Approaches to the study of neural coding of sound source location and sound envelope in real environments
- Department of Neuroscience, University of Connecticut Health Center, Farmington, CT, USA
The major functions of the auditory system are recognition (what is the sound) and localization (where is the sound). Although each of these has received considerable attention, rarely are they studied in combination. Furthermore, the stimuli used in the bulk of studies did not represent sound location in real environments and ignored the effects of reverberation. Another ignored dimension is the distance of a sound source. Finally, there is a scarcity of studies conducted in unanesthetized animals. We illustrate a set of efficient methods that overcome these shortcomings. We use the virtual auditory space method (VAS) to efficiently present sounds at different azimuths, different distances and in different environments. Additionally, this method allows for efficient switching between binaural and monaural stimulation and alteration of acoustic cues singly or in combination to elucidate neural mechanisms underlying localization and recognition. Such procedures cannot be performed with real sound field stimulation. Our research is designed to address the following questions: Are IC neurons specialized to process what and where auditory information? How does reverberation and distance of the sound source affect this processing? How do IC neurons represent sound source distance? Are neural mechanisms underlying envelope processing binaural or monaural?
Introduction
The goal here is to describe our approach to the study of neural mechanisms that underlie spatial and envelope coding of sounds in the mammalian auditory system. The ability to recognize and to localize a sound are the major functions of the auditory system. A key feature for recognition is the amplitude modulation (AM) envelopes present in natural sounds (Plomp, 1983). Key features for localization are interaural time (ITD) and level (ILD) differences and spectral cues that depend on sound source locations (Rayleigh, 1907; Blauert, 1997).
It is well established that sounds are transformed by the head and body (aka, head-related transfer function, HRTF) as well as by the acoustic environment (aka, binaural room transfer function, BRTF) in which they occur. Thus, it is surprising that the bulk of neural studies of envelope processing and localization used sounds that were delivered through headphones that lacked the important acoustic features created by HRTFs and BRTFs.
Despite decades of research devoted to the study of binaural cues in sound localization (see reviews by Palmer and Kuwada, 2005; Yin and Kuwada, 2010), there are relatively few studies that have investigated localization sensitivity in sound fields, either directly or through virtual auditory space (VAS) techniques. Even these studies have several shortcomings. First, the bulk of the studies were conducted under anesthesia which is known to alter binaural processing in the inferior colliculus (IC) (Kuwada et al., 1989; Tollin et al., 2004; D'Angelo et al., 2005). The findings using barbiturate anesthesia are consistent with the well known fact that barbiturates potentiate GABA-mediated inhibition (Barker and Ransom, 1978). Second, the bulk of the studies (exception: Sterbing et al., 2003; Behrend et al., 2004; Slee and Young, 2011) tested sound localization only in the frontal field resulting in an incomplete and perhaps inaccurate description of a neuron's spatial receptive field. Third, these studies did not systematically test the effects of stimulus level. Although it is generally recognized that azimuth tuning broadens with increasing stimulus level, the magnitude of broadening and the level tolerance of different neurons is poorly understood. Fourth, the bulk of the studies did not examine azimuth tuning to binaural and monaural stimulation (exception: Delgutte et al., 1999; Poirier et al., 2003). The extent to which azimuth tuning to binaural stimulation is disrupted under monaural stimulation indicates the importance of binaural cues. Fifth, the effect of sound source distance on neural responses is essentially ignored despite strong behavioral evidence linking reverberation to distance localization accuracy (Zahorik, 2002). Finally, the bulk of the studies (exception: Devore et al., 2009; Devore and Delgutte, 2010) have investigated spatial tuning in anechoic environments whereas real sound fields contain reverberations to different degrees. The above deficiencies collectively constitute a major void in our understanding of neural coding of sound source location in the auditory system.
Analogously, the bulk of neural studies of envelope processing used sounds delivered through headphones that lacked sound source location in an acoustic environments (see review by Joris et al., 2004). Lesica and Grothe (2008) studied temporal processing of natural sounds in IC neurons, with and without ambient noise, but not the effects of reverberation per se. Sayles and Winter (2008) studied pitch processing in cochlear nucleus neurons in reverberation with a primary focus on monaural mechanisms in pitch processing. Despite decades of studies of neurons sensitive to AM envelopes using headphones little is known about the effects of sound source azimuth, distance and reverberation on envelope processing, an essential component of communication sounds.
Here, we outline our approach to alleviating these deficiencies. Our findings are from neurons in the IC of the unanesthetized rabbit. We used VAS stimuli because it is an efficient way to control the sound source location, and also used sinusoidally amplitude modulated (SAM) noise in order to simultaneously investigate neural sensitivities to location (where is the sound?) and envelope (what is the sound?). The VAS method has proven to be a valid method to study spatial tuning in humans (Wightman and Kistler, 1989; Kulkarni and Colburn, 1998) and in neurons (Keller et al., 1998; Behrend et al., 2004; Campbell et al., 2006). We summarize key findings of our recent published study (Kuwada et al., 2011) that focused on azimuth tuning in an anechoic environment. We also describe responses of an example neuron that outlines our approach to simultaneously examine azimuth tuning and envelope sensitivity at different distances and in different reverberant environments. Our research is designed to address the following questions: Are IC neurons specialized to process what and where auditory information? How does reverberation and distance of the sound source affect this processing? How do IC neurons represent sound source distance? Are neural mechanisms underlying envelope processing binaural or monaural?
Materials and Methods
This study was approved by the University of Connecticut Health Center Animal Care Committee and was conducted according to the NIH guidelines. Neural recordings were performed in two female Dutch-Belted rabbits (1.5–2.5 kg). Surgical and experimental procedures have been described previously (e.g., Kuwada et al., 1987; Batra et al., 1989).
Surgical Procedures
All surgery was performed using aseptic techniques on rabbits with clean external ears. Under anesthesia (sedation: 1 mg/kg, acepromazine, sc: anesthesia: 1.5–4% isoflurane inhalation, 1–2 liters/min oxygen) a brass plate with three threaded inserts (6–32) was anchored to the skull using screws and dental acrylic. At this time, custom ear molds were made for sound delivery using dental impression compound (Reprosil). After acoustic measurements were made (see below), the animal was again anesthetized, and a small craniotomy (~3 × 4 mm) was made over cortex overlying the IC. The craniotomy was bathed in chlorohexidine (0.2%), a cotton pellet placed over it and then covered with dental impression compound.
Recording Procedures and Data Collection
All recordings were conducted in a double-walled, sound-insulated chamber. The rabbit's body was wrapped with a surgical towel held in place with wide elastic bandages (ACE). It was then seated in a padded cradle, and further restrained using nylon straps. The wrap and straps provided only mild restraint, their primary purpose being to discourage movements that might cause injury to the rabbit. The rabbit's head was fixed by mating the head appliance to a horizontal bar with 6–32 threaded socket head screws. Once the rabbit was secured, the craniotomy was exposed. To eliminate possible pain or discomfort during the penetration of the electrode, a topical anesthetic (marcaine) was applied to the dura for approximately 5 min and then removed by aspiration. With these procedures, rabbits remained still for a period of 2 or more h, an important requirement for neural recording. Each rabbit participated in daily recording sessions over a period of several months. A session was terminated if the rabbit showed any signs of discomfort. The rabbit's comfort was a priority both for ethical reasons and because movements made it difficult to record from neurons.
Action potentials were recorded extracellularly with tungsten-in-glass microelectrodes (tip diameter of ~1 μm, impedances of 5–10 MΩ). The recordings were amplified at a gain of 2–20 k and filtered (0.3–3 kHz) and the action potentials were triggered using a window discriminator (BAK Electronics, Germantown, MD) and timed relative to the stimulus onset with an accuracy of 10 μs. The recordings were from single-units or clusters comprising 2–3 units based on the height of their action potentials evaluated visually. The waveforms of the neural signals and the stimuli were recorded continuously (Adobe Audition) which allowed for subsequent re-examination.
Measurements of HRTFs/BRTFs
Each rabbits' HRTFs were measured in our anechoic chamber (9 × 4 × 4 m, anechoic between 0.11 and 200 kHz). The BRTFs were measured in our moderately reverberant room (6 × 5 × 3 m, T60 = 825 ms) and our highly reverberant room (6.5 × 5.7 × 5 m, T60 = 2,500 ms). These transfer functions were measured with an acoustic point source positioned at nine distances (10–160 cm in half doubling steps) and 25 azimuths (±165° in 15° steps) all at 0° elevation. These measurements were made with a blocked meatus approach with a miniature microphone (Knowles FG 23629) placed deep in each ear canal. This is done in the unanesthetized state and is highly advantageous because several sessions are required to complete these acoustic measurements and multiple sessions using anesthesia would increases the probability of death. The procedures for measuring HRTFs are described in (Kim et al., 2010).
Generation of Virtual Auditory Space (VAS) Stimuli
In various experiments we have used broad-band noise, 1-octave wide noise-based on the neuron's best frequency (BF), and 1-octave wide SAM noise. In all cases the source signals are filtered with the individual rabbit's HRTFs and BRTFs for each ear and each sound source location and acoustic environment. Comparisons of the SAM envelope at the source and in the ear canals in the different acoustic environments allow us to determine the acoustic transformations that the SAM envelope undergoes between the source and the ear canals for various source locations. This yields an acoustic modulation transfer function (MTF) of the system comprising the rabbit and sound source in a specific environment. In general, modulation gain in reverberation decreased with increasing modulation frequency and with increasing distance. Furthermore, the ear opposite to the sound source was most affected.
These VAS stimuli are delivered to each ear through a Beyer DT-770 earphone coupled to a sound tube embedded in custom-fitted ear mold to form a closed system. The distal end of the sound tube is at the same location as the microphone used in the HRTF/BRTF measurements. The frequency responses of the sound delivery systems for the two ears is measured using a microphone (B&K type 4133) connected to a probe tube that extended to the tip of the sound delivery tube. Compensation of the system's frequency response was incorporated into sound stimuli.
In addition to the VAS stimuli, we stimulated both ears, as well as the ipsilateral and contralateral ear separately with sequential pure tones (100 ms every 300 ms repeated 4 times (4 ms rise/fall) between 0.2 and 32 kHz in 1/3rd octave steps at a constant level (30–70 dB SPL, re: 20 μPa) to measure each unit's BF). The tone frequencies were randomly presented.
Results
Azimuth Tuning in an Anechoic Environment
Figure 1 shows our general approach to measure azimuth tuning of IC neurons. We first determined the unit's BF by delivering tone bursts as described above at 50 dB SPL. To determine the unit's threshold for VAS stimulation we set the azimuth to −75° and varied the stimulus level of a broad-band noise over a 70 dB range in 10 dB steps. We then delivered VAS stimuli at levels between 10 and 50 dB above its threshold for azimuths ranging between ±150° in 15° steps. These were delivered in random order and the response to the initial azimuth was discarded to minimize adaptation effects. Figure 1A displays this unit's response as dot rasters to binaural (red), ipsilateral (green) and contralateral stimulation, each 100 ms in duration and separated by 300 ms. This sequence was repeated 4 times at each azimuth. It is clear that this neuron is excited by binaural and contralateral ear stimulation and inhibited by ipsilateral ear stimulation. The strongest driven activity to binaural stimulation was in the contralateral sound field (i.e., 0–150°), whereas that to contralateral ear stimulation was omnidirectional. These features are also plotted in Figure 1B where the neural firing rates are plotted in Cartesian coordinates. These plots reflect the response during the stimulus burst. The spontaneous activity indicated was the mean of the last 100 ms of the silent period after binaural, ipsilateral and contralateral ear stimulation. In Figure 1C, the binaural and contralateral ear alone azimuth functions are displayed in polar coordinates after subtraction of the mean spontaneous activity. If this subtraction yielded negative values, we made the azimuth function positive by adding a constant (absolute value of the minimum). Although recordings were not made at 180° we interpolated and smoothed the function over the full range. Also shown are the actual responses at each azimuth for binaural (red open circle) and contralateral ear stimulation (blue open circles) after subtraction of the spontaneous rate. This neuron displays binaural facilitation (binaural response > contralateral ear response) in the contralateral sound field and binaural suppression (binaural response < contralateral ear response) in the ipsilateral sound field. The interpolation to ±180° allowed the calculation of vector strength (VS) and vector angle (VA) as a measure of the neuron's sharpness of azimuth tuning and its preferred azimuth direction (magenta line), respectively. VS and angle measures were computed using the original definition of Goldberg and Brown (1969). Best azimuth (BA, azimuth at the maximum response) is included as a comparison with VA.
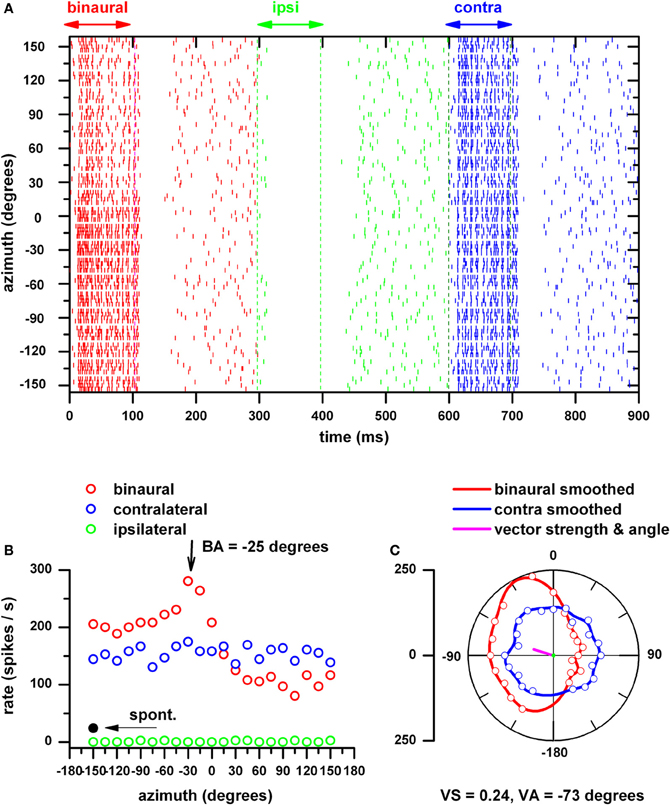
Figure 1. Procedure for assessing a neuron's azimuth tuning. (A) IC neurons response (BF = 3.2 kHz) to wide-band noise (0.2–20 kHz) presented to both ears (red), to the ipsilateral ear (green) and to the contralateral ear, each 100 ms in duration and separated by 300 ms as dot rasters at azimuths between ±150° in 15° steps at a maximum of 45 dB SPL. This sequence was repeated 4 times at each azimuth and azimuths were presented in a random order. Negative azimuths correspond to sounds in the contralateral hemifield (re: recording site). (B) Firing rates as a function of azimuth are plotted in Cartesian coordinates for binaural, ipsilateral and contralateral stimulation. These plots reflect the response during the stimulus burst and the mean spontaneous firing rate (measured during the last 100 ms of each silent period) is indicated. (C) The azimuth functions in (B) after subtraction of the mean spontaneous firing rate and after interpolation and smoothing over a ±180° range are displayed in polar coordinates. Also shown are the actual responses at each azimuth for binaural (red open circle) and contralateral ear stimulation (blue open circles) after subtraction of the spontaneous rate. Vector strength (VS) and vector angle (VA) (magenta line) were calculated from the azimuth function to binaural stimulation and used as a measure of the neuron's sharpness of azimuth tuning (VS) and its preferred azimuth direction (VA). Best azimuth (BA, azimuth at the maximum response) is included as a comparison with VA.
Figure 2 displays the distributions of VS (red), VA (blue), and BA (black) to binaural stimulation as a function of stimulus level (upper five rows). In the bottom row is a summary of these distributions in the form of the median ± semi-interquartile range. The sharpness of azimuth tuning broadened with increasing stimulus level as evidenced by VS decreasing from 0.44 to 0.22. The direction of azimuth tuning as measured by VA shifted from −68° at 10 dB to −93° at 50 dB and its distribution became tighter with increasing stimulus level. BA shifted from −62° to −82°, but its distribution became broader with stimulus level.
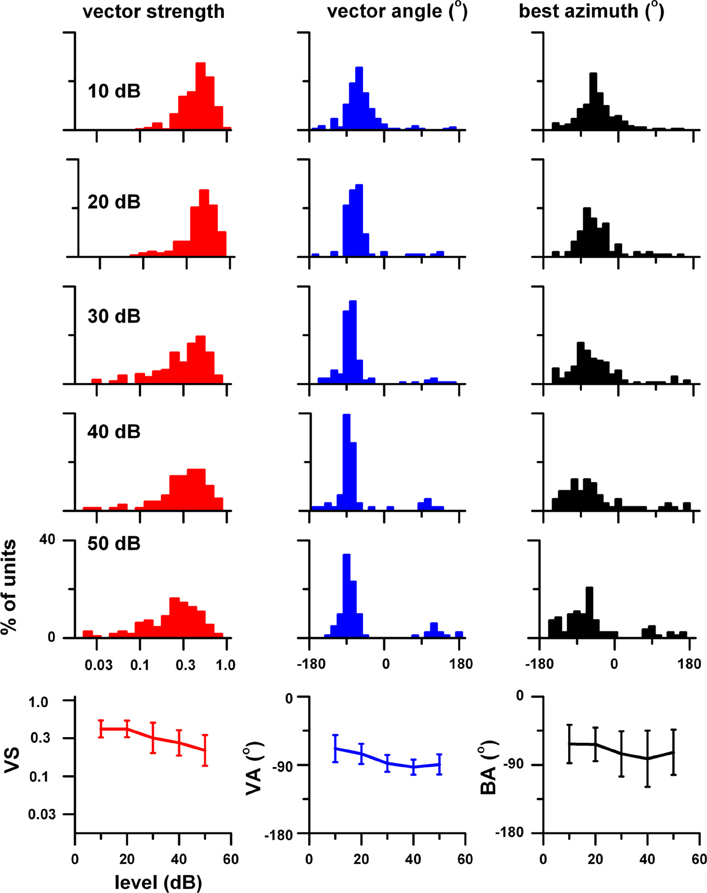
Figure 2. Top 5 rows: Distributions of vector strength (VS, red), vector angle (VA, blue), and best azimuth (BA, black) at stimulus levels between 10 and 50 dB (re: neural threshold). Bottom row: Plot of the median and semi-interquartile range of these three measures of azimuth tuning as a function of stimulus level. The sample size was: 10 dB, 178 units; 20 dB, 102 units; 30 dB, 155 units; 40 dB, 74 units; 50 dB, 115 units. Adapted from Kuwada et al. (2011).
The degree of level tolerance in azimuth tuning varies among neurons. We investigated the hypothesis that certain neurons exhibit level tolerant azimuth tuning, i.e., no significant changes in VS and VA across stimulus levels. To test this hypothesis we first selected units that were tested at 10, 30, and 50 dB and rank ordered this sample based on VS at 50 dB. We then subdivided it into three sub populations, top 10%, top 50%, and all for stimulus levels at 10, 30, and 50 dB and averaged their rate azimuth functions (Figure 3, top 3 rows). For each population, VS and VA are plotted in the fourth and fifth rows, respectively. For binaural stimulation, VS and angle remain relatively stable across stimulus level in all three subpopulations. There were no statistically significant differences in vector strength across stimulus level (1 way repeated measures ANOVA, F = 4.74, df = 122, p > 0.01) for the top 37% of the units, indicating level tolerant behavior for this subpopulation. There were no statistically significant differences in vector angle across stimulus level (F = 4.93, df = 50, p > 0.01) for only the top 15% of the units. Thus, if we require no significant change in both vector strength and vector angle across stimulus levels, then the top 15% satisfied this combined criterion. For all three subpopulations, the mean VA was in the frontal contralateral quarter field (~−60°) at 10 dB and shifted backwards to ~−90° at 30 and 50 dB. This shift reflects the fact that the responses in the back and front quarter fields become more symmetrical at higher stimulus levels.
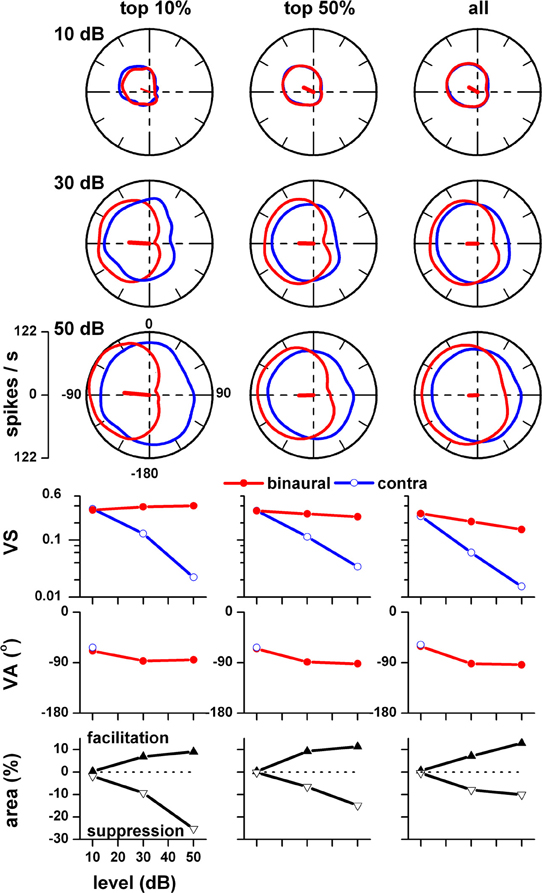
Figure 3. Population azimuth tuning to binaural (red) and contralateral ear alone (blue) stimulation as a function of stimulus level. Only those units that were tested to both binaural and contralateral ear stimulation at 10, 30, and 50 dB (n = 75) were included. This sample was rank ordered based on vector strength to binaural stimulation at 50 dB and subdivided into three sub populations, top 10%, top 50%, and all. Top three rows: 10, 30, and 50 dB (re: threshold). Fourth row: vector strength versus stimulus level. Fifth row: vector angle versus stimulus level. Vector angles were plotted only when the corresponding vector strength was ≥0.15. Fifth row: binaural facilitation (solid triangles) and binaural suppression (open triangles) versus stimulus level. Adapted from Kuwada et al. (2011).
In contrast, contralateral ear stimulation yielded VSs and angles comparable to binaural stimulation only at 10 dB and precipitously decreased with increasing stimulus level. VA at 30 and 50 dB are not plotted because the VS did not reach our minimal criterion (≥0.15). When the response was greater to binaural stimulation than to contralateral ear stimulation, we defined the difference summated over a region of azimuth to be the binaural facilitation area; when the relationship was reversed, we defined the difference to be the binaural suppression area. These measures are same as those used by Delgutte et al. (1999). The facilitation and suppression areas for our three subpopulations are plotted as a function of stimulus level in the bottom row (Figure 3). The strengths of binaural suppression and facilitation increased with increasing stimulus level. The combined consequence of this facilitation and suppression is to confine the azimuth tuning to the contralateral field over a wide range of stimulus levels.
Coding of Azimuth and Envelope in Reverberant Environments
These experiments simultaneously examine coding of location and envelope in different acoustic environments by presenting SAM noise at different azimuths and distances. The carrier sound was a 1-octave wide noise centered at the unit's BF. Using this noise band we determine the unit's threshold by presenting sounds from 0 to 70 dB SPL binaurally and separately to the ipsilateral and contralateral ear at −75° azimuth (a value that approximates the BA of most units). We then determine the unit's azimuth functions to binaural, ipsilateral, and contralateral ear stimulation at 30 dB above threshold at a distance of 80 cm in the anechoic environment. Next, we determined its MTF to modulation frequencies between 2 and 512 Hz in 1-octave steps (100% depth) at the unit's BA, at a distance of 80 cm, and a level 30 dB above its threshold. Based on its MTF, the modulation depth of its best modulation frequency was varied between 12.5 and 100% in 3 dB steps. We then selected a modulation depth that was approximately in the center of its range that produced significant (p < 0.001) neural synchrony based on circular statistics (Mardia, 1972).
Figure 4 displays the response of an IC neuron that had a BF of 628 Hz to the above type SAM noise (444–888 Hz, 32 Hz modulation, 70.7% depth, 50 dB SPL). The top dot raster displays the unit's response to the above stimuli presented binaurally (red) and to the contralateral ear alone (blue) in the anechoic environment at our closest sound source distance (10 cm). The corresponding polar plots of azimuth represent four measures derived from the responses depicted in the dot raster. The rate azimuth function shows that the binaural response is strongest in the contralateral sound field whereas those to the contralateral ear are omnidirectional. The combination of binaural facilitation in the contralateral sound field and the binaural suppression in the ipsilateral sound field described in Figures 1, 3 is also present here. The remaining 3 polar plots represent the neuron's response to the envelope. Because recordings were not made at 180° and because these measures require significant synchrony to the envelope, these polar plots have a gap at this azimuth. The syncrate measure is defined as a product of synchrony to the modulation envelope and firing rate. The significance of syncrate depends entirely on whether synchrony is significant or not (p < 0.001). The synchrony azimuth function was similar between binaural and contralateral stimulation. Consequently, the syncrate azimuth function resembled the rate azimuth function. The rightmost polar plot represents the neural modulation gain. It is defined as 20 × log (2 × neural synchrony/modulation depth in the ear) and was approximately 5 dB for binaural and monaural stimulation.
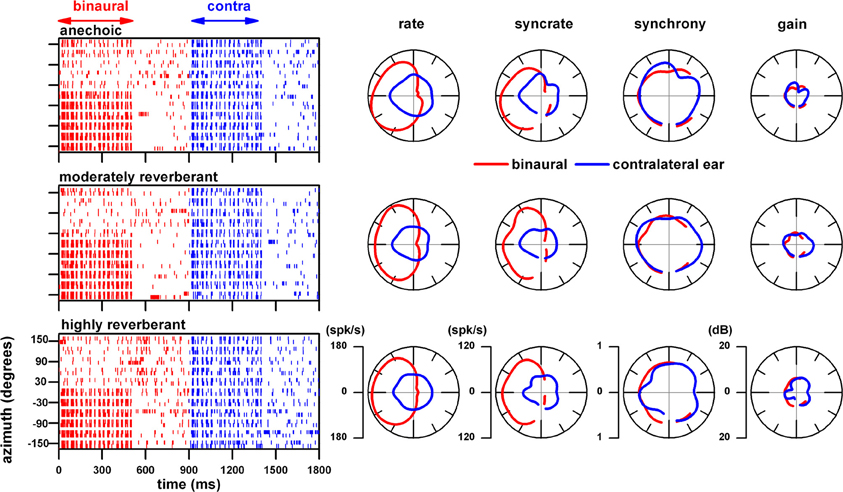
Figure 4. Response of an IC neuron (BF = 628 Hz) to a SAM 1-octave band noise delivered binaurally and to the contralateral ear alone as a function of azimuth at a fixed distance of 10 cm. Top row: responses to different azimuths in the anechoic condition displayed as spike time rasters. The corresponding polar plots represent four measures derived from the responses depicted in the raster plot: rate, syncrate (synchrony × rate), synchrony, and neural modulation gain (20 × log (2 × neural synchrony/modulation depth in the ear). Middle row: responses of the same neuron to sounds in the moderately reverberant chamber. Bottom row: responses of the same neuron to sounds in the highly reverberant chamber. Responses to binaural stimulation are depicted as red and those to contralateral ear stimulation as blue. Stimulus parameters: 500 ms duration every 900 ms, 444–888 Hz band width, 32 Hz modulation frequency, 70.7% modulation depth, 30 dB above neural threshold (50 dB SPL).
The middle and bottom row of Figure 4 represents the responses of the same neuron to the same stimuli but presented in our moderately reverberant and highly reverberant environments, respectively. At this close distance (10 cm), the responses in these two reverberant environments are remarkably similar to each other and to those in the anechoic condition.
In Figure 5 we display the responses of the same neuron to the same stimuli but at a further sound source distance (80 cm). In contrast to the responses at 10 cm (Figure 4), at 80 cm, the acoustic environment had noticeable effects on spike rate, syncrate, synchrony and gain azimuth functions.

Figure 5. Response of the same neuron in Figure 4 to the same stimuli but at a distance of 80 cm. Same format as Figure 4.
The responses in the anechoic environment at 80 cm (Figure 5, top row) are very similar to those at 10 cm (Figure 4, top row). However, the responses in the two reverberant environments at 80 cm (Figure 5, middle and bottom rows) differed considerably from those in the anechoic condition (Figure 5, top row) and from those at 10 cm (Figure 4, middle and bottom rows). In reverberation, the firing rate to binaural stimulation in the contralateral sound field decreased relative to the anechoic condition. Additionally, the binaural facilitation and suppression in the rate azimuth function in the moderately reverberant environment was less pronounced and binaural suppression in the highly reverberant environment was absent. The firing rate to contralateral ear stimulation remained omnidirectional in all three environments. The synchrony to the modulation envelope to both binaural and monaural stimulation declined and was the weakest in the highly reverberant environment. Surprisingly, in the moderately reverberant environment, the mean neural modulation gain in the contralateral sound field to both binaural and contralateral ear stimulation reached 10 dB and further increased to 13 dB in the highly reverberant environment. These gains represent enhancements of 5 and 8 dB over the anechoic condition.
The strong firing rate of this neuron to binaural stimulation in the anechoic environment was confined to the contralateral sound field (Figures 5, 6, top rows). In order to elucidate mechanisms underlying this azimuth tuning we altered the ITD cue in the fine structure by decorrelating the sounds between the two ears. In Figure 6, using the same neuron as in Figures 4, 5, we show the effect of delivering decorrelated sounds to the ears. The upper row shows the dot rasters and polar plots when the same normal sound was delivered to the ears in our anechoic chamber at a distance of 160 cm. Note that as in the 10 and 80 cm distances (Figures 4, 5, top rows), the azimuth rate response is primarily confined to the contralateral sound field whereas that to monaural stimulation is omnidirectional. In all cases, binaural facilitation in the contralateral sound field and binaural suppression in the ipsilateral sound field is prominent. However, when the sound to the ears is uncorrelated (Figure 6, bottom row), azimuth tuning to binaural stimulation becomes omnidirectional and very similar to monaural stimulation. The fact that azimuth tuning to binaural stimulation was destroyed is strong evidence that ITD plays the key role in azimuth tuning for this neuron. ILD play a negligible role because this cue is <1 dB at 160 cm in frequency range used (1-octave centered at 628 Hz). Synchrony to binaural and monaural stimulation remained relatively unchanged under the decorrelated condition. This indicates that the envelope coding mechanism for this neuron is monaural.
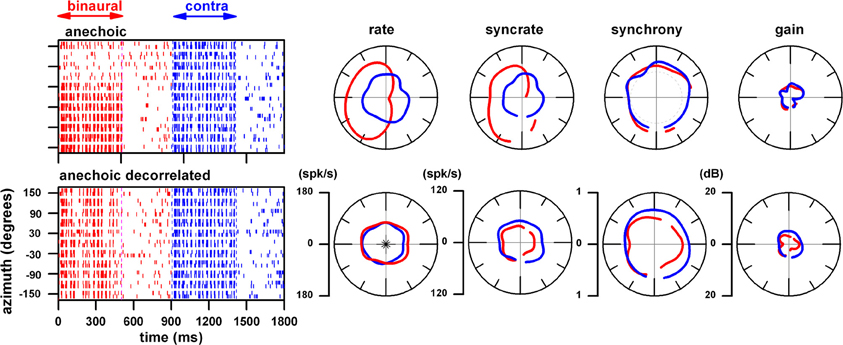
Figure 6. Effect of presenting noise to each ear that is uncorrelated. Same neuron as in Figures 5, 6. Top row: responses when the normal, correlated sound was delivered to the ears in our anechoic chamber at a distance of 160 cm. Bottom row: responses when the sound to the ears is uncorrelated.
We recorded the responses of this neuron not only at 10 cm (Figure 4), 80 cm (Figure 5) and 160 cm (Figure 6), but also at sound source distances of 20 and 40 cm. Figure 7 provides a summary of our findings at sound source distances between 10 and 160 cm. Plots E–L reflect the responses averaged in the contralateral sound field. The stimulus level was adjusted at each distance such that the absolute level was kept constant.
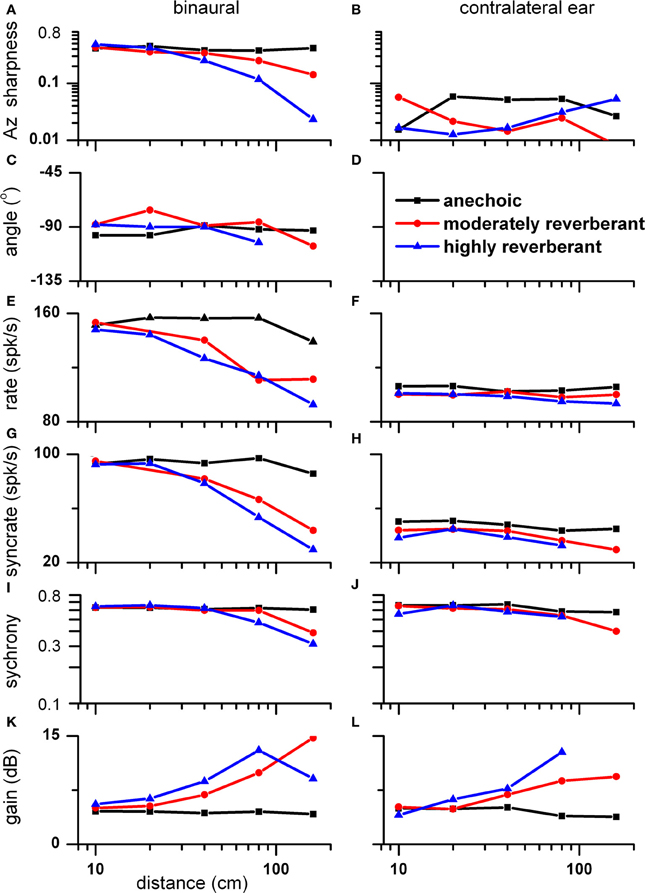
Figure 7. Azimuth tuning and envelope sensitivity as a function of distance (10-160 cm) for the same neuron in Figures 4, 6, 7. Plots E–L reflect the responses averaged in the contralateral sound field. (A,B) Sharpness of azimuth tuning as measured by vector strength of rate azimuth function versus distance and environment to binaural (A) and contralateral ear stimulation (B). (C,D) Direction of azimuth tuning as measured by vector angle of rate azimuth function. (E,F) Firing rate. (G,H) Syncrate, i.e., product of synchrony and rate. (I,J) Synchrony to the modulation envelope. (K,L) Neural modulation gain.
The sharpness of azimuth tuning as reflected by azimuth VS is plotted as a function of distance for binaural (panel A) and contralateral ear (panel B) stimulation. The VS to binaural stimulation remained constant across distance in the anechoic environment whereas it systematically decreased with distance in reverberation and most dramatically in the highly reverberant environment. This decrease in azimuth tuning with distance to binaural stimulation in the reverberant environments is likely due to a decrease in interaural correlation of the stimulus with distance. From 10 to 160 cm, the mean interaural correlation measured in the contralateral sound field systematically decreased from 0.98 to 0.74 in the highly reverberant environment, whereas it remained constant (0.997 ± 0.002) in the anechoic condition. Recall that decorrelation destroyed azimuth tuning (Figure 6). Thus, the decrease in correlation with distance in reverberation parallels the observed decrease in azimuth VS, and the constant and high interaural correlation seen in the anechoic condition parallels the observed constant and strong azimuth VS.
Although azimuth VS to binaural stimulation decreased with distance in reverberation, azimuth VA remained relatively constant with distance (panel C). For contralateral stimulation (panel B), the azimuth VS across conditions was too small to meet our criterion for azimuth tuning (VS = 0.15). Consequently, none are plotted for azimuth VA to contralateral stimulation (panel D).
The mean rates to binaural and contralateral ear stimulation in the contralateral sound field are plotted in panels E and F, respectively. The rate to binaural stimulation remained relatively constant with distance in the anechoic environment (black) but gradually declined in the two reverberant environments to a maximum decline of 30% at 160 cm in the highly reverberant condition (blue). The decrease in rate to binaural stimulation in the contralateral sound field with distance in the reverberant environments is likely due to a decrease in interaural correlation as outlined above. Specifically, this decline in firing rate is consistent with decreasing interaural correlation with distance. The response rate to contralateral ear stimulation was about half that to binaural stimulation and there was no clear relationship with distance in the two reverberant environments. However, the firing rates averaged across distance in the moderate and highly reverberant environments were 9 and 14% less, respectively, compared to that in the anechoic environment.
The syncrate functions across distance to binaural and contralateral ear stimulation are shown in panels G and H, respectively. At 160 cm in the highly reverberant environment, syncrate was not significant to contralateral ear stimulation. Thus, this point is absent in panel H. The syncrate functions show a steeper decline with distance than the rate functions because both rate and synchrony decrease with distance.
Synchrony to binaural and contralateral ear stimulation remained essentially constant in the anechoic condition. In reverberation, synchrony remained essentially constant for distances up to 40 cm and then declined (panels I and J). At 160 cm in the highly reverberant environment, synchrony was not significant to contralateral ear stimulation. Thus, this point is absent in panel J.
The neural modulation gain as a function of distance is plotted in panels K and L for binaural and contralateral ear stimulation, respectively. The mean gain across distance in the anechoic condition for both types of stimulation was 5 dB. However, at far distances it increased with reverberation to a maximum of 15 dB to binaural stimulation and 13 dB to contralateral ear stimulation.
Discussion
We have provided a synopsis of our previous findings on azimuth coding in anechoic conditions (Kuwada et al., 2011). We have also provided an example neuron illustrating our current approach that investigates coding of sound source distance, azimuth and AM envelope in anechoic and reverberant environments. In the Introduction we described the motivation for our research strategy and four questions that our strategy is designed to answer. We will discuss in turn these questions and the answers provided by our example neuron.
Are IC Neurons Specialized to Process What and Where Auditory Information?
The example neuron was able to code both azimuth and envelope (e.g., Figures 4–7), i.e., not specialized for envelope or azimuth coding. Other neurons show varying degrees of specialization for envelope or azimuth coding.
It has been firmly established that different specialized auditory cortical areas mediate recognition (anterior auditory field, AAF) and localization (posterior auditory field, PAF) of sounds (Lomber and Malhotra, 2008). Their finding that the PAF mediates localization is consistent with the finding that neural population coding of space in the PAF is more accurate than that in the primary auditory field (AI) (Stecker et al., 2003). It remains to be determined whether neurons in the PAF are poor in coding envelope and whether neurons in the AAF are specialized for pattern recognition and poor in coding location as predicted by Lomber and Malhotra (2008).
The specialized processing in the cortex may be created de novo. This would be the logical case if IC neurons are not specialized for what and where processing. On the other hand, the specialized processing in the cortex may reflect inputs from specialized neuron in the IC that project selectively via the thalamus to the appropriate cortical areas.
How does Reverberation and Distance of the Sound Source Affect Neural Processing of Envelope and Azimuth?
In response to binaural stimulation the synchrony to envelope in our example neuron showed immunity to reverberation for distances between 10 and 40 cm and a modest reduction in reverberation at 80 and 160 cm. Similarly, the sharpness of azimuth tuning showed immunity to reverberation for distances between 10 and 40 cm. However, at 160 cm in the highly reverberant environment the azimuth tuning was markedly degraded. This degradation is likely due to a reduction in interaural correlation caused by reverberation at far distances. This interpretation was supported by the same neuron's response to decorrelated stimuli (Figure 6). These observations are consistent with the finding that the ITD sensitivity of IC neurons systematically decreased with decreasing interaural correlation (Yin et al., 1987). In a classic model of sound localization (Jeffress, 1948), ITD sensitive neurons act like coincidence detectors. Thus, when the signals at the two ears are in-phase there is binaural facilitation and when they are out-of-phase there is binaural suppression (Goldberg and Brown, 1969). VS of azimuth tuning is a reflection of the strength of binaural facilitation and suppression. The decrease in interaural correlation with increasing distance in reverberation is a consequence of a decrease in the direct to reverberant energy ratio (D/R) with increasing distance (Zahorik, 2002).
How do IC Neurons Represent Sound Source Distance?
The firing rate of the example neuron to binaural stimulation in reverberation systematically decreased with increasing distance thus providing a rate code for distance. In contrast, in the anechoic condition, its rate was nearly constant. This decrease was not due to changes in stimulus level because it was kept constant across distance. Interestingly, the same mechanism proposed for changes in azimuth tuning, coincidence detection governed by strength of interaural correlation, produces a sensitivity to sound source distance. The fact that this neuron's firing rate to monaural stimulation remained nearly constant across distance is consistent with our view that a binaural mechanism (i.e., coincidence detection) underlies its ability to code sound source distance. Providing a distance code is a new role played by the coincidence detection mechanism that has not been described. The neural coding of sound source distance is vastly understudied and our strategy is designed to fill this void.
Are Neural Mechanisms Underlying Envelope Processing Binaural or Monaural?
Our example neuron displayed similar envelope synchrony to binaural and monaural stimulation. Relatedly, neural modulation gain of this neuron was high in reverberation at far distances and was essentially the same to binaural or monaural stimulation. These properties imply that monaural mechanisms underlie this neuron's envelope synchrony and modulation gain. This was validated by the finding that synchrony remained unchanged when the signals at the two ears were decorrelated (Figure 6).
Measurements in the auditory nerve (Kim et al., 1990; Joris and Yin, 1992) using conventional earphone stimuli indicate gains between −10 and 10 dB. In the olivocochlear efferent auditory nerve fibers, modulation gains were higher (up to 12 dB) than in afferent nerve fibers (Gummer et al., 1988). In the cochlear nucleus higher gains (often reaching 10–13 dB) were found (Frisina et al., 1990; Kim et al., 1990). In the IC even higher gains (reaching 15–20 dB) were found (Rees and Moller, 1983; Rees and Palmer, 1989; Krishna and Semple, 2000).
The larger gains in the reverberant compared to the anechoic condition in this example neuron may represent a compensatory monaural mechanism that counteracts the deleterious effects of reverberation. In a related behavioral study, it was shown that human AM sensitivity in reverberation was more sensitive than predicted by the acoustical MTFs (Zahorik et al., 2011). At an azimuth of −90° this enhancement effect was present whether the stimulation was monaural or binaural. However, a binaural advantage was seen at 0°, consistent with previous results (Danilenko, 1969).
Conflict of Interest Statement
The authors declare that the research was conducted in the absence of any commercial or financial relationships that could be construed as a potential conflict of interest.
Acknowledgments
We thank Xi Bie, Jason Sijie Wang, Caitlin Alex, and Daniel Condit for their assistance. This study was supported by NIH grant R01 DC002178.
References
Barker, J. L., and Ransom, B. R. (1978). Pentobarbitone pharmacology of mammalian central neurones grown in tissue culture. J. Physiol. 280, 355–372.
Batra, R., Kuwada, S., and Stanford, T. R. (1989). Temporal coding of envelopes and their interaural delays in the inferior colliculus of the unanesthetized rabbit. J. Neurophysiol. 61, 257–268.
Behrend, O., Dickson, B., Clarke, E., Jin, C., and Carlile, S. (2004). Neural responses to free field and virtual acoustic stimulation in the inferior colliculus of the guinea pig. J. Neurophysiol. 92, 3014–3029.
Blauert, J. (1997). Spatial Hearing: the Psychophysics of Human Sound Localization, Revised Edn. Cambridge, MA: MIT Press.
Campbell, R. A., Doubell, T. P., Nodal, F. R., Schnupp, J. W., and King, A. J. (2006). Interaural timing cues do not contribute to the map of space in the ferret superior colliculus: a virtual acoustic space study. J. Neurophysiol. 95, 242–254.
D'Angelo, W. R., Sterbing, S. J., Ostapoff, E. M., and Kuwada, S. (2005). Role of GABAergic inhibition in the coding of interaural time differences of low-frequency sounds in the inferior colliculus. J. Neurophysiol. 93, 3390–3400.
Danilenko, L. (1969). [Binaural hearing in non-stationary diffuse sound field]. Kybernetik 6, 50–57.
Delgutte, B., Joris, P. X., Litovsky, R. Y., and Yin, T. C. (1999). Receptive fields and binaural interactions for virtual-space stimuli in the cat inferior colliculus. J. Neurophysiol. 81, 2833–2851.
Devore, S., and Delgutte, B. (2010). Effects of reverberation on the directional sensitivity of auditory neurons across the tonotopic axis: influences of interaural time and level differences. J. Neurosci. 30, 7826–7837.
Devore, S., Ihlefeld, A., Hancock, K., Shinn-Cunningham, B., and Delgutte, B. (2009). Accurate sound localization in reverberant environments is mediated by robust encoding of spatial cues in the auditory midbrain. Neuron 62, 123–134.
Frisina, R. D., Smith, R. L., and Chamberlin, S. C. (1990). Encoding of amplitude modulation in the gerbil cochlear nucleus: I. A hierarchy of enhancement. Hear. Res. 44, 99–122.
Goldberg, J. M., and Brown, P. B. (1969). Response properties of binaural neurons of dog superior olivary complex to dichotic tonal stimuli: some physiological mechanisms of sound localization. J. Neurophysiol. 32, 613–636.
Gummer, M., Yates, G. K., and Johnstone, B. M. (1988). Modulation transfer function of efferent neurons in the guinea pig cochlea. Hear. Res. 36, 41–52.
Jeffress, L. A. (1948). A place code theory of sound localization. J. Comp. Physiol. Psychol. 41, 35–39.
Joris, P. X., Schreiner, C. E., and Rees, A. (2004). Neural processing of amplitude-modulated sounds. Physiol. Rev. 84, 541–577.
Joris, P. X., and Yin, T. C. (1992). Responses to amplitude-modulated tones in the auditory nerve of the cat. J. Acoust. Soc. Am. 91, 215–232.
Keller, C. H., Hartung, K., and Takahashi, T. T. (1998). Head-related transfer functions of the barn owl: measurement and neural responses. Hear. Res. 118, 13–34.
Kim, D. O., Bishop, B., and Kuwada, S. (2010). Acoustic cues for sound source distance and azimuth in rabbits, a racquetball and a rigid spherical model. J. Assoc. Res. Otolaryngol. 11, 541–557.
Kim, D. O., Sirianni, J. G., and Chang, S. O. (1990). Responses of DCN-PVCN neurons and auditory nerve fibers in unanesthetized decerebrate cats to AM and pure tones: analysis with autocorrelation/power-spectrum. Hear. Res. 45, 95–113.
Krishna, B. S., and Semple, M. N. (2000). Auditory temporal processing: responses to sinusoidally amplitude-modulated tones in the inferior colliculus. J. Neurophysiol. 84, 255–273.
Kulkarni, A., and Colburn, H. S. (1998). Role of spectral detail in sound-source localization. Nature 396, 747–749.
Kuwada, S., Batra, R., and Stanford, T. R. (1989). Monaural and binaural response properties of neurons in the inferior colliculus of the rabbit: effects of sodium pentobarbital. J. Neurophysiol. 61, 269–282.
Kuwada, S., Bishop, B., Alex, C., Condit, D., and Kim, D. (2011). Spatial tuning to sound-source azimuth in the inferior colliculus of the unanesthetized rabbit. J. Neurophysiol. 106, 2698–2708.
Kuwada, S., Stanford, T. R., and Batra, R. (1987). Interaural phase-sensitive units in the inferior colliculus of the unanesthetized rabbit: effects of changing frequency. J. Neurophysiol. 57, 1338–1360.
Lesica, N. A., and Grothe, B. (2008). Efficient temporal processing of naturalistic sounds. PLoS ONE 3:e1655. doi: 10.1371/journal.pone.0001655
Lomber, S. G., and Malhotra, S. (2008). Double dissociation of ‘what’ and ‘where’ processing in auditory cortex. Nat. Neurosci. 11, 609–616.
Palmer, A., and Kuwada, S. (2005). “Binaural and spatial coding in the inferior colliculus,” in The Inferior Colliculus, eds J. A. Winer and C. E. Schreiner (New York, NY: Springer-Verlag), 377–410.
Plomp, R. (1983). “The role of modulations in hearing,” in Hearing: Physiological Bases and Psychophysics, eds R. Klinke and R. Hartmann (New York, NY: Springer Verlag), 270–275.
Poirier, P., Samson, F. K., and Imig, T. J. (2003). Spectral shape sensitivity contributes to the azimuth tuning of neurons in the cat's inferior colliculus. J. Neurophysiol. 89, 2760–2777.
Rees, A., and Moller, A. R. (1983). Responses of neurons in the inferior colliculus of the rat to AM and FM tones. Hear. Res. 10, 301–330.
Rees, A., and Palmer, A. R. (1989). Neuronal responses to amplitude-modulated and pure-tone stimuli in the guinea pig inferior colliculus, and their modification by broadband noise. J. Acoust. Soc. Am. 85, 1978–1994.
Sayles, M., and Winter, I. M. (2008). Reverberation challenges the temporal representation of the pitch of complex sounds. Neuron 58, 789–801.
Slee, S. J., and Young, E. D. (2011). Information conveyed by inferior colliculus neurons about stimuli with aligned and misaligned sound localization cues. J. Neurophysiol. 106, 974–985.
Stecker, G. C., Mickey, B. J., Macpherson, E. A., and Middlebrooks, J. C. (2003). Spatial sensitivity in field PAF of cat auditory cortex. J. Neurophysiol. 89, 2889–2903.
Sterbing, S. J., Hartung, K., and Hoffmann, K. P. (2003). Spatial tuning to virtual sounds in the inferior colliculus of the Guinea pig. J. Neurophysiol. 90, 2648–2659.
Tollin, D. J., Populin, L. C., and Yin, T. C. (2004). Neural correlates of the precedence effect in the inferior colliculus of behaving cats. J. Neurophysiol. 92, 3286–3297.
Wightman, F. L., and Kistler, D. J. (1989). Headphone simulation of free-field listening. II: psychophysical validation. J. Acoust. Soc. Am. 85, 868–878.
Yin, T., and Kuwada, S. (2010). “Binaural localization cues,” in The Auditory Brain, Vol. 2, eds A. R. Palmer and A. Rees (Oxford, UK: Oxford University Press), 271–302.
Yin, T. C., Chan, J. C., and Carney, L. H. (1987). Effects of interaural time delays of noise stimuli on low-frequency cells in the cat's inferior colliculus. III. Evidence for cross-correlation. J. Neurophysiol. 58, 562–583.
Keywords: AM envelope processing, inferior colliculus, sound localization, auditory distance, reverberation
Citation: Kuwada S, Bishop B and Kim DO (2012) Approaches to the study of neural coding of sound source location and sound envelope in real environments. Front. Neural Circuits 6:42. doi: 10.3389/fncir.2012.00042
Received: 24 April 2012; Accepted: 13 June 2012;
Published online: 28 June 2012.
Edited by:
Eric D. Young, Johns Hopkins University, USAReviewed by:
Adrian Rees, University of Newcastle, UKNicholas A. Lesica, University College London, UK
Copyright: © 2012 Kuwada, Bishop and Kim. This is an open-access article distributed under the terms of the Creative Commons Attribution Non Commercial License, which permits non-commercial use, distribution, and reproduction in other forums, provided the original authors and source are credited.
*Correspondence: Shigeyuki Kuwada, Department of Neuroscience, University of Connecticut Health Center, Farmington, CT 06030, USA. e-mail: shig@neuron.uchc.edu