Activation of high and low affinity dopamine receptors generates a closed loop that maintains a conductance ratio and its activity correlate
 Wulf-Dieter C. Krenz
 Ryan M. Hooper2,3
  Anna R. Parker
 Astrid A. Prinz
 Deborah J. Baro
- 1Department of Biology, Georgia State University, Atlanta, GA, USA
- 2Department of Biology, Emory University, Atlanta, GA, USA
- 3Department of Biomedical Engineering, Georgia Institute of Technology and Emory University, Atlanta, GA, USA
Neuromodulators alter network output and have the potential to destabilize a circuit. The mechanisms maintaining stability in the face of neuromodulation are not well described. Using the pyloric network in the crustacean stomatogastric nervous system, we show that dopamine (DA) does not simply alter circuit output, but activates a closed loop in which DA-induced alterations in circuit output consequently drive a change in an ionic conductance to preserve a conductance ratio and its activity correlate. DA acted at low affinity type 1 receptors (D1Rs) to induce an immediate modulatory decrease in the transient potassium current (IA) of a pyloric neuron. This, in turn, advanced the activity phase of that component neuron, which disrupted its network function and thereby destabilized the circuit. DA simultaneously acted at high affinity D1Rs on the same neuron to confer activity-dependence upon the hyperpolarization activated current (Ih) such that the DA-induced changes in activity subsequently reduced Ih. This DA-enabled, activity-dependent, intrinsic plasticity exactly compensated for the modulatory decrease in IA to restore the IA:Ih ratio and neuronal activity phase, thereby closing an open loop created by the modulator. Activation of closed loops to preserve conductance ratios may represent a fundamental operating principle neuromodulatory systems use to ensure stability in their target networks.
Introduction
Neuromodulators reconfigure circuit output; but, they must confer stability as well as flexibility in order to maintain the functionality of a target network. Our knowledge of modulatory stabilizing mechanisms is limited. We suggest that modulators stabilize circuits by activating feedback loops that preserve conductance ratios and their activity correlates. Many cells maintain conductance ratios (Linsdell and Moody, 1994; MacLean et al., 2003; Schulz et al., 2006; Peng and Wu, 2007), and it is generally thought that a given conductance ratio sustains a specific activity parameter(s) (Marder and Goaillard, 2006; Hudson and Prinz, 2010; Soofi et al., 2012). A neuromodulator could establish a feedback loop if it modulated one of the conductances in the pair and conferred activity dependence on the other. In this case, modulation of the first current would contribute to changes in neuronal and circuit output that, in turn, would drive a change in the second current to restore the ratio and the activity feature. The work presented here establishes, for the first time, the existence of such a feedback loop.
The 14-neuron pyloric circuit in the spiny lobster, Panulirus interruptus, is a small central pattern generator (CPG) that drives the striated muscles surrounding the pylorus to produce an ordered series of contractions (Marder and Bucher, 2007). One cycle of contractions is continuously repeated to produce constant filtering of the foregut contents. The repetitive cycle of muscle contractions is underpinned by the recurrent output of the pyloric CPG, which stems from a pacemaker kernel that rhythmically inhibits four follower neuron cell types. The follower neurons then display post-inhibitory rebound (PIR), and differences in their rates of PIR, together with the synaptic architecture, produce a tri-phasic motor pattern (Figure 1).
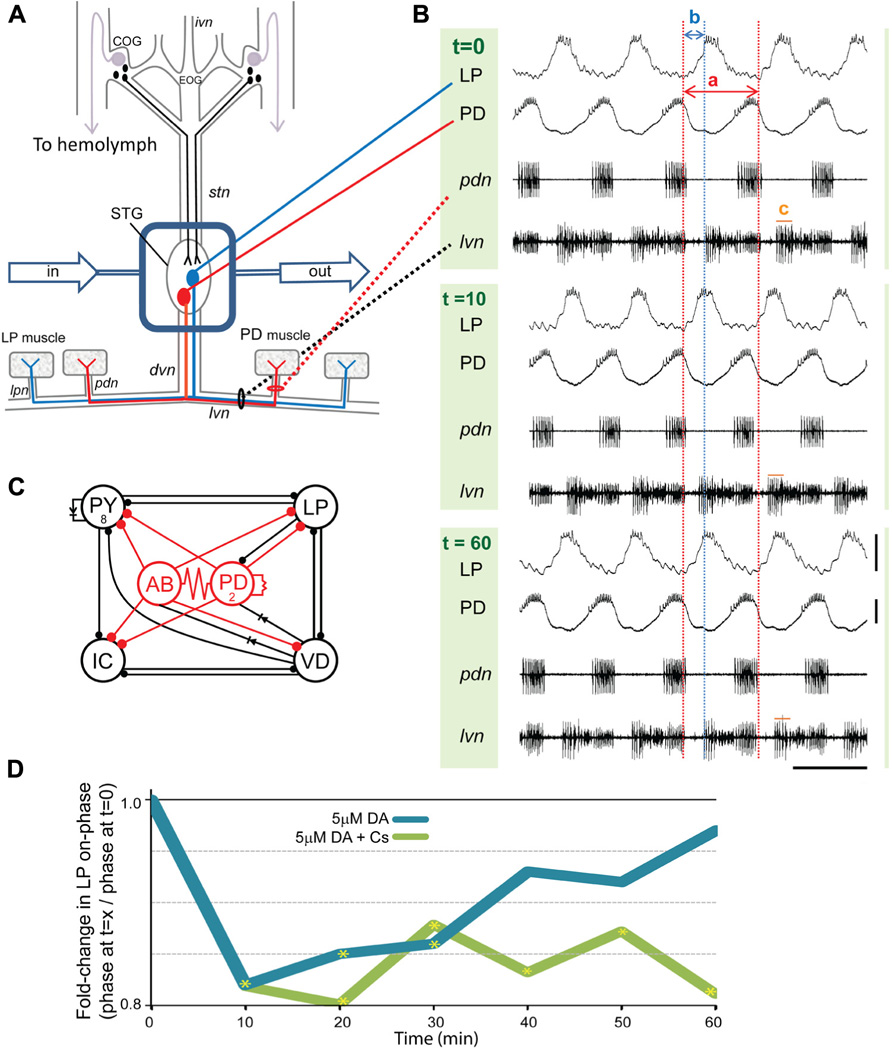
FIGURE 1. Phase recovery in the pyloric network. (A) In situ preparation: the stomatogastric nervous system (STNS) is dissected and pinned in a dish. The commissural ganglia (CoGs) contain DA neurons that project to the STG (black) and L-cells, which are the source of neurohormonal DA (purple). The well surrounding the STG (blue rectangle) is continuously superfused with saline (in/out arrows). There are ~30 neurons in the STG. The pyloric network comprises 14 STG neurons; two are drawn: pyloric dilator (PD, red), lateral pyloric (LP, blue). Network neurons interact locally within the STG and can project axons to striated muscles surrounding the foregut. The diagram shows that PD and LP neurons project their axons through identified nerves to innervate muscles (rectangles). (B) Spontaneous pyloric network output from one experiment during a 1 h 5 μM DA application: one set of traces comprises two intra-cellular recordings (top) and two extra-cellular recordings (bottom) from the in situ preparation diagrammed in (A). The three sets of traces represent recordings from the indicated time points, in minutes, directly before and after the start of DA application. Red and blue dashed lines reveal how cycle period and LP-on delay change with time. The two red lines demarcate one cycle. Cycle period (a) is defined as the time between the last spike in one PD burst and the last spike in the subsequent PD burst. Note that for each time point the last spike in the first PD burst is aligned with the first red line; however, the last spike in the second PD burst is not aligned with the second red line except at t = 0. This is because 5 μM DA produces a sustained average 10% reduction in cycle period. Thus, for t = 10 and 60 min, the spike in the second PD burst occurs prior to the second red line. Within the indicated cycle, a blue line aligns with the first spike in LP at t = 0. The time between the last spike in PD and the first spike in LP (b) represents LP-on delay, and LP-on phase is: b/a. Note that for the t = 10 min cycle, the first spike in LP occurs well before the blue line. This is because DA produces an average~20% LP-on phase advance. LP-on phase recovery can be seen in the cycle at t = 60 min because the first LP spike is again aligned with the blue line. Measures of pyloric output parameters can be obtained from either intra- or extra-cellular traces, and LP burst duration is indicated by (c) on the extracellular traces; scale bars: 20 mV and 500 ms. (C) The pyloric circuit: the diagram represents pyloric neuron interactions within the STG. Open circles represent the six cell types, numbers indicate more than one cell within a cell type: anterior burster (AB), inferior cardiac (IC), ventricular dilator (VD); filled circles, inhibitory chemical synapses; resistors and diodes, electrical coupling; red, pacemaker kernel and its output connections. (D) Phase recovery: the preparation shown in (A) was superfused with one of the two indicated treatments for 1 h and LP on-phase was measured every 10 min throughout the experiment (n ≥ 6/treatment). Average fold-changes in LP on-phase are plotted for each group; yellow asterisks, significantly different from t = 0, data taken from Rodgers et al. (2011a). Note that phase recovery in 5 μM DA was blocked by Cs.
Follower neuron cell types have specific activity phases, meaning that a given cell type fires a burst of action potentials at the same point in each reiteration of the cyclic network output. The timing of neuronal activity phases is determined, in part, by their rate of PIR. IA and Ih are opposing subthreshold conductances whose ratio regulates the rate of PIR (Harris-Warrick et al., 1995). Population studies on other species of crustaceans showed that pyloric neuron activity phases (Bucher et al., 2005; Goaillard et al., 2009) and their IA:Ih ratios (Temporal et al., 2012) were invariant across individuals and lifetimes, suggesting compensatory mechanisms may exist to maintain the IA:Ih ratio and its activity correlates. Such a compensatory mechanism(s) was revealed by overexpressing the Kv4 channels mediating IA throughout days in organ culture. Overexpression of IA in pyloric neurons resulted in compensatory increases in Ih that maintained the rates of PIR (MacLean et al., 2003, 2005).
We suggest that a mechanism to maintain the IA:Ih ratio may also prevail during DA modulation of pyloric neurons (Rodgers et al., 2011a): there is a single LP follower neuron in the pyloric network, and it contributes to cycle frequency regulation (Weaver and Hooper, 2003). The timing of the LP activity phase is critical for this function (Johnson et al., 2011). LP expresses D1Rs but not D2Rs (Zhang et al., 2010), and a 10 min bath application of 5 μM DA can disrupt the LP IA:Ih ratio and induce an LP phase advance largely by decreasing LP IA (Harris-Warrick et al., 1995). DA modulation also decreases LP burst duration and increases pyloric cycle frequency through intrinsic and network effects (Harris-Warrick et al., 1998; Rodgers et al., 2011a). During continuous DA application, the timing of LP activity phase is restored, while the DA-induced changes in burst duration and cycle frequency are maintained (Rodgers et al., 2011a); thus, a compensatory mechanism operates to restore neuronal activity phase during neuromodulation. Here we investigate this mechanism and show that LP phase recovery involves a DA- and activity-dependent (DAD) decrease in LP Ih that compensates for the modulatory decrease in LP IA to restore the LP IA:Ih ratio and LP activity phase.
Materials and Methods
Animals and Drugs
California spiny lobsters, Panulirus interruptus, were purchased from Catalina Offshore Products (San Diego, CA, USA) and Marinus Scientific (Long Beach, CA, USA) and housed at 16–18°C in saltwater aquaria at Georgia State University (Atlanta, GA, USA). Animals of both sexes were used in these experiments. TTX was from Tocris (Ellisville, MO, USA), all other reagents were from Sigma (St. Louis, MO, USA). Solutions containing DA were made fresh every 30 min in saline to prevent oxidation and reduced DA activity.
Physiological Recordings
Lobsters were anesthetized on ice for at least 30 min, followed by dissection of the stomatogastric nervous system (Figure 1), as previously described (Panchin et al., 1993). A Vaseline well was constructed around the stomatogastric ganglion (STG) which was continuously superfused for the remainder of the experiment with Panulirus (P.) saline (in mM: 479 NaCl, 12.8 KCl, 13.7 CaCl2, 39 Na2SO4, 10 MgSO4, 2 glucose, 4.99 HEPES, 5 TES; pH 7.4). Experiments were conducted at room temperature (19–21°C). Temperature was continuously monitored with a miniature probe inside the well. Temperatures changed by less than 1°C throughout the course of the day.
Cells were identified by combining standard intracellular and extracellular recording techniques. Lateral pyloric (LP) neurons were identified by their distinct waveforms, the timing of their voltage oscillations, and correlation of spikes on the extracellular and intracellular recordings. Intracellular somatic LP recordings were obtained using 20–40 MΩ glass microelectrodes filled with 3 M KCl connected to Axoclamp 2B or 900A amplifiers (Molecular Devices, Foster City, CA, USA). Extracellular recordings of identified motor neurons were obtained using a model 1700 differential AC amplifier (A-M Systems, Everett, WA, USA) and stainless steel pin electrodes on the lateral ventricular nerve (lvn) and pyloric dilator nerve (pdn) and recorded with Axoscope v8.2 software (Molecular Devices, Foster City, CA, USA). Extracellular recordings were analyzed using DataView v6.3.2 (Heitler, 2009) to determine cycle period, spike frequency, burst duration, LP-on/off delays, and LP activity phase as previously described (Rodgers et al., 2011a). Reported values for all parameters represent a 10 cycle average.
Experiments in TTX blocked action potential firing and slow voltage oscillations in STG neurons. Under these conditions, the resting membrane potential of most pyloric neurons is between ~ -52 and -62 mV. Pyloric neuron input/output curves suggest that graded transmitter release will be minimal to non-existent at these voltages (Johnson et al., 1991, 1995). DA (100 μM) can shift the curves (Johnson and Harris-Warrick, 1990), but a 10-fold lower concentration has a minimal effect on the strength of graded release (Kvarta et al., 2012). Pyloric neurons can oscillate in TTX if bathed in 100 μM DA, but we do not observe pyloric oscillations in TTX at ≤5 μM DA.
Two-Electrode Voltage Clamp (TEVC)
For TEVC of LP Ih, the LP neuron was impaled with two micropipettes (8–10 MΩ when filled with 3 M KCl) connected to Axoclamp 2B or 900A amplifiers (Molecular Devices, Foster City, CA, USA). The well surrounding the STG was superfused with P. saline containing 100 nM TTX for ≥5 min. LP was clamped to a -50 mV holding potential using pClamp software. Ih was elicited using a series of 4 s hyperpolarizing voltage steps, from -60 to -120 mV in 10 mV increments with 6 s between steps. Steady-state peak currents were measured by fitting the current trace back to the beginning of the hyperpolarizing voltage step using a single exponential equation. In some experiments small oscillations interrupted the current trace at t = 0 (e.g., Figure 2) and prevented curve fitting. In those experiments, peak Ih was measured by subtracting the initial fast leak current from the slowly developing peak of Ih at the end of each negative voltage step. Currents were converted to conductance using (G = Ipeak/(Vm - Vrev) and fitted to a first-order Boltzmann equation. Vrev Ih = -35 mV (Kiehn and Harris-Warrick, 1992). For TEVC measurement of peak IA the command potential was stepped from -50 to -90 mV for 200 ms to remove resting inactivation. The deinactivating prepulse was immediately followed by an activation pulse to 60 mV for 400 ms to ensure that channels were maximally activated and observed changes could not be due to alterations in voltage dependence (Zhang et al., 2010). To subtract the leak current the hyperpolarizing prepulse was omitted and instead the prepulse was set to -40 mV to remove IA activation from the -50 mV holding potential. For recordings to measure the LP IA:Ih ratio in 5 μM DA, the saline also contained 20 μM TEA and 1 μM PTX to block DA-induced modulatory changes in other conductances that could interfere with measures of peak currents. Recurring voltage steps to mimic slow wave oscillations and action potentials were constructed with pClamp software. When currents were not being measured, and recurring steps were not being implemented, LP was held at its initial resting membrane potential in TTX (on average, -59 mV).
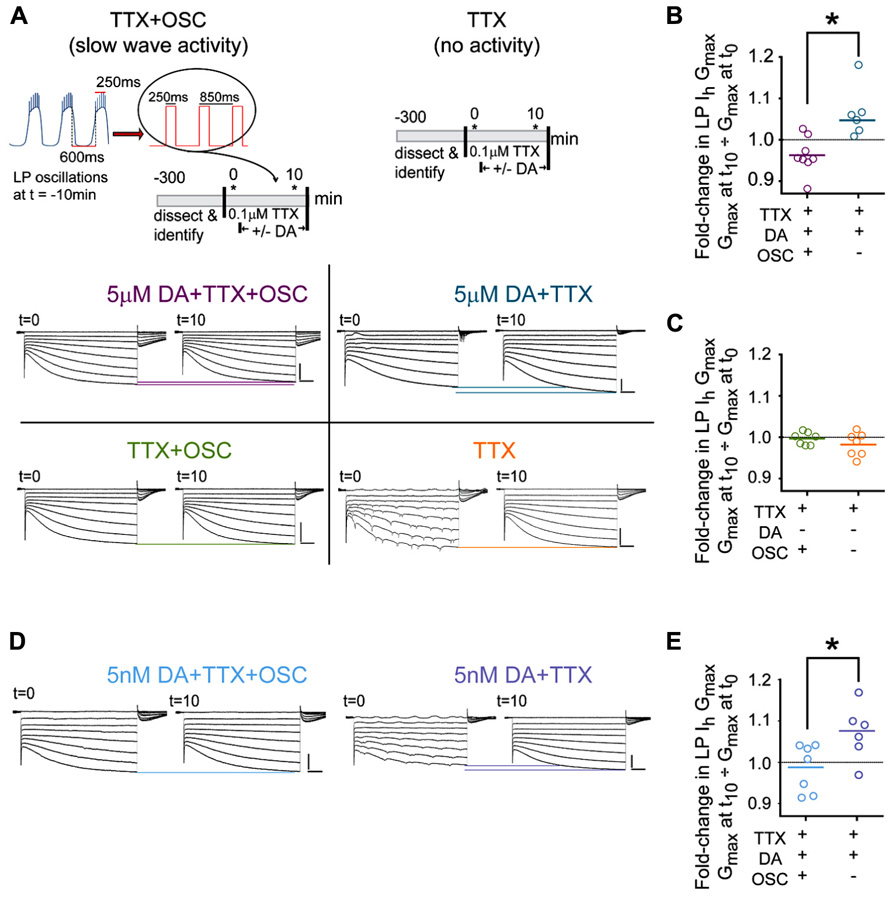
FIGURE 2. DA-enables activity-dependent alterations in LP Ih. (A) The protocols used to measure DA- and/or activity-induced changes in LP Ih are diagramed in the top two panels. Asterisks indicate points where TEVC measures of LP Ih were made. Bottom panels show typical LP Ih recordings at t = 0 and t = 10 min for each of the four the indicated treatment groups; scale bars: 500 ms and 5 nA. Note that distal compartments of LP neurons are not completely space clamped and oscillatory activity at t = 0 was observed in all treatment groups in ~20% of the experiments due to the short exposure to TTX (example seen in TTX group); nevertheless, Ih could be measured from the traces. (B,C) Plots of the fold-changes in LP Ih Gmax in each treatment group at t = 10 min. Each symbol represents one experiment; solid lines indicate the means; *p < 0.05, t-tests. (D) Typical LP Ih recordings for additional experiments in 5 nM DA. (E) Plots of the fold-changes in LP Ih Gmax in each treatment group in 5 nM DA at t = 10 min. Each symbol represents one experiment; solid lines represent means *p < 0.05, t-test.
Dynamic Clamp
We used the dynamic clamp to introduce an artificial injection current (Iinj) specified to counteract the metaplastic (DA modulation of activity dependent (AD) intrinsic plasticity) change in Ih in LP neurons during ongoing rhythmic pyloric activity following bath application of 5 μM DA (Sharp et al., 1993a,b; Prinz et al., 2004a). The membrane potential of the LP soma was amplified, fed into a PCI-6052E DAQ board (National Instruments, Austin, TX, USA), and digitized at 20 kHz. The dynamic clamp program was written in the C programming language and designed to use the real time Linux dynamic controller (Dorval et al., 2001). This dynamic clamp software calculated the Iinj that would be active at the measured membrane potential (Vm) given a set of model parameters as follows:
where m changed according to dm/dt = (m∞ - m)/τ m, computed numerically using the first-order forward Euler method, and m∞ was given by m∞ = 1/(1 + exp((Vm - V½)/Vslope). Erev was set to -35 mV (Kiehn and Harris-Warrick, 1992). Values for Ih τm represent average TEVC measures from 12 experiments. LP Ih was measured in each LP neuron before the dynamic clamp experiment and Gmax, V½, and Vslope were determined from a Boltzmann fit as described above. The predicted metaplastic change in LP Ih Gmax was determined using the activity-dependence curve in Figure 3 and the measured change in LP burst duration after a 10 min application of 5 μM DA. The predicted metaplastic change in Ih conductance was subtracted with the dynamic clamp, which calculated and continuously injected current according to the above model, where Gmax = measured LP Ih Gmax × predicted metaplastic change in LP Ih Gmax. Intracellular and extracellular recordings of LP activity throughout the experiment were obtained using a separate computer equipped with Axoscope and Clampex 9.2 software (Axon Instruments).
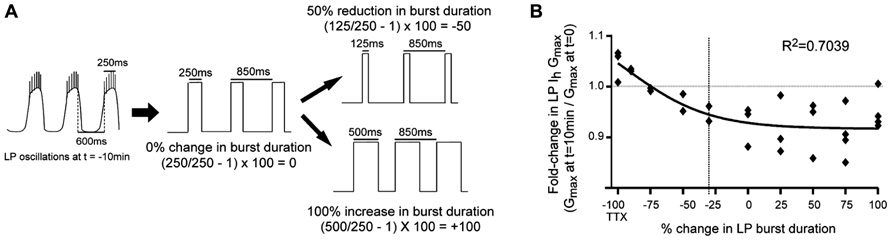
FIGURE 3. LP Ih activity-dependence curve in 5 μM DA. (A) Experimental protocol: TEVC was used to create a recurring voltage step that mimicked slow wave activity at t = -10 min, except the length of the depolarizing step varied across experiments to alter burst duration. Examples are shown for how the length of the step corresponded to no change, a reduction or an increase in burst duration. There was no change in cycle period. (B) Plot of fold-changes in LP Ih Gmax for the 10 min time point; -100 on the x-axis represents experiments in TTX without a recurring step; vertical dashed line marks 30% reduction in burst duration (i.e., average 5 μM DA-induced change) each diamond represents one experiment; data were fitted with a Boltzmann sigmoidal equation.
Statistical Analysis
Data were checked for normal distribution and analyzed using parametric statistical tests with Prism software package v5.01 (GraphPad, La Jolla, CA, USA). Significance was set at p < 0.05 in all cases. Individual samples that were more than 2 standard deviations from the mean were excluded from the analyses after determining the mean. This eliminated two experiments. ANOVAs are followed by post hoc tests that make all possible comparisons between columns (Tukey’s) or that compare all columns to a single column, usually t = 0 (Dunnett’s). Means are followed by standard errors.
Results
The Experimental Model
The pyloric circuit is located in the crustacean STG (Figure 1A), and it produces a rhythmic motor output in situ. Each pyloric cell type displays repetitive oscillations in membrane potential with a burst of spikes riding on the depolarized plateau (Figure 1B). The circuit comprises six oscillatory cell types coupled by fast inhibitory synapses and/or gap junctions (Figure 1C). The pacemaker kernel (anterior burster (AB) + 2 PD neurons) rhythmically inhibits the four follower neuron cell types, which then display different rates of PIR. The different rates of PIR are due, in part, to differences in the expression of IA in each follower neuron (Baro et al., 1997, 2000). IA delays pyloric neuron PIR (Tierney and Harris-Warrick, 1992): the hyperpolarizing phase of the membrane potential oscillation removes resting inactivation from the Kv4 channels mediating IA and activates the hyperpolarization activated cyclic nucleotide (HCN) gated channels mediating the depolarizing inward Ih. The subsequent depolarization activates Kv4 channels, and the resulting outward potassium current slows the rate of depolarization. In this way, the ratio of IA:Ih can influence when LP activity phase begins (termed LP-on phase). Figure 1B shows intra- and extra-cellular recordings from a typical experiment where the STG was superfused with 5 μM DA for 1 h: DA was applied after the initial recording at t = 0. By 10 min, DA increased pyloric network cycle frequency by reducing the inherent period of the pacemaker AB neuron (Harris-Warrick et al., 1998; Rodgers et al., 2011a). DA application also reduced LP burst duration and advanced LP firing phase. The traces indicate that by 60 min in DA, network cycle frequency was still increased and LP burst duration was still decreased, but LP-on phase was restored. In previous experiments we clearly demonstrated that phase recovery was AD: if the experiment shown in Figure 1B was repeated with continuous injection of a depolarizing bias current into LP to block the DA-induced decrease in LP burst duration, then the LP phase advance occurred, but phase recovery did not (Rodgers et al., 2011a). We also showed that phase recovery in the presence of 5 μM DA could be blocked by bath application of CsCl to reduce Ih (Figure 1D).
DA- and Activity-Dependent (DAD) Regulation of LP Ih in 5 μM DA
We first tested the idea that DA conferred activity-dependence upon LP Ih by measuring Ih in LP neurons that showed different activity patterns. In these experiments, LP neurons have one of two activity patterns: either LP activity is completely blocked (TTX), or LP displays normal slow wave but not spike activity (TTX + OSC). LP Ih is measured in each of these two groups in the presence and absence of DA resulting in four treatment groups. The experiment, which is diagrammed in Figure 2A, was as follows: after dissection and cell identification, the STG was superfused with TTX for 5 min to block spike and slow wave activity, and the TTX was present throughout the remainder of the experiment. Next, at t = 0, LP Ih was measured with somatic TEVC. After the first measure of LP Ih, DA was or was not added to the superfusate and LP Ih was re-measured after 10 min. The voltage of LP was continuously controlled with TEVC throughout the experiment. Between measures of LP Ih, a recurrent step mimicking LP slow oscillatory activity at t = -10 min was (TTX + OSC) or was not (TTX) implemented. Frequency, duration, and amplitude of the recurrent steps were chosen for each preparation individually depending upon measured activity at t = -10 min: frequency and duration of the recurrent step corresponded to average cycle frequency and LP burst duration at t = -10 min, respectively; the step and holding potentials corresponded to the average peak and nadir of the LP oscillation at t = -10 min, respectively. In the absence of the recurring voltage step, LP was held at its initial resting membrane potential in TTX (-59 mV on average). Typical LP Ih recordings for each treatment group are shown in Figure 2A.
The results indicated that DA conferred activity dependence upon LP Ih: in the presence of DA, the fold-change in LP Ih Gmax varied according to LP activity (Figure 2B; t-test, p < 0.004); by 10 min in 5 μM DA average LP Ih Gmax was significantly decreased in preparations with the slow wave LP activity pattern (paired t-test, t = 0 vs. 10 min, p = 0.0491) and significantly increased in preparations showing no LP activity (paired t-test, p = 0.0285). In the absence of DA the fold-change in LP Ih Gmax was not significantly different between treatment groups (Figure 2C, t-test, p = 0.256) and there was no significant change in LP Ih Gmax by t = 10 min relative to t = 0 in preparations where slow wave activity was mimicked (paired t-test, p = 0.1166) or activity was completely blocked (Wilcoxon matched pairs signed rank test, p = 0.2969). We previously demonstrated that 5 nM DA acting at high affinity LP D1Rs permitted a decrease in LP burst duration to produce an increase in LP Ih Gmax that persisted well beyond DA washout (Rodgers et al., 2011a). This suggested that perhaps high affinity D1Rs receptors might also mediate the more rapid DAD regulation of LP Ih Gmax observed in Figure 2B. To test this hypothesis, we repeated the experiments diagrammed in Figure 2A, but applied 5 nM rather than 5 μM DA (Figure 2D). The results were consistent with the hypothesis; in the presence of 5 nM DA, the fold-change in LP Ih Gmax at t = 10 min varied according to activity (Figure 2E, t-test, p = 0.0321). Interestingly, LP Ih Gmax did not change over time in 5 nM DA preparations where slow wave activity was mimicked (paired t-test, t = 0 vs. 10 min, p = 0.5962); however, a complete block of activity produced a clear trend toward an increase in LP Ih Gmax (paired t-test, p = 0.0596), and the magnitude of the increase was similar to that observed in 5 μM DA (compare Figures 2B vs. 2E). The difference in the TTX + OSC treatment groups in 5 nM DA (no change in Gmax) vs. 5 μM DA (decrease in Gmax) may be due to the fact that micromolar DA can regulate calcium dynamics during oscillations in membrane potential (Johnson et al., 2003; Kadiri et al., 2011). For all treatment groups the voltages of half activation changed by ≤2.3 mV on average, and LP Ih voltage dependence is not considered further here. In sum, ≥5 nM DA permitted activity to differentially regulate LP Ih Gmax; but, neither 5 nM DA alone nor changes in activity alone significantly altered LP Ih Gmax; i.e., DA did not modulate LP Ih, but conferred activity-dependence upon LP Ih.
DAD Regulation of LP Ih is Necessary for Phase Recovery
Our previous study suggested that LP phase recovery during sustained DA modulation was triggered by a change in LP burst duration (Rodgers et al., 2011a). In order to understand if and how DAD regulation of LP Ih restored the timing of the LP activity phase in 5 μM DA, it was necessary to determine how LP Ih varied according to changes in LP burst duration. An LP Ih activity-dependence curve for changes in burst duration was constructed by repeating the previous experiments in 5 μM DA for the TTX + OSC treatment group, except that the length of the depolarizing step varied across experiments to mimic a change in burst duration (Figure 3A). A plot of the fold-change in LP Ih Gmax vs. percent change in LP burst duration at t = 10 min was best-fitted with a Boltzmann sigmoidal equation. DA (5 μM) produced an average 30% decrease in LP burst duration (Rodgers et al., 2011a), and so, according to the activity-dependence curve, LP Ih Gmax should be reduced by ~6% in 5 μM DA during on-going activity (Figure 3B, dashed line). This decrease in LP Ih is consistent with our hypothesis that DAD regulation of LP Ih compensates for the DA-induced modulatory decrease in LP IA to restore the IA:Ih ratio and the timing of LP activity phase.
In order to determine if DAD regulation of LP Ih was necessary for phase restoration, we used the activity-dependence curve in conjunction with dynamic clamp experiments to abrogate DAD regulation of LP Ih (Figure 4). The experimental preparation was as shown in Figure 1A. After dissection and cell identification the STG was superfused with TTX for 5 min; LP Ih was measured with TEVC and values for Gmax, V1/2 and Vslope were subsequently incorporated into the dynamic clamp model for Iinj (see Section “Materials and Methods”). TTX was immediately washed out with saline for 90 min. LP burst duration was measured at the end of the wash followed by application of 5 μM DA from t = 0–60 min. The predicted fold-change in LP Ih Gmax due to DAD regulation was determined using the activity-dependence curve in Figure 3 and the measured change in LP burst duration from t = 0 to t = 10 min, and was subsequently incorporated into the dynamic clamp model for Iinj (see Section “Materials and Methods”). From ~t = 10 to 60 min, dynamic clamp was used to remove the predicted DAD regulation of LP Ih, i.e., to add back, in the form of dynamic clamp current, the same amount of Ih that was predicted to have been lost because of DAD regulation. LP-on phase was subsequently measured every 10 min from t = 0–60 min. Plots of the fold-change in LP-on phase over the course of the experiment demonstrated that 5 μM DA-induced the usual phase advance, but removing DAD regulation of LP Ih prevented LP-on phase recovery (compare Figures 4 vs. 1D). It also prevented LP-off phase recovery [repeated measures ANOVA: F(6,4) = 3.119, p = 0.0210]. However, it should be noted that the recovery of LP-off phase may be complicated by the PY cell activity phase. The PY-LP synapse contributes to the timing of LP-off phase, especially in DA; thus, any change in LP-on phase that subsequently alters the timing of PY activity through the LP–PY synapse may also indirectly affect LP-off phase (Johnson et al., 2011). From these experiments we conclude that DAD regulation of LP Ih Gmax is necessary for LP-on phase restoration.
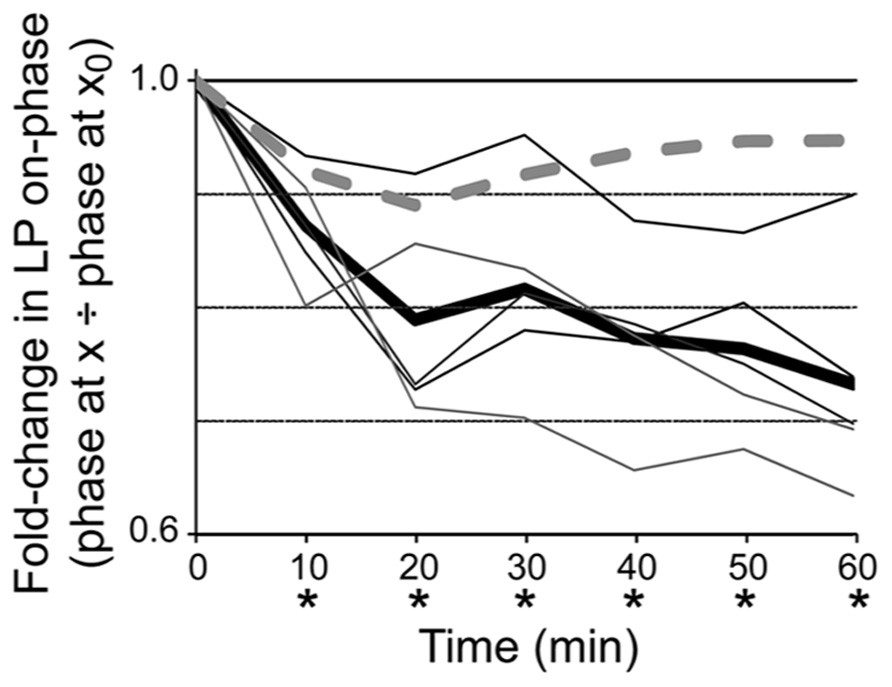
FIGURE 4. DAD regulation of LP Ih is necessary for phase recovery in 5 μM. Plots of fold-changes in LP-on phase over time for dynamic clamp (solid lines) and control (dashed line) experiments indicate that introduction of a dynamic clamp current to abrogate DAD regulation of LP Ih prevents phase recovery; thin lines, individual experiments with dynamic clamp (n = 5); thick line, average for experiments with dynamic clamp; dashed line, control experiment that was exactly the same as the dynamic clamp experiments except that the dynamic clamp was turned off during the 1 h superfusion with 5 μM DA. Repeated measures ANOVA with Dunnett’s post hoc tests that compared all time points to t = 0 showed that average LP-on phase did not recover in experimental preparations, F(6,4) = 16.04, p < 0.0001; *p < 0.05. Note that phase did recover in the control experiment.
DAD Regulation of LP Ih Compensates for Modulatory Changes in LP IA to Restore IA:Ih
Thus far the data are consistent with our working model for how phase advance and recovery occur in 5 μM DA: 5 μM DA initially alters the LP IA:Ih ratio by decreasing LP IA, and this creates a phase advance (Harris-Warrick et al., 1995; Zhang et al., 2010). DA (5 μM) also produces a 30% reduction in LP burst duration, and this subsequently initiates a process that generates a compensatory decrease in LP Ih to restore the LP IA:Ih ratio and produce phase recovery. In order to further test this hypothesis, we repeatedly measured the LP IA:Ih ratio during a 1 h 5 μM DA application accompanied by a recurrent step that mimicked a 30% reduction in LP burst duration. At t = 0, peak LP IA was measured at +60 mV and peak LP Ih was measured at -120 mV. DA (5 μM) was immediately applied for 1 h and peak currents were re-measured at t = 10, 30, and 60 min. During the DA application, whenever peak currents were not measured, LP received a recurring step. Plots of the average fold-changes in the peak IA:Ih ratio (Figure 5A) and average peak IA and Ih (Figure 5B) suggested that our hypothesis was incorrect or incomplete. The average IA:Ih ratio significantly decreased over time (Figure 5A) because the decreases in peak LP Ih did not fully compensate for the decreases in peak LP IA (Figure 5B).
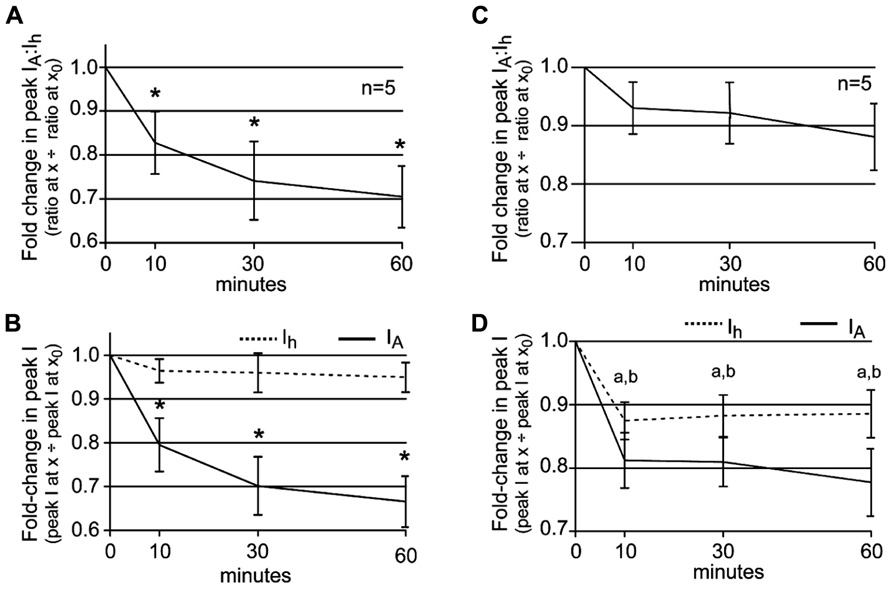
FIGURE 5. The LP IA:Ih ratio is maintained in 5 μM DA when DA application is accompanied by DA-induced changes in slow wave activity. (A) A plot of the fold-changes in the LP IA:Ih ratio (mean ± SEM) throughout a 1 h superfusion with 5 μM DA and implementation of a recurring voltage step that mimicked the DA-induced 30% decrease in LP burst duration, but no change in cycle frequency. The ratio significantly decreased with time; repeated measures ANOVA with Dunnett’s post hoc tests that compare all time points to t = 0, F(3,4) = 7.322, p = 0.0032. (B) Plots of the fold-changes in peak LP IA and Ih (mean ± SEM) from the same experiments as in (A). Repeated measures ANOVAs with Dunnett’s post hoc tests that compare all time points to t = 0 indicate that only LP IA was significantly decreased [LP IA: F(3,4) = 19.66, p < 0.0001; LP Ih, F(3,4) = 1.218, p = 0.3456]. *p < 0.05. (C) Plot of the fold-changes in the LP IA:Ih ratio (mean ± SEM) throughout a 1 h superfusion with 5 μM DA and implementation of a recurring voltage step that mimicked the DA-induced 30% decrease in LP burst duration and a 10% increase in cycle frequency. The ratio did not change significantly over time (repeated measures ANOVA, see text). (D) Plots of the fold-changes in peak LP IA and Ih (mean ± SEM) from the same experiments as in (C) show that both currents are stably altered by 10 min; a and b indicate a significant change in LP IA and Ih, respectively, based on repeated measures ANOVA with Dunnett’s post hoc tests that compare all time points to t = 0, p < 0.05 (see text).
It is noteworthy that DA-induced a change in both LP burst duration and cycle period (Rodgers et al., 2011a), but our step only mimicked the change in burst duration. We next asked if the DA-induced increase in cycle frequency contributed to DAD regulation of LP Ih Gmax, by repeating the experiments to measure the LP IA:Ih ratio but using a recurring voltage step that mimicked both the average 30% decrease in LP burst duration and the 10% increase in cycle frequency. In this case, the average IA:Ih ratio did not change significantly throughout the experiment [Figure 5C, repeated measures ANOVA, F(3,4) = 2.161, p = 0.1457], despite the fact that by 10 min, average peak LP IA was significantly and stably reduced to 81 ± 4% of its initial value [Figure 5D, repeated measures ANOVA, F(3,4) = 16.91, p = 0.0001]. The ratio did not change because by 10 min in DA, average peak LP Ih was significantly and stably reduced to 87 ± 3% of its original value [Figure 5D, repeated measures ANOVA, F(3,4) = 6.983, p = 0.0057]. We conclude that the AD mechanism that regulates LP Ih Gmax in the presence of DA integrates information on both neuronal burst duration and cycle period.
Spike Activity Delays the Effect of Changes in Slow Wave Activity
Overall, the data supported our hypothesis: in the presence of 5 μM DA and average DA-induced changes in LP slow wave activity, the DA-induced fold-change in LP IA was compensated by a similar fold-change in LP Ih. However, one aspect of the data did not fit with our working model. The ratio could be restored by 10 min (Figure 5), but phase recovery required 60 min on average (Figures 1B,D). It is possible that restoration of the LP IA:Ih ratio was necessary (Figure 4) but not sufficient for phase recovery, and that one or more unidentified slower processes were also involved. Alternatively, one major difference between the experiments shown in Figures 1 vs. 5 was the presence vs. absence of spike activity. If a Ca2+ sensor participated in this homeostatic mechanism to maintain the LP IA:Ih ratio (Gunay and Prinz, 2010), then spike activity and DA-induced changes in slow wave activity might have opposing effects on steady-state Ca2+, and spike activity could delay the compensatory decrease in LP Ih by slowing the rate of change of steady-state Ca2+. To investigate this idea, we repeated experiments to measure the LP IA:Ih ratio using a recurring step that mimicked not only slow wave activity, but also, spike activity.
During normal LP activity, spikes passively spread to the soma and neuropil from a distal spike initiation zone (siz). We mimicked spike activity generated at the siz with depolarizing current injections into the soma. We reasoned that LP HCN channels, which are located in the neuropil (Goeritz et al., 2011), will experience a similar depolarization regardless of whether the spikes initiate at the soma or siz, because the two structures are roughly equidistant from the neuropil. This logic rests on the untested assumption that the electrotonic properties and protein composition of the entire primary neurite membrane between soma and spike initiation zone are homogeneous and that electrotonic potentials spread with similar efficiency in both directions. We also made untested assumptions about LP spike amplitude and duration. Peak voltage (+40 mV) and duration (2 ms) of PD spikes have been directly measured from intra-axonal recordings (Ballo et al., 2012). We assumed LP and PD spikes would be similar and used these values here.
Previous work suggested that activity-dependent regulation can be coded by the pattern of spike activity and not simply the total amount of depolarization (Gorbunova and Spitzer, 2002). We performed two series of experiments to determine if spike activity influenced the LP IA:Ih ratio either by the total amount of depolarization produced or by the pattern of depolarization. The total amount of depolarization was mimicked with a step to +40 mV whose duration equaled the average number of spikes per burst multiplied by 2 ms. Patterned spike activity was mimicked by 2 ms depolarizations to +40 mV separated by the average interspike interval (ISI), and the number of depolarizations was equal to the average number of spikes per burst.
In the first set of experiments a depolarizing step to +40 mV was superimposed upon the recurrent voltage step that mimicked LP slow wave activity in 5 μM DA (Figure 6A). The duration of the step to +40 mV corresponded to the average number of spikes per burst at t = -10 min multiplied by 2 ms. Note that the average number of spikes per burst does not change significantly during a 1 h 5 μM DA application [repeated measures ANOVA, F(6,8) = 0.8920, p = 0.5083, data not shown]. Surprisingly, this short depolarization on top of the usual recurrent voltage step that mimicked a 30% decrease in LP burst duration and a 10% increase in cycle frequency completely abolished the effect of DA-induced changes in slow wave activity upon LP peak Ih. The LP IA:Ih ratio significantly decreased under these conditions [Figure 6C; repeated measures ANOVA: F(3,3) = 6.114, p = 0.0149] because, there was no reduction in LP Ih (Figure 6D, mean ± SEM fold-change in LP peak Ih at 10 min = 1.008 ± 0.010). The insignificant change in LP Ih throughout the 1 h 5 μM DA application could not compensate for the significant decrease in LP IA [Figure 6D; repeated measures ANOVAs: Ih, F(3,4) = 0.1801, p = 0.9078; IA, F(3,3) = 5.251, p = 0.0228]. Note that the change in LP IA was not significantly different between experiments that did (Figure 6D) vs. did not (Figure 5D) mimic spike activity along with DA-induced changes in slow wave activity [two-way ANOVA: treatment, F(1,28) = 0.08, p = 0.7789; time, F(3,28) = 6.83, p = 0.0014; interaction, F(3,28) = 0.33, p = 0.8065].
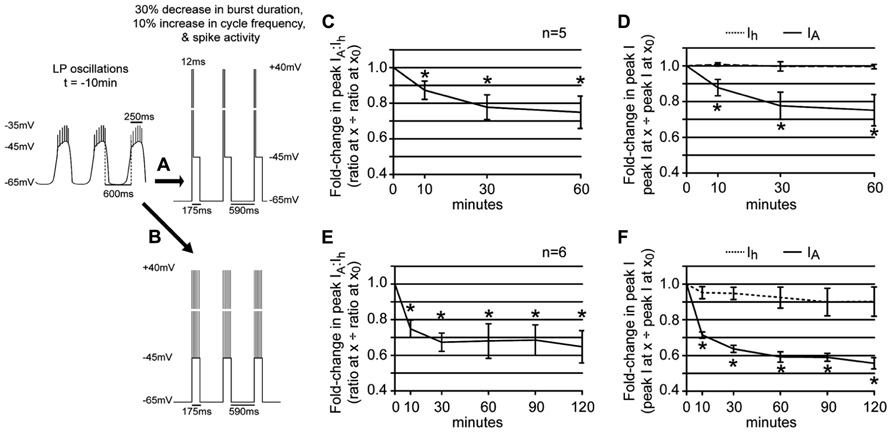
FIGURE 6. Spike activity influences the LP IA:Ih ratio in 5 μM DA. (A,B) Diagrams of recurrent voltage steps that were applied during 5 μM DA application. Spikes are not drawn to scale. Note the recurrent step mimicked the DA-induced decrease in LP burst duration and cycle period. In addition, it mimicked spike activity. In (A), spike activity is represented as a single depolarizing step to +40 mV. The duration of the step = 6 spikes × 2 ms = 12 ms. In (B), the six spikes are represented as 6, 2 ms depolarizations to +40 mV. The time between each depolarization is 0.66 x average ISI in ms at t = -10 min. (C) Plot of the fold-changes in the LP IA:Ih ratio (mean ± SEM) throughout a 1 h superfusion with 5 μM DA and implementation of the recurrent voltage step indicated by protocol A. The ratio significantly decreased with time; *p < 0.05, repeated measures ANOVA with Dunnett’s post hoc tests that compare all time points to t = 0 (see text). (D) Plots of the fold-changes in peak LP IA and Ih (mean ± SEM) from the same experiments as in (C); *p < 0.05 for IA only, repeated measures ANOVAs with Dunnett’s post hoc tests (see text). (E) Plot of the fold-changes in the LP IA:Ih ratio (mean ± SEM) throughout a 2 h superfusion with 5 μM DA and implementation of a recurring voltage step indicated by protocol B. The ratio significantly decreased with time; *p < 0.05, repeated measures ANOVA with Dunnett’s post hoc tests that compare all time points to t = 0, F(5,4) = 8.728, p = 0.0002. (F) Plots of the fold-changes in peak LP IA and Ih (mean ± SEM) from the same experiments as in (E). Note that although LP Ih is slowly reduced, repeated measures ANOVAs with Dunnett’s post hoc tests that compare all time points to t = 0 indicate that only the decrease in LP IA is statistically significant [LP IA: F(3,4) = 19.66, p < 0.0001; LP Ih, F(3,4) = 1.218, p = 0.3456]; *p < 0.05.
We next asked if we could delay, but not abolish the compensatory decrease in LP Ih Gmax by better mimicking the spike pattern (Figure 6B). To do this, we included an ISI in between each 2 ms depolarization to +40 mV that was equal to the average ISI at t = -10 min multiplied by 0.66, because a 1 h 5 μM DA application reduced the mean ISI to 66% of its initial value [repeated measures ANOVA: F(6,4) = 4.002, p = 0.0065, data not shown]. Including patterned spike activity in the recurrent voltage step delayed the compensatory reduction in LP Ih Gmax (Figure 6F). By 10 min in 5 μM DA, the compensatory reduction in LP peak Ih was significantly smaller for protocols that did (Figure 6F) vs. did not (Figure 5D) include patterned spike activity on top of the slow wave (Student’s t-test, p = 0.0014). Although a delayed and slowly developing compensatory reduction in LP Ih Gmax was elicited with protocol B, it was not large enough to compensate for the decrease in LP IA, even by 2 h (Figure 6E). This is because the patterned spike activity also unexpectedly regulated LP IA: the reduction in peak LP IA was significantly larger for protocols that did (Figure 6F) vs. did not (Figure 5D) include patterned spike activity on top of the slow wave [two-way ANOVA, treatment, F(1,32) = 25.76, p < 0.0001; time, F(3,32) = 38.53, p < 0.0001; interaction, F(3,32) = 3.45, p = 0.0278]. This large decrease in LP IA was most likely a technical artifact. Kv4 channels are located throughout the LP somatodendritic membrane (Baro et al., 2000). According to our untested assumption, Kv4 channels in the neuropil will experience typical changes in membrane potential with each spike mimic; however, this is not true for somatic Kv4 channels. The average LP membrane potential typically recorded at the soma at the peak of spike activity is -36 ± 4 mV because spikes are severely attenuated as they passively spread to the soma. Thus, a +40 mV depolarization at the soma is unrealistic and most likely generates an artificially large decrease in the somatic LP IA. Nonetheless, based on these experiments we can conclude that DAD regulation of LP Ih Gmax integrates information on burst duration, cycle period, and spike activity.
Discussion
The principal finding of our study is that 5 μM DA simultaneously creates flexibility and stability in a rhythmically active neural network by activating a closed loop (Figure 7). DA acts at both low and high affinity D1Rs to alter activity and enable AD intrinsic plasticity, respectively. The feedback loop re-established a conductance ratio that was modified by DA, and thereby restored a neuronal phase relationship during a sustained increase in cycle frequency. The generation of closed loops via modulator-enabled AD intrinsic plasticity may represent a fundamental organizing principle used by modulatory systems to preserve conductance ratios and their associated activity correlates, while at the same time altering other aspects of circuit output.
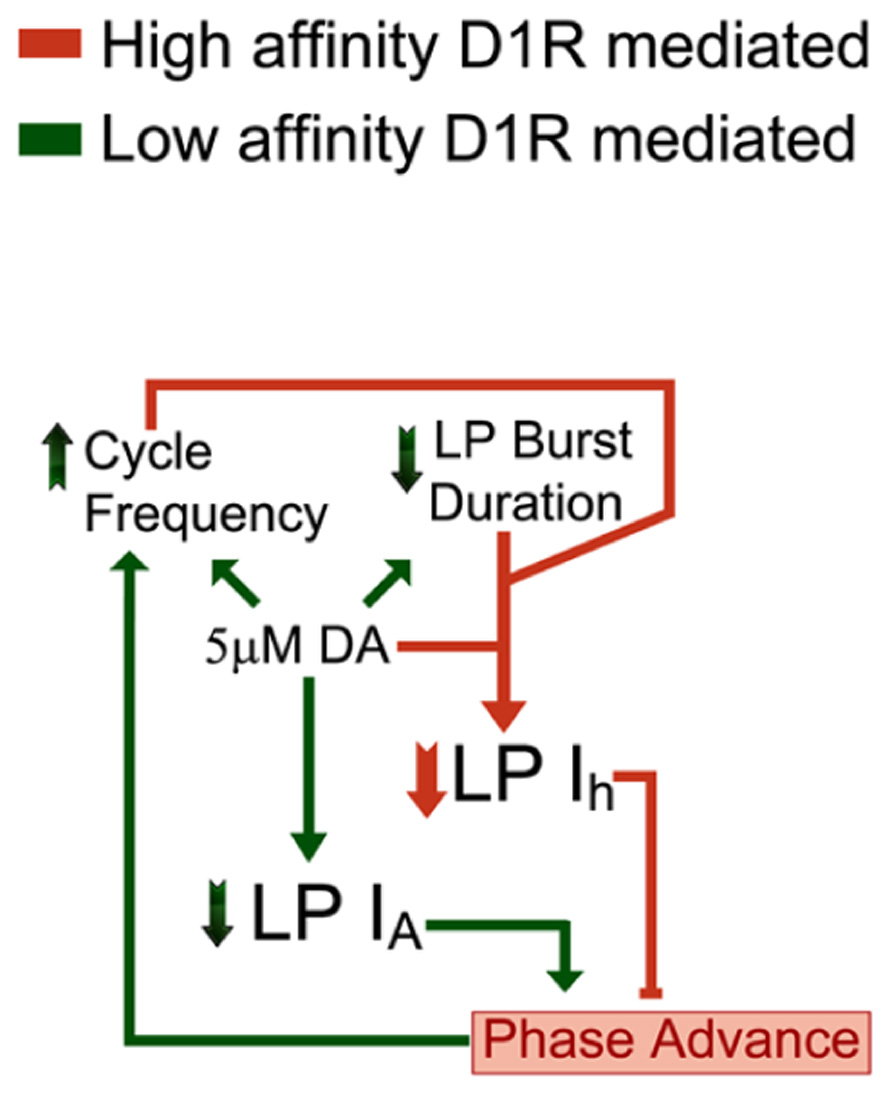
FIGURE 7. DA (5 μM) activates a closed loop. DA (5 μM) acts at high affinity D1Rs to confer activity-dependence upon LP Ih (DAD regulation, coral). In addition, 5 μM DA acts at low affinity D1Rs to modulate LP IA and circuit output (DA modulation, green). Note that the D1R high affinity (coral) and low affinity (green) effects each provide an arm of a closed loop. DA (5 μM) initially increases network cycle frequency, decreases LP burst duration and advances LP activity phase. The latter is due to a decrease in LP IA. The phase advance not only prevents LP network function, which is to act as a brake on increasing cycle frequencies, but may even drive further increases in cycle frequency. DAD regulation permits these DA-induced changes in activity to subsequently produce a compensatory decrease in LP Ih Gmax. This restores the LP IA:Ih conductance ratio and the timing of LP activity phase at the increased cycle frequency and decreased burst duration. This will stabilize circuit output by limiting further increases in cycle frequency.
DA Simultaneously Generates Flexibility and Stability by Activating High and Low Affinity D1Rs
Like most systems, DA transmission takes two forms in the stomatogastric nervous system, tonic, and phasic. DA neurons in the commissural ganglia project to the STG and release DA into open synapses; DA then diffuses to its sites of action before re-uptake (Oginsky et al., 2010). To the best of our knowledge, DA levels have not been measured in the STG, but in other systems that use volume transmission, DA is tonically present at ~nM levels (range: 0.1–100 nM) and can transiently increase to ~μM levels (range: 0.1–100 μM) near the release sites of bursting DA neurons (Zoli et al., 1998; Schultz, 2007; Fuxe et al., 2010). In addition, the STG is located in a blood vessel and is bathed by neurohormonal DA (Sullivan et al., 1977; Marder and Bucher, 2007). Generally speaking, high affinity receptors respond to ~nM DA (tonic) and low affinity receptors respond to ~μM DA (phasic). We have previously shown that LP possesses both high and low affinity D1Rs that mediate different effects on IA. High affinity receptors were activated by a tonic 1 h application of 0.5 nM but not 0.05 nM DA and produced a persistent (i.e., non-reversible) increase in LP IA through a translation-dependent mechanism (Rodgers et al., 2011b,in press). On the other hand, low affinity D1Rs responded to bath application of ~μM DA and immediately and reversibly decreased LP IA by altering its biophysical properties (Zhang et al., 2010). In this study we showed that high affinity D1Rs do not simply act through slow mechanisms (hours) to produce persistent changes in ionic currents, but can also rapidly (seconds to minutes) confer activity-dependence upon an ionic conductance to generate a feedback loop.
Concomitant stimulation of both low and high affinity LP D1Rs activates a closed loop that maintains neuronal activity phase while other aspects of neuronal output are altered (Figure 7). A 5 μM but not 5 nM DA application alters pyloric network activity (Rodgers et al., 2011a); therefore, DA acts at low affinity receptors to modulate circuit output. At least three key aspects of pyloric network output are modulated by DA (Rodgers et al., 2011a): on average, cycle frequency is increased by ~10%, LP burst duration is decreased by 30% and LP firing phase is advanced by ~20%. The LP phase advance is largely due to a DA-induced reduction in LP IA (Harris-Warrick et al., 1995; Zhang et al., 2010). These alterations in network output disrupt LP network function (Johnson et al., 2011). Normally, LP acts through the LP–PD synapse to slow increasing cycle frequencies (Nadim et al., 1999; Weaver and Hooper, 2003; Mamiya and Nadim, 2004, 2005; Johnson et al., 2011). The timing of LP activity phase is critical for this function because, LP inhibition has different effects according to when it occurs during the pacemaker oscillation, and a phase advance can even increase cycle frequency (Thirumalai et al., 2006; Johnson et al., 2011). This creates a potential for spiraling changes in network output that would destabilize the system. However, besides eliciting these alterations in network activity, DA acts at high affinity D1Rs to permit AD regulation of LP Ih. This allows the DA-induced changes in cycle frequency and LP burst duration to subsequently elicit a reduction in LP Ih that exactly compensates for the modulatory decrease in LP IA to restore the timing of LP activity phase. Restoring LP firing phase re-establishes LP network function which is to slow increasing cycle frequency (Johnson et al., 2011). This could limit the DA-induced increase in cycle frequency driven by DA actions on the pacemaker and stabilize circuit performance at the increased network cycle frequency, decreased LP burst duration, and potentially altered LP input:output gain (Burdakov, 2005). It should also restore the initial phasing of rhythmic pyloric muscle contractions, but at an increased cycle frequency. Interestingly, burst duration and on/off-delays scale with cycle period in the natural population throughout development and over a wide range of temperatures (Bucher et al., 2005; Goaillard et al., 2009; Tang et al., 2010). Thus, the closed loop uncovered here may be part of a more extensive control system that synchronizes these network characteristics over multiple time scales and through multiple mechanisms.
Dopaminergic Tone Might Maintain the IA:Ih Ratio During Non-Dopaminergic Perturbations to Activity
Landmark studies from the Marder group demonstrated equivalent neuronal and network firing patterns can arise from different sets of intrinsic and synaptic conductances (Golowasch et al., 1999a,b; Prinz et al., 2004b; Schulz et al., 2006, 2007). This work led to the idea that conductances co-vary over time in order to maintain a particular activity feature, an idea that was supported by existing ion channel overexpression studies (MacLean et al., 2003, 2005). These findings were unexpected and caused the Selverston group to ask: can the output of a network made up of disparate components be robust to perturbation (Szucs and Selverston, 2006)? Within a population, peak PD IA and PD Ih each varies by >3-fold across individuals; but, all individuals maintain the same PD IA:Ih ratio (Temporal et al., 2012). Selverston’s group reasoned that if PD IA were blocked with 4-AP in multiple preparations, then PD Ih would no longer be balanced in any preparation, and the variable amounts of PD Ih in each preparation would be revealed in distinct PD activity patterns (Szucs and Selverston, 2006; Nowotny et al., 2007). To their surprise, all blocked neurons produced similar activity patterns, suggesting either that the pyloric network is not made up of disparate components in each individual or that rapid compensatory mechanisms must exist to maintain activity. Our findings suggest the latter may be true: modulator-enabled, AD feedback loops could have produced compensatory changes in Ih Gmax that maintained activity in the Selverston group’s experiments. Indeed, modulatory inputs were intact in the latter studies (Szucs and Selverston, 2006), and 4-AP significantly alters pyloric cycle period and neuronal burst durations (Tierney and Harris-Warrick, 1992). Together, the data imply that modulatory tone could enable multiple AD feedback loops that maintain conductance ratios and their activity correlates under a variety of conditions.
Phase Maintenance
Both intrinsic and synaptic mechanisms can operate over different time scales to maintain pyloric neuron phase relationships when cycle frequency varies. Synaptic depression rapidly promotes phase maintenance by proportionately delaying neuronal firing as synapses increasingly recover from depression with longer cycle periods (Nadim et al., 1999, 2003; Manor et al., 2003). DA can modulate synaptic dynamics to promote phase maintenance: 10 μM DA decreased the time constants of short-term depression and its recovery at the PD–LP graded synapse, thus contributing to phase maintenance with changing network frequency (Kvarta et al., 2012). It is also worth noting that PY inhibition onto LP plays an important role in determining LP off-phase and this impact is enhanced in DA (Johnson et al., 1993, 1995), contributing to the shortening and stabilization of LP activity phase (Johnson et al., 2011). Fast intrinsic conductances, including IA, can act in conjunction with synaptic mechanisms to promote phase maintenance in pyloric neurons (Bose et al., 2004; Greenberg and Manor, 2005; Rabbah and Nadim, 2005). Slower processes can also play a role in pyloric neuron phase maintenance. In a combined physiological and computational study on the spiny lobster, Hooper et al. (2009) demonstrated that a conductance with slow activating and inactivating kinetics (seconds to minutes) could explain adjustment of PIR and phase maintenance in PY neurons in the presence of altered cycle period. Goaillard et al. (2010) showed the crab LP neuron possessed a similar mechanism. Neither of these studies identified the slow conductance. Ih was considered, but blocking Ih did not terminate the mechanism. The authors suggested the conductance could be an unidentified slow potassium or calcium conductance, deinactivation of a fast sodium current, a pump current or a combination of opposing currents with fast kinetics. Our research extends these previous findings by revealing the existence of a DA-enabled mechanism(s) for phase maintenance that involves preserving the IA:Ih ratio. DAD regulation of Ih may contribute to phase maintenance in other rhythmically active systems where phase relationships are maintained amidst changes in cycle frequency (Dicaprio et al., 1997; Jacobson et al., 2009).
Mechanism of DAD Regulation of LP Ih
DAD regulation of LP Ih Gmax integrates information on multiple aspects of activity. The neurons under study exhibit slow membrane potential oscillations (~20 mV at 1–2 Hz) and action potentials riding on the depolarized plateau of each oscillation. DAD regulation integrated information on cycle period and burst duration, as well as spike activity. Integration may be an epi-phenomenon created by voltage clamp measures of the entire population of HCN channels, and it is possible that distinct subcellular populations of HCN channels are differentially regulated by different types of activity.
It is not clear if DAD regulation of LP Ih represents a single integrator that is influenced by multiple types of activity; or, if multiple molecular integrators exist, each of which is sensitive to a distinct aspect of activity. AD mechanisms that regulate Ih density could rely on both Ca2+ release and Ca2+ entry. It is tempting to speculate that the mechanism(s) that is sensitive to burst duration and cycle frequency senses Ca2+ release from stores while the mechanism(s) that is sensitive to spiking senses Ca2+ entry through voltage-gated calcium channels. It was previously noted that Ca2+ release from stores can regulate Ih density in hippocampal neurons (Narayanan et al., 2010), and that in the pyloric AB neuron, Ca2+ release oscillates with oscillations in membrane potential (Kadiri et al., 2011). Thus, changes in cycle frequency and burst duration could alter steady-state Ca2+ contributed by store release. In addition, Ca2+ entry through glutamate receptors can regulate surface expression of HCN channels over minutes in cultured hippocampal neurons (Noam et al., 2010). Perhaps this mechanism may be generalized to Ca2+ entry through other types of channels, such as high threshold voltage-gated Ca2+ channels that open maximally during spike activity. In this case, spike frequency could also influence steady-state Ca2+. Previous studies show that micromolar DA can enhance LP voltage-gated Ca2+ currents (Johnson et al., 2003; Kloppenburg et al., 2007), and in the AB neuron micromolar DA can act on IP3 receptors to increase release from stores (Kadiri et al., 2011). Since higher concentrations of DA can alter Ca2+ dynamics, these data suggest that DAD regulation of LP Ih may vary according to DA concentrations as well as activity patterns.
The mechanisms by which high affinity D1Rs permit AD regulation of LP Ih Gmax are not known. Traditionally, D1Rs are thought to act through Gαs to regulate adenylyl cyclase activity and thereby cAMP levels, which in turn regulate PKA. D1R induced increases in PKA activity can regulate surface expression of cortical neuron glutamate receptors (Sun et al., 2005). Thus, in one scenario, a cAMP-PKA signaling pathway may modulate AD surface expression of HCN channels. Indeed such a pathway can regulate AD Kv4 channel trafficking in hippocampal neurons (Hammond et al., 2008). One of the invertebrate adenylyl cyclases, rutabaga, is a known coincidence detector that can be influenced by both Gαs and Ca2+ (Tomchik and Davis, 2009; Gervasi et al., 2010), and rutabaga could underpin DA’s permissive effect.
Conflict of Interest Statement
The authors declare that the research was conducted in the absence of any commercial or financial relationships that could be construed as a potential conflict of interest.
Acknowledgments
The authors thank Tim Dever for excellent technical assistance and animal care. We are also grateful to Dr. Akira Sakurai for reading an earlier version of the manuscript. This work was supported by NIH DA024039 to Deborah J. Baro and NIH NS054911 to Astrid A. Prinz.
References
Ballo, A. W., Nadim, F., and Bucher, D. (2012). Dopamine modulation of Ih improves temporal fidelity of spike propagation in an unmyelinated axon. J. Neurosci. 32, 5106–5119. doi: 10.1523/JNEUROSCI.6320-11.2012
Baro, D. J., Ayali, A., French, L., Scholz, N. L., Labenia, J., Lanning, C. C., et al. (2000). Molecular underpinnings of motor pattern generation: differential targeting of shal and shaker in the pyloric motor system. J. Neurosci. 20, 6619–6630.
Baro, D. J., Levini, R. M., Kim, M. T., Willms, A. R., Lanning, C. C., Rodriguez, H. E., et al. (1997). Quantitative single-cell-reverse transcription-PCR demon-strates that A-current magnitude varies as a linear function of shal gene expression in identified stomatogastric neurons. J. Neurosci. 17, 6597–6610.
Bose, A., Manor, Y., and Nadim, F. (2004). The activity phase of postsynaptic neurons in a simplified rhythmic network. J. Comput. Neurosci. 17, 245–261. doi: 10.1023/B:JCNS.0000037685.71759.1a
Bucher, D., Prinz, A. A., and Marder, E. (2005). Animal-to-animal variability in motor pattern production in adults and during growth. J. Neurosci. 25, 1611–1619. doi: 10.1523/JNEUROSCI.3679-04.2005
Burdakov, D. (2005). Gain control by concerted changes in I(A) and I(H) conductances. Neural Comput. 17, 991–995. doi: 10.1162/0899766053491841
Dicaprio, R., Jordan, G., and Hampton, T. (1997). Maintenance of motor pattern phase relationships in the ventilatory system of the crab. J. Exp. Biol. 200, 963–974.
Dorval, A. D., Christini, D. J., and White, J. A. (2001). Real-time linux dynamic clamp: a fast and flexible way to construct virtual ion channels in living cells. Ann. Biomed. Eng. 29, 897–907. doi: 10.1114/1.1408929
Fuxe, K., Dahlstrom, A. B., Jonsson, G., Marcellino, D., Guescini, M., Dam, M., et al. (2010). The discovery of central monoamine neurons gave volume transmission to the wired brain. Prog. Neurobiol. 90, 82–100. doi: 10.1016/j.pneurobio.2009.10.012
Gervasi, N., Tchenio, P., and Preat, T. (2010). PKA dynamics in a Drosophila learning center: coincidence detection by rutabaga adenylyl cyclase and spatial regulation by dunce phosphodiesterase. Neuron 65, 516–529. doi: 10.1016/j.neuron.2010.01.014
Goaillard, J. M., Taylor, A. L., Pulver, S. R., and Marder, E. (2010). Slow and persistent postinhibitory rebound acts as an intrinsic short-term memory mechanism. J. Neurosci. 30, 4687–4692. doi: 10.1523/JNEUROSCI.2998-09.2010
Goaillard, J. M., Taylor, A. L., Schulz, D. J., and Marder, E. (2009). Functional consequences of animal-to-animal variation in circuit parameters. Nat. Neurosci. 12, 1424–1430. doi: 10.1038/nn.2404
Goeritz, M. L., Ouyang, Q., and Harris-Warrick, R. M. (2011). Localization and function of Ih channels in a small neural network. J. Neurophysiol. 106, 44–58. doi: 10.1152/jn.00897.2010
Golowasch, J., Abbott, L. F., and Marder, E. (1999a). Activity-dependent regulation of potassium currents in an identified neuron of the stomatogastric ganglion of the crab cancer borealis. J. Neurosci. 19, RC33.
Golowasch, J., Casey, M., Abbott, L. F., and Marder, E. (1999b). Network stability from activity-dependent regulation of neuronal conductances. Neural Comput. 11, 1079–1096. doi: 10.1162/089976699300016359
Gorbunova, Y. V., and Spitzer, N. C. (2002). Dynamic interactions of cyclic AMP transients and spontaneous Ca(2+) spikes. Nature 418, 93–96. doi: 10.1038/nature00835
Greenberg, I., and Manor, Y. (2005). Synaptic depression in conjunction with A-current channels promote phase constancy in a rhythmic network. J. Neurophysiol. 93, 656–677. doi: 10.1152/jn.00640.2004
Gunay, C., and Prinz, A. A. (2010). Model calcium sensors for network homeostasis: sensor and readout parameter analysis from a database of model neuronal networks. J. Neurosci. 30, 1686–1698. doi: 10.1523/JNEUROSCI.3098-09.2010
Hammond, R. S., Lin, L., Sidorov, M. S., Wikenheiser, A. M., and Hoffman, D. A. (2008). Protein kinase A mediates activity-dependent Kv4.2 channel trafficking. J. Neurosci. 28, 7513–7519. doi: 10.1523/JNEUROSCI.1951-08.2008
Harris-Warrick, R. M., Coniglio, L. M., Levini, R. M., Gueron, S., and Guckenheimer, J. (1995). Dopamine modulation of two subthreshold currents produces phase shifts in activity of an identified motoneuron. J. Neurophysiol. 74, 1404–1420.
Harris-Warrick, R. M., Johnson, B. R., Peck, J. H., Kloppenburg, P., Ayali, A., and Skarbinski, J. (1998). Distributed effects of dopamine modulation in the crustacean pyloric network. Ann. N.Y. Acad. Sci. 860, 155–167. doi: 10.1111/j.1749-6632.1998.tb09046.x
Heitler, W. J. (2009). Practical tools for analysing rhythmic neural activity. J. Neurosci. Methods 185, 151–164. doi: 10.1016/j.jneumeth.2009.09.009
Hooper, S. L., Buchman, E., Weaver, A. L., Thuma, J. B., and Hobbs, K. H. (2009). Slow conductances could underlie intrinsic phase-maintaining properties of isolated lobster (Panulirus interruptus) pyloric neurons. J. Neurosci. 29, 1834–1845. doi: 10.1523/JNEUROSCI.5392-08.2009
Hudson, A. E., and Prinz, A. A. (2010). Conductance ratios and cellular identity. PLoS Comput. Biol. 6:e1000838. doi: 10.1371/journal.pcbi.1000838
Jacobson, G. A., Lev, I., Yarom, Y., and Cohen, D. (2009). Invariant phase structure of olivo-cerebellar oscillations and its putative role in temporal pattern generation. Proc. Natl. Acad. Sci. U.S.A. 106, 3579–3584. doi: 10.1073/pnas.0806661106
Johnson, B. R., Brown, J. M., Kvarta, M. D., Lu, J. Y., Schneider, L. R., Nadim, F., et al. (2011). Differential modulation of synaptic strength and timing regulate synaptic efficacy in a motor network. J. Neurophysiol. 105, 293–304. doi: 10.1152/jn.00809.2010
Johnson, B. R., and Harris-Warrick, R. M. (1990). Aminergic modulation of graded synaptic transmission in the lobster stomatogastric ganglion. J. Neurosci. 10, 2066–2076.
Johnson, B. R., Kloppenburg, P., and Harris-Warrick, R. M. (2003). Dopamine modulation of calcium currents in pyloric neurons of the lobster stomatogastric ganglion. J. Neurophysiol. 90, 631–643. doi: 10.1152/jn.00037.2003
Johnson, B. R., Peck, J. H., and Harris-Warrick, R. M. (1991). Temperature sensitivity of graded synaptic transmission in the lobster stomatogastric ganglion. J. Exp. Biol. 156, 267–285.
Johnson, B. R., Peck, J. H., and Harris-Warrick, R. M. (1993). Dopamine induces sign reversal at mixed chemical–electrical synapses. Brain Res. 625, 159–164. doi: 10.1016/0006-8993(93)90149-H
Johnson, B. R., Peck, J. H., and Harris-Warrick, R. M. (1995). Distributed amine modulation of graded chemical transmission in the pyloric network of the lobster stomatogastric ganglion. J. Neurophysiol. 74, 437–452.
Kadiri, L. R., Kwan, A. C., Webb, W. W., and Harris-Warrick, R. M. (2011). Dopamine-induced oscillations of the pyloric pacemaker neuron rely on release of calcium from intracellular stores. J. Neurophysiol. 106, 1288–1298. doi: 10.1152/jn.00456.2011
Kiehn, O., and Harris-Warrick, R. M. (1992). 5-HT modulation of hyperpolarization-activated inward current and calcium-dependent outward current in a crustacean motor neuron. J. Neurophysiol. 68, 496–508.
Kloppenburg, P., Zipfel, W. R., Webb, W. W., and Harris-Warrick, R. M. (2007). Heterogeneous effects of dopamine on highly localized, voltage-induced Ca2+ accumulation in identified motoneurons. J. Neurophysiol. 98, 2910–2917. doi: 10.1152/jn.00660.2007
Kvarta, M. D., Harris-Warrick, R. M., and Johnson, B. R. (2012). Neuromodulator-evoked synaptic metaplasticity within a central pattern generator network. J. Neurophysiol. 108, 2846–2856. doi: 10.1152/jn.00586.2012
Linsdell, P., and Moody, W. J. (1994). Na+ channel mis-expression accelerates K+ channel development in embryonic Xenopus laevis skeletal muscle. J. Physiol. 480(Pt 3), 405–410.
MacLean, J. N., Zhang, Y., Goeritz, M. L., Casey, R., Oliva, R., Guckenheimer, J., et al. (2005). Activity-independent coregulation of IA and Ih in rhythmically active neurons. J. Neurophysiol. 94, 3601–3617. doi: 10.1152/jn.00281.2005
MacLean, J. N., Zhang, Y., Johnson, B. R., and Harris-Warrick, R. M. (2003). Activity-independent homeostasis in rhythmically active neurons. Neuron 37, 109–120. doi: 10.1016/S0896-6273(02)01104-2
Mamiya, A., and Nadim, F. (2004). Dynamic interaction of oscillatory neurons coupled with reciprocally inhibitory synapses acts to stabilize the rhythm period. J. Neurosci. 24, 5140–5150. doi: 10.1523/JNEUROSCI.0482-04.2004
Mamiya, A., and Nadim, F. (2005). Target-specific short-term dynamics are important for the function of synapses in an oscillatory neural network. J. Neurophysiol. 94, 2590–2602. doi: 10.1152/jn.00110.2005
Manor, Y., Bose, A., Booth, V., and Nadim, F. (2003). Contribution of synaptic depression to phase maintenance in a model rhythmic network. J. Neurophysiol. 90, 3513–3528. doi: 10.1152/jn.00411.2003
Marder, E., and Bucher, D. (2007). Understanding circuit dynamics using the stomatogastric nervous system of lobsters and crabs. Annu. Rev. Physiol. 69, 291–316. doi: 10.1146/annurev.physiol.69.031905.161516
Marder, E., and Goaillard, J. M. (2006). Variability, compensation and homeostasis in neuron and network function. Nat. Rev. Neurosci. 7, 563–574. doi: 10.1038/nrn1949
Nadim, F., Boothe, V., Bose, A., and Manor, Y. (2003). Short-term synaptic dynamics promote phase maintenance in multi-phasic rhythms. Neurocomputing 52–54, 79–87. doi: 10.1016/S0925-2312(02)00811-1
Nadim, F., Manor, Y., Kopell, N., and Marder, E. (1999). Synaptic depression creates a switch that controls the frequency of an oscillatory circuit. Proc. Natl. Acad. Sci. U.S.A. 96, 8206–8211. doi: 10.1073/pnas.96.14.8206
Narayanan, R., Dougherty, K. J., and Johnston, D. (2010). Calcium store depletion induces persistent perisomatic increases in the functional density of h channels in hippocampal pyramidal neurons. Neuron 68, 921–935. doi: 10.1016/j.neuron.2010.11.033
Noam, Y., Zha, Q., Phan, L., Wu, R. L., Chetkovich, D. M., Wadman, W. J., et al. (2010). Trafficking and surface expression of hyperpolarization-activated cyclic nucleotide-gated channels in hippocampal neurons. J. Biol. Chem. 285, 14724–14736. doi: 10.1074/jbc.M109.070391
Nowotny, T., Szucs, A., Levi, R., and Selverston, A. I. (2007). Models wagging the dog: are circuits constructed with disparate parameters? Neural Comput. 19, 1985–2003. doi: 10.1162/neco.2007.19.8.1985
Oginsky, M. F., Rodgers, E. W., Clark, M. C., Simmons, R., Krenz, W. D., and Baro, D. J. (2010). D(2) receptors receive paracrine neurotransmission and are consistently targeted to a subset of synaptic structures in an identified neuron of the crustacean stomatogastric nervous system. J. Comp. Neurol. 518, 255–276. doi: 10.1002/cne.22225
Panchin, Y. V., Arshavsky, Y. I., Selverston, A., and Cleland, T. A. (1993). Lobster stomatogastric neurons in primary culture. I. Basic characteristics. J. Neurophysiol. 69, 1976–1992.
Peng, I. F., and Wu, C. F. (2007). Drosophila cacophony channels: a major mediator of neuronal Ca2+ currents and a trigger for K+ channel homeostatic regulation. J. Neurosci. 27, 1072–1081. doi: 10.1523/JNEUROSCI.4746-06.2007
Prinz, A. A., Abbott, L. F., and Marder, E. (2004a). The dynamic clamp comes of age. Trends Neurosci. 27, 218–224. doi: 10.1016/j.tins.2004.02.004
Prinz, A. A., Bucher, D., and Marder, E. (2004b). Similar network activity from disparate circuit parameters. Nat. Neurosci. 7, 1345–1352. doi: 10.1038/nn1352
Rabbah, P., and Nadim, F. (2005). Synaptic dynamics do not determine proper phase of activity in a central pattern generator. J. Neurosci. 25, 11269–11278. doi: 10.1523/JNEUROSCI.3284-05.2005
Rodgers, E. W., Fu, J. J., Krenz, W. D., and Baro, D. J. (2011a). Tonic nanomolar dopamine enables an activity-dependent phase recovery mechanism that persistently alters the maximal conductance of the hyperpolarization-activated current in a rhythmically active neuron. J. Neurosci. 31, 16387–16397. doi: 10.1523/JNEUROSCI.3770-11.2011
Rodgers, E. W., Krenz, W. D., and Baro, D. J. (2011b). Tonic dopamine induces persistent changes in the transient potassium current through translational regulation. J. Neurosci. 31, 13046–13056. doi: 10.1523/JNEUROSCI.2194-11.2011
Rodgers, E. W., Krenz, W. C., Jiang, X., Li, L., and Baro, D. J. (in press). Dopaminergic tone regulates transient potassium current maximal conductance through a translational mechanism requiring D1Rs, cAMP/PKA, Erk and mTOR. BMC neuroscience.
Schultz, W. (2007). Multiple dopamine functions at different time courses. Annu. Rev. Neurosci. 30, 259–288. doi: 10.1146/annurev.neuro.28.061604.135722
Schulz, D. J., Goaillard, J. M., and Marder, E. (2006). Variable channel expression in identified single and electrically coupled neurons in different animals. Nat. Neurosci. 9, 356–362. doi: 10.1038/nn1639
Schulz, D. J., Goaillard, J. M., and Marder, E. E. (2007). Quantitative expression profiling of identified neurons reveals cell-specific constraints on highly variable levels of gene expression. Proc. Natl. Acad. Sci. U.S.A. 104, 13187–13191. doi: 10.1073/pnas.0705827104
Sharp, A. A., O’Neil, M. B., Abbott, L. F., and Marder, E. (1993a). The dynamic clamp: artificial conductances in biological neurons. Trends Neurosci. 16, 389–394. doi: 10.1016/0166-2236(93)90004-6
Sharp, A. A., O’Neil, M. B., Abbott, L. F., and Marder, E. (1993b). Dynamic clamp: computer-generated conductances in real neurons. J. Neurophysiol. 69, 992–995.
Soofi, W., Archila, S., and Prinz, A. A. (2012). Co-variation of ionic conductances supports phase maintenance in stomatogastric neurons. J. Comput. Neurosci. 33, 77–95. doi: 10.1007/s10827-011-0375-3
Sullivan, R. E., Friend, B. J., and Barker, D. L. (1977). Structure and function of spiny lobster ligamental nerve plexuses: evidence for synthesis, storage, and secretion of biogenic amines. J. Neurobiol. 8, 581–605. doi: 10.1002/neu.480080607
Sun, X., Zhao, Y., and Wolf, M. E. (2005). Dopamine receptor stimulation modulates AMPA receptor synaptic insertion in prefrontal cortex neurons. J. Neurosci. 25, 7342–7351. doi: 10.1523/JNEUROSCI.4603-04.2005
Szucs, A., and Selverston, A. I. (2006). Consistent dynamics suggests tight regulation of biophysical parameters in a small network of bursting neurons. J. Neurobiol. 66, 1584–1601. doi: 10.1002/neu.20325
Tang, L. S., Goeritz, M. L., Caplan, J. S., Taylor, A. L., Fisek, M., and Marder, E. (2010). Precise temperature compensation of phase in a rhythmic motor pattern. PLoS Biol. 8:e1000469. doi: 10.1371/journal.pbio.1000469
Temporal, S., Desai, M., Khorkova, O., Varghese, G., Dai, A., Schulz, D. J., et al. (2012). Neuromodulation independently determines correlated channel expression and conductance levels in motor neurons of the stomatogastric ganglion. J. Neurophysiol. 107, 718–727. doi: 10.1152/jn.00622.2011
Thirumalai, V., Prinz, A. A., Johnson, C. D., and Marder, E. (2006). Red pigment concentrating hormone strongly enhances the strength of the feedback to the pyloric rhythm oscillator but has little effect on pyloric rhythm period. J. Neurophysiol. 95, 1762–1770. doi: 10.1152/jn.00764.2005
Tierney, A. J., and Harris-Warrick, R. M. (1992). Physiological role of the transient potassium current in the pyloric circuit of the lobster stomatogastric ganglion. J. Neurophysiol. 67, 599–609.
Tomchik, S. M., and Davis, R. L. (2009). Dynamics of learning-related cAMP signaling and stimulus integration in the Drosophila olfactory pathway. Neuron 64, 510–521. doi: 10.1016/j.neuron.2009.09.029
Weaver, A. L., and Hooper, S. L. (2003). Follower neurons in lobster (Panulirus interruptus) pyloric network regulate pacemaker period in complementary ways. J. Neurophysiol. 89, 1327–1338. doi: 10.1152/jn.00704.2002
Zhang, H., Rodgers, E. W., Krenz, W. D., Clark, M. C., and Baro, D. J. (2010). Cell specific dopamine modulation of the transient potassium current in the pyloric network by the canonical D1 receptor signal transduction cascade. J. Neurophysiol. 104, 873–884. doi: 10.1152/jn.00195.2010
Keywords: activity-dependent intrinsic plasticity, metaplasticity, metamodulation, HCN channel, stomatogastric, pyloric network
Citation: Krenz W-DC, Hooper RM, Parker AR, Prinz AA and Baro DJ (2013) Activation of high and low affinity dopamine receptors generates a closed loop that maintains a conductance ratio and its activity correlate. Front. Neural Circuits 7:169. doi: 10.3389/fncir.2013.00169
Received: 14 August 2013; Accepted: 27 September 2013;
Published online: 22 October 2013.
Edited by:
Allen Selverston, University of California at San Diego, USAReviewed by:
Wolfgang Stein, Illinois State University, USABruce R. Johnson, Cornell University, USA
Copyright © 2013 Krenz, Hooper, Parker, Prinz and Baro. This is an open-access article distributed under the terms of the Creative Commons Attribution License (CC BY). The use, distribution or reproduction in other forums is permitted, provided the original author(s) or licensor are credited and that the original publication in this journal is cited, in accordance with accepted academic practice. No use, distribution or reproduction is permitted which does not comply with these terms.
*Correspondence: Deborah J. Baro, Department of Biology, Georgia State University, P.O. Box 4010, Atlanta, GA 30302-4010, USA e-mail: dbaro@gsu.edu