Dynamic Analysis of the Conditional Oscillator Underlying Slow Waves in Thalamocortical Neurons
 François David
 Vincenzo Crunelli
 Nathalie Leresche
 Régis C. Lambert
- 1Neuroscience Division, School of Biosciences, Cardiff University, Cardiff, UK
- 2Lyon Neuroscience Research Center, Centre National de la Recherche Scientifique UMR 5292, Lyon, France
- 3Lyon Neuroscience Research Center, Institut National de la Santé et de la Recherche Médicale U1028, Lyon, France
- 4Faculté de Médecine, Université Claude Bernard, Lyon, France
- 5Sorbonne Universités, UPMC Université Paris 06, UM 119, Neuroscience Paris Seine, Paris, France
- 6Centre National de la Recherche Scientifique, UMR 8246, Neuroscience Paris Seine, Paris, France
- 7Institut National de la Santé et de la Recherche Médicale, U1130, Neuroscience Paris Seine, Paris, France
- 8Department of Physiology and Biochemistry, University of Malta, Msida, Malta
During non-REM sleep the EEG shows characteristics waves that are generated by the dynamic interactions between cortical and thalamic oscillators. In thalamic neurons, low-threshold T-type Ca2+ channels play a pivotal role in almost every type of neuronal oscillations, including slow (< 1 Hz) waves, sleep spindles and delta waves. The transient opening of T channels gives rise to the low threshold spikes (LTSs), and associated high frequency bursts of action potentials, that are characteristically present during sleep spindles and delta waves, whereas the persistent opening of a small fraction of T channels, (i.e., ITwindow) is responsible for the membrane potential bistability underlying sleep slow oscillations. Surprisingly thalamocortical (TC) neurons express a very high density of T channels that largely exceed the amount required to generate LTSs and therefore, to support certain, if not all, sleep oscillations. Here, to clarify the relationship between T current density and sleep oscillations, we systematically investigated the impact of the T conductance level on the intrinsic rhythmic activities generated in TC neurons, combining in vitro experiments and TC neuron simulation. Using bifurcation analysis, we provide insights into the dynamical processes taking place at the transition between slow and delta oscillations. Our results show that although stable delta oscillations can be evoked with minimal T conductance, the full range of slow oscillation patterns, including groups of delta oscillations separated by Up states (“grouped-delta slow waves”) requires a high density of T channels. Moreover, high levels of T conductance ensure the robustness of different types of slow oscillations.
Introduction
Sleep is characterized by the regular appearance of stereotyped sequences of EEG waves (Achermann and Borbely, 1997; Steriade, 2006; Crunelli et al., 2014) that are generated by the dynamic interaction between, and require the integrity of both cortical and thalamic oscillators (Steriade et al., 1993b; Crunelli and Hughes, 2010; David et al., 2013; Lemieux et al., 2014). The various cellular activities that are expressed by thalamocortical (TC) neurons during sleep oscillations tightly depend on the expression of low-threshold T-type Ca2+ channels (T channels; Leresche et al., 1991; Williams et al., 1997a; Crunelli et al., 2014). In fact, while these channels are almost fully inactivated in the range of membrane potentials associated to the wake state (but see Lambert et al., 2014), during non-REM sleep the progressive reduction in the depolarizing tone exerted by modulatory afferents onto both cortical and thalamic neurons (McCormick, 1992) allows T channel de-inactivation. As a consequence, the recruitment of de-inactivated T channels generates large inward currents resulting in transient depolarizations, called low-threshold spike (LTS). Thus, rhythmic LTSs, often crowned by bursts of high-frequency (>200 Hz) action potentials, are present in TC neurons during sleep spindles (7–14 Hz; Steriade et al., 1993b; Contreras and Steriade, 1996; David et al., 2013) and delta waves (0.5–4 Hz; Steriade et al., 1993a), and an LTS is almost invariably present at the start of each Up state of sleep slow oscillations in TC neurons (Figure 2A; Steriade et al., 1993a). Up states interspersed with periods of hyperpolarization (i.e., Down states) are the thalamic cellular hallmarks of sleep slow (< 1 Hz) waves (Figure 2A). Moreover, slow waves group together periods of sleep spindle and delta waves (Steriade, 2006), and these periods of delta oscillations that are visible during the Down state of the cellular counterpart of sleep slow waves in TC neurons have been named “grouped-delta slow waves” (Figure 2A; Steriade et al., 1993a; Hughes et al., 2002; Crunelli et al., 2015). Importantly, the interaction of the leak current with a small number of de-inactivated T channels opening with a low (but non-zero) probability in a narrow range of membrane potentials around −60 mV (i.e., ITwindow; Perez-Reyes, 2003; Dreyfus et al., 2010) is necessary for the generation of the membrane potential bistability that in TC neuron underlies the expression of the Up and Down state dynamics of sleep slow waves (Williams et al., 1997a; Toth et al., 1998; Hughes et al., 2002; Dreyfus et al., 2010).
Despite these key roles for T channels in sleep waves, it is still not known how the density of the T-type Ca2+ current (IT) affects each sleep oscillation. We previously demonstrated that robust LTSs can be evoked even when up to 70% of the T channel population is pharmacologically blocked (Dreyfus et al., 2010), suggesting that the high T channel expression that is present in TC neurons is not required for LTS generation during delta and slow oscillations. A high T channel expression in TC neurons, however, may be crucial to provide a level of ITwindow sufficient for the generation of the UP and Down state dynamics underlying slow oscillations in this type of thalamic neurons.
Here, using both in vitro experiments and TC neuron simulation, we systematically investigated the impact of the T conductance level on the various sleep oscillations intrinsically generated in TC neurons. Since IT can be controlled by various modulatory mechanisms (Lambert et al., 2006; Huc et al., 2009), we also investigated the effects of the ATP- and voltage-dependent regulation that potentiates the amplitude of IT in sensory TC neurons (Leresche et al., 2004). Our results show that although stable delta oscillations can be evoked with minimal T conductance, the full range of slow oscillation patterns, including simple Up and Down state transitions and the more complex “grouped-delta slow waves,” requires a high density of T channels or a potentiation of the current. Moreover, high levels of IT ensure the robustness of different slow wave oscillations over a larger range of leak conductance values.
Materials and Methods
Slice Preparation and Recordings
All procedures involving experimental animals were carried out in accordance with the UK Animals (Scientific Procedure) Act, 1986 and Cardiff Ethical Review Committee guidelines. Thalamic slices from a 3-year old cat were prepared as described previously (Hughes et al., 2002). Briefly, the cat was deeply anesthetized with a mixture of O2 and NO2(2:1) and 5% isoflurane, a wide craniotomy was performed to remove the brain and coronal slices of the thalamus (300–400 μm) that contain the dorsal lateral geniculate nucleus (LGN), were prepared and incubated at 35°C for 1 h before being maintained at room temperature. For recording, slices were perfused with a warmed (35 ± 1°C) continuously oxygenated (95% O2, 5% CO2) artificial CSF (ACSF) containing the following (in mM): 134 NaCl, 2 KCl, 1.25 KH2PO4, 1 MgSO4, 2 CaCl2, 16 NaHCO3, and 10 glucose.
Intracellular recordings, using the current clamp technique, were performed with standard-wall glass microelectrodes filled with 1 M potassium acetate (resistance, 80–120 MOhm) and connected to an Axoclamp-2A amplifier (Molecular Devices, Sunnyvale, CA) operating in bridge mode. Membrane potentials were digitized at 25 kHz using pClamp 9 (Molecular Devices). All recordings in the LGN were obtained from lamina A. Impaled cells were identified as TC neurons using established criteria (Pirchio et al., 1997; Turner et al., 1997). Sleep oscillations (including slow oscillations < 1 Hz) were induced by bath application of 50 μM (±)-1-aminocyclopentane-trans-1,3-dicarboxylic acid (trans-ACPD) followed by changes in steady-state current injections to allow neurons to express different slow oscillations, as previously shown (Hughes et al., 2004). SR95531 (gabazine, 10 μM), CGP54626 (20 μM), D-APV (50 μM), and CNQX (10 μM) were included in the bath solution to block both GABA-A and GABA-B as well as NMDA and AMPA glutamatergic synaptic inputs onto TC neurons, respectively. The T channel antagonist, TTA-P2 (kindly provided by Merck Inc, USA), was made up as a 10 mM stock solution in dimethylsulfoxide and kept at −20°C until use at a final concentration of 500 nM.
Simulations
All simulations were performed using the Matlab based programs (Mathworks, Natick, MA) or xppaut continuation application developed by Ermentrout (2002), and were run with a fixed time step of 0.02 ms using the Euler integration method. For simulations, the system was initiated at a point close to the Up state and the simulation results were analyzed only after stabilization of the simulation result (i.e., 50 s after the start of the simulation).
The single-compartment TC neuron model based on (Williams et al., 1997a; Hughes et al., 2002), expressed the essential physiological properties of these neurons (Figure 2). Ionic currents were simulated following Hodgkin-Huxley formalism.
The membrane potential (V) was described by the following equation:
where Cm (50 pF) is the membrane capacitance, ILeak is a potassium leak current (reversal potential = −95 mV), IT is the T current, ITP is the potentiated component of the T current, Ih is the hyperpolarization-activated nonspecific cationic current, ICAN is the Ca2+ activated non-selective cation current, INa is the voltage-dependent Na+ current and IKir is K+ current which includes the inward and delayed rectifier components. All current units are pA. Each current was simulated as follows:
IT:
where gT is the maximal conductance and ET = 180 mV is the reversal potential for Ca2+ flux. m and h are activation and inactivation variables, respectively, which are defined as follows:
ITP:
The potentiated component of the T current was modeled by multiplying the T current by a voltage-dependent coefficient P representing the fraction of phosphorylated (“potentiated”) channels (see Leresche et al., 2004 for details)
The voltage dependence of P is related to the steady-state inactivation of IT as followed (Figure 1A):
Ih:
gh = 8 nS
ICAN (Figure 1B):
gCAN = 12 nS
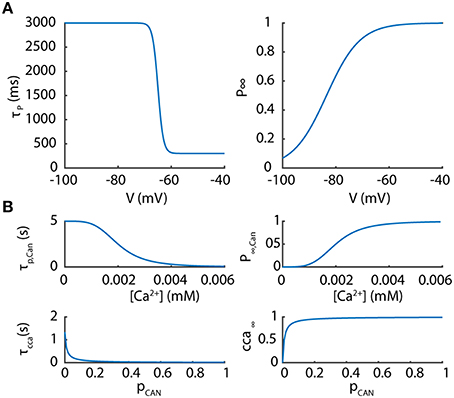
Figure 1. Parameters of the potentiated component of the T current and the Ca2+ activated non-selective cation current. (A) The potentiated component of the T current is controlled by a voltage-dependent coefficient P whose kinetics and steady values are presented according to membrane potentials. (B) The Ca2+ activated non-selective cation channel (CAN) is controlled by two variables pCANand cca depending upon Ca2+ concentration as plotted.
The calcium concentration ([Ca2+], in mM) is governed by the Ca2+ influx through T channels and a Ca2+ pump that controls intracellular Ca2+ levels.
where Area is 5000 μm2 and Depth is 0.1 μm.
INa:
IKir:
Data Analysis
Numerical integrations of the equations without gNa were performed with the software package XXPAUT (Ermentrout, 2002) to compute the periodic and steady-state solutions as a function of a given parameter (either gLeakor gT). The orbits (or periodic solutions) were detected by continuation of the equation system i.e., by computing the equilibrium solutions of the differential equations of the membrane potential and of other variables by the forward and backward temporal integration of these equations starting from the bifurcation fixed points with Xppaut (http://www.math.pitt.edu/~bard/xpp/xpp.html). The bifurcation parameter (gLeak) was varied on adaptative step size between 0.0001 and 0.1 nS and a discretization interval number for periodic orbit of 50. gNa was not used on a first approximation as this fast component easily prevents the system from converging to a stable orbit solution on a slow temporal scale. Stable solutions found without gNa were nonetheless confirmed or infirmed in the system that included gNa in the following steps of the analysis. For Up and Down state detection, the membrane potential was down-sampled at 1 kHz. Up states were defined as the proportion of simulated time where the membrane potential was >−65 mV. An Up state episode during slow oscillation was defined as a finite temporal continuous sequence during which the membrane potential remained >−65 mV for more than 500 ms. A Down state during slow oscillation was defined as a continuous temporal sequence where the membrane potential remained below the −65 mV threshold. The average membrane potential during an Up state was estimated by averaging all membrane potential values belonging to the Up state. The number of LTSs per slow oscillation was estimated as the number of Down states (which always precede a LTS) divided by the number of Up states. Slow oscillation frequency was estimated by averaging instantaneous frequencies measured for each slow oscillation cycle that was defined as starting and finishing with the LTS that is invariably present at the start of each Up state.
Results
In slices, TC neurons of sensory (lateral and medial geniculate, VB), motor (ventrolateral), and intralaminar (centrolateral) thalamic nuclei recorded in the presence of trans-ACPD exhibit stereotypical firing patterns and oscillations when submitted to steady hyperpolarizing currents of increasing amplitudes, as we previously described (Hughes et al., 2002; Zhu et al., 2006; Crunelli et al., 2012, 2014): from stable UP states, at times showing tonic firing, to slow Up and Down state oscillations, “grouped-delta slow waves” (i.e., slow oscillations with delta oscillations during the DOWN state), pure delta oscillations (1–4 Hz) and stable silent DOWN states (Figure 2A). These activities result from the interplay of intrinsic TC neuron conductances, including the T-type Ca2+ current (IT), with both its transient and window (ITwindow) components, the hyperpolarization activated Na+-K+ current (Ih), the Ca2+ activated non-selective cation current (ICAN), the inward rectifying potassium current (IKir) and the leak K+ current (Ileak) (Williams et al., 1997b; Hughes et al., 2002). In order to investigate how IT density affects the expression of these various oscillations, we compared in LGN TC neurons the range of injected steady hyperpolarizing current required to observe the distinct patterns of oscillations in control conditions and when IT was partially blocked by the selective antagonist TTA-P2 (Dreyfus et al., 2010). As shown in Figure 2B, the range of steady hyperpolarizing currents where slow oscillations could occur under control condition (355 ± 31 pA, n = 5) was clearly smaller in the presence of TTA-P2 (198 ± 28 pA, n = 5), indicating that a reduction in IT drastically weakens the generation of the slow oscillation.
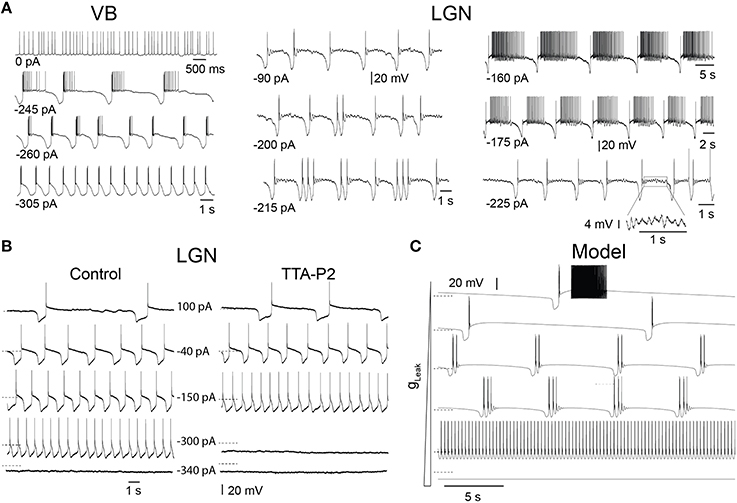
Figure 2. Different intrinsic oscillations in TC neurons and the effect of low doses of TTA-P2. (A) Typical membrane potential oscillations recorded in vitro in a ventrobasal nucleus (VB) neuron and two lateral geniculate nucleus (LGN) neurons in response to injection of steady hyperpolarizing current of increasing amplitude in the presence of trans-ACPD (adapted, with permission from Zhu et al. (2006). With little current injection, oscillations exhibited Up states associated to periods of tonic firing. Increasing the hyperpolarizing current induced slow oscillations comprising quiescent Up states followed by isolated LTSs or short episode of delta oscillations. In the VB neuron, continuous delta oscillation was observed with large current injection. Note also the periods of small amplitude, 5–7 Hz oscillations during Up states in the LGN neurons (see enlargement of a section of the bottom right trace). (B) Membrane potential oscillations recorded in vitro in a cat LGN TC neuron in the continuous presence of trans-ACPD before and during perfusion of the slice with the selective T channel blocker TTA-P2. The reduction in IT leads to a narrowing of the range of hyperpolarizing currents that triggers slow oscillations. (C) Membrane potential oscillations in a model of TC neuron. As observed in experiments, enhancing the hyperpolarizing drive by increasing gLeak values from 1.5 to 4.2 nS induced (from top to bottom) a transition from slowly alternating Up and Down states to “group-delta slow waves,” continuous delta oscillations and stable Down state. Dotted lines: −65 mV.
To thoroughly analyze the relationship between the T conductance and the ability of TC neuron to generate various sleep-related oscillations, we constructed a minimal single compartment model of a TC neuron that, upon gLeak variation, satisfactorily reproduced the activities observed in vitro in response to different steady hyperpolarizing currents (Figure 2C). Although not strictly equivalent, we chose to vary gLeak instead of simulating a hyperpolarizing current injection in order to mimic the natural changes observed across various sleep stages. Using the bifurcation analysis of this dynamic system (without INa to facilitate analysis, see Materials and Methods), we first calculated the extent of stable Up and Down states as a function of gT and gLeak. As shown in Figure 3A, increasing gT favors a stable Up state and larger gLeak values are required to switch the system to a stable DOWN state. As already mentioned, ITwindow contributes to the resting membrane potential around −60mV (Dreyfus et al., 2010). Since departure from the stable Up state occurs around this potential, a stronger ILeak is required to counteract the depolarizing drive resulting from a large gT and a consequently greater ITwindow. The graph also shows the presence of a region of membrane potential instability (delineated by the green and yellow dashed lines in Figure 3A) which occurs for a range of gLeak and gT values. This area of instability can be associated to particular oscillatory dynamics: slow oscillations and continuous delta oscillations (Figure 3B). As already observed experimentally (see Figure 9 in Soltesz and Crunelli, 1992), for some gT values where the system has a subcritical Hopf bifurcation point (Wang and Rinzel, 2002; Amarillo et al., 2015), oscillatory regimes and a stable Down state can theoretically occur in the same gLeak domain.
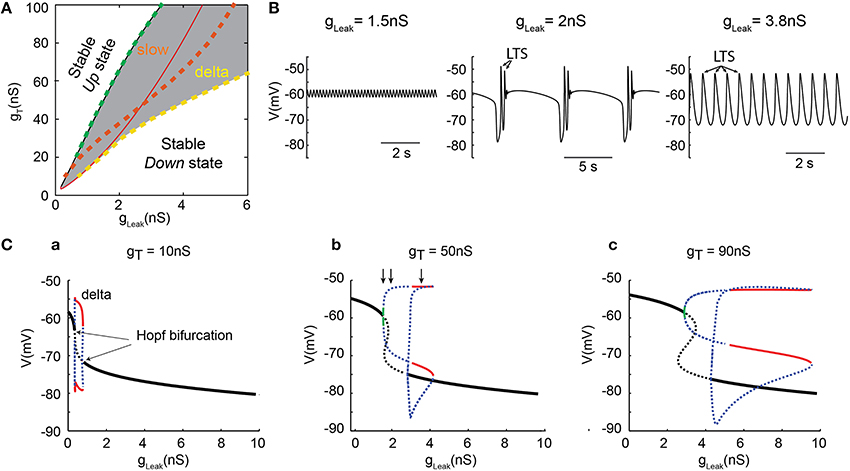
Figure 3. Dynamical analysis of different oscillations in the TC model cell. (A) Two-parameter bifurcation diagram indicating the lines of bifurcation of the system in theg, Leak− gT plane: (i) black line (almost overlapping with the dashed green line), the (supercritical Hopf) bifurcations from the stable Up states (left side) to oscillatory regimes (right side); (ii) dashed green line, frontier from the small amplitude 6 Hz oscillations to slow oscillations (right side); (iii) red line, the (subcritical Hopf) bifurcations from oscillatory regime (left side) to stable Down state (right side); iv) dashed orange line, bifurcations from the slow oscillation regime (left side) to continuous delta oscillation (right side); (v) dashed yellow line, limit of continuous delta oscillation. The gray zone indicates the domains of oscillations. (B) Example of small amplitude 6 Hz oscillations (left), slow oscillations (middle) and delta oscillations (right) observed in the model for gT = 50 nS with gLeak, = 1.5, 2, and 3.8 nS, respectively (corresponding to the three vertical arrows in Cb, respectively). Some of the LTSs are indicated by arrows. (C) One-parameter (gLeak) bifurcation diagrams for 3 increasing values of gT. Maximum and minimum membrane potential values (Vm) of small amplitude 6 Hz oscillations (green line), continuous delta oscillations (red lines), unstable orbits (blue dashed lines), and fixed-point equilibria (black lines) for stable Up and Down states. The dashed black lines indicate the unstable static equilibria. As gT increases, the range of gLeak that allows delta and slow oscillations is drastically increased. These analyses were performed without gNa to simplify computation of the bifurcation diagrams.
For a small gT (Figure 3Ca), the one-dimension bifurcation diagram of the model system as a function of gLeak remains simple with departure from the stable Up or Down states involving Hopf bifurcations. The stable periodic orbits correspond to pure delta oscillations (red lines in Figure 3Ca) that do not overlap with the regions where stable Up or Down states exist. This indicates that small gT values allow only 3 robust exclusive activity patterns in TC neurons: stable Up state, pure delta oscillations and stable Down state. However, when gT is increased, the bifurcation diagram becomes more complex (Figures 3Cb,c). At departure from the stable Up-state, small periodic orbits involving membrane potential oscillations of a few millivolts in amplitude (Figure 3B left) at 6 Hz (or higher frequency) are present for a very narrow range of gLeak (green line in Figures 3Cb,c). Such low-amplitude oscillations that occur close to −60 mV are consistently present in our simulations. Although these oscillations cannot be easily related to any physiologically defined membrane potential waveform of TC neurons, they resemble oscillations that occasionally appear in the Up state of slow oscillations in these neurons (Figure 2A; see Hughes et al., 2002; Zhu et al., 2006), and have been suggested to represent the intrinsic dynamic contribution of TC neurons to synaptically generated spindle oscillations (Wang, 1994). As gLeak further increases, unstable orbit cycles (blue dots in Figures 3Cb,c), corresponding to the complex “grouped-delta slow waves” (Figure 3B middle), occur for a large range of gLeak before the stable periodic orbits corresponding to pure delta oscillations (Figure 3B right) could develop (red lines in Figures 3Cb,c). Therefore, although delta oscillations are already present with small gT values, only a larger gT allows the occurrence of the full dynamics observed in TC neurons, including “grouped-delta slow waves.”
In order to more precisely describe the different slow wave patterns present for a given gT value, simulations were then run while systematically varying gT and gLeak (in the presence of gNa; Figure 4). Confirming the conclusions of the bifurcation diagrams, analysis of the membrane potential dynamics as a function of gLeak indicates that only delta oscillations occur for the smallest gT value (10 nS, Figures 4B,C). When gT is increased, in addition to continuous delta oscillations, slow oscillations with Up states that always start with a LTS are observed in a narrow range of gLeak (Figures 4A–C). For larger values of gT, “grouped-delta slow waves” are present and this firing pattern can be observed in a large range of gLeak values that expands as gTincreases (Figures 4A–C). Further quantification of the slow oscillation parameters indicates that for gT values associated with a robust slow oscillation pattern (gT≥ 30 nS), the ranges of Up-state duration and slow wave frequencies remain stable (Figures 5A,B), but the maximal value of the Up state membrane potential increases proportionally to gT (Figure 5C). These increasingly more depolarized Up states may result from both a stronger ITwindow directly linked to the larger gT and the consequently stronger ICAN due to the larger Ca2+ entry occurring during the T channel activation that generates the LTS at the beginning of each Up state.
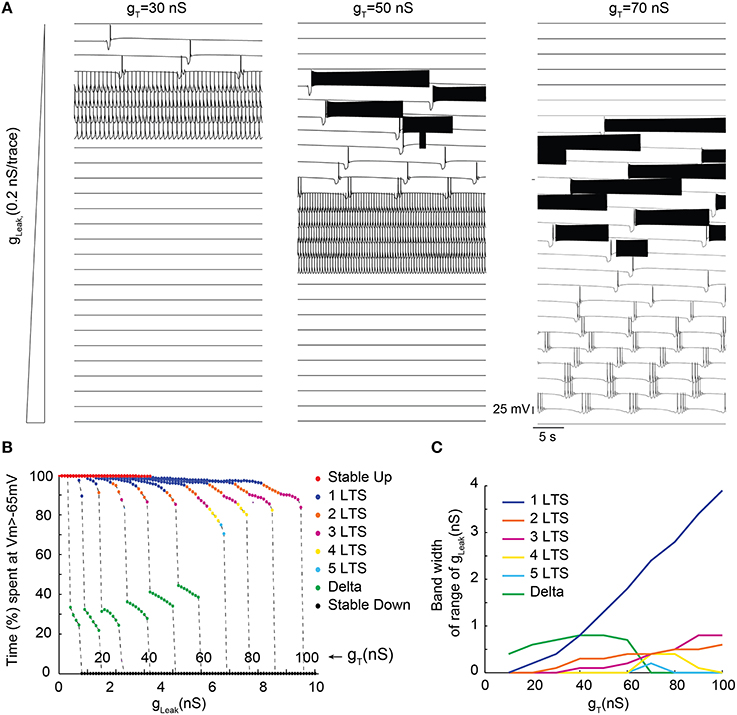
Figure 4. Membrane potential dynamics as a function of gLeak of TC model cells with increasing gT. (A) Examples of membrane potential dynamics for gT = 30, 50, and 70 nS and increasing values of gLeak (from top to bottom). (B) Proportion of time spent at depolarized membrane potential (Vm >−65 mV) as a function of gLeak for TC model cells with increasing gT values (from 10 to 100 nS). Dynamic regimes are categorized by color coding according to the number of LTSs per slow oscillation period. (C) Range of gLeak, in which a given dynamic regime is observed as a function of gT.
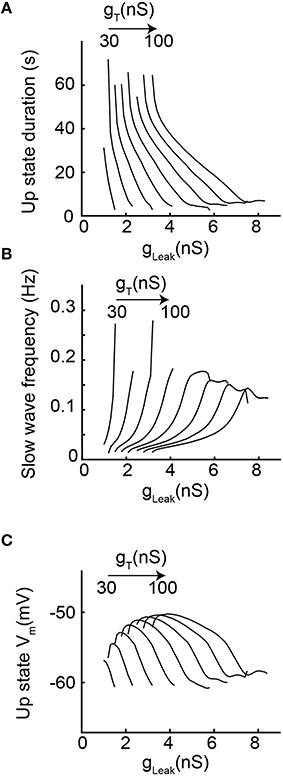
Figure 5. Slow oscillation properties as a function of increasing gT and gLeak. (A) Each line represents the duration of Up state episodes during slow oscillation as a function of gLeak, for a given gT (from 20 to 100 nS). (B) Slow oscillation frequency for the same data set. (C) Up state average membrane potential values (see text and Materials and Methods for further details).
Surprisingly, for the highest gT values (>70 nS), although long sequences of “grouped-delta slow waves” are present (Figure 4C), our model cell did not anymore display continuous delta oscillations but abruptly switched from “grouped-delta slow waves” to stable Down states when gLeak increased. While the bifurcation diagrams previously calculated for large gT values (Figures 3A,Cc) predicted an increase of the range of gLeak values where stable periodic delta orbits corresponding to continuous delta oscillations may develop, stable Down states were the only solutions observed in our simulations (Figure 4C). Such dominance of the stable Down state over continuous delta oscillations was due to the presence of action potentials on top of the LTS which elicit large high K+ rectifying currents. Indeed, in simulations performed without gNa continuous delta oscillations were observed for some gLeak values (data not shown).
Although the prominent IT in TC neurons mainly results from a high channel expression, we previously demonstrated that in neurons of sensory thalamic nuclei, IT amplitude is also transiently potentiated by a phosphorylation (ATP-dependent) mechanism, which exclusively occurs when the channels are inactivated, i.e., it increases with membrane depolarization (Leresche et al., 2004). To study how this additional mechanism that drastically controls the T current amplitude in this population of TC neurons contributes to their firing dynamics a new set of simulations was run where part of the total IT was due to a “potentiated” T conductance (gTP). The kinetics, amplitude and voltage-dependence of this gTP mimic the effect and properties of the described phosphorylation mechanism (see Materials and Methods for further details; Leresche et al., 2004). When IT was increased by introducing gTP in the model, a strengthening of the slow oscillation which occurred in a larger range of gLeak values is once again observed (Figure 6C; also compare Figures 6A,B with Figures 4A,B). However, for a given value of T conductance, negligible differences in the bifurcation diagrams are observed when comparing the dynamical behaviors supported either by non-potentiated currents or by a combination of non-potentiated and potentiated currents (Figures 6D–G). Hence, the peculiar biophysical properties of the potentiated T conductance do not significantly modify the membrane potential dynamics of slow oscillations. Nevertheless a close examination of the oscillatory regimes shows that for T conductance values where both “grouped-delta slow waves” and continuous delta developed (Figure 6B, gT 60 nS), the continuous delta disappeared upon introduction of the voltage-dependent potentiation (Figure 6B, gT 30 nS+gTP 30 nS). This suggests that compared to a simple increase in gT, this ATP-dependent T channel regulation can selectively enhance the occurrence of slow oscillations of TC neurons at the expenses of delta oscillations.
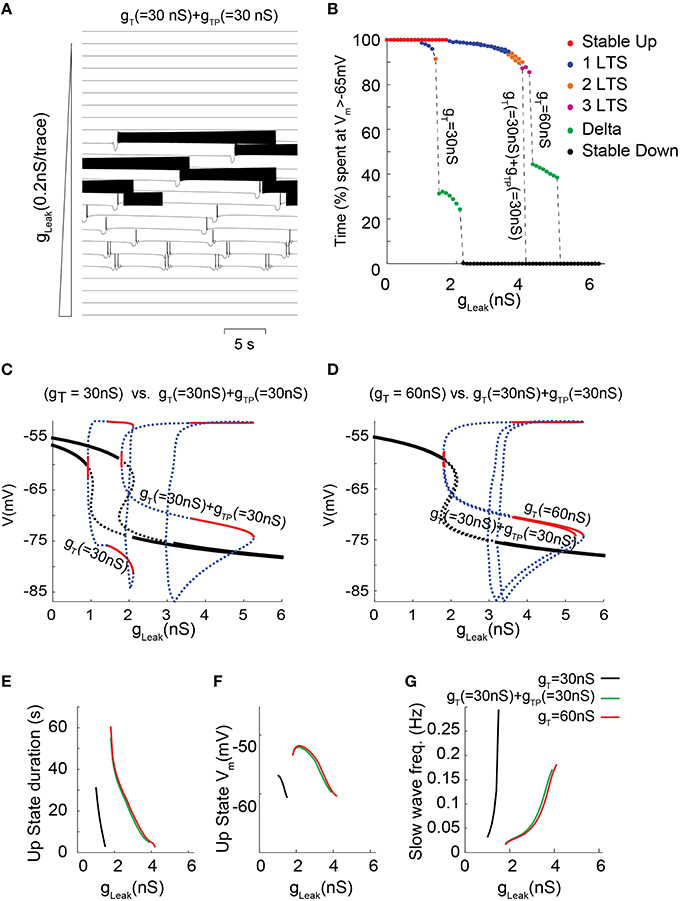
Figure 6. Membrane potential dynamics as a function of gLeak for a TC model cell that incorporates IT potentiation. (A) Typical example of membrane potential dynamics for gT = 30 nS + gTP = 30 nS for increasing gLeak, values. (B) Proportion of time spent at depolarized membrane potential (Vm >−65 mV) as a function of gLeak for TC model cells with gT = 30 nS; gT = 30 nS + gTP = 30 nS; and gT = 60 nS (same color code as in Figure 4B to indicate dynamical regimes). (C,D) Effect on the one-parameter (gLeak on x-axis) bifurcation diagrams of either adding a potentiated T conductance (C, gT = 30 nS vs. gT = 30 nS + gTP = 30 nS) or replacing half of the T conductance by a potentiated T conductance (D, gT = 60 nS vs. gT = 30 nS + gTP = 30 nS). Same legend as in Figure 3C. (E–G) Slow oscillation characteristics observed in model TC cells with either gT = 30 nS (black); gT = 30 nS + gTP = 30 nS (green) or gT = 60 nS (red). (E) Each line represents the duration of Up state episodes during slow oscillation as a function of gLeak, for a given gT and gTP. (F) Slow oscillation frequency for the same data set. (G) Up state average membrane potential values.
Discussion
Since their first development (Rose and Hindmarsh, 1989), TC neuron models have gained in precision and completeness (Destexhe et al., 1998), thus allowing detailed analysis of the dynamical processes that are intrinsic to these neurons (Destexhe and Sejnowski, 2003; Amarillo et al., 2015). Our current model adds to this knowledge by providing for the first time insights into the dynamical processes that take place at the transition between slow and delta oscillations. In particular, our results strongly suggest that the high gT of TC neurons, either due to channel expression or regulation, is not required to generate full-blown LTSs during delta and slow oscillations but is necessary for the generation of the Up and Down state dynamics underlying the slow oscillation of these neurons (David et al., 2013; Crunelli et al., 2014).
Contrary to the interpretation of the original in vitro and in vivo studies (see Crunelli et al., 2015), it is now well established that the full expression of slow oscillations requires both cortical and thalamic activities. In particular, combining ensemble recordings of single TC neurons and reverse microdialysis, we recently showed that slow wave frequency is strongly reduced following intrathalamic application of either TTX or TTA-P2 in both anesthetized and naturally sleeping rats (David et al., 2013). In agreement with these data, mice with a Cav3.1 deletion in the thalamus (but not in the cortex) experience frequent arousals during sleep (Anderson et al., 2005), supporting the importance of thalamic T channels in stabilizing sleep rhythms. Moreover, the biophysical mechanisms underlying the conditional thalamic oscillator responsible in TC neurons for the full manifestation of different types of slow oscillation depends on the membrane potential bistability that is created by the interaction between ITwindow and ILeak (Williams et al., 1997a; Toth et al., 1998; Crunelli et al., 2006). TC neurons present a small ITwindow (a few tens of pA; Dreyfus et al., 2010) and any decrease in this current may drastically impact its ability to play a significant physiological role. Our simulations results indicate that the high T channel expression in TC neurons is crucial to generate a large enough ITwindow capable of supporting the Up and Down states dynamics of slow oscillations over a large range of gLeak values. This was clearly confirmed by our in vitro recordings showing that partial block of the IT by TTA-P2 drastically reduces the range of steady hyperpolarizing currents that can generate intrinsic slow oscillations in TC neurons.
In addition, our simulations have indicated that a large gT is also essential for the appearance of “grouped-delta slow waves.” As indicated above, during slow waves the voltage-dependence of ITwindow creates the membrane potential bistability but the rhythmic occurrence of Up and Down states relies on the dynamics of ICAN (Hughes et al., 2002). Indeed, upon Ca2+ entry via the T channels these mixed cationic channels generates a transient depolarizing current that adds to ITwindow to set the membrane potential of the Up state. As intracellular Ca2+ slowly return to its basal level, the progressive decrease of ICAN reduces this membrane potential up to the point where the stable Up state equilibrium disappears and the membrane potential switches to the Down-state. With medium gT values, Ca2+ entry during LTS is moderate and ICAN activation, together with ITwindow, is not strong enough to counteract a strong ILeak and thus to generate the stable equilibrium necessary for an Up-state. Consequently, TC neurons go into continuous delta oscillations. However, with higher gT values, Ca2+ accumulation after a few delta oscillation cycles is sufficient to maximally activate ICAN and thus set an Up state equilibrium that terminates a delta oscillation episode.
Importantly, when our simulations included gNa we did not observe continuous delta oscillations for high or potentiated T channel conductances. Indeed, during natural sleep, thalamic delta oscillations appear to occur mostly in discrete groups during the down state of slow oscillations in both TC and nucleus reticularis thalami neurons (Steriade et al., 1993c; Timofeev and Steriade, 1996) and there is no evidence supporting the presence of continuous delta oscillations in TC neurons in vivo. Therefore, one can hypothesize that as suggested in Figure 3A strong T channel expression may prevent the appearance of continuous intrinsic rhythmicity at delta frequency in TC neurons. Interestingly, we previously showed that the maximal amplitude of IT is highly variable across neurons of different thalamic nuclei and even in different TC neurons within a nucleus (Leresche et al., 2004). Therefore, further modeling studies should aim to investigate how this heterogeneity in T channel density among TC neurons interacts with other intrinsic conductance expression such as ICAN or Ih to impact oscillatory dynamics.
Finally, one has to consider that the slow oscillation modeled here is generated intrinsically by single TC neurons (i.e., recorded in the presence of both glutamate and GABA blockers) and thus without the influence of either excitatory cortical and inhibitory inputs. Although this should represent the basic cellular mechanism explaining the conditional role played by the thalamus in sleep slow waves generation (Crunelli and Hughes, 2010), the precise interactions between this intrinsic mechanism and the complex thalamocortical activities (Sheroziya and Timofeev, 2014) remain to be clarified. Along the same line our simulations cannot inform on the firing dynamics of TC neurons during the expression of absence seizures since this abnormal activity requires the integrity of the thalamocortical network (Crunelli and Leresche, 2002). However the present results may help to better understand firing patterns observed during general anesthesia where the EEG mostly includes spindle and delta waves (Franks, 2008). In particular, phase 2 of the maintenance period is characterized by an increase in delta (0–4 Hz) activity (Brown et al., 2010). At clinically relevant concentrations, a number of volatile general anesthetics have been shown to inhibit both recombinant and native T channels (Orestes and Todorovic, 2010; Eckle et al., 2012), a result which was considered at first glance in contradiction with the occurrence of delta oscillations. However, (Eckle et al., 2012) showed that anesthetic doses of isoflurane only inhibits 20 to 60% of IT but induce a marked decrease of ITwindow in TC neurons. In this respect, our simulations clearly indicate that such partial inhibition of IT should indeed favor the occurrence of continuous delta oscillations, at least in TC neurons. In agreement with this view, a partial block of IT by in vivo administration of TTA-related compounds also produce sedative effects in behaving mice (Uebele et al., 2009; Kraus et al., 2010), further illustrating the complex relationship between the amount of gT and various sleep-related activities.
Author Contributions
FD, VC, NL, RL contribute to the design of the work, the acquisition, analysis and interpretation of data. FD, VC, NL, RL contribute to the manuscript and approve the final version.
Funding
The work was supported by the Centre National de la Recherche Scientifique (LIA 528) and the Wellcome Trust (grant 91882).
Conflict of Interest Statement
The authors declare that the research was conducted in the absence of any commercial or financial relationships that could be construed as a potential conflict of interest.
Acknowledgments
We thank Stuart Hughes for his help with the experiments and Tim Gould for the technical assistance.
References
Achermann, P., and Borbely, A. A. (1997). Low-frequency (< 1 Hz) oscillations in the human sleep electroencephalogram. Neuroscience 81, 213–222.
Amarillo, Y., Mato, G., and Nadal, M. S. (2015). Analysis of the role of the low threshold currents IT and Ih in intrinsic delta oscillations of thalamocortical neurons. Front. Comput. Neurosci. 9:52. doi: 10.3389/fncom.2015.00052
Anderson, M. P., Mochizuki, T., Xie, J., Fischler, W., Manger, J. P., Talley, E. M., et al. (2005). Thalamic Cav3.1 T-type Ca2+ channel plays a crucial role in stabilizing sleep. Proc. Natl. Acad. Sci. U.S.A. 102, 1743–1748. doi: 10.1073/pnas.0409644102
Brown, E. N., Lydic, R., and Schiff, N. D. (2010). General anesthesia, sleep, and coma. N. Engl. J. Med. 363, 2638–2650. doi: 10.1056/NEJMra0808281
Contreras, D., and Steriade, M. (1996). Spindle oscillation in cats: the role of corticothalamic feedback in a thalamically generated rhythm. [published erratum appears in J Physiol (Lond) 1996 Mar 15;491(Pt 3):889]. J. Physiol. (Lond). 490, 159–179.
Crunelli, V., Cope, D. W., and Hughes, S. W. (2006). Thalamic T-type Ca2+ channels and NREM sleep. Cell Calcium 40, 175–190. doi: 10.1016/j.ceca.2006.04.022
Crunelli, V., David, F., Leresche, N., and Lambert, R. C. (2014). Role for T-type Ca2+ channels in sleep waves. Pflugers Archiv. 466, 735–745. doi: 10.1007/s00424-014-1477-3
Crunelli, V., David, F., Lorincz, M. L., and Hughes, S. W. (2015). The thalamocortical network as a single slow wave-generating unit. Curr. Opin. Neurobiol. 31, 72–80. doi: 10.1016/j.conb.2014.09.001
Crunelli, V., and Hughes, S. W. (2010). The slow (< 1 Hz) rhythm of non-REM sleep: a dialogue between three cardinal oscillators. Nat. Neurosci. 13, 9–17. doi: 10.1038/nn.2445
Crunelli, V., and Leresche, N. (2002). Childhood absence epilepsy: genes, channels, neurons and networks. Nat. Rev. Neurosci. 3, 371–382. doi: 10.1038/nrn811
Crunelli, V., Lorincz, M., and Hughes, S. W. (2012). Activity of cortical and thalamic neurons during the slow (< 1Hz) oscillation in the mouse in vivo. Pflugers Arch. 463, 73–88. doi: 10.1007/s00424-011-1011-9
David, F., Schmiedt, J. T., Taylor, H. L., Orban, G., Di Giovanni, G., Uebele, V. N., et al. (2013). Essential thalamic contribution to slow waves of natural sleep. J. Neurosci. 33, 19599–19610. doi: 10.1523/JNEUROSCI.3169-13.2013
Destexhe, A., Neubig, M., Ulrich, D., and Huguenard, J. (1998). Dendritic low-threshold calcium currents in thalamic relay cells. J. Neurosci. 18, 3574–3588.
Destexhe, A., and Sejnowski, T. J. (2003). Interactions between membrane conductances underlying thalamocortical slow-wave oscillations. Physiol. Rev. 83, 1401–1453. doi: 10.1152/physrev.00012.2003
Dreyfus, F. M., Tscherter, A., Errington, A. C., Renger, J. J., Shin, H. S., Uebele, V. N., et al. (2010). Selective T-type calcium channel block in thalamic neurons reveals channel redundancy and physiological impact of I(T)window. J. Neurosci. 30, 99–109. doi: 10.1523/JNEUROSCI.4305-09.2010
Eckle, V. S., Digruccio, M. R., Uebele, V. N., Renger, J. J., and Todorovic, S. M. (2012). Inhibition of T-type calcium current in rat thalamocortical neurons by isoflurane. Neuropharmacology 63, 266–273. doi: 10.1016/j.neuropharm.2012.03.018
Ermentrout, B. (2002). Simulating, Analyzing and Animating Dynamical Systems: A Guide to Xppaut for Researchers and Student. 1st Edn. Philadelphia, PA: Society for Industrial and Applied Mathematics.
Franks, N. P. (2008). General anaesthesia: from molecular targets to neuronal pathways of sleep and arousal. Nat. Rev. Neurosci. 9, 370–386. doi: 10.1038/nrn2372
Huc, S., Monteil, A., Bidaud, I., Barbara, G., Chemin, J., and Lory, P. (2009). Regulation of T-type calcium channels: signalling pathways and functional implications. Biochim. Biophys. Acta 1793, 947–952. doi: 10.1016/j.bbamcr.2008.11.003
Hughes, S. W., Cope, D. W., Blethyn, K. L., and Crunelli, V. (2002). Cellular mechanisms of the slow (1 Hz) oscillation in thalamocortical neurons in vitro. Neuron 33, 947–958. doi: 10.1016/S0896-6273(02)00623-2
Hughes, S. W., Lorincz, M., Cope, D. W., Blethyn, K. L., Kekesi, K. A., Parri, H. R., et al. (2004). Synchronized oscillations at alpha and theta frequencies in the lateral geniculate nucleus. Neuron 42, 253–268. doi: 10.1016/S0896-6273(04)00191-6
Kraus, R. L., Li, Y., Gregan, Y., Gotter, A. L., Uebele, V. N., Fox, S. V., et al. (2010). In vitro characterization of T-type calcium channel antagonist TTA-A2 and in vivo effects on arousal in mice. J. Pharmacol. Exp. Ther. 335, 409–417. doi: 10.1124/jpet.110.171058
Lambert, R. C., Bessaih, T., Crunelli, V., and Leresche, N. (2014). The many faces of T-type calcium channels. Pflugers Archiv. 466, 415–423. doi: 10.1007/s00424-013-1353-6
Lambert, R. C., Bessaih, T., and Leresche, N. (2006). Modulation of neuronal T-type calcium channels. CNS Neurol. Disord. Drug Targets 5, 611–627. doi: 10.2174/187152706779025544
Lemieux, M., Chen, J. Y., Lonjers, P., Bazhenov, M., and Timofeev, I. (2014). The impact of cortical deafferentation on the neocortical slow oscillation. J. Neurosci. 34, 5689–5703. doi: 10.1523/JNEUROSCI.1156-13.2014
Leresche, N., Hering, J., and Lambert, R. C. (2004). Paradoxical potentiation of neuronal T-type Ca2+ current by ATP at resting membrane potential. J. Neurosci. 24, 5592–5602. doi: 10.1523/JNEUROSCI.1038-04.2004
Leresche, N., Lightowler, S., Soltesz, I., Jassik-Gerschenfeld, D., and Crunelli, V. (1991). Low-frequency oscillatory activities intrinsic to rat and cat thalamocortical cells. J Physiol (Lond) 441, 155–174.
McCormick, D. A. (1992). Neurotransmitter actions in the thalamus and cerebral cortex and their role in neuromodulation of thalamocortical activity. Prog. Neurobiol. 39, 337–388.
Orestes, P., and Todorovic, S. M. (2010). Are neuronal voltage-gated calcium channels valid cellular targets for general anesthetics? Channels 4, 518–522. doi: 10.4161/chan.4.6.12873
Perez-Reyes, E. (2003). Molecular physiology of low-voltage-activated t-type calcium channels. Physiol. Rev. 83, 117–161. doi: 10.1152/physrev.00018.2002
Pirchio, M., Turner, J. P., Williams, S. R., Asprodini, E., and Crunelli, V. (1997). Postnatal development of membrane properties and delta oscillations in thalamocortical neurons of the cat dorsal lateral geniculate nucleus. J. Neurosci. 17, 5428–5444.
Rose, R. M., and Hindmarsh, J. L. (1989). The assembly of ionic currents in a thalamic neuron. I. The three-dimensional model. Proceedings of the Royal Society of London. Ser. B Biol. Sci. 237, 267–288.
Sheroziya, M., and Timofeev, I. (2014). Global intracellular slow-wave dynamics of the thalamocortical system. J. Neurosci. 34, 8875–8893. doi: 10.1523/JNEUROSCI.4460-13.2014
Soltesz, I., and Crunelli, V. (1992). A role for low-frequency, rhythmic synaptic potentials in the synchronization of cat thalamocortical cells. J. Physiol. (Lond). 457, 257–276.
Steriade, M. (2006). Grouping of brain rhythms in corticothalamic systems. Neuroscience 137, 1087–1106. doi: 10.1016/j.neuroscience.2005.10.029
Steriade, M., Contreras, D., Curro Dossi, R., and Nunez, A. (1993a). The slow (< 1 Hz) oscillation in reticular thalamic and thalamocortical neurons: scenario of sleep rhythm generation in interacting thalamic and neocortical networks. J. Neurosci. 13, 3284–3299.
Steriade, M., McCormick, D. A., and Sejnowski, T. J. (1993b). Thalamocortical oscillations in the sleeping and aroused brain. Science 262, 679–685.
Steriade, M., Nunez, A., and Amzica, F. (1993c). Intracellular analysis of relations between the slow (< 1 Hz) neocortical oscillation and other sleep rhythms of the electroencephalogram. J. Neurosci. 13, 3266–3283.
Timofeev, I., and Steriade, M. (1996). Low-frequency rhythms in the thalamus of intact-cortex and decorticated cats. J. Neurophysiol. 76, 4152–4168.
Toth, T. I., Hughes, S. W., and Crunelli, V. (1998). Analysis and biophysical interpretation of bistable behaviour in thalamocortical neurons [In Process Citation]. Neuroscience 87, 519–523.
Turner, J. P., Anderson, C. M., Williams, S. R., and Crunelli, V. (1997). Morphology and membrane properties of neurones in the cat ventrobasal thalamus in vitro. J. Physiol. (Lond). 505, 707–726.
Uebele, V. N., Nuss, C. E., Fox, S. V., Garson, S. L., Cristescu, R., Doran, S. M., et al. (2009). Positive allosteric interaction of structurally diverse T-type calcium channel antagonists. Cell Biochem. Biophys. 55, 81–93. doi: 10.1007/s12013-009-9057-4
Wang, X. J. (1994). Multiple dynamical modes of thalamic relay neurons: rhythmic bursting and intermittent phase-locking. Neuroscience 59, 21–31.
Wang, X. J., and Rinzel, J. (2002). The Handbook of Brain Theory and Neural Networks. Cambridge, MA: The MIT Press.
Williams, S. R., Toth, T. I., Turner, J. P., Hughes, S. W., and Crunelli, V. (1997a). The ‘window’ component of the low threshold Ca2+ current produces input signal amplification and bistability in cat and rat thalamocortical neurones. J. Physiol. (Lond). 505, 689–705.
Williams, S. R., Turner, J. P., Hughes, S. W., and Crunelli, V. (1997b). On the nature of anomalous rectification in thalamocortical neurones of the cat ventrobasal thalamus in vitro. J. Physiol. (Lond). 505, 727–747.
Keywords: thalamus, sleep slow wave, delta waves, T-type calcium channels, bifurcation, computational modeling
Citation: David F, Crunelli V, Leresche N and Lambert RC (2016) Dynamic Analysis of the Conditional Oscillator Underlying Slow Waves in Thalamocortical Neurons. Front. Neural Circuits 10:10. doi: 10.3389/fncir.2016.00010
Received: 23 October 2015; Accepted: 08 February 2016;
Published: 25 February 2016.
Edited by:
Miles A. Whittington, University of York, UKReviewed by:
Roger D. Traub, IBM T.J. Watson Research Center, USAHeiko J. Luhmann, Institut für Physiologie und Pathophysiologie, Germany
Copyright © 2016 David, Crunelli, Leresche and Lambert. This is an open-access article distributed under the terms of the Creative Commons Attribution License (CC BY). The use, distribution or reproduction in other forums is permitted, provided the original author(s) or licensor are credited and that the original publication in this journal is cited, in accordance with accepted academic practice. No use, distribution or reproduction is permitted which does not comply with these terms.
*Correspondence: François David, francois.david@inserm.fr;
Régis C. Lambert, regis.lambert@upmc.fr