Emergent bursting and synchrony in computer simulations of neuronal cultures
- 1Department of Biomedical Engineering, Duke University, Durham, NC, USA
- 2Department of Mechanical Engineering and Materials Science, Duke University, Durham, NC, USA
- 3Program in Neuroscience and Behavioral Disorders, Duke-NUS Graduate Medical School, Singapore
Experimental studies of neuronal cultures have revealed a wide variety of spiking network activity ranging from sparse, asynchronous firing to distinct, network-wide synchronous bursting. However, the functional mechanisms driving these observed firing patterns are not well understood. In this work, we develop an in silico network of cortical neurons based on known features of similar in vitro networks. The activity from these simulations is found to closely mimic experimental data. Furthermore, the strength or degree of network bursting is found to depend on a few parameters: the density of the culture, the type of synaptic connections, and the ratio of excitatory to inhibitory connections. Network bursting gradually becomes more prominent as either the density, the fraction of long range connections, or the fraction of excitatory neurons is increased. Interestingly, biologically prevalent values of parameters result in networks that are at the transition between strong bursting and sparse firing. Using principal components analysis, we show that a large fraction of the variance in firing rates is captured by the first component for bursting networks. These results have implications for understanding how information is encoded at the population level as well as for why certain network parameters are ubiquitous in cortical tissue.
1. Introduction
Networks of cultured neurons have proven to be a valuable tool in the study of the mechanisms of learning, plasticity, information processing, and bursting (Shahaf and Marom, 2001; Eytan et al., 2003). With the advent of multielectrode arrays (MEAs), it is possible to monitor network activity by recording extracellularly from large numbers of neurons in vitro (Potter and DeMarse, 2001; Segev et al., 2001) or to influence network behavior through direct stimulation (Wagenaar et al., 2004). A wide variety of spatiotemporal firing patterns has been observed in cultured neuronal recordings, including: sporadic or asynchronous firing, synchronized network bursting, and neuronal avalanches (Maeda et al., 1995; van Pelt et al., 2004; Chen et al., 2006; Eytan and Marom, 2006; Eckmann et al., 2008; Petermann et al., 2009). Functionally, the mechanisms driving this activity are not well understood. There is experimental evidence that qualitatively suggests the plating density and the culture’s age play significant roles in determining the amount of synchronization in the network (Wagenaar et al., 2006b). Recent studies have quantified this dependence of bursting strength on culture denisties (Ito et al., 2010). In addition, Shew et al. used information theoretic measures to show that cultured neuronal networks maximized information at a particular ratio of excitation to inhibition (Shew et al., 2011).
Because of experimental limitations, it has been difficult to determine which network parameters have the greatest impact on observed bursting activity. One approach is to study the effect of the parameters using a computer model that captures many of the key features of in vitro networks. Previous modeling efforts have shown that synchronous activity is a common phenomenon in simulated neuronal networks and have studied how individual neuronal and synaptic dynamics affect synchronization (Börgers and Kopell, 2003; Kudela et al., 2003; Kube et al., 2004; Belykh et al., 2005; Nesse et al., 2008). Recent work has also focused on studying the importance of network level parameters such as axonal delays, ratio of excitatory/inhibitory neurons (E/I ratio), and the maximum number of connections (Gritsun et al., 2010, 2011) through simulation of networks with pacemaker neurons and random connections. Here, we extend this work by studying the emergence of synchronized bursting in networks without inherent pacemaker neurons, and with variable densities and small-world connections.
In order to further understand the effect of network properties on observed behavior of in vitro networks, an in silico model of a typical neuronal culture was developed, allowing parameters of interest to be varied systematically. The model of a 2D medium of spiking neurons includes key network features such as variable axonal delays, dynamic synapses, and small-world connectivity (Watts and Strogatz, 1998). To enable the comparison of simulated data and experimental data, an MEA is also modeled. In contrast to previous studies, the model is not built with inherently bursting neurons. The nature of emergent bursting, characterized by burst rate and periodicity, is explored across parameter space. Results show that bursting is an emergent phenomenon as the density, long-range connections, and the fraction of excitatory neurons are increased. The model also shows that bursting develops at the parameter values typically observed in cultures, suggesting that these networks are operating near criticality.
2. Materials and Methods
2.1. Spiking Neuron Model
The framework of the model consists of a set of N interconnected spiking neurons, similar to the one developed in Gritsun et al., 2010. To accurately capture the varied behavior present in neuronal populations while maintaining computational efficiency, the Izhikevich model was used to simulate the spiking dynamics of each neuron (Izhikevich, 2003). The Izhikevich model consists of a fast acting variable describing the membrane voltage (v) and a slowly decaying membrane reset variable (u) defined by the following equations:
With the after-spike reset conditions:
The parameters a, b, c, and d are dimensionless variables that are chosen to give the neurons various spiking dynamics, and the current I consists of synaptic input due to neurotransmitter release from presynaptic neurons plus Gaussian white noise. Varying the dimensionless parameters a through d allows for tuning of the spiking behavior of the neurons, and were chosen to give excitatory neurons regular spiking dynamics and inhibitory neurons fast spiking dynamics. Exact values are given in Izhikevich, 2003.
2.1.1. Synaptic release
Neurons form connections at synapses which are modeled by a simple exponentially decaying neurotransmitter (n) release, defined by the following:
This model is efficient in capturing the decay in neurotransmitter at the synapse after a spike. Axonal delays, which have been found to have a wide range of distinct values in cortical neurons, are also incorporated into the model as values proportional to the distance between neurons, with a maximum delay of 20 ms (Crook et al., 1997). Specific timings of presynaptic spikes are required to force a postsynaptic spike, otherwise they potentiate the postsynaptic neuron. In the model, neurons are treated as points embedded in a two-dimensional medium, which serves as the surface of the MEA. Figure 1 shows voltage traces of three simulated Izhikevich neurons at a synapse, with two excitatory neurons synapsing onto the third.
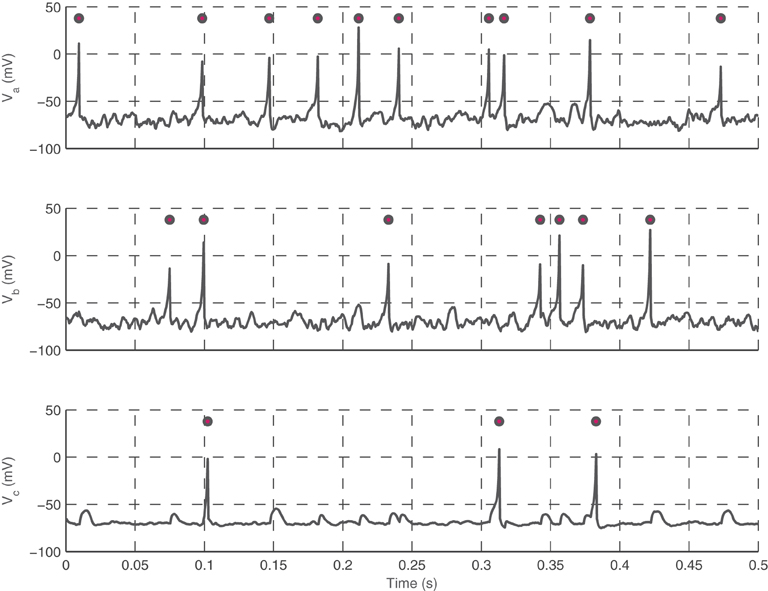
Figure 1. Interactions between three neurons. Neuron a (top trace) and b (middle trace) are presynaptic neurons that terminate onto c (bottom trace). Voltage traces (lines) and spikes (circles) for neurons a, b, and c during 0.5 s of simulation is shown. Note that coincidental spikes from a and b will cause c to fire, and only occasionally will a spike from one presynaptic neuron but not the other causes c to fire. Neuron c is shown with reduced noise to show the presence of EPSPs in the trace.
2.1.2. Network connections
The density of neurons in the network vas varied from 100 to 400 neurons/mm2. Recent work has found that bursting in cultured networks increases as a function of density, and starts at a density of around 250 neurons/mm2 (Ito et al., 2010). Thus, we set the parameter range of interest for density to be centered around 250 neurons/mm2. Connections between neurons are chosen according to the small-world paradigm (Watts and Strogatz, 1998). A network is considered “small-world” if it has a short mean path length (average number of links between two nodes) and large clustering coefficient (a measure of the degree to which nodes are clustered). To achieve small-world structure, neurons are initially connected to every other neuron within some radius threshold, and then randomly reconnected to other neurons across the network with probability p. Note that for small values of p, the network is ordered but highly localized (it has a large clustering coefficient and a large mean path length), while for large values of p the network is largely randomized (and has a small clustering coefficient and short mean path length). Figure 2 shows the effect of this probability on the network. A value of p = 0.03 was chosen to obtain a short mean path length and high clustering coefficient. This process yields sparse synaptic weight distributions which are then initialized to randomly chosen weights, drawn from normal distributions. Typically, 80% of the synapses are chosen to be excitatory and 20% are chosen to be inhibitory (Markram et al., 2004).
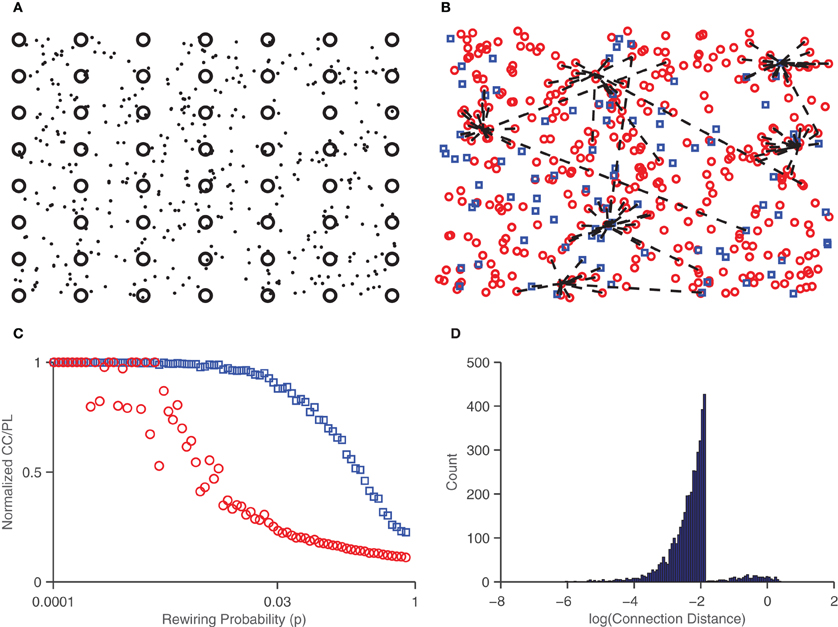
Figure 2. Small-world network connections. (A) Neurons (dots) are placed in random locations of a 2D medium, along with the embedded electrodes (circles). (B) Excitatory (circles) and inhibitory (squares) neurons shown with connections (dashed lines) drawn for seven randomly chosen neurons. Note that some connections are long range but the majority lie within a given radius threshold. (C) Characteristic path length (circles) and clustering coefficient (squares) in networks as a function of the probability of rewiring, p. A p value of 0.03 was chosen for a large clustering coefficient and small path length, characteristic of small-world networks. (D) Histogram of the log of the distance of synaptic connections. Most connections are short (10−2mm or less) though some are long range (around 1mm).
2.2. Simulations and MEAs
A new trial generates a newly randomized network with a unique set of weights, connections, and neuronal parameters. The network is then simulated using random synaptic noise as the only input. In addition to recording the spike times of all of the individual neurons, the electrode interface of the MEAs is modeled as well. MEAs are modeled with a 7 × 8 grid of electrodes spaced 200 μm apart. Each electrode records spikes from neurons within a 20 μm radius of the center of the electrode, and in total they capture a small subset of the spiking activity of the whole network. Sorting of the contributing neurons is not performed, so there may be multiple neurons contributing to the spikes recorded from a given electrode.
The model was developed in Matlab (The MathWorks Inc., Natick, MA) using C++ mex files as the core. This allows for simulation of around 500–800 neurons in real time on a 2 GHz computer using a clock-driven algorithm (Brette et al., 2007). That is, the model equations are updated at each time step rather than at each firing event. Table 1 shows a list of parameters used and their values. Simulations of larger networks (holding other factors constant) did not change qualitative network behavior. The data from these simulations, as with data from multielectrode recordings, provides a significant analysis challenges (Brown et al., 2004). Below, we describe our analysis methods.
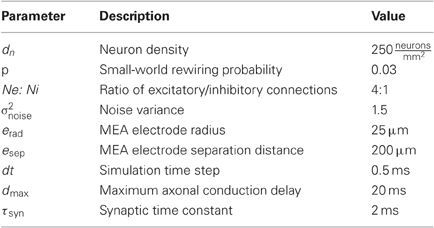
Table 1. Neural network and simulation parameters.
2.3. Data Analysis
2.3.1. Bursting metrics
In order to measure the degree or amount of network synchronization or bursting present in a given simulation, two different metrics were used: the maximum AC component (MAC) and the bursts per minute count (BPM). In order to compute these estimates across N different spike trains for a network with N neurons, all of the spikes are binned using discrete time windows to obtain a time-varying signal corresponding to the average firing rate of the entire network at a given point in time. This signal is then normalized by the number of neurons in the network and smoothed by convolving with a Gaussian kernel. The filtered signal is defined as the global firing rate, or GFR. The GFR is a time varying signal that represents the firing rate of the network over time.
For networks that display prominent synchronized bursting, this signal has sharp peaks during the bursts as many neurons in the network are firing in a short time window. To quantify the rate of bursting independent of whether it is synchronous or not, the GFR signal is used. A peak detection algorithm is run on the GFR and the number of peaks found per minute is computed and defined as the BPM count. The more prominent a network burst is, the sharper the peak will be in the GFR signal, and the more likely it is to be registered in the BPM count. To compute the MAC parameter, frequency analysis is used. The Fourier spectrum of the GFR signal is analyzed by computing the Fast Fourier transform (FFT). The FFT is then normalized by a factor of  where f0 is the DC (zero frequency) component. The amplitude of the maximum AC (non-zero frequency) component of this signal is defined as the maximum AC (MAC) parameter. A high value for the MAC parameter corresponds to a high degree of synchrony in the network, as there is a sharp peak in the normalized FFT. The frequency at which the maximum value occurs indicates the fundamental frequency of network bursting. The MAC serves as a measure of the periodicity of network bursting. Figure 3 shows these metrics applied to example sets of spike trains.
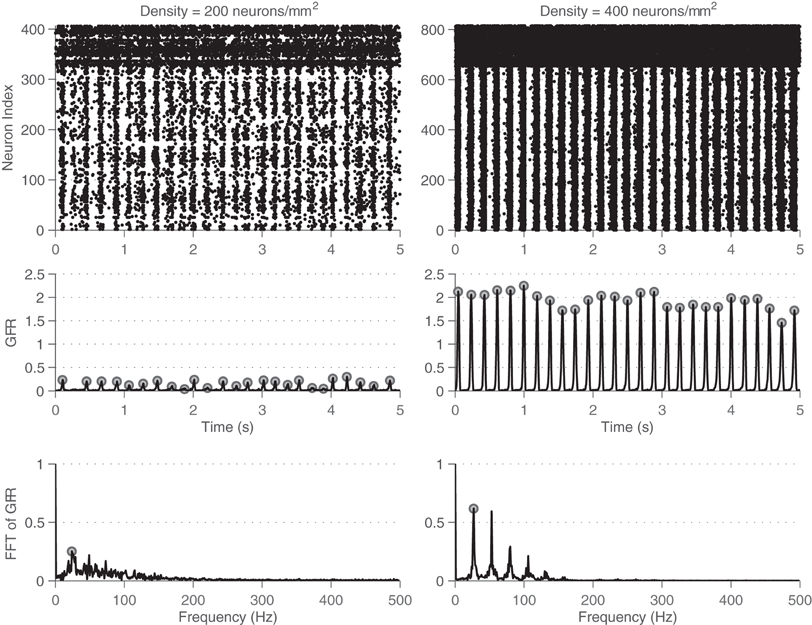
Figure 3. Example of metrics used to characterize degree of bursting. Metrics shown for a low-density network (left, 200 neurons/mm2) and a high-density network (right, 400 neurons/mm2). Top: Rasters of the spiking activity of all neurons in the network for 5 s of simulation. Inhibitory neurons are located at the top, and fire more rapidly. Middle: Global firing rate (GFR) signal along with bursts detected through peak detection using the GFR signal. Bottom: Fourier transform of the GFR shown, normalized by the DC component. The higher density network has a larger maximum AC component of the GFR.
2.3.2. Neural trajectories
Previous work (Churchland et al., 2007) has used dimensionalilty reduction techniques to translate firing rates onto low-dimensional projections that allow for easier visualization of neural trajectories. Here, the term “neural trajectory” refers to a lower dimensional projection of the high-dimensional vector of network firing rates. The general idea is that redundancy is encoded in the firing rates of neurons, so using methods such as principal components analysis to transform the firing rates onto a basis that better captures the variance in the data allows us to ignore the redundant variables. To extract neural trajectories, the firing rates for individual neurons were first determined by binning spike counts into 10 ms time windows. The square root of the rates was taken (to compress the range) and the resulting signals were smoothed with a Gaussian kernel. PCA was run on these smoothed firing rate trajectories, and the top three components were extracted to serve as the low-dimensional projection of the neural state (defined as the N-dimensional vector describing the firing rate of all N neurons in the network).
3. Results
3.1. Qualitative Behavior
Figure 4 shows examples of activity from the simulations: the behavior of all neurons (left) and those that are recorded at the simulated electrodes (right). Note the large variability in activity (here shown across different network densities), indicating that the transition from sparse asynchronous activity to network bursting is gradual. Spatial sub-sampling of MEA electrodes seems to capture the qualitative behavior but fails to capture a large amount of the activity in the network. Notably, there exist significant qualitative differences between the two rasters. Activity patterns are robust with respect to the random initialization of the network, that is, the observed bursting occurs independently of the initial connections, weights, and neuronal properties of the network. In addition, it is important to note that the emergent bursting is a connection-dependent phenomenon. That is, an uncoupled network will show no signs of synchrony. Different from previous work on coupled oscillators, is the fact that none of these elements are intrinsically bursting or oscillate without input from their neighbors.
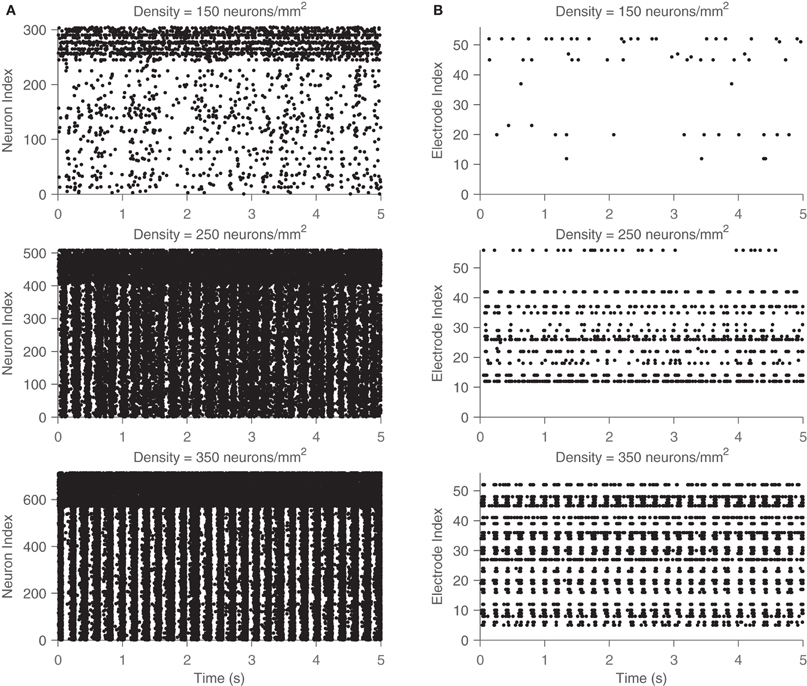
Figure 4. Network activity and electrode recordings from simulation. Rasters of both the spiking activity of all neurons (A) and that recorded by the simulated MEA (B) across 5 s of simulation. Three different networks are shown, one of a low density (top), medium density (middle), and high density (low). The high firing rates for the upper neuron indices correspond to the fast spiking inhibitory neurons, which have different dynamics than the excitatory neurons. Network bursting gradually becomes more pronounced as density is increased.
3.2. Variation Across Parameter Space
The effect of three different parameters (density, connection type, and ratio of excitatory/inhibitory connections) on network activity was studied. For each parameter, a range of different values was tested (densities from 100 to 500 neurons/mm2, p values logarithmically spaced from 0.001 to 1, and the fraction of excitatory neurons from 0.5 to 1). Each parameter affects the network structure differently: increasing the density corresponds to an increase in the number of connections each neuron makes, as there are more neurons within the local threshold to form synapses with. Increasing the value of p only affects how the connections are organized: either local and structured (small p) or long-range and disorganized (large p). Finally, increasing the fraction of excitatory neurons affects the amounts of inhibitory and excitatory neurotransmitter release in the network. Each range was tested by generating a new randomized network for each parameter value and simulating with gaussian white noise for 5 s.
Figure 5 shows the Fourier transform of the global firing rate (GFR) signal across parameters. Note that as each parameter is increased, highly periodic structure emerges centered around a fundamental frequency of just over 5Hz.
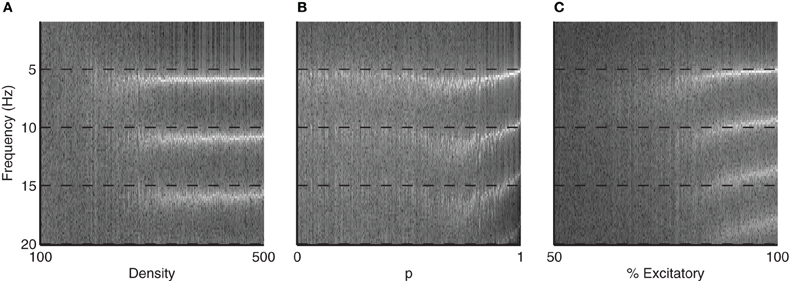
Figure 5. FFT of GFR signal across different parameters. Images show emergence of synchronous activity as the (A) density, (B) small-world rewiring probability p, and (C) % of excitatory connections are varied. Largest frequency component emerges for all three parameters around just over 5 Hz, corresponding to the frequency of network bursting. The higher values observed in the FFT are harmonics of this 5 Hz bursting. Also note that for increasing density, the emergent frequency of around 5 Hz is more consistent that the other two parameters, where the burst frequency collapses to the final value.
This frequency corresponds to the bursting rate of around five times per second, which is consistent with observed bursting frequency in cultures. The MAC and number of bursts were also computed across the range of parameters. These results are summarized in Figures 6 and 7. The vertical gray bar in Figure 6 indicates the biologically prevalent range of the parameter of interest (Table 1). The general trend appears to be that as the network gets denser (more connected) and as those connections are more likely to reach out across the network, there is an increase in synchronous network activity. Perhaps surprisingly, the ranges of interest (gray bars) with respect to all three parameters tend to be centered at the middle of the transition between sparse firing and synchronous bursting. Figure 7 shows how the bursting metrics vary by scanning a 2D grid of parameter space. Here, we see bursting increase as pairs of parameters are increased.
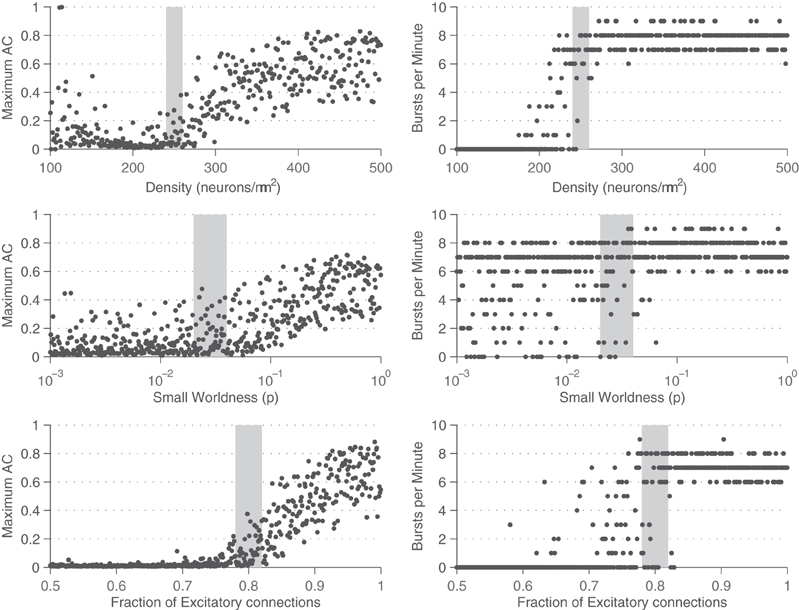
Figure 6. Analysis of bursting metrics across parameters. The maximum AC parameter (left) and the bursts per minute count (right) are shown for different values of density (top), small-world parameter (middle), and fraction of excitatory synapses (bottom). For all three parameters, both the maximum AC component of the GFR and the number of bursts per minute are found to increase along with the parameter, indicative of an emergence in the strength and synchrony of network bursting. Gray bars indicate typical values of the parameters from networks in culture.
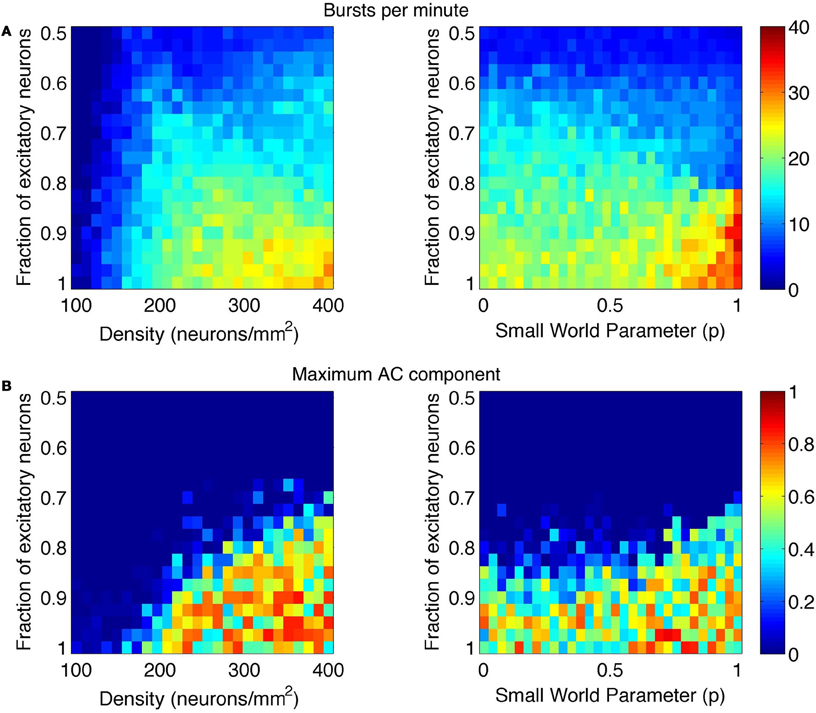
Figure 7. Phase space of bursting activity measured using the (A) bursts per minute and (B) maximum AC component metrics. Bursting was measured across networks of varying density and E/I ratio (left images) and small-world rewiring parameter (p) and E/I ratio (right images).
3.3. Principal Components Analysis
Principal components of firing rates were computed to better visualize the neural state. Example neural trajectories are shown in Figure 8 for different values of density and of p. Note that as the degree of synchrony in the network increases (for increasing values of p and density) the trajectory projected onto the first principal component becomes increasingly periodic. It is much easier to characterize the synchrony in the system by looking at the projection of the first principal component rather than of the global activity. The motivation behind applying dimensionality reduction techniques to neural data is to eliminate the redundancy inherent to the neural code and to extract out interesting variables.
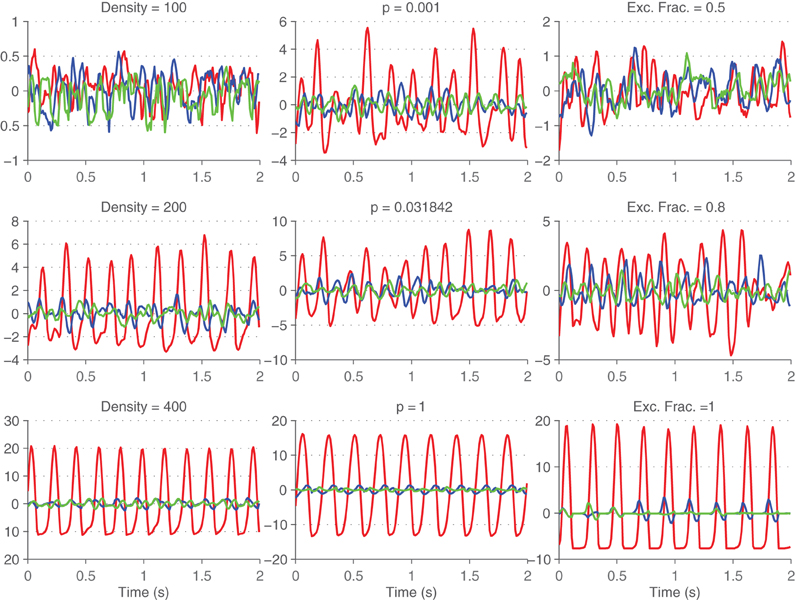
Figure 8. Neural trajectories across time. First (red), second (blue), and third (green) principal components of the firings rates are shown across time for different values of density (left column), small-world rewiring parameter p (middle column), and fraction of excitatory synapses (right column).
Plots of the projection of neural state onto the top three principal components are shown in Figure 9. Here, each point in the space can be thought of as a distinct neural state. The trajectory through the space across time represents the evolution of that neural state. For asynchronous networks (top), the trajectories appear random or chaotic. The neural state is unpredictable using just a three dimensional projection of the original data space. However, for networks that burst (bottom), the trajectories follow a cyclic trajectory as they evolve through the space. The evolution of the attractor is again gradual across different values of density or p, but once it develops it remains the same across newly initialized networks with similar properties.
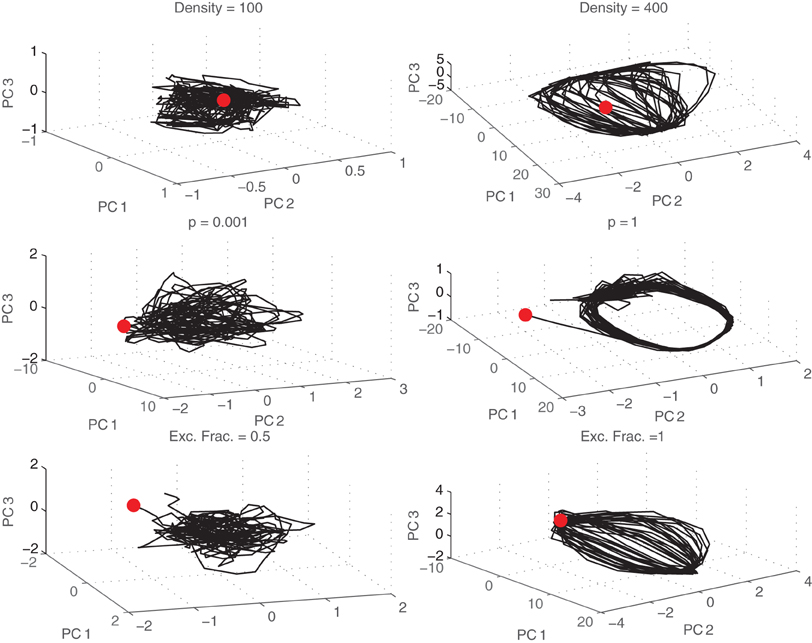
Figure 9. Trajectories through state space. Neural trajectories (black lines) projected onto the first three principal components shown for different densities (top), small-world probabilities p (middle), and fraction of excitatory synapses (bottom). Initial states are marked with a red dot.
These results also make sense when we look at how much variance is captured by the first principal component across the parameter space, shown in Figure 10. For large values of p or high densities, there is a large amount of redundancy in the system, and the neural state can be approximated with just a few variables. This seems rather inefficient, as a large number of neurons are encoding the same information.
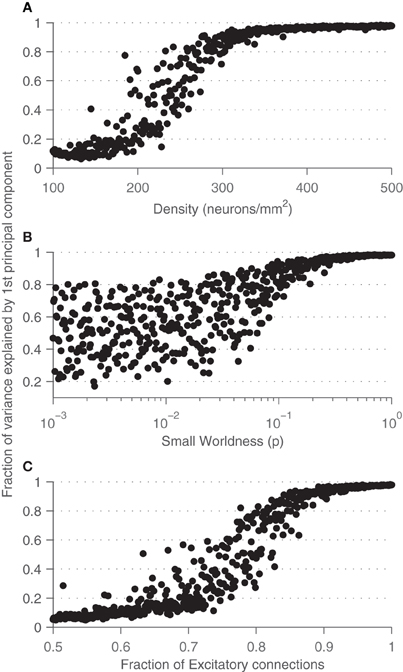
Figure 10. Fraction of the variance captured by the first principal component across different values of density (A), small-world rewiring probability p (B), and fraction of excitatory synapses (C).
4. Discussion
These results help to uncover the nature of network bursting observed in in vitro cultures. Bursting appears to be an emergent property of networks with both excitatory and inhibitory connections. Simulations qualitatively match data obtained from cultures grown on microelectrode arrays, and are able to mimic the wide repertoire of activity seen experimentally. The model was developed using a bottom-up approach, replicating both the connectivity and intrinsic properties observed in neuronal cultures. Random synaptic noise is a sufficient input for driving these cultures towards self-synchronization. The dynamics of network bursting are explored across the parameter space, against both the density of the network and the type of connections (realized by the small-world rewiring probability p). The strength and periodicity of bursting is found to become more prominent as the density increases or as the network becomes more random and disorganized. This gradation in strength of bursting agrees quantitatively with recent experimental evidence (Wagenaar et al., 2006b; Ito et al., 2010; Shew et al., 2011). Ito et al. found bursting to start occurring at densities of 250 neurons/mm2, and increase as a function of density, which agrees remarkably with our results shown in Figures 6 and 7.
One natural concern that arises from this work is how robust the findings are with respect to the model parameters. Due to the large parameter space, searching the entire space is not feasable. The chosen parameters fall into three groups: one is a set of parameters that are chosen based on previous studies (E/I ratio, neuron dynamics), another set is randomized (individual connections, weights, and locations), and the last set makes up the parameter space that was searched (density, small-worldness, E/I ratio). Furthermore, network details such as individual connections, synaptic weights, neuron locations, and type are all randomized at the start of each simulation. Therefore, they do not play a critical role in determining how strongly the network will burst over multiple trials. Our findings show that network bursting is heavily dependent on network level parameters, such as the gross connection paradigm, network density, and E/I ratio.
Projecting network firing rates onto an optimal subspace using principal components analysis yields more insight into the dynamics of network bursting. As density is increased, or as the network connections becomes more long-range, the amount of variance captured by the first principal component increases markedly from as little as 10% to as much as 95%. This implies that networks with a strong degree of bursting are highly redundant such that the behavior of all of the neurons can be captured with only a few. Trajectories of the neural state through the phase space of the top three components show that the dynamics are chaotic and unpredictable for sparse or ordered cultures, yet for dense or random cultures, distinct cyclic trajectories arise. These cycles are robust with respect to random initialization of different networks, indicating that their dynamics are capturing the essential activity of the network. Persistent dynamical attractors have already been observed in experimental cultures (Wagenaar et al., 2006a). Interestingly, the trajectories for dense networks are different from those of highly disorganized networks, which could serve as a potential marker for identifying experimental network states.
From an information theoretic point of view, one might expect biological neural networks to operate between the twin extremes of asynchronous (chaotic) and synchronous (redundant) spiking. This would allow networks to take advantage of robustness in the system while still utilizing the information capacity efficiently. Simulations of networks with densities of around 200–250 neurons/mm2, characteristically small-world connections (corresponding to a p value of around 0.03), and excitatory/inhibitory ratios of 4:1 all share critical properties regarding spiking patterns. For these values, the MAC parameter, bursts per minute count, and amount of variance captured through the first principal component all center at the transition to bursting behavior. The model suggests that the network may be operating at or near criticality (Bak et al., 1988; Chialvo, 2010).
Conflict of Interest Statement
The authors declare that the research was conducted in the absence of any commercial or financial relationships that could be construed as a potential conflict of interest.
Acknowledgments
This material is based upon work supported by the National Science Foundation under grant ECCS-0925407.
References
Belykh, I., de Lange, E., and Hasler, M. (2005). Synchronization of bursting neurons: what matters in the network topology. Phys. Rev. Lett. 94, 1–4.
Börgers, C., and Kopell, N. (2003). Synchronization in networks of excitatory and inhibitory neurons with sparse, random connectivity. Neural Comput. 15, 509–538.
Brette, R., Rudolph, M., Carnevale, T., Hines, M., Beeman, D., Bower, J. M., Diesmann, M., Morrison, A., Goodman, P. H., Harris, F. C., Zirpe, M., Natschläger, T., Pecevski, D., Ermentrout, G. B., Djurfeldt, M., Lansner, A., Rochel, O., Vieville, T., Muller, E., Davison, A. P., El Boustani, S., and Destexhe, A. (2007). Simulation of networks of spiking neurons: a review of tools and strategies. J. Comput. Neurosci. 23, 349–398.
Brown, E. N., Kass, R. E., and Mitra, P. P. (2004). Multiple neural spike train data analysis: state-of-the-art and future challenges. Nat. Neurosci. 7, 456–461.
Chen, C., Chen, L., Lin, Y., Zeng, S., and Luo, Q. (2006). The origin of spontaneous synchronized burst in cultured neuronal networks based on multi-electrode arrays. Biosystems 85, 137–143.
Chialvo, D. R. (2010). Emergent complex neural dynamics: the brain at the edge. Nature 750, 744–750.
Churchland, M. M., Yu, B. M., Sahani, M., and Shenoy, K. V. (2007). Techniques for extracting single-trial activity patterns from large-scale neural recordings. Curr. Opin. Neurobiol. 17, 609–618.
Crook, S. M., Ermentrout, G. B., Vanier, M. C., and Bower, J. M. (1997). The role of axonal delay in the synchronization of networks of coupled cortical oscillators. J. Comput. Neurosci. 4, 161–172.
Eckmann, J.-P., Jacobi, S., Marom, S., Moses, E., and Zbinden, C. (2008). Leader neurons in population bursts of 2D living neural networks. New J. Phys. 10, 015011.
Eytan, D., Brenner, N., and Marom, S. (2003). Selective adaptation in networks of cortical neurons. J. Neurosci. 23, 9349–9356.
Eytan, D., and Marom, S. (2006). Dynamics and effective topology underlying synchronization in networks of cortical neurons. J. Neurosci. 26, 8465–8476.
Gritsun, T., le Feber, J., Stegenga, J., and Rutten, W. L. C. (2011). Experimental analysis and computational modeling of interburst intervals in spontaneous activity of cortical neuronal culture. Biol. Cybern. 105, 197–210.
Gritsun, T. A., le Feber, J., Stegenga, J., and Rutten, W. L. C. (2010). Network bursts in cortical cultures are best simulated using pacemaker neurons and adaptive synapses. Biol. Cybern. 102, 293–310.
Ito, D., Tamate, H., Nagayama, M., Uchida, T., Kudoh, S. N., and Gohara, K. (2010). Minimum neuron density for synchronized bursts in a rat cortical culture on multi-electrode arrays. Neuroscience 171, 50–61.
Kube, K., Herzog, A., Spravedlyvyy, V., Michaelis, B., Opitz, T., De Lima, A., and Voigt, T. (2004). “Modelling of biologically plausible excitatory networks: emergence and modulation of neural synchrony,” in Proceedings of the European Symposium on Artificial Neural Networks, 28–30 April, 379–384. (Bruges, Belgium: Citeseer).
Kudela, P., Franaszczuk, P. J., and Bergey, G. K. (2003). Changing excitation and inhibition in simulated neural networks: effects on induced bursting behavior. Biol. Cybern. 88, 276–285.
Maeda, E., Robinson, H. P., and Kawana, A. (1995). The mechanisms of generation and propagation of synchronized bursting in developing networks of cortical neurons. J. Neurosci. 15, 6834–6845.
Markram, H., Toledo-Rodriguez, M., Wang, Y., Gupta, A., Silberberg, G., and Wu, C. (2004). Interneurons of the neocortical inhibitory system. Nat. Rev. Neurosci. 5, 793–807.
Nesse, W. H., Borisyuk, A., and Bressloff, P. C. (2008). Fluctuation-driven rhythmogenesis in an excitatory neuronal network with slow adaptation. J. Comput. Neurosci. 25, 317–333.
Petermann, T., Thiagarajan, T. C., Lebedev, M. A., Nicolelis, M. A. L., Chialvo, D. R., and Plenz, D. (2009). Spontaneous cortical activity in awake monkeys composed of neuronal avalanches. Proc. Natl. Acad. Sci. U.S.A. 106, 15921–15926.
Potter, S. M., and DeMarse, T. B. (2001). A new approach to neural cell culture for long-term studies. J. Neurosci. Methods 110, 17–24.
Segev, R., Shapira, Y., Benveniste, M., and Ben-Jacob, E. (2001). Observations and modeling of synchronized bursting in two-dimensional neural networks. Phys. Rev. E 64, 1–9.
Shahaf, G., and Marom, S. (2001). Learning in networks of cortical neurons. J. Neurosci. 21, 8782–8788.
Shew, W. L., Yang, H., Yu, S., Roy, R., and Plenz, D. (2011). Information capacity and transmission are maximized in balanced cortical networks with neuronal avalanches. J. Neurosci. 31, 55–63.
van Pelt, J., Wolters, P. S., Corner, M. A., Rutten, W. L. C., and Ramakers, G. J. A. (2004). Long-term characterization of firing dynamics of spontaneous bursts in cultured neural networks. IEEE Trans. Biomed. Eng. 51, 2051–2062.
Wagenaar, D. A., Nadasy, Z., and Potter, S. M. (2006a). Persistent dynamic attractors in activity patterns of cultured neuronal networks. Phys. Rev. 73, 1–8.
Wagenaar, D. A., Pine, J., and Potter, S. M. (2004). Effective parameters for stimulation of dissociated cultures using multi-electrode arrays. J. Neurosci. Methods 138, 27–37.
Wagenaar, D. A., Pine, J., and Potter, S. M. (2006b). An extremely rich repertoire of bursting patterns during the development of cortical cultures. BMC Neurosci. 7, 11.
Keywords: neuronal cultures, bursting, computer simulations, synchrony, small-world networks
Citation: Maheswaranathan N, Ferrari S, VanDongen AMJ and Henriquez CS (2012) Emergent bursting and synchrony in computer simulations of neuronal cultures. Front. Comput. Neurosci. 6:15. doi: 10.3389/fncom.2012.00015
Received: 11 August 2011; Accepted: 08 March 2012;
Published online: 03 April 2012.
Edited by:
Arvind Kumar, University of Freiburg, GermanyReviewed by:
Ulrich Egert, University of Freiburg, GermanyRon Meir, Israel Institute of Technology, Israel
Copyright: © 2012 Maheswaranathan, Ferrari, VanDongen and Henriquez. This is an open-access article distributed under the terms of the Creative Commons Attribution Non Commercial License, which permits non-commercial use, distribution, and reproduction in other forums, provided the original authors and source are credited.
*Correspondence: Craig S. Henriquez, Department of Biomedical Engineering, Duke University, 136 Hudson Eng Ctr, Durham, NC 27708, USA. e-mail: ch@duke.edu