A wavelet-based neural model to optimize and read out a temporal population code
- 1Synthetic Perceptive Emotive and Cognitive Systems (SPECS), Universitat Pompeu Fabra, Barcelona, Spain
- 2Institució Catalana de Recerca i Estudis Avançats (ICREA), Barcelona, Spain
It has been proposed that the dense excitatory local connectivity of the neo-cortex plays a specific role in the transformation of spatial stimulus information into a temporal representation or a temporal population code (TPC). TPC provides for a rapid, robust, and high-capacity encoding of salient stimulus features with respect to position, rotation, and distortion. The TPC hypothesis gives a functional interpretation to a core feature of the cortical anatomy: its dense local and sparse long-range connectivity. Thus far, the question of how the TPC encoding can be decoded in downstream areas has not been addressed. Here, we present a neural circuit that decodes the spectral properties of the TPC using a biologically plausible implementation of a Haar transform. We perform a systematic investigation of our model in a recognition task using a standardized stimulus set. We consider alternative implementations using either regular spiking or bursting neurons and a range of spectral bands. Our results show that our wavelet readout circuit provides for the robust decoding of the TPC and further compresses the code without loosing speed or quality of decoding. We show that in the TPC signal the relevant stimulus information is present in the frequencies around 100 Hz. Our results show that the TPC is constructed around a small number of coding components that can be well decoded by wavelet coefficients in a neuronal implementation. The solution to the TPC decoding problem proposed here suggests that cortical processing streams might well consist of sequential operations where spatio-temporal transformations at lower levels forming a compact stimulus encoding using TPC that are subsequently decoded back to a spatial representation using wavelet transforms. In addition, the results presented here show that different properties of the stimulus might be transmitted to further processing stages using different frequency components that are captured by appropriately tuned wavelet-based decoders.
1. Introduction
The encoding of sensory stimuli requires robust compression of salient features (Hung et al., 2005). This compression must support representations of the stimulus that are invariant to a range of transformations caused, in case of vision, by varying viewing angles, different scene configurations, and deformations. Invariances and compression of information can be achieved by moving across different representation domains i.e., from spatial to temporal representations.
In earlier work we proposed an encoding paradigm that makes use of this strategy called the Temporal Population Code (TPC) (Wyss et al., 2003a). In this approach the input stimulus is topographically projected onto a network of neurons organized in a bi-dimensional Cartesian space with dense local connectivity. The output of the network is a compressed representation of the stimulus captured in the temporal evolution of the population spike activity. The space to time transformation of TPC provides for a high-capacity encoding, invariant to position, and image deformations that has been successfully applied to real-world tasks such as hand-written character recognition (Wyss et al., 2003b), spatial navigation (Wyss and Verschure, 2004) and face recognition in a humanoid robot (Luvizotto et al., 2011). TPC shows that the dense excitatory local connectivity found in the primary sensory areas of the mammalian neo-cortex can play a specific role in the rapid and robust transformation and compression of spatial stimulus information that can be transmitted over a small number of projections to subsequent areas. This wiring scheme is consistent with the anatomy of the neo-cortex where about 95% of all connections found in a cortical volume also originate in it (Sporns and Zwi, 2004).
In classical models of visual perception invariant representations emerge in the form of activity patterns at the highest level of an hierarchical multilayer network of spatial feature detectors (Fukushima, 1980; Riesenhuber and Poggio, 1999; Serre et al., 2007). In this approach, invariances are achieved at the cost of increasing the number of connections between the different layers of the hierarchy. However, these models seem to be based on a fundamental assumption that is not consistent with cortical anatomy. In comparison to these hierarchical models of object recognition, the TPC architecture has the significant advantage of being both compact and wire independent thus providing for the multiplexing of information.
Recently direct support for the TPC as a substrate for stimulus encoding has been found in a number of physiological studies. For instance, the physiology of the mammalian visual system shows dynamics consistent with the TPC in orientation discrimination (Samonds and Bonds, 2004; MacEvoy et al., 2009) and spatial selectivity regulation (Benucci et al., 2007). In particular, showing stimulus-specific modulation of the phase relationships among active neurons. In the bird auditory system, the temporal responses of neuron populations allow for the intensity invariant discrimination of songs (Cyrus et al., 2008). Similarly in the inferior temporal and prefrontal cortices information about stimulus categories is encoded by the temporal response of populations of neurons (Meyers et al., 2008; Barak et al., 2010). Signatures of the TPC have also been found in the insect olfactory system where the glomeruli and the projection neurons of the antennal lobe display stimulus induced temporal modulations of their firing rate at a scale of hundreds of milliseconds (Carlsson et al., 2005; Knusel et al., 2007).
If the TPC plays a role in stimulus encoding it is relevant to understand what its key coding features are and how these features can be subsequently decoded in areas downstream from the encoder. The readout by the decoder must be fast and compact, extracting the key characteristics of the original input stimulus in a compressed way. These key features must be captured in a non-redundant fashion so that prototypes of a class can emerge and be efficiently stored in memory and/or serve on-going action.
In a hierarchical model of sensory processing based on the notion of TPC, the encoded temporal information provided by primary areas is mapped back onto the spatial domain allowing higher order structures to further process the stimulus. Hence, a TPC decoder is required to generate a spatially structured response from the TPC of the encoder. Taking into account these requirements our question is how a cortical circuit can retrieve the features encapsulated in the TPC.
In the past years, different strategies for decoding temporal information have been suggested. A recently proposal is the so-called Liquid State Machine, or LSM (Doetsch, 2000) which is an example of a larger class of models also called reservoir computing (Lukoševičius and Jaeger, 2009). In this approach the dense local circuits of the cerebral cortex are seen as implementing a large set of practically randomly defined filters. When applied to reading out the TPC we have reported a lower performance as compared to using Euclidean distance as a result of the LSM's noise sensitivity (Knüsel et al., 2004). In addition to being less effective than a linear decoder, LSM is computationally expensive requiring an additional layer of hundreds of integrate and fire neurons, while performance strongly depends on the specific parameters settings which compromises generality. Given that TPC is consistent with current physiology we want to know whether an alternative approach can be defined that is more tuned to the specific properties of the TPC, i.e., its temporal structure.
A readout mechanism for temporal codes, such as TPC, could also be based on an analysis of the temporal signal over different frequency bands and resolutions. A population of readout neurons tuned to different spectral bands could be possibly capable to implement such a readout stage. In this scheme, the temporal information of TPC is mapped back into a spatial representation by cells responsive to different frequency bands and thus the spectral properties of their inputs. A suitable framework for modeling such a readout stage is the wavelet decomposition: a spectrum analysis technique that divides the frequency spectrum in a desirable number of bands using variable-sized regions (Stéphane, 1998). Higher processing stages in the neo-cortex could make use of such a scheme in order to capture information compressed and multiplexed in different frequency bands by preceding areas.
The wavelet transform is a biological plausible candidate and has already been extensively used for modeling cortical circuits in different areas (Stevens, 2004; Chi et al., 2005). The classic description of image processing in V1 is based on a two-dimensional Gabor wavelet transform (Daugman, 1980). Recently, two alternative wavelet-based models approximating the receptive field properties of V1 neurons in the discrete domain have been proposed, which show additional desirable features such as orthogonality (Saul, 2008; Willmore et al., 2008).
A one-dimensional wavelet transform can be interpreted as a strategy for reading out the different spectral components of the TPC that is equivalent to the wavelet-based models of V1 receptive fields (Jones and Palmer, 1987; Ringach, 2002). Thus, providing for a general encoding-decoding model that can be generalized to the whole of the neo-cortex given its relatively uniform anatomical organization. Furthermore, from both representation and implementation perspectives, orthogonal wavelets are a compact way of decomposing a signal where the frequency spectrum is divided in a dyadic manner: at each resolution level of the filtering process a new frequency band emerges represented by half of the wavelet coefficients presented in the previous resolution level. Thus, meeting one of the fundamental requirements of an efficient readout system: compactness.
Here, we combine the encoding mechanism of the TPC with decoder that is based on a one-dimensional, orthogonal, and discrete wavelet transform implemented by a biological plausible circuit. We show that the information provided by the TPC generated at an earlier neuronal processing level can be decoded in a compressed way by this wavelet read-out circuit. Furthermore, we show that these wavelet transforms can be performed by a plausible neuronal mechanism that implements the, so called, Haar wavelet (Haar, 1911; Papageorgiou et al., 1998; Viola and Jones, 2001). The simplicity and orthogonality of the Haar wavelet makes this readout process fast and compact in a implementation that requires only four neurons.
To investigate the validity of our hypothesis we first define a baseline for benchmarking the network's performance in a classification task. Benchmarking is done using a stimulus set of images based on artificially generated geometric shapes. To test the readout performance we evaluate how the information extracted across different sets of wavelet coefficients, covering orthogonal regions of the frequency spectrum, influences classification performance. The simulations are performed using two types of implementations: regular spiking and bursting neurons. We consider these two types of models in order to address the effects of spiking dynamics on the encoding and decoding performance of the model. These two types of spiking behaviors have also been observed in V1 pyramidal neurons (Hanganu et al., 2006; Iurilli et al., 2011).
We also investigate the speed of encoding-decoding of the proposed wavelet-based circuit in comparison to the method used in previous studies of TPC that are based purely on linear classifiers. In the last experiments, we explore the generality that the wavelet coefficients hold in forming prototypical representations of an object class that can be stored in working memory in fast object recognition tasks. In particular, we are concerned with the question of how high-level information generated by sensory processing streams can be flexibly stored and retrieved in long-term and working memory systems (Verschure et al., 2003; Duff et al., 2011).
One option for the memory storage problem would be a labeled line code where specific axon/synapse complexes are dedicated to specific stimuli and their components (Chandrashekar et al., 2006; Nieder and Merten, 2007). This approach, however, faces capacity limitations both in the amount of information stored and the physical location where it can be processed. Alternatively a purely temporal code, such as TPC, would be in this respect independent of the spatial organization of the physical substrate and allow the multiplexing of high-level information. We show that this latter scenario is feasible and can be realized with simple biologically plausible neuronal components.
Our results suggest that sensory processing hierarchies might well comprise sequences of spatio-temporal transformations that encode combinations of local stimulus features into perceptual classes using sequences of TPCs encoding and their wavelet decoding back to a spatial domain.
2. Materials and Methods
The model is divided in two stages: a model of the lateral geniculate nucleus (LGN) and a topographic map of laterally connected spiking neurons with properties found in the primary visual cortex V1 (Figure 1) (Wyss et al., 2003a,b). In the first stage we calculate the response of the receptive fields of LGN cells to the input stimulus, a gray scale image that covers the visual field. The approximation of the receptive field's characteristics is done convolving the input image with a difference of Gaussians operator (DoG) followed by a positive half-wave rectification. The positive rectified DoG operator resembles the properties of on LGN center-surround cells (Rodieck and Stone, 1965; Einevoll and Plesser, 2011). The LGN stage is a mathematical abstraction of known properties of this brain area and performs an edge enhancement of the input image. In the simulations we use a kernel ratio of 4:1, with a size of 10 × 10 pixels and variance σ= 1.5 (for the smaller Gaussian).
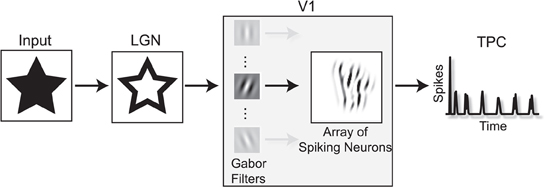
Figure 1. The TPC encoding model. In a first step, the input image is projected to the LGN stage where its edges are enhanced. In the next stage, the LGN output passes through a set of Gabor filters that resemble the orientation selectivity characteristics found in the receptive fields of V1 neurons. Here we show the output response of one Gabor filter as input for the V1 spiking model. After the image onset, the sum of the V1 network's spiking activity over time gives rise to a temporal representation of the input image. This temporal signature of the spatial input is the, so called temporal population code, or TPC.
The LGN signal is projected onto the V1 spiking model, where the coding concept is illustrated in Figure 2. The network is an array of N × N model neurons connected to a circular neighborhood with synapses of equal strength and instantaneous excitatory conductance. The transmission delays are related to the Euclidean distance between the positions of the pre- and post-synaptic neurons. The stimulus is continuously presented to the network and the spatially integrated spreading activity of the V1 units, as a sum of their action potentials, results in the so called TPC signal.
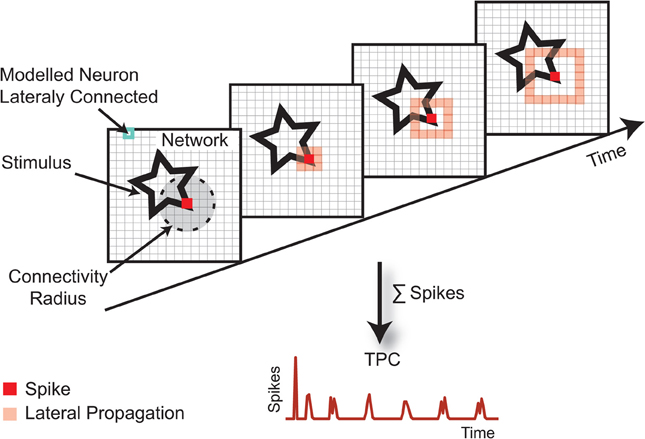
Figure 2. The TPC encoding paradigm. The stimulus, here represented by a star, is projected topographically onto a map of interconnected cortical neurons. When a neuron spikes, its action potential is distributed over a neighborhood of a given radius. The lateral transmission delay of these connections is 1 ms/unit. Because of these lateral intra-cortical interactions, the stimulus becomes encoded in the network's activity trace. The TPC representation is defined by the spatial average of the population activity over a certain time window. The invariances that the TPC encoding renders are defined by the local excitatory connections.
In the network, each neuron is approximated using the spiking model proposed by Izhikevich (Izhikevich, 2003). These model neurons are biologically plausible and computationally efficient as integrate-and-fire models (Izhikevich, 2004). Relying only on four parameters, our network can reproduce both regular (RS) and bursting (BS) spiking behavior using a system of ordinary differential equations of the form:
with the auxiliary after-spike resetting:
Here, v and u are dimensionless variables and a, b, c, and d are dimensionless parameters that determine the spiking or bursting behavior of the neuron unit and , where t is time. The parameter a describes the time scale of the recovery variable u. The parameter b describes the sensitivity of the recovery variable u to the sub-threshold fluctuations of the membrane potential v. The parameter c accounts for the after-spike reset value of v caused by the fast high-threshold K+, and d the after-spike reset of the recovery variable u caused by slow high-threshold NA+ and K+ conductances. The mathematical analysis of the model can be found in (Izhikevich, 2006).
The excitatory input I in Equation 1 consists of two components: first a constant driving excitatory input gi and second the synaptic conductances given by the lateral interaction of the units gc (t). So
For the simulations, we used the parameters suggested in (Izhikevich, 2004) to reproduce RS and BS spiking behavior (Figure 3). All the parameters used in the simulations are summarized in Table 1.
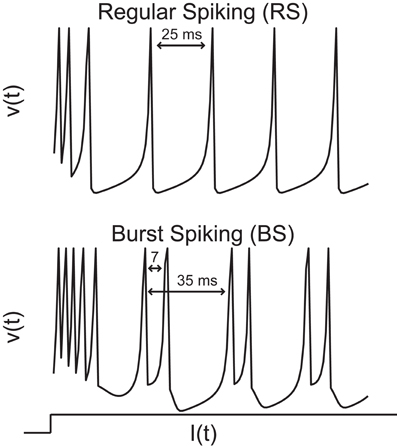
Figure 3. Computational properties of the two types of neurons used in the simulations: regular (RS) and burst spiking (BS). The RS neuron shows a mean inter spike interval of about 25 ms (40 Hz). The BS type displays a similar inter-burst interval with a within burst inter-spike interval of approximately 7 ms (140 Hz) every 35 ms (28 Hz).
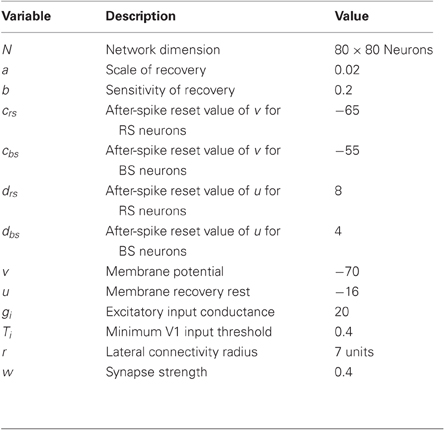
Table 1. Parameters used for the simulations.
The network architecture is composed of 24 populations of orientation selective neurons where a bank of Gabor filters are used to reproduce the characteristics of V1 receptive fields (Figure 1). The filters are divided in layers of eight orientations and three scales denoted by δ. The distance of the central frequency among the scales is 1/2 octave with a max frequency Fmax =1/10 cycles/pixel. The convolution with Gδ,Θ is computed at each time step and the output is truncated according to a threshold Ti ∈ [0,1], where the values above Ti are set to a constant driving excitatory input gi. Each unit can be characterized by its orientation selectivity angle Θ, its scale δ, and a bi-dimensional vector x ∈ R2 specifying the location of its receptive center within the input plane. So a column is denoted by u(x,Θ,δ).
The lateral connectivity between V1 units is exclusively excitatory with strength w. A unit ua (x,ϕ,δ) connects with ub if all of the following conditions are met:
- Be in the same population: Θa = Θb and δa = δb
- Have a different center position: xa ≠ xb
- Within a region of a certain radius: || xb − xa || < r
According to recent physiological studies, intrinsic V1 intra-cortical connections cover distances that represent regions of the visual space up to eight times the size of single receptive fields in V1 (Stettler et al., 2002). In our model we set the connectivity radius r to 7 units. The lateral synapses are of equal strength w and the transmission delays τa are proportional to || xb −xa || with 1 ms/cell.
The TPC is generated by summing the network activity in a time window of 128 ms. Finally, the output TPC vectors from different layers of orientation and scales are read out by the proposed wavelet circuit forming the decoded TPC vector used for the statistical analysis. In discrete-time, all the equations are integrated with Euler's method using a temporal resolution of 1 ms.
2.1. Neuronal Wavelet Circuit
The proposed neuronal wavelet circuit is based on discrete multi-resolution decomposition where each resolution reflects a different spectral range and uses the Haar wavelets as basis (Stéphane, 1998). Approximation Coefficients, or AC, are the high-scale, low-frequency components of the signal spectrum obtained by convolving the signal with the scale function ϕ. The Detail Coefficients, or DC, are the low-scale, high-frequency components giving by the wavelet function ψ. Each component has a time resolution matched to the wavelet scale that works as a filter.
The Haar wavelet ψ at time t is defined as:
and its associated scale function ϕ as:
In a biologically plausible implementation, the wavelet decomposition can be performed based on the activity of two short-term buffer cells B1 and B2 inhibited by an asymmetric delayed connection from cell A (Figure 4A). The buffer cells integrate rapid changes over a certain amount of time analogous to the scale function ϕ, from Equation 6. In our model, the buffer cells are modeled as discrete low-pass Finite Impulse Response (FIR) filters. They are equivalent to the scale function ϕ in the discrete domain. Buffer cells have been reported recently in other cortical areas such as the prefrontal cortex (Koene and Hasselmo, 2005; Sidiropoulou et al., 2009).
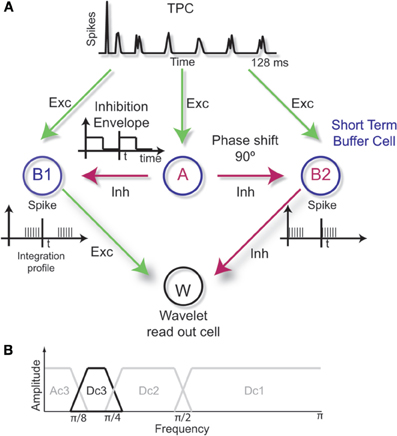
Figure 4. (A) Neuronal readout circuit based on wavelet decomposition. The buffer cells B1 and B2 integrate, in time, the network activity performing a low-pass approximation of the signal over two adjacent time windows given by the asynchronous inhibition received from cell A. The differentiation performed by the excitatory and inhibitory connections to W gives rise to a band-pass filtering process analogous to the wavelet detail levels. (B) An example of band-pass filtering performed by the wavelet circuit where only the frequency range corresponding to the resolution level Dc3 is kept in the spectrum.
In our model, the buffer cells receive an inhibitory input from A that defines the integration envelope. The inhibition has to be over a time period of t and with a shift in phase of π/2 between A to B2. Therefore, B1 and B2 will have their integration profile shifted in time by t. When the inhibition is synchronized in time with the integration profile of the buffer cells, the period 2t determines the low-frequency cutoff or the resolution level l associated with the Haar scale function ϕ, Equation 6 (low-pass filter). If both B1 and B2 are excitatory, the projection to cell W gives rise to the approximation level A1. On the other hand, if one buffer cell is inhibitory, as in the example of Figure 4A, the detail level Dl+1 is obtained by cell W as performed by the Haar wavelet function itself (Equation 5). In our model, the inhibition is modeled as discrete high-pass FIR filters. The combination of low-pass and high-pass filters in cascade produces band-pass filters. Therefore, the readout can be optimized to specific ranges of the frequency spectrum (Figure 4B).
2.2. Stimulus Set
The stimulus set is based on abstract geometric forms as used previously (Wyss et al., 2003b). In a circular path with a diameter of 40 pixels, five uniformly distributed vertices can connect to each other with equal probability, defining the shape of a stimulus class, (Figure 5). The different objects forming a class are generated by jittering the position of the vertices and the default line thickness of 4 pixels. We defined a total of 10 classes for the experiments with 50 exemplars per class.
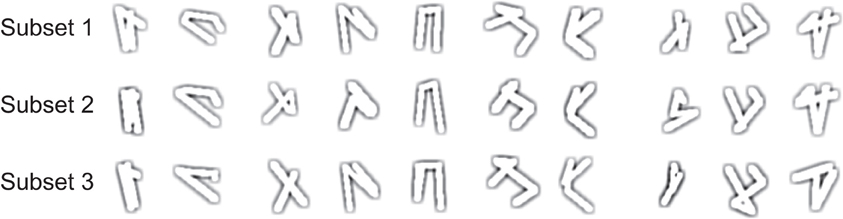
Figure 5. The stimulus classes used in the experiments after the edge enhancement of the LGN stage.
For the experiments we subdivide the data-set in three subsets with increasing complexity by varying the amount of jitter in the vertices' position and thickness of the connected line segments. The values of the jitter are given by uniform randomly distributed factors with zero mean and standard deviation equal to 0.03, 0.04, and 0.05 for the vertices' position and 0.018, 0.021, and 0.025 the thickness of each subset, respectively. We used subset 1 with 50 stimuli per class as training and classification set. In the case where subset 1 is used for classification, 50% of the stimuli are randomly assigned as training set and the other part used for classification. The subsets 2 and 3 are only used as classification set. In this case the subset 1 is entirely used for training. Therefore, training stimuli are not used for classification and vice-versa.
For estimating the degree of similarity among the images we used the normalized Euclidean distance of the pixels. The normalization is done as follows: a given stimulus has distance equal to zero if it is equal to its class prototype and one if it is the globally most distant exemplar over all subsets. The image prototype is defined by the five vertices that define the geometry of a class with no jitter applied.
2.3. Cluster Algorithm
For the classification we used the following algorithm. The network's responses to stimuli from C stimulus classes S1, S2, …, SC are assigned to C response classes R1, R2, …, RC of the training set, yielding a C × C hit matrix N(Sα, Rβ), whose entries denote the number of times that a stimulus from class Sα elicits a response in class Rβ. Initially, the matrix N(Sα, Rβ) is set to zero. For each response r ∈ Sα, we calculate the Euclidean distance of r to the responses r′ ≠ r elicited by stimuli of class Sγ:
where 〈.〉 denotes the average among the temporal Euclidean distances between r and r′ denoted by ρ(r, r′). The response r is classified into the response-class Rβ for that is minimal, and N(Sα, Rβ) is incremented by one. The overall classification ratio in percentage is calculated summing the diagonal of the N(Sα, Rβ) and dividing by the total number of elements in the classification set R. We chose the same metrics that was used in previous studies to establish a direct comparison between the results over different scenarios.
3. Results
We start analyzing the properties of the proposed stimulus set detailed in section “Stimulus set”. Then, we run network simulations in order to establish a baseline classification ratio in an stimulus detection task. In the follow step we use the wavelet circuit to read out the TPC signal over different frequency bands and compare the classification results to the previously established baseline. In order to address the effect of spiking modality on the decoding mechanism we run separate simulations with two different kinds of neurons: Regular and Burst Spiking (Equations 1 and 2). In the subsequent experiment, we investigate how the speed of encoding is affected by reading out the TPC using a neuronal implementation of the wavelet circuit. Subsequently, we show how the dense wavelet representation provided by our decoding circuit can be used to create class prototypes that can be used to flexibly define the content of a memory system. Finally, we perform an analysis of the similarity relationships between the TPC encoding and the representation of the stimuli in the wavelet and in the spatial domain respectively. The model parameters used for all simulations are specified in section “Materials and methods” and in Table 1.
3.1. Stimulus Set Similarity Properties
We use an algorithmic approach to parametrically define our stimulus classes. Every class is defined around a prototype. (Figure 6A upper row). We measure how similar the exemplars from the classification sets are to the respective image class prototype (see methods, section “Stimulus set”). The median Euclidian distance of stimulus set 1–3 are 0.59, 0.64, and 0.70, respectively. This increasing median translates in an increasing difficulty in the classification of the stimulus sets.
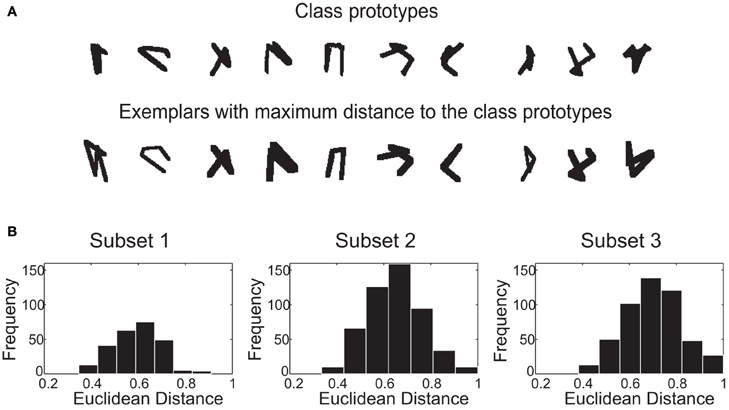
Figure 6. The stimulus set. (A) Image-based prototypes (no jitter in the vertices applied) and the globally most different exemplars with normalized distance equal one. The distortions can be very severe as in the case of class number one. (B) Histogram of the normalized Euclidean distances between the class exemplars and the class prototypes in the spatial domain.
3.2. Baseline and Network Performance
As a reference for further experiments we first establish a baseline classification ratio. The baseline is defined by applying the clustering algorithm described previously (section “Cluster algorithm”) directly in the spatial domain of the stimulus set. In this scenario, the classification is performed over the pixel intensities of the centered and edge enhanced images (Figure 7). As to be expected, the classification performance decreases with an increase of the geometric variability of the three subsets used in the experiments. For subset one, two, and three the classification ratio reaches 91%, 88%, and 82%, respectively.
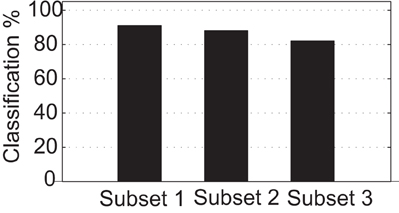
Figure 7. Baseline classification ratio using Euclidean distance among the images from the stimulus set in the spatial domain.
3.3. Wavelet Circuit Readout
We want to now assess the classification performance of compression capacity of the wavelet circuit we have proposed (section “Neuronal wavelet circuit”). We consider a range of frequency resolutions in a dyadic manner using the wavelet resolution levels Ac5 corresponding to 0–15.5 Hz, Dc5 from 15.5 to 31 Hz, Dc4 from 31 to 62 Hz, Dc3 from 62 to 125 Hz, Dc2 from 125 to 250 Hz and finally Dc1 from 250 to 500 Hz. In the simulations, we increase the inhibition and integration time of the cells A, B1, and B2 (Figure 5) in order to explore the classification performance in the stimulus classification task of the network.
The results using RS neurons show that the classification performance has a peak in the frequency range from 62 Hz to 125 Hz equivalent to the, so called, Dc3 level in the wavelet domain where 91%, 83%, and 74% of the TPC encoded stimuli are correctly classified for the subsets one, two, and three, respectively (Figure 2). In comparison, using BS neurons the classification performance has a peak in the frequency range from 15 Hz to 31 Hz equivalent to the, so called, Dc5 level in the wavelet domain where 92%, 82%, and 74% of the responses are correctly classified for the subsets one, two, and three, respectively (Figure 8). Reading out the TPC without the wavelet circuit, i.e., using the integrated spiking activity over time without the wavelet representation, we achieve a classification ratio for subsets one, two, and three of 88%, 79%, and 75 % for RS neurons and 87%, 80%, and 74 % for BS neurons. Thus, the wavelet circuit adds a marginal improvement to the readout of the TPC signals as compared to the control condition for the RS neurons, in particular for the easier stimulus set, while the BS version of the model does not show a marked increase in classification performance.
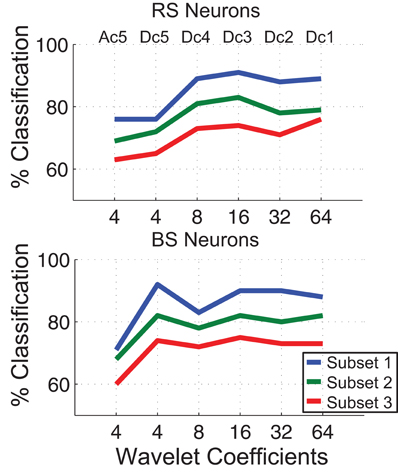
Figure 8. Comparison among the correct classification ratio for different resonance frequencies of the wavelet filters for both types of neurons RS and BS. The frequency bands of the TPC signal is represented by the wavelet coefficients Dc1 to Ac5 in a multi-resolution scheme. The network time window is 128 ms.
However, while maintaining classification performance nearly the same, the dyadic property of the wavelet discrete transform compresses the length of the temporal signal by a factor of 8 and 32 using the Dc3 level and the Dc5 levels for RS and BS neurons, respectively. So the information encoded over the 128 ms of stimulus presentation is captured by only a few wavelet coefficient, in a compressed way.
In comparison, with the benchmark results (Figure 7), the wavelet circuit readout provides slightly lower classification ratio. However, if we look at the BS network numbers, the TPC wavelet readout can generate a reliable representation of the input image with 24 × 4 coefficients. In comparison, the 80 × 80 pixels of the original input image used for the benchmark is extremely compressed. The compression factor is about 66 times without a significant loss in classification performance. Therefore, the wavelet coefficients provide for a compact representation of the stimuli in a specific region of the frequency spectrum.
3.4. Classification Speed
A key feature of TPC is the encoding speed. It has been shown in previous TPC studies that the speed of encoding is compatible with the speed of processing observed in the mammalian visual system (Thorpe et al., 1996; Wyss et al., 2003b; Töllner et al., 2011). Here we investigate how fast the information transmitted by the TPC is captured by the wavelet coefficients. We use the mutual information measure (Victor and Purpura, 1999) to quantify the amount of transmitted information for a varying length of the signal interval of all the 24 network layers used to calculate the Euclidean distance (Figure 9). The mutual information calculation is performed using the wavelet coefficients generated by the readout circuit. We also compare the speed of encoding between the TPC signal in the temporal domain against the readout version based on the wavelet coefficients. For RS neurons, the wavelet coefficients that lead to maximum classification performance are localized in the frequency interval from 62 Hz to 125 Hz, equivalent to the resolution level Dc3. For BS neurons, the frequency interval is in a lower range from 15 Hz to 31 Hz, equivalent to the resolution level Dc5. In these frequency ranges the maximum classification performance is achieved as shown in the previous section (Figure 8).
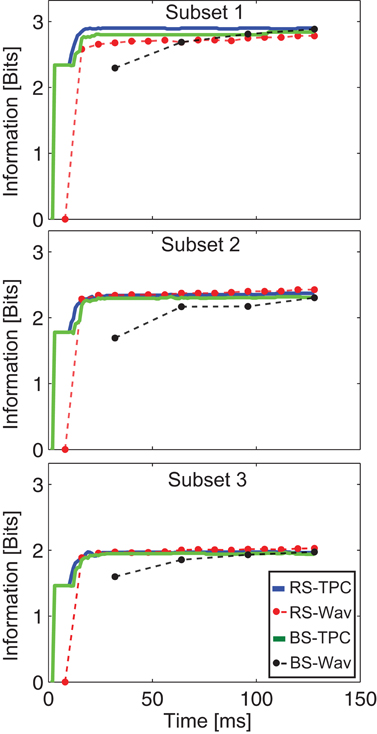
Figure 9. Speed of encoding. Number of bits encoded by the network's activity trace as a function of time. The RS-TPC and BS-TPC curves represent the bits encoded by the network's activity trace without the wavelet circuit. The RS-Wav and BS-Wav correspond to the bits encoded by the wavelet coefficients using the Dc3 resolution level for RS neurons and the Dc5 for BS neurons, respectively. For a time window of 128 ms the Dc3 level has 16 coefficients and the Dc5 has only 4 coefficients. The dots in the figure represent the moment in time where the coefficients are generated.
We observe that the number of bits encoded over the time window of 128 ms is nearly the same when comparing the non-filtered TPC signals (RS-TPC and BS-TPC, Figure 3) and the signals captured by the wavelet readout (RS-Wav and BS-Wav, Figure 9). However, in the case of the BS neurons the speed of encoding is slower when the signal is decoded by the wavelet circuit. This effect is due to the longer time constant of the buffer cells B1 and B2 to integrate and differentiate the signal at this resolution level and, therefore, to compute the wavelet coefficients. The buffer cells need 32 ms to compute the first wavelet (Figure 9). In case of the RS neurons more than 90% of total information was captured within the second wavelet coefficient, or 16 ms after stimulus onset. Thus, the effect of the neuronal wavelet circuit on the speed of encoding depends both on the spiking behavior of the encoders and on the frequency range at which the signal is read out.
3.5. Prototype-Based Classification
In the last step, we investigate whether the wavelet representation can be generalized to the generation of prototypes from the stimulus classes. The aim of the experiment is to create prototypes learned from the training set that can be stored in memory and retrieved in a future classification task. To construct such representations we build class prototypes based on the wavelet coefficients of the N stimuli making up the training set. For each of the 10 stimulus classes we calculate the median over the wavelet coefficients among the 50 response exemplars that define a training class (subset one). Hence, for each class we have a vector of wavelet coefficients that define the class specific prototype, i.e., a representation of a class in the wavelet domain. Based on the classification experiments we use for RS neurons the coefficients from the Dc3 level and for BS neurons the Dc5 levels. The Fourier transform of the prototypes reveals the frequency components that comprise the prototypes for the two different neuron models we consider (Figure 10).
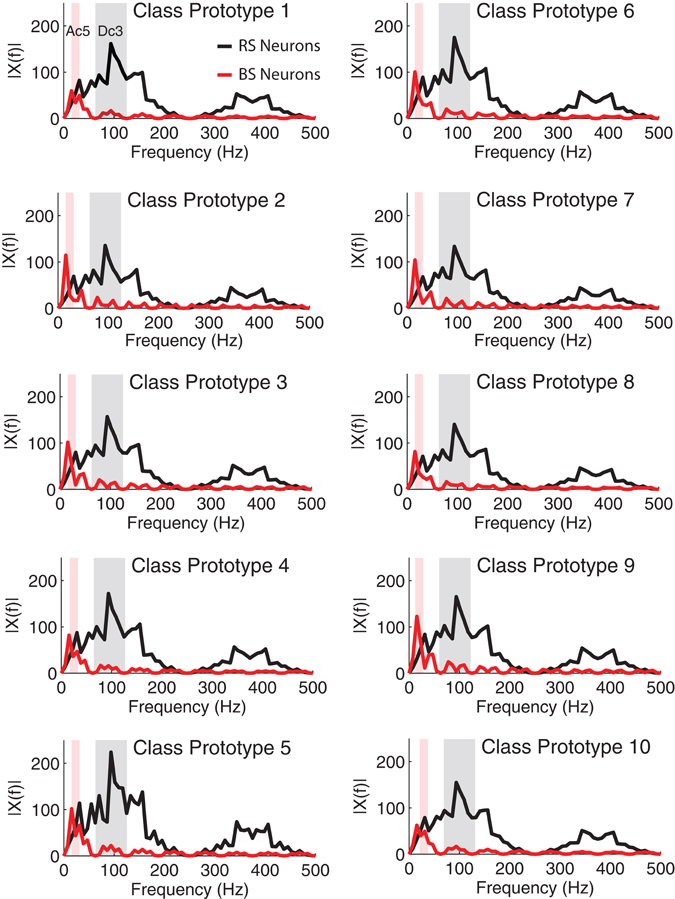
Figure 10. Single-sided amplitude spectrum of the wavelet prototype for each stimulus class used in the simulations. The signals x(t) where reconstructed in time using the wavelet coefficients from the Dc3 and Dc5 levels for RS and BS neurons, respectively. The shaded areas shows the optimal frequency response of the Dc3 level (62–125 Hz) and of the Dc5 level (15.5–31 Hz). The less pronounced responses around 400 Hz are aliasing effects due to the signal reconstruction to calculate the Fourier transform (see discussion).
We present the classification set to the network and calculate the Euclidean distance between the output responses of the wavelet network within the ten previously created prototypes. For the classification a simple criterion is adopted, the smallest Euclidean distance defines the class to which the stimulus is assigned.
The results for the RS neurons show that 86%, 82%, and 75% of the responses are correctly classified (diagonal entries) by the wavelet prototypes for the subset one, two, and three, respectively. For the BS neurons we observe that 91%, 81%, and 72% of the responses are correctly classified for the subset one, two and three, respectively (Figure 11). The classification ratios are consistent with the results previously presented in section “Wavelet circuit readout” using the cluster algorithm (see Methods, “Cluster algorithm”). However, the number of calculations in the classification stage is drastically reduced because each class is represented by a prototype vector of wavelet coefficients instead of a collection of vectors. This result suggest that with a simple algorithm the wavelet representation can be integrated into a compact description of a complex spatially organized stimulus. Therefore, the information provided by densely coupled cortical neurons can be learned and efficiently stored in memory independently of the details of their spiking behavior.
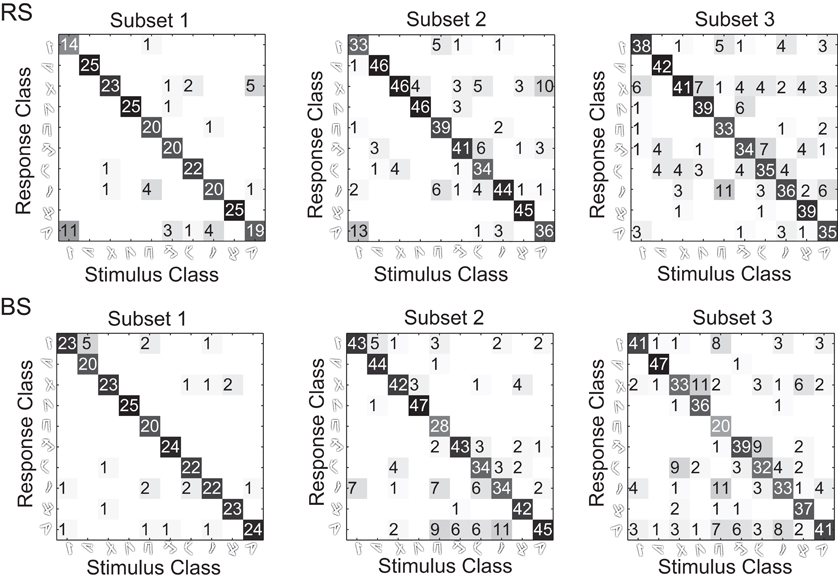
Figure 11. Prototype-based classification hit matrices. For each class in the training we average the wavelet coefficients to form class prototypes. In the classification process, the euclidean distance between the classification set and the prototypes are calculated. A stimulus is assigned to a the class with smaller euclidean distance to the respective class prototype.
In the second part of the experiment, we present a geometric and spatio-temporal analysis of the underlying neural code. We perform a correlation analysis among the stimuli misclassified using the wavelet prototypes in both wavelet and spatial domains. We want to understand whether the geometric deformations applied in the spatial domain are directly translated to the temporal representation captured by the wavelet coefficients. This analysis is performed using the exemplars that where misclassified using the wavelet prototypes approach. We calculate the normalized Euclidean distances in the spatial domain between each stimulus of the misclassified set and its prototype for each class. Second, we apply the same distance measure but using the wavelet representation of the misclassified stimuli and the prototypes. Finally, we make a correlation among the distance values. (Figure 12). The results show a positive correlation over the Euclidian distances in the two domains suggesting that the amount of geometric deformations in the spatial domain is directly translated to the wavelet representation of the temporal code. The correlation is higher for RS neurons with a value of 0.62 against 0.50 for BS neurons (p < 0.001). The positive correlation between both domains validates the wavelet prototypes and therefore the overall TPC transformation structure as an equivalent representation of the stimuli classes that conserves the relevant spatial information.
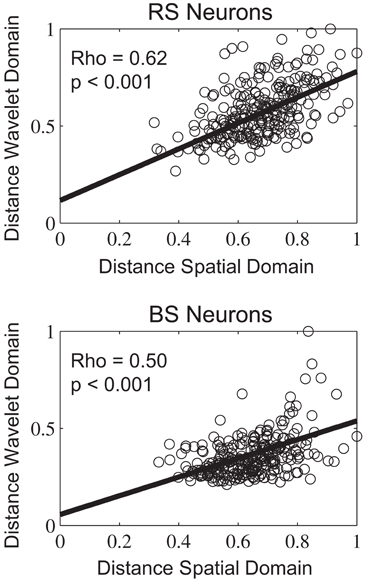
Figure 12. Distribution of errors in the wavelet-based prototype classification with relation to the Euclidean distances within the prototyped classes.
4. Discussion
We have shown previously that in a model of the sensory cortex, the representation of a static stimulus can be generated using the temporal dynamics of a neuronal population or Temporal Population Code. Here we have shown that this temporal code has a specific signature in the phase relationships among the active neurons of the underlying substrate. This signal is efficiently used to pass a complete and dense amount of information that can be decoded in further areas through a sub-set of wavelet coefficients.
The TPC is a relevant hypothesis on the encoding of sensory events given its consistency with cortical anatomy and recent physiology. Since its introduction, however, a persistent problem has been to extend this concept to a readout stage that would be neurobiologically compatible. A priori it was not clear whether a wavelet transform would be suitable because it implies a specific structure in the TPC representation itself.
We have shown that decoding of the TPC can be based on wavelet transforms. Using a systematic spectral investigation of the TPC signal we observed that the Haar basis seems to be a feasible choice providing robust and reliable decoding. The achieved results associated with the Haar wavelet are consistent with previous studies where Haar filters are used to preprocess neuronal data prior to a linear discriminant analysis (Laubach, 2004). In comparison with the original TPC readout the neuronal wavelet circuit proposed here showed the same encoding performance for regular spiking neurons as compared to the algorithmic version. However, for bursting neurons the wavelet readout had a slower speed of encoding in comparison with the original TPC. Therefore, the details of the readout mechanism such as its integration time constant and its wavelet resolution level depend on the spiking dynamics.
The specific geometric characteristics of each stimulus class could be captured in a very compact way using the wavelet filters. We showed that a visual stimulus can be represented and further classified using a strongly compressed signal based on the wavelet coefficients. Reading out the network based on regular spiking neurons using wavelet coefficients yielded a compression factor of 16.6 times the original image size. In the case of the bursting neurons the compression ratio was even higher reaching 66 times the original image size. Therefore, the spatial to temporal transformation of the TPC model combined with the efficient wavelet readout circuit can provide for a robust and compact representation of sensory inputs for different spiking modalities.
We have performed a detailed analysis of the misclassified stimuli in order to better understand the similarity conserving misclassifications we observe. We found a positive correlation among the geometric distortions between the spatial and temporal domain, represented by the wavelet coefficients. These findings suggest that the deformations in the spatial domain were directly translated into the wavelet domain and, therefore, responsible for the misclassifications observed. This result reinforces the direct relationship present between the geometric and spatio-temporal portions of the underlying neural code and its decoding.
Our results also suggest that specific axon/synapse complexes dedicated to specific features are not needed to successfully encode visual stimuli. We have shown that the efficient structure of an orthogonal basis like the Haar wavelet, can be implemented by a neuronal circuit (see Figure 4), with low computational cost, low latency and thus in a real-time system. The wavelet filters as implemented with buffer neurons can be changed on line depending on what kind of information needs to be retrieved and its specific frequency range. This property allows multiplexing high-level information from the visual input and flexible storage and retrieval of information by a memory system. Indeed, recent experiments have shown that distinct activity patterns overlaid in primary visual cortex individually signal motion direction, speed, and orientation of object contours within the same network at the same time (Onat et al., 2011). We speculate that in a non-static scenario other stimulus characteristics such as motion speed and direction could be extracted from other frequency bands using the same wavelet circuit.
The optimal resolution level for the wavelet readout was determined through an systematic investigation based on the correlation between compression and performance (Figure 8). In the case of regular spiking neurons we observed a maximum classification performance in the Dc3 resolution level, or in the frequency range from 62 Hz up to 125 Hz. While for the bursting neurons it falls in the range of 15.5 Hz to 31 Hz. The wavelet circuit itself does not define the choice of the wavelet resolution. However, we could show that in the TPC framework the proposed readout circuit can capture different properties of visual stimuli that travel through the sensory processing stream at different frequency ranges. In our case the sensitivity of the wavelet circuit will depend on the feed-forward receptive fields combined with the phase relationship imposed by the inhibitory units. The mechanisms used by higher cognitive areas to manipulate the frequency ranges and the kind of information carried in these temporal information channels are currently not clear and are subject of follow up studies.
In comparison to the LSM model previously applied to read out the TPC, the wavelet circuit is computationally inexpensive and requires only four neurons to be implemented. Although the optimal readout performance also depends on specific parameters to set the readout frequency range the generality of the model is not affected as in the case of the LSM. Our results suggest that this optimal frequency range is determined by the spiking behavior of the neurons in the network.
From a technical perspective, one issue related to orthogonal wavelets is the aliasing effect (Chen and Wang, 2001) which could insert redundant spectral content in the TPC signals leading to reduced classification performance. This property can be addressed by increasing the vanishing moments of the wavelet basis, the effects of aliasing is smoothed, increasing the orthogonality between the spectral sub-bands. However, the filtering process would get more sophisticated and would require more than two buffer cells. In contrast, the Haar based readout circuit is computationally efficient.
To evaluate the effects of different spiking behaviors on the proposed readout circuit, we used a different and more physiologically constrained neuron model from previous TPC studies. In comparison, the overall dynamics of the previous neuron model are significantly different from the model used here. For instance, the model used in previous studies (Wyss et al., 2003b) has a strong onset response with about 50% more spikes in the first 20 ms after stimulus onset as compared to the model used in the current study that includes mechanisms for spike adaptation. In addition, we observed significant differences in the sub-threshold fluctuations and the membrane potential envelope between these neuron models. However, the overall results reported here are compatible with those previously reported (Wyss et al., 2003a,b). Based on that, we conclude that TPC and the proposed readout mechanism are robust with respect to the details of the spiking dynamics and the overall biophysical properties of the membrane potential envelope. We are not aware of any other encoding-decoding model of cortical dynamics that shows a similar generality.
The performance measure we use, essentially based on classification, is a well-established standard (Victor and Purpura, 1999) in the literature, based on Euclidean distance. We looked both at classification performance and information encoded. In order to develop the specific point of this paper, the decoding of the TPC using wavelets, we adhere to this standard. Hence, the results should be seen as relative to those established and published for the TPC, contributing to the unresolved issue of how a biologically plausible decoding can take place. We demonstrate that a Wavelet-like transform can fulfill the requirements for an efficient readout mechanism, thus generating a specific hypothesis on the role of the sparse inter-areal connectivity found in the neo-cortex.
We have shown that the dense local connectivity of the neo-cortex can transform the spatial organization of their inputs into a compact TPC. By virtue of its multiplexing capability this code can be transmitted to downstream decoding areas using the sparse long-range connections of the cortex. We have shown that in these downstream areas the TPC can be decoded and further compressed using a wavelet based readout system. Our results show that the TPC information is organized in a specific subset of frequency space creating virtual communication channels that can serve working memory systems. Thus, TPC does not only provide a functional hypothesis on the specifics of cortical anatomy but it also provides a computational substrate for a functional neuronal architecture that is organized in time rather than in space (Buzsáki, 2006).
Conflict of Interest Statement
The authors declare that the research was conducted in the absence of any commercial or financial relationships that could be construed as a potential conflict of interest.
5. Acknowledgments
This work was supported by EU FP7 projects EFAA (FP7-ICT-270490) and GOAL-LEADERS (FP7-ICT-97732).
References
Barak, O., Tsodyks, M., and Romo, R. (2010). Neuronal population coding of parametric working memory. J. Neurosci. 30, 9424–9430.
Benucci, A., Frazor, R. A., and Carandini, M. (2007). Standing waves and traveling waves distinguish two circuits in visual cortex. Neuron 55, 103–117.
Carlsson, M. A., Knusel, P., Verschure, P. F., and Hansson, B. S. (2005). Spatio-temporal Ca2+ dynamics of moth olfactory projection neurones. Eur. J. Neurosci. 22, 647–657.
Chandrashekar, J., Hoon, M. A., Ryba, N. J. P., and Zuker, C. S. (2006). The receptors and cells for mammalian taste. Nature 444, 288–294.
Chen, S-H., and Wang, J.-F. (2001). “Extraction of pitch information in noisy speech using wavelet transform with aliasing compensation,” in Acoustics, Speech, and Signal Processing, 2001 Proceedings, Vol. 1, (Salt Lake City, USA), 89–92.
Chi, T., Ru, P., and Shamma, S. A. (2005). Multiresolution spectrotemporal analysis of complex sounds. J. Acoust. Soc. Am. 118, 887–906.
Cyrus, P. B., Kraus, B. J., Narayan, R., Maddox, R. K., and Sen, K. (2008). Invariance and sensitivity to intensity in neural discrimination of natural sounds. J. Neurosci. 28, 6304–6308.
Daugman, J. (1980). Two-dimensional spectral analysis of cortical receptive field profiles. Vision Res. 20, 847–856.
Doetsch, G. S. (2000). Patterns in the brain. Neuronal population coding in the somatosensory system. Physiol. Behav. 69, 187–201.
Duff, A., Fibla, M. S., and Verschure, P. F. (2011). A biologically based model for the integration of sensory-motor contingencies in rules and plans: a prefrontal cortex based extension of the Distributed Adaptive Control architecture. Brain Res. Bull. 85, 289–304.
Einevoll, G. T., and Plesser, H. E. (2011). Extended difference-of-Gaussians model incorporating cortical feedback for relay cells in the lateral geniculate nucleus of cat. Cogn. Neurodyn. 1–18. [Epub ahead of print].
Fukushima, K. (1980). Neocognitron: a self organizing neural network model for a mechanism of pattern recognition unaffected by shift in position. Biol. Cybern. 36, 193–202.
Hanganu, I. L., Ben-Ari, Y., and Khazipov, R. (2006). Retinal waves trigger spindle bursts in the neonatal rat visual cortex. J. Neurosci. 26, 6728–6736.
Hung, C. P., Kreiman, G., Poggio, T., and DiCarlo, J. J. (2005). Fast readout of object identity from macaque inferior temporal cortex. Science 310, 863–866.
Iurilli, G., Benfenati, F., and Medini, P. (2011). Loss of visually driven synaptic responses in layer 4 regular-spiking neurons of rat visual cortex in absence of competing inputs. Cereb. Cortex, 304. [Epub ahead of print].
Izhikevich, E. M. (2004). Which model to use for cortical spiking neurons? IEEE Trans. Neural Netw. 15, 1063–1070.
Izhikevich, E. M. (2006). Dynamical Systems in Neuroscience: The Geometry of Excitability and Bursting. 1 Edn. (Cambridge: The MIT Press).
Jones, J. P., and Palmer, L. A. (1987). An evaluation of the two-dimensional Gabor filter model of simple receptive fields in cat striate cortex. J. Neurophysiol. 58, 1233–1258.
Knusel, P., Carlsson, M. A., Hansson, B. S., Pearce, T. C., and Verschure, P. F. M. J. (2007). Time and space are complementary encoding dimensions in the moth antennal lobe. Network 18, 35–62.
Knüsel, P., Wyss, R., König, P., and Verschure, P. F. M. J. (2004). Decoding a temporal population code. Neural Comput. 16, 2079–2100.
Koene, R. A., and Hasselmo, M. E. (2005). An integrate-and-fire model of prefrontal cortex neuronal activity during performance of goal-directed decision making. Cereb. Cortex 15, 1964–1981.
Laubach, M. (2004). Wavelet-based processing of neuronal spike trains prior to discriminant analysis. J. Neurosci. Methods 134, 159–168.
Lukoševičius, M., and Jaeger, H. (2009). Reservoir computing approaches to recurrent neural network training. Comput. Sci. Rev. 3, 127–149.
Luvizotto, A., Rennó-Costa, C., Pattacini, U., and Verschure, P. F. M. J. (2011). “The encoding of complex visual stimuli by a canonical model of the primary visual cortex: temporal population coding for face recognition on the iCub robot,” in IEEE International Conference on Robotics and Biomimetics, (Thailand), 313–318.
MacEvoy, S. P., Tucker, T. R., and Fitzpatrick, D. (2009). A precise form of divisive suppression supports population coding in the primary visual cortex. Nat. Neurosci. 12, 637–645.
Meyers, E. M., Freedman, D. J., Kreiman, G., Miller, E. K., and Poggio, T. (2008). Dynamic population coding of category information in inferior temporal and prefrontal cortex. J. Neurophysiol. 100, 1407–1419.
Nieder, A., and Merten, K. (2007). A labeled-line code for small and large numerosities in the monkey prefrontal cortex. J. Neurosci. 27, 5986–5993.
Onat, S., Nortmann, N., Rekauzke, S., König, P., and Jancke, D. (2011). Independent encoding of grating motion across stationary feature maps in primary visual cortex visualized with voltage-sensitive dye imaging. Neuroimage 55, 1763–1770.
Papageorgiou, C. P., Oren, M., and Poggio, T. (1998). A General Framework for Object Detection. (Bombay: Narosa Publishing House).
Riesenhuber, M., and Poggio, T. (1999). Hierarchical models of object recognition in cortex. Nat. Neurosci. 2, 1019–1025.
Ringach, D. L. (2002). Spatial structure and symmetry of simple-cell receptive fields in macaque primary visual cortex. J. Neurophysiol. 88, 455–463.
Rodieck, R. W., and Stone, J. (1965). Analysis of receptive fields of cat retinal ganglion cells. J. Neurophysiol. 28, 833.
Samonds, J. M., and Bonds, A. B. (2004). From another angle: differences in cortical coding between fine and coarse discrimination of orientation. J. Neurophysiol. 91, 1193–1202.
Saul, A. B. (2008). Temporal receptive field estimation using wavelets. J. Neurosci. Methods 168, 450–464.
Serre, T., Wolf, L., Bileschi, S., Riesenhuber, M., and Poggio, T. (2007). Robust object recognition with cortex-like mechanisms. IEEE Trans. Pattern Anal. Mach. Intell. 29, 411–426.
Sidiropoulou, K., Lu, F-M., Fowler, M. A., Xiao, R., Phillips, C., Ozkan, E. D., Zhu, M. X., White, F. J., and Cooper, D. C. (2009). Dopamine modulates an mGluR5-mediated depolarization underlying prefrontal persistent activity. Nat. Neurosci. 12, 190–199.
Sporns, O., and Zwi, J. D. (2004). The small world of the cerebral cortex. Neuroinformatics 2, 145–162.
Stettler, D. D., Das, A., Bennett, J., and Gilbert, C. D. (2002). Lateral connectivity and contextual interactions in macaque primary visual cortex. Neuron 36, 739–750.
Stevens, C. F. (2004). Preserving properties of object shape by computations in primary visual cortex. Proc. Natl. Acad. Sci. U.S.A. 101, 15524–15529.
Thorpe, S., Fize, D., and Marlot, C. (1996). Speed of processing in the human visual system. Nature 381, 520–522.
Töllner, T., Zehetleitner, M., Gramann, K., and Müller, H. J. (2011). Stimulus saliency modulates pre-attentive processing speed in human visual cortex. PloS One 6:e16276. doi: 10.1371/journal.pone.0016276
Verschure, P. F. M. J., Voegtlin, T., and Douglas, R. J. (2003). Environmentally mediated synergy between perception and behaviour in mobile robots. Nature 425, 620–624.
Victor, J. D., and Purpura, K. (1999). Estimation of information in neuronal responses. Trends Neurosci. 22, 543.
Viola, P., and Jones, M. (2001). “Rapid object detection using a boosted cascade of simple features” in IEEE Comput. Soc, Vol. 1, (Kauai, HI), 511–518.
Willmore, B., Prenger, R. J., Wu, M. C., and Gallant, J. L. (2008). The berkeley wavelet transform: a biologically inspired orthogonal wavelet transform. Neural Comput. 20, 1537–1564.
Wyss, R., Konig, P., and Verschure, P. F. M. J. (2003a). Invariant representations of visual patterns in a temporal population code. Proc. Natl. Acad. Sci. U.S.A. 100, 324–329.
Keywords: temporal coding, visual system, wavelet transform, pattern recognition, spike neural network, Haar wavelets
Citation: Luvizotto A, Rennó-Costa C and Verschure PFMJ (2012) A wavelet-based neural model to optimize and read out a temporal population code. Front. Comput. Neurosci. 6:21. doi: 10.3389/fncom.2012.00021
Received: 26 October 2011; Accepted: 20 March 2012;
Published online: 03 May 2012.
Edited by:
Jay Hegdé, Georgia Health Sciences University, USAReviewed by:
Bo Cao, Neuroscience Program in Boston University, USAShyam Diwakar, Amrita University, India
Copyright: © 2012 Luvizotto, Rennó-Costa and Verschure. This is an open-access article distributed under the terms of the Creative Commons Attribution Non Commercial License, which permits non-commercial use, distribution, and reproduction in other forums, provided the original authors and source are credited.
*Correspondence: Paul F. M. J. Verschure, Laboratory of Synthetic Perceptive Emotive and Cognitive Systems – SPECS, Universitat Pompeu Fabra, Carrer Roc Boronat, 138, 08018 Barcelona, Spain. e-mail: paul.verschure@upf.edu