Persistence and storage of activity patterns in spiking recurrent cortical networks: modulation of sigmoid signals by after-hyperpolarization currents and acetylcholine
- Graduate Program in Cognitive and Neural Systems, Center for Adaptive Systems, Center of Excellence for Learning in Education, Science, and Technology, Center for Computational Neuroscience and Neural Technology, Boston University, Boston, MA, USA
Many cortical networks contain recurrent architectures that transform input patterns before storing them in short-term memory (STM). Theorems in the 1970's showed how feedback signal functions in rate-based recurrent on-center off-surround networks control this process. A sigmoid signal function induces a quenching threshold below which inputs are suppressed as noise and above which they are contrast-enhanced before pattern storage. This article describes how changes in feedback signaling, neuromodulation, and recurrent connectivity may alter pattern processing in recurrent on-center off-surround networks of spiking neurons. In spiking neurons, fast, medium, and slow after-hyperpolarization (AHP) currents control sigmoid signal threshold and slope. Modulation of AHP currents by acetylcholine (ACh) can change sigmoid shape and, with it, network dynamics. For example, decreasing signal function threshold and increasing slope can lengthen the persistence of a partially contrast-enhanced pattern, increase the number of active cells stored in STM, or, if connectivity is distance-dependent, cause cell activities to cluster. These results clarify how cholinergic modulation by the basal forebrain may alter the vigilance of category learning circuits, and thus their sensitivity to predictive mismatches, thereby controlling whether learned categories code concrete or abstract features, as predicted by Adaptive Resonance Theory. The analysis includes global, distance-dependent, and interneuron-mediated circuits. With an appropriate degree of recurrent excitation and inhibition, spiking networks maintain a partially contrast-enhanced pattern for 800 ms or longer after stimuli offset, then resolve to no stored pattern, or to winner-take-all (WTA) stored patterns with one or multiple winners. Strengthening inhibition prolongs a partially contrast-enhanced pattern by slowing the transition to stability, while strengthening excitation causes more winners when the network stabilizes.
Introduction
Local cortical circuits have recently attracted growing attention (Song et al., 2005; Yoshimura et al., 2005; Perin et al., 2011) especially now that new experimental techniques can assess these circuits in functionally revealing ways, such as mapping fine-scale anatomical connectivity in parallel with behavioral responsiveness (Ohki et al., 2005; Bock et al., 2011). The ability of these local circuits to retain information about input signals after their input sources become silent is the foundation of short-term memory (STM; Grossberg, 1973, 1988; McCormick et al., 2003). STM is important in many aspects of perception, cognition, emotion, and action. Correspondingly, many cortical networks exhibit a recurrent anatomy that can support this capability (e.g., Levitt et al., 1994; Bosking et al., 1997; Schmidt et al., 1997; Chisum et al., 2003; Song et al., 2005; Morishima and Kawaguchi, 2006). This article proposes how the transformation of input patterns and their storage in STM in spiking neural networks is influenced by changes in their recurrent anatomy, feedback signal functions, and modulation by after-hyperpolarization (AHP) currents and acetylcholine (ACh).
Rate-based recurrent neural networks enable a diverse set of nonlinear dynamics useful for perceptual, cognitive, emotional, and motor functions, including STM storage (Grossberg, 1973, 1978), cortical dynamics of form and motion perception (Raizada and Grossberg, 2001; Berzhanskaya et al., 2007), speech perception and word recognition (Grossberg and Myers, 2000; Grossberg and Kazerounian, 2011), reinforcement learning and motivation (Phillips and LeDoux, 1992; Grossberg and Seidman, 2006; Dranias et al., 2008), syntactic structure in linguistic processing (Elman, 1991), cognitive working memory (Grossberg and Pearson, 2008; Silver et al., 2011), and incremental learning of recognition categories (Carpenter and Grossberg, 1987; Grossberg and Versace, 2008). In these networks, the cells typically obey membrane, or shunting, equations (Hodgkin and Huxley, 1952; Grossberg, 1968), the on-center of self-excitatory feedback is narrow, and the off-surround of lateral inhibition reaches a broader expanse of cells. Such networks are thus called recurrent shunting on-center off-surround networks, or recurrent competitive fields. See Figure 1.
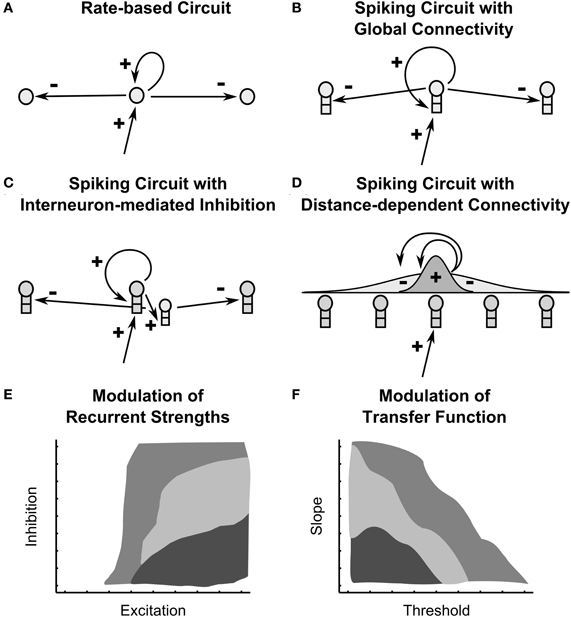
Figure 1. Recurrent on-center off-surround shunting networks and their modulation. Four recurrent circuits are depicted: (A) a rate-based recurrent circuit analyzed in Grossberg, 1973 (B) a spiking recurrent circuit in which principle pyramidal cells connect directly to each other (C) a spiking recurrent circuit in which inhibition is mediated indirectly by interneurons (D) a spiking recurrent circuit in which connection weights are distance-dependent, specifically scaled by a Gaussian of distance. (E,F) Two diagrams depict how all four circuits show qualitatively similar dependence on (E) the strength of recurrent connectivity and (F) the shape of cellular transfer functions. The diagrams are conceptual synopses of the network dynamics across the various circuit types. Light gray signifies gradual dynamics, medium gray indicates fast dynamics and small stored patterns, dark gray indicates fast dynamics and large stored patterns.
Recurrent excitation and inhibition need to be approximately balanced to prevent too much or too little network activity. For example, in the earliest theorems about STM storage in shunting on-center off-surround networks (Grossberg, 1973), recurrent excitatory and inhibitory signals were of equal strength and the effects of different feedback signal functions on pattern transformation before STM storage were studied. These theorems showed that a linear signal function could store an arbitrary input pattern, but only at the price of amplifying noise in the network. Later modeling studies clarified how laminar circuits can develop to realize a balance between excitation and inhibition in both the deep and superficial layers of visual cortex (Grossberg and Williamson, 2001). The balance of excitation and inhibition has often been simulated in models that do not incorporate key neural constraints (e.g., Lau and Bi, 2005). For example, linear signal functions (Xie et al., 2002; Yi et al., 2003) and recurrent networks without shunting dynamics (Wersing et al., 2001) are common, despite their disagreement with experimental findings (Hodgkin and Huxley, 1952; Freeman, 1979; Fellous et al., 2003).
Wang and colleagues have examined the role of inhibition and excitation in STM in biologically detailed recurrent networks of prefrontal cortex (Camperi and Wang, 1998; Miller et al., 2003). Their models utilize cells that exhibit strong bistability; that is, the cells remain either an “up” state, in which activity is maintained without input, or a “down” state, in which activity rapidly decays away. Grossberg (1973) (see also the reviews in Grossberg, 1980, 1988) showed how a cubic or, more generally, any faster-than-linear signal function could lead to winner-take-all (WTA) STM dynamics in a recurrent shunting on-center off-surround network. Such faster-than-linear dynamics enable cells to resist noise when driven into an “up” state (Camperi and Wang, 1998). However, this feature comes at the cost of losing the analog sensitivity of each cell to input strength.
This shortcoming has been overcome at the network level by positing a large number of cells (e.g., 12,000) whose collective activities implement a binary code with a range of sensitivities or signal function thresholds across the cell population (Miller et al., 2003). In contrast, Grossberg (1973) proved how rate-based recurrent shunting on-center off-surround networks with a sigmoid feedback signal function could transform and store partially contrast-enhanced patterns in STM. Such a stored pattern preserves analog sensitivity to the input pattern while also suppressing noise. The current study with spiking neurons builds upon this insight and studies how STM can occur with a small collection of cells (e.g., 40) in a recurrent shunting on-center off-surround network, with a sigmoid signal function, whose individual cells retain their analog sensitivity to input strength.
Balanced Excitation and Inhibition
This article first manipulates the balance of inhibitory and excitatory signals in four anatomical variants of recurrent shunting on-center off-surround networks, three of which are spiking circuits (fast narrow excitation and global inhibition, fast narrow excitation and global interneuron-mediated inhibition, distance-dependent excitation and inhibition; Figures 1B–D). This analysis addresses how changing parameters affects the speed with which network dynamics converges to equilibrium. With appropriately chosen excitation and inhibition, spiking networks maintain a partially contrast-enhanced pattern for 800 ms or longer after stimuli termination, then resolve to no stored pattern, or to WTA stored patterns with one or multiple winners. Mapping the stability of network dynamics parametrically as a function of excitation and inhibition reveals several regions of network behavior (Figure 1E). Strengthening inhibition prolongs a partially contrast-enhanced pattern by slowing the transition to stability, while strengthening excitation causes more winners when the network stabilizes. With excitation and inhibition chosen to be balanced in the recurrent circuits, we examine other important factors in the network dynamics.
Input Transformation by Different Feedback Signals
Within recurrent networks, the choice of feedback signal has a major impact on network transformations of input patterns before the patterns are stored in STM. Beginning in Grossberg (1973), theorems about rate-based models have provided insights into how the choice of feedback signal can alter how input patterns are stored (e.g., Ellias and Grossberg, 1975; Grossberg and Levine, 1975; Wersing et al., 2001). In particular, global theorems in Grossberg (1973) showed how different signal functions in recurrent shunting networks with narrow on-centers and global off-surrounds [see Figure 1A and Equations (1), (3), (4)] transform input patterns before they are stored in STM as sustained patterns of neural activity as the network settles to equilibrium.
As shown in Figure 2A, if the signal function is linear (e.g., f(x) = Ax), then the relative activities of the initial input pattern are preserved. If the signal function is slower-than-linear (e.g., f(x) = Ax (B − x)−1), then all differences in the input are uniformized. In both of these cases, noise is amplified. If a signal function is faster-than-linear (e.g., f(x) = Ax2), then noise is suppressed. In fact, noise is suppressed so vigorously, and the input pattern is so vigorously contrast-enhanced, that only the cell (population) with the largest input survives the competition, and its activity is stored in STM. This is thus a WTA network.
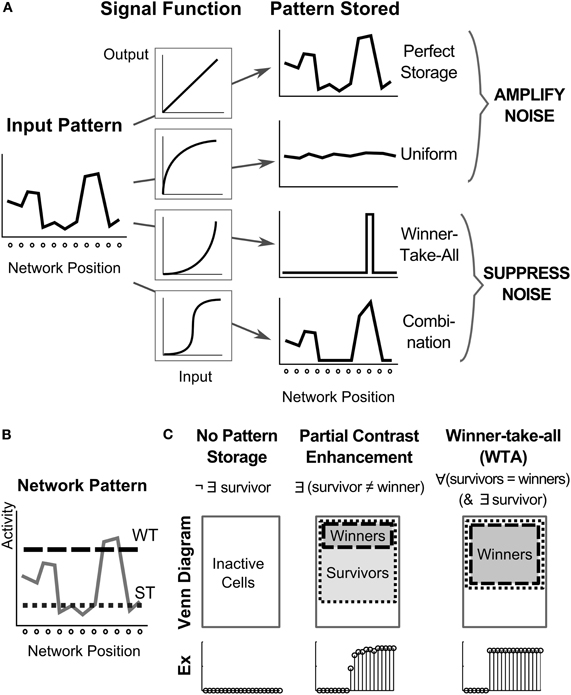
Figure 2. Dynamics of signal functions control pattern in a recurrent architecture. (A) How the choice of four different non-linear signal functions determines network storage behavior including whether noise is amplified or suppressed (Grossberg, 1973). The sigmoidal case is noteworthy, because it features a quenching threshold which enables noise suppression and partially contrast-enhanced activity patterns to be stored in STM. Modulation of the quenching threshold enables the number of stored items to be varied. (B) To analyze the resultant network activity patterns, cells are labeled as winners or survivors, based on whether their activity relative to the network overcomes a winning threshold (WT) or a surviving threshold (ST). (C) Once the network stabilizes after stimulation has ceased, the network pattern can be classified as no pattern storage, partial contrast enhancement, or winner-take-all. A venn diagram of the cell activities and an example (Ex) of a stored pattern are shown for each case.
In order to enable cells with activities less than the maximum to be stored in STM, a sigmoid, or S-shaped, signal function suffices, because it is a hybrid of the other signal functions. Any signal function needs to be faster-than-linear at low activity levels in order to suppress noise, and any biologically plausible signal function needs to be bounded at high activity values. A sigmoid signal function is the simplest one that combines both constraints. At high activity values, it is slower-than-linear. Because it is faster-than-linear at low activities, it is approximately linear at intermediate activities, by continuity. Thus, a sigmoid signal function can begin to contrast-enhance an input pattern as the shunting on-center off-surround network interactions begin to normalize cell activities and drive them into the approximately linear range, where they can be stored as a partially contrast-enhanced pattern; namely, an activity pattern in which a subset of the most active cells are contrast-enhanced and stored in STM, while activities of less active cells are completely suppressed.
Quenching Threshold and Hill Function
The net effect on network dynamics is to define a quenching threshold, or initial activity level below which activities are treated like noise and suppressed, and above which they are contrast-enhanced and stored in STM. The quenching threshold can be tuned, thus leading to a tunable filter: in the limit of a high quenching threshold, it can perform like a WTA network. If in response to an unexpected event the quenching threshold goes down, then the network can store a distributed pattern of input features, until hypothesis testing can select the features that can better predict future outcomes (discussed in section “Discussion: The Role of ACh in STM Storage and Vigilance Control”).
The adaptability of this quenching threshold is crucial. For example, WTA dynamics might be preferable in a situation in which a fast decision must be made or an unambiguous stimulus must be rapidly perceived. On the other hand, longer maintenance of a partially contrast-enhanced pattern might facilitate comparison between possible representations, or enable distributed recognition categories to be learned (cf. Carpenter, 1997). As described in the rate-based analysis (Grossberg, 1973), the quenching threshold can be determined by considering the hill function; that is, g(x) = f(x)/x, so-called because, given a sigmoidal signal function, this function takes the shape of a hill. The peak of a hill function, where it is approximately flat, denotes the region of approximate linearity of the signal function that tends to preserve a partially contrast-enhanced activity pattern. A wider plateau of the hill function leads to slower change in the activity pattern when network activities are in that range. The quenching threshold and the hill function are thus key factors in the rate of partial pattern contrast enhancement and in the form of patterns retained in STM.
After-Hyperpolarization Currents Determine Sigmoid Signal Shape
What processes control the shape of sigmoid signal functions within biophysically detailed models of spiking neurons and consequently the hill function and quenching threshold? In networks of spiking neurons, transfer functions, defined as the relationship between input and output spiking rates, are postulated to act analogously to the signal functions that are used in rate-based models. Physiological observations confirm that neurons often exhibit a sigmoidal relationship between input and output (Freeman, 1979; Fellous et al., 2003). For a sigmoidal curve, apart from rescaling by boosting excitability, there are two elementary degrees of freedom: threshold translation and slope change. Translation of the sigmoidal threshold occurs when the region of highest sensitivity for the function shifts along the input domain, and mathematically equates to movement of its point of inflection. Slope varies when the curve either steepens or becomes more gradual, and mathematically relates to the magnitude of the derivative around the point of inflection. Because biological cell activation is limited to a restricted operational domain, threshold translation and slope alterations manipulate the curvature of the signal function. What factors shape the two sigmoidal degrees of freedom during development, or modulate them dynamically during on-going behaviors?
AHP currents, defined as hyperpolarizing currents that occur following action potentials, are prime candidates for adaptive control of cell transfer functions, because of their dependence on recent activity and their susceptibility to external modulation. These AHP currents are predominantly carried by calcium-dependent potassium channels (Hotson and Prince, 1980; Lancaster and Adams, 1986), but also partly by calcium-independent potassium currents (Lorenzon and Foehring, 1992, 1995). Calcium (Ca2+)-dependence implies spike dependence, because calcium concentrations fluctuate via voltage-dependent channels that open as a result of depolarization during action potentials. Studies of these currents in layer 5 Betz cells of cat sensorimotor cortex (Schwindt et al., 1988b) and pyramidal cells in layers 3–6 of human neocortex (Lorenzon and Foehring, 1992) have identified three distinct AHP currents: a fast, medium, and slow current. Henceforth, we refer to these currents as fAHP, mAHP and sAHP, respectively. Other reports confirm similar mAHP and sAHP currents in a variety of rat slices (Storm, 1987, 1989; Lee et al., 2005). The difference in the time course of these AHP currents has not been completely explained, but recent evidence suggests that proximity to calcium channels may be the dominant factor rather than, for example, the time constant of calcium binding to the channels themselves (Lima and Marrion, 2007).
Recent work (Palma et al., 2011) demonstrates how the three AHP conductances can together control the shape of a sigmoidal transfer function by independently translating its threshold and changing its slope. The Palma et al. (2011) analysis revealed simple rules that govern conductance changes in the three AHP currents as they combine to generate desired changes in signaling. It was shown that, for spiking neurons, a leftward threshold shift occurs when the sAHP and mAHP currents decrease, while the fAHP current increases. Likewise, it was shown that the slope of the transfer function becomes steeper when the sAHP and fAHP currents decrease, while the mAHP current increases. The analysis defined threshold and slope manipulations as operations, which occur in the parametric space of cell membrane conductances, and can be mapped onto the operational space of cell signaling.
Given that AHP currents can control the shape of transfer functions, how do changes in slope and threshold impact network dynamics when the cells are spiking neurons in recurrent shunting on-center off-surround networks? By extending the pyramidal cell model and techniques from our previous work, we demonstrate here how changes in the shape of sigmoidal transfer functions by AHP conductances can control the maintenance of a partially contrast-enhanced pattern and the number of cells remaining active in each of the four anatomies in Figure 1 stabilizes. Mapping the stability of network dynamics parametrically as a function of the signal threshold and slope reveals several regions of network behavior (sketched in Figure 1F). To better understand these effects in cortical spiking circuits, we compare them with rate-based models of network dynamics.
AHP Modulation by Acetylcholine
Numerous studies have shown that AHP currents are modulated by the level of ACh and other neurotransmitters (McCormick and Williamson, 1989; Vogalis et al., 2003 for review). ACh is believed to increase gain on sensory input in cortical cells both by reducing AHP currents as well as strengthening sodium currents to boost cell excitability (Sarter et al., 2005; Giocomo and Hasselmo, 2007). This description and associated computational models portray ACh as a promoter of sensory processing by decrease in a single AHP current either by lumping distinct AHP currents together or neglecting two of the three currents (Barkai and Hasselmo, 1994; Cox et al., 1997; Wang et al., 2003; Soto et al., 2006; Grossberg and Versace, 2008). However, these models have not clarified the functional roles of the multiple timescales on which AHP currents have been observed and have not evaluated the effect of changes in AHP on STM.
How does ACh biophysically coordinate the control of AHP currents at all three different timescales? Palma et al. (2011) proposed that ACh modulates the three AHP currents, and thus sigmoid signal shape, by predominantly shifting the threshold. By including a combination of three AHP currents, each uniquely modulated by ACh, the model clarified how ACh may simultaneously cause a steepening in the sigmoid slope and a lowering of the sigmoid threshold. Here we show how, when this modulatory effect on individual signal functions occurs throughout a recurrent network, it can lengthen the persistence of a partially contrast-enhanced pattern, increase the number of winners, or, if connectivity is distance-dependent, cause cell activities to cluster.
How can such ACh modulation influence behavior through its action on entire brain systems? Adaptive Resonance Theory, or ART (Grossberg, 1980; Carpenter and Grossberg, 1987, 1991; Carpenter, 1997) proposes how cortical recognition categories may be learned through interactions of an attentional system with an orienting system. Bottom-up adaptive filters and top-down attentive prototypes interact within the attentional system to match input feature patterns with active top-down attentive prototypes. A sufficiently large mismatch may cause reset of currently active recognition categories and thereby trigger search for a better matching category that is either within the repertoire of already learned categories, or by initiating learning of a new category. If the match between bottom-up and top-down information is good enough, then feedback between bottom-up and top-down signals triggers a resonant state capable of driving fast learning of the attended data. Hence the name Adaptive Resonance Theory.
The criterion of what constitutes a good enough match is controlled by a gain, called vigilance that is computed within the orienting system (Carpenter and Grossberg, 1987). Vigilance may be increased during supervised learning by a predictive mismatch, thereby triggering reset of categories that were acceptable under a lower setting of vigilance, and search for a better matching category. Grossberg and Versace (2008) proposed how the release of ACh could increase vigilance and thereby promote search for, and learning of, more specific, or concrete, recognition categories in response to mismatch-inducing environmental feedback. In this conception, mismatch-mediated activation of the nucleus basalis of Meynert results in release of ACh, which causes a reduction of an AHP current in layer 5 pyramidal cells and thus an increase of cell excitability. In a similar manner, vigilance might increase in response to a release of ACh in response to stress factors such as shock (Zhang et al., 2004), even when bottom-up and top-down signals have a good match based on similarity alone.
Other models have considered alternative effects of ACh modulation. Soto et al. (2006) have examined pattern transformation and its modulation by ACh in a model of primary auditory cortex (2006). They do not, however, evaluate pattern storage in STM. Their model of primary auditory cortex does consider the cholinergic modulation of sodium currents (Cantrell and Catterall, 2001) and of synaptic strength that effectively changes network connectivity (Gil et al., 1999; Hsieh et al., 2000), but includes only a single AHP current. Wang et al. (2003) have included a Na+-dependent K+ current and a Ca2+-dependent K+ current into their model of cells in primary visual cortex to explain visual adaptation on two different timescales.
Hasselmo et al. (1995) developed a model of how ACh may affect STM and learning in the rat hippocampus. In their model, ACh diminished a single AHP current and, thereby, enabled network activities to exhibit STM alternatives that are not possible at lower ACh levels. The cells in their model were not, however, spiking neurons, and generated cell bistability, as in the model of Miller et al. (2003). The current model uses a more detailed analysis of three AHP currents, and sigmoid signal functions instead of threshold linear functions.
“Materials and Methods” describes the four recurrent circuits, differential equations for the compartmental neuron model for the spiking circuits, the physiological basis of the simulation parameters, the AHP modeling with spike-dependence, synaptic modeling, estimation of cholinergic behavioral intensities, and general analysis techniques. “Results” describes simulation results, and provides a comparison between the circuits for excitatory and inhibitory modulation, the network dynamics for threshold translation and slope change, an evaluation of the effect of ACh on network behavior, and finally evidence that the parameter regimes of network dynamics are not strongly dependent on the amplitude of the presented stimuli. “Discussion: The Role of ACh in STM Storage and Vigilance Control” discusses the significance of the work within the context of learning and behavior.
Materials and Methods
Network Circuitry
The networks considered here obey recurrent on-center off-surround shunting dynamics that are known to be widespread in many brain systems. The simulations compare a rate-based network with spiking networks. The recurrent excitatory kernel activates either a single cell, or cell population, or a narrow distance-dependent Gaussianly distributed set of cells, while the inhibitory kernel inhibits either the entire network, or a broad Gaussianly distributed set of cells.
Rate-Based Circuit
The rate-based model uses a variant of the recurrent shunting on-center off-surround network that was first described in Grossberg, 1973 and whose more general variants were soon after studied by Grossberg and colleagues (e.g., Ellias and Grossberg, 1975; Grossberg and Levine, 1975, 1976; Grossberg, 1988). We use the first equation from Grossberg (1973) with parameters τ and D added to scale the rate of the network dynamics and the strength of the excitatory recurrence, respectively:
The sigmoid signal function is:
where S and T corresponds to slope and threshold, respectively. For a default state, T = 0.35, and S = 1.4, since this makes the signal function similar in shape to the transfer functions for the spiking cells. The variables in this model are mostly dimensionless, but τ allows the model to be calibrated in milliseconds to facilitate comparison with the spiking circuits.
Spiking Circuits
The spiking model neurons are composed of three cylindrical compartments: somatic, proximal dendritic, and distal dendritic. Compartment membrane equations are governed by Hodgkin–Huxley, or conductance-based, dynamics (Hodgkin and Huxley, 1952). For pyramidal neurons, the somatic membrane potential, VS, fluctuates via spike-generating sodium and potassium currents, leak current, three AHP currents, and a dendritic inter-compartmental current, with the corresponding terms in Equation (3):
Inhibitory interneurons obey a similar equation without AHP currents:
In both Equations (3) and (4), the first three currents use the Hodgkin–Huxley form (Hodgkin and Huxley 1952):
and
with “shunting” terms (E − V) in each current. Table 1 lists the complete names, units, and values for the parameters of both the pyramidal neurons and the inhibitory interneurons. The somatic sodium and potassium equilibrium potentials and the axial conductance are similar to parameters for layer 5 cortical cells from Grossberg and Versace (2008), but are adjusted such that the cells do not fire at rest, yet are still responsive to stimulation. The dendritic parameters used, such as a high capacitance, support a form of intracellular memory, or persistence, even without recurrence by maintaining recent input signal for about 20 ms. These parameters in the spiking neurons correspond to the decay parameter, A in Equation (1), in rate-based networks. The dendritic capacitance is higher for pyramidal cells than interneurons to reflect their size and this dendritic memory. In contrast, interneurons spike faster and with less memory, because they have lower capacitance and no AHP currents. Physiological studies have demonstrated that AHP currents in cortical inhibitory cells are negligible (McCormick et al., 1985; Connors and Gutnick, 1990).
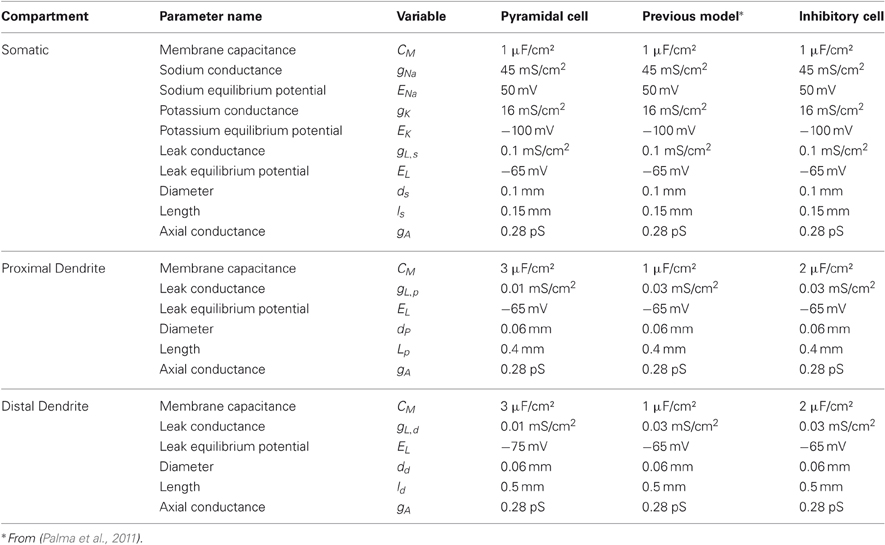
Table 1. Neuron parameters.
In pyramidal cells, the dynamics of AHP currents are a function of generated spike history, HS, and individual rise and fall times, τr and τf, and are described further in section “Modeling Spike-based After-hyperpolarization Currents”. Activation and inactivation functions, including mNa, hNa and nK in Equations (5) and (6), follow the conventional form of forward and backward rates, α and β, for voltage-dependent conductances commonly used for spiking models (Hodgkin and Huxley, 1952; Traub et al., 1991; Grossberg and Versace, 2008) and each change as x in the equation:
where specific expressions for α and β are:
and
Dendritic compartments are passive with leak currents, and are divided into proximal and distal compartments. Inputs and recurrent excitatory connections are manifested via an alpha-amino-3-hydroxy-5-methyl-4-isoxazolepropionic acid (AMPA) synaptic current into the distal dendrite, while recurrent inhibitory connections are manifested via an gamma-aminobutyric acid (GABA) synaptic current into the proximal dendrite. Synaptic connections are described further in “Spiking Stimulation and Synaptic Models”. Proximal and distal dendritic membrane potentials, Vp and Vd, of pyramidal cells follow Equations (15) and (16), respectively:
and
where parameters are listed as pyramidal cells in Table 1. Inhibitory interneurons follow similar equations to (15) and (16) but input arrives distally from excitatory neurons alone:
and
where parameters are listed as interneuron cells in Table 1. For simplicity, we do not use inhibitory interneurons in the circuit with global connectivity and distance-dependent networks.
Modeling Spike-Dependent Signals
An individual excitatory postsynaptic potential (EPSP) results from a time-varying conductance wave after each arriving presynaptic (or input) spike, while an AHP current results from a time-varying conductance wave after each postsynaptic (or output) spike. Given a single spike occurring at time ts, a double exponential function for a conductance gE describes both its onset and decay:
where τr and τf are rise and fall time constants, respectively (Destexhe et al., 1994a). For a single spike, the conductance peaks at time tpeak:
with an amplitude of 1, ensured by the normalizing constant c:
A spike train, whether of input or output signals, defines a history, or list, H, of spike times:
Output spikes, Hs, are determined by when the presynaptic somatic potential, Vs, crosses a detection threshold, Vth = 10 mV, with a negative derivative.
A spike history poses the problem of conductance saturation during temporal summation. Total conductance could be unbounded, accumulating at the same rate regardless of how many spikes occur over an interval. This approach is equivalent to summing up independently double exponentials for each spike represented by Equation (19), and shown to be efficiently computed by a discrete algorithm that leverages z-transform mathematics (Köhn and Wörgötter, 1998).
However, as demonstrated in Palma et al. (2011), a more realistic approximation uses a mass action law, similar to other kinetic models (Destexhe et al., 1994a,b), to introduce an intermediate variable. This is expressed by two differential equations:
and
For a synaptic signal, the variable R most closely portrays the concentration of transmitter in the synaptic cleft, while the conductance gSD represents postsynaptic receptor activation. The function I denotes the input signal, a set of square waves from the spike train, H, which equals 1/τr, if the time since the last spike arrival, t − tn, is less than τr ms, and equals 0 otherwise. The passive decay rate parameters, 1/τr and 1/τf, can be thought of as the diffusion rate of the neurotransmitter and as the average dissociation rate of the neurotransmitter from the receptors, respectively. The net conductance change following a single presynaptic spike resembles the double exponential wave in Equation (19) [as shown in Figure 2 of Palma et al. (2011)]. This formalism implies that the conductance does not saturate after a single spike, but does approach a saturation level given a prolonged high firing rate or a rapid burst of spikes. For this reason, it is preferred to other synaptic models and is called the saturating differentials (SD) spike-dependent signal.
Modeling Spike-Based After-Hyperpolarization Currents
Since fluctuations in somatic calcium concentrations strongly match the timing of action potentials, and AHP currents are predominantly carried by calcium-dependent potassium channels (Lancaster and Adams, 1986; Prakriya et al., 1996; Abel et al., 2004; Lee et al., 2005), these currents are spike-dependent. Therefore, individual AHP currents are modeled by a wave of increased conductance following each spike and follow the equations:
and
Since each AHP current within an individual cell has a bounded conductance based physiologically on channel density, this bound must be enforced during summation across the spiking history. Therefore, the spike-dependent signals in Equations (25)–(27), take the saturating differentials form of Equations (23) and (24) for their time course.
The parameters for the model were chosen to match measurements observed in mammalian neocortex by Lee et al. (2005) and Storm (1987); see Table 2. These basal levels were determined by measuring the amplitude difference in somatic potential, Vs, between simulation of individual spikes with and without each AHP current and then changing conductances until amplitudes approximately matched measurements from physiological studies.
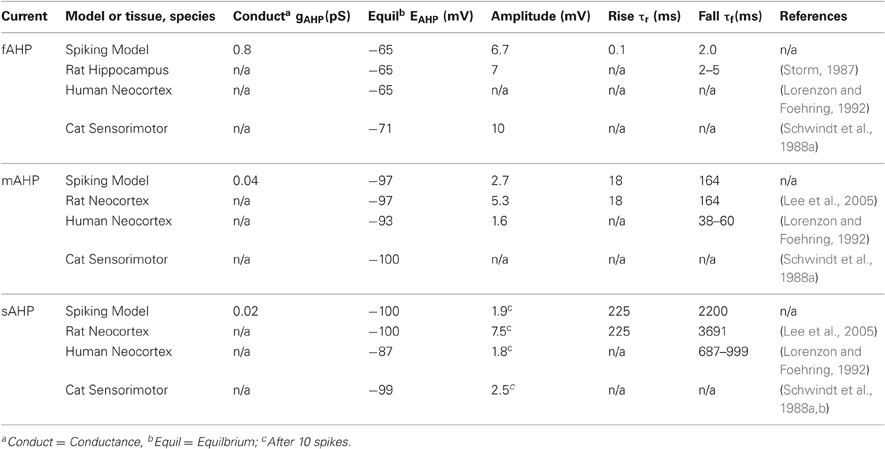
Table 2. Comparison of physiological AHP data with basal model parameters.
This computational model of AHP currents has been shown to closely approximate a more detailed AHP model that describes a mixture of six channels with sensitivities to membrane voltage and intracellular calcium concentrations affected by calcium channels, diffusion, and pumps (Cox et al., 1997; Palma et al., 2011). The model captured recent findings that differences in calcium-channel proximity account for the different time courses of calcium-dependent AHP currents (Pineda et al., 1998).
Modeling Acetylcholine Modulation of AHP Currents
Different intensities of cholinergic modulation that correspond to behavioral or attentional states are demonstrated by an array of experiments. These studies, displayed in Table 3, estimate the concentrations and relative magnitudes of ACh release for different states. The majority of the studies used a microdialysis technique to measure the concentration of neurotransmitter, a technique known to salvage only between 5 and 20% of the original concentration. When recovery percentages are reported, we adjusted these estimates to compensate for this limitation by dividing the reported concentration by the recovery percentage to estimate the original concentration.
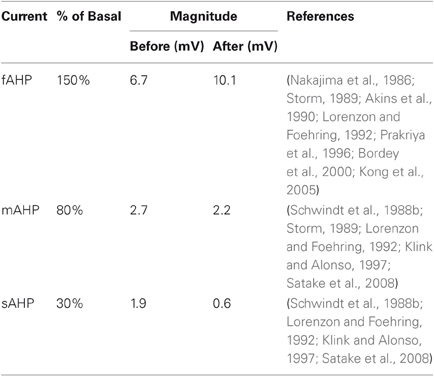
Table 3. Pharmacological modulation of AHP currents by ACh receptor agonists.
The novel technique of using choline-sensitive microelectrodes has produced data with high temporal resolution showing rapid increases in ACh during a presented cue (Parikh et al., 2007). To convert these results from transients above the mean into percentage changes for comparison with other studies, we assumed (1) that basal ACh concentrations in Parikh et al. (2007) are close to measurements in Parikh and Sarter (2006) with the same rat species, methodology, and lab; and (2) that the ratio of actual ACh concentration to measured extracellular choline concentration is about 0.083 (340 μM/4110 μM) based on a related study (Köppen et al., 1996). This calculation parallels that made for microdialysis with recovery percentages. For both experimental techniques, we do not expect measurements to be precise. Nor do we note any significant conformity between the two. Rather, we are concerned with relative fluctuations, because the change in ACh levels provides an estimate of the resultant change in AHP currents and transfer functions of the target cells.
Most importantly, we estimate the impact of increasing the cholinergic intensity on the AHP currents by examining an array of physiological studies. The physiology has shown that these AHP currents differ both in degree of modulation and the underlying mechanism of modulation. The changes in magnitude for each AHP current following application of ACh or cholinergic agonists are summarized quantitatively in Table 3.
Results indicate that application of ACh and muscarinic agonists reduces or entirely abolishes the sAHP in a variety of tissue types and species (Schwindt et al., 1988b; McCormick and Williamson, 1989; Lorenzon and Foehring, 1992; Muller et al., 1992; Pedarzani and Storm, 1996; Klink and Alonso, 1997). Findings for the cholinergic modulation of the mAHP current are mixed, but generally show a reduction in mAHP conductance to about 70% by applying muscarinic agonists in human and other mammals (Storm, 1989; Lorenzon and Foehring, 1992; Shapiro et al., 2000; Power and Sah, 2008). The mAHP current is considered to be carried mainly by SK calcium-dependent potassium channels, which are generally distinguished by their sensitivity to blockade by apamin.
Experiments on the cholinergic modulation of the fAHP current have produced more conflicting results. Cholinergic agonists either cause fAHP increase (Bordey et al., 2000; Kong et al., 2005), no change in fAHP (Storm, 1987; Lorenzon and Foehring, 1992), or affect fAHP depending on the membrane potential, but probably cause increase under normal conditions (Nakajima et al., 1986; Akins et al., 1990; Hicks and Marrion, 1998; Kong et al., 2007). The detailed physiology of BK calcium-dependent potassium channels, the main carriers of the fAHP, and a kinetic model (Cox et al., 1997) has helped to explain its effect. Activation of BK channels depends jointly on the membrane voltage and two binding sites for calcium, one of which is also sensitive to cadmium (Schreiber and Salkoff, 1997). These physiological findings are described in further detail including underlying channel mechanisms and compared with modeling results in Palma et al. (2011).
Model AHP hypotheses
Our model assumes ACh-induced AHP changes and ACh intensities that generally concur with these experimental data, shown in Table 3 and Table 4, respectively. By combining these estimates, we arrive at five intensities of ACh modulation, labeled “Low”, “Basal”, “Moderate”, “High” and “Very High”, with corresponding states of different AHP conductances, also in Table 4. Simulations were performed at these five intensities.
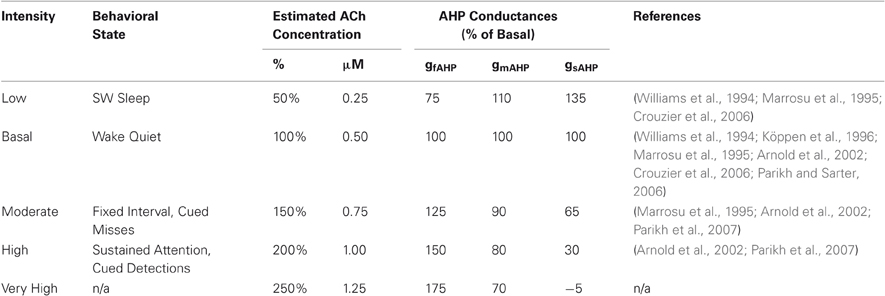
Table 4. Behavioral correspondence to cholinergic intensities.
Spiking Stimulation and Synaptic Models
For stimulation, an input spike train is used to replicate in vivo signaling. A synaptic model should ideally account for limited postsynaptic receptors and neurotransmitter saturation. For an external input to the network, the synaptic current is denoted:
where gAMPA−IN = 0.15pS and gSD is the saturating differentials waveform. For recurrent excitatory synapses from cell j to cell i, the current follows the equation:
where gAMPA−RE = 0.14 pS by default and parametrically changed in Figures 4 and 5. Regardless of whether the connection is directly between pyramidal cells or from interneurons, the current in recurrent inhibitory synapses from cell j to cell i, follows the equation:
where gGABA = 1.6 fS (femtosiemens) by default and parametrically changed in Figures 4 and 5. In the case of interneurons, each pyramidal cell excites an immediate interneuron, which is given the same index i to denote the same position in the network:
where is gAMPA−EI = 0.08 pS. With all circuits, the rise and fall rates of EPSPs and IPSPs remain identical. Excitatory parameters are derived from recordings of currents from pyramidal cells of rat prefrontal cortex layer 2/3 (Povysheva et al., 2006). The parameters for the AMPA current are EAMPA= 0 mV, and time constants τr,AMPA = 0.76 ms and τf,AMPA = 6.5 ms, which fall in a range similar to other cortical experimental data; e.g., τr,AMPA = 0.9 ms and τf,AMPA = 3.1 ms for AMPA receptors in neocortical layer 4 pyramidal and interneuron cells of the rat visual cortex (Watt et al., 2000) and τr,AMPA = 0.3 ms, τf,AMPA = 2.2 ms for layer 1 neurons in rat visual cortex (Hestrin and Armstrong, 1996). The parameters for the GABA current are EGABA = −72 mV, and time constants τr,AMPA = 0.81 ms and τf,AMPA = 8.7 ms. Rise and fall rates of IPSPs are derived from physiological recordings from Perrais and Ropert, 1999.
Spiking Circuit Variants
Spiking circuit with global inhibitory connectivity
For initial simplicity of comparison to the rate-based circuit, we examine a circuit with global inhibitory connectivity; that is, from a given cell, equal inhibition targets all other cells and does not use inhibitory interneurons. Inhibitory inputs to pyramidal cells in this circuit are received directly from spikes of other pyramidal cells, thereby causing GABA synaptic current into the proximal dendritic compartment of the postsynaptic neuron, as in Equation (15). In other words, the weight wIij in Equation (30) is 0 when i = j and 1 elsewhere. Excitatory recurrence is simply self-excitatory, that is wEij in Equation (29) is 1 when i = j and 0 elsewhere.
Spiking circuit with interneuron-mediated inhibition
In the next circuit variant, the inhibition remains global, but the signal is mediated indirectly through inhibitory interneurons, which correspond to fast-spiking basket cells in mammalian neocortex. Each pyramidal neuron excites an immediate interneuron with the same parameters but a dendritic capacitance of 2 μF/cm2 instead of 3 μF/cm2 and no AHP currents (See Table 1). Each interneuron inhibits all other cells besides the corresponding pyramidal cell at their proximal dendritic compartment, as in Equation (15).
Spiking circuit with distance-dependent connectivity
Finally, we examine a spiking circuit in which the strength of recurrent signals depends on the distance between the cells. To avoid edge effects, the architecture is a ring network; that is, it has a loop topology whose first cell of index 1 neighbors the last cell of index 20. Specifically, the strength of the excitatory conductance between two cells, denoted i and j, is scaled by a Gaussian of the distance between them, assuming they are regularly spaced:
where σE is 0.5. The strength of the inhibitory conductance between two cells is scaled:
where σI is 10.
Evaluation of Network Dynamics
For both rate-based and spiking models, networks of 20 cells were simulated for a fixed interval of 5000 ms. From simulation start to 1000 ms, the networks were presented with a stimulus that is a ramp across the 20 cells (Figure 3). Using a ramp stimulus is a straightforward way to evaluate order preservation; that is, whether the network preserves in STM the rank ordering of input sizes. In the rate-based model, the ramp consists of dimensionless values up to 0.5 in steps of 0.025. In the spiking model, the ramp consists of regular spikes at frequencies up to 200 Hz in steps of 10 Hz (Figure 3B). Generally, we test whether changes in the network connectivity strengths and sigmoid function parameters (e.g., threshold and slope) cause changes in STM dynamics and storage across the four circuits.

Figure 3. Partial contrast-enhanced pattern sustained in short-term memory. (A) A simulation trial consists of one second of stimulus (Stim) presentation and four seconds to evaluate STM storage; (B) the ramp stimulus of increasing input rates at each successive network position; (C) raster of output spikes in a 20 cell network; (D) the transfer function, the thick black dashed line, for the cells in this example superimposed over the transfer function, shown in gray, that was used under normal conditions; that is, with the AHP conductances in Table 2. The vertical thin dotted line across the transfer function is drawn at the lowest abscissa of the cell's hill function; (E) output firing rates estimated by windowing the spikes. Vertical dashed gray and dashed black lines across the activities denote the last time of the highly distributed partially contrast-enhanced pattern and the time when the network stabilizes on STM storage of a much small number of activities, respectively. The vertical thin dotted line demarks the time of stimulus offset. Note that the distributed pattern can be maintained for over a second, which is within the duration of many STM functions; (F) pattern storage after the input pattern ends, evaluated 1000 ms and 4000 ms after input termination. The simulated network is a spiking circuit with interneuron-mediated inhibition, where the excitation and inhibition are 0.14 pS and 4 fS, and the AHP conductances are changed, such that threshold and slope are −1.5 and −4.0, respectively.
Firing rate estimation
To estimate firing rate for spiking circuits, spikes in a train are first binned into 0.5 ms intervals. The firing rate of a neuron is then estimated by convolving with a sliding trapezoidal window and dividing by 250 ms (the area of the window). The trapezoidal window is flat at the center for 200 ms and then tapers linearly for 50 ms down to zero. This produces an estimate of rate, which is quite similar to a sliding rectangular window of 250 ms. A rectangular window, however, measures the firing rate only at multiples of 4 Hz, produces sharp plots and has fluctuations at that scale when spikes enter and exit the window. The trapezoidal windowing avoids this issue, produces smoother plots and enables more precise comparison between cells than a rectangular window.
Transfer functions, hill functions and quenching threshold
Using the method from Palma et al. (2011), the transfer function of a neuron is determined by stimulating for 2000 ms at increasing intensities in steps of 10 Hz from 0 Hz up to 200 Hz. The output or axonal firing rate of a neuron can then be characterized as a function of the input or presynaptic firing rate over time. The resulting function of input rate to output rate is generally sigmoidal in form. To obtain the hill function of the cell, the signal function or transfer function is divided by a linear function, that is y = x. This approach follows the analysis of rate-based networks in Grossberg (1973) which showed that the quenching threshold abscissa covaries with the position of the leftmost peak of the hill function. For the spiking model, a measurement of the transfer function or the hill function consists of a discrete set of values from simulations. To obtain a precise estimation of abscissa of the peak from this set, the three maximal points are fit with a parabola.
Pattern storage, pattern maintenance, and network stability
At simulation end, we classify the activity pattern across the network as one of three cases: no pattern storage, partial contrast enhancement, or WTA, in which there can be a single winner or multiple winners (Figure 2). Specifically, for a neuron to be a winner, it must exceed the winning threshold (Figure 2B). The winning threshold of a cell is 97% of the highest firing cell in the network at 5000 ms, the end of the simulation. For a pattern to be stored in STM, some neurons need to be “survivors.” For a neuron to be classified as a survivor, it must exceed the survivor threshold at 5000 ms (Figure 2B), which is defined as 20% of the highest firing rate in the simulation. The case of no pattern storage occurs if there are no survivors. It is categorized as partial contrast enhancement, if there exist a survivor that is not a winner. Finally, if all survivors are winners, whether there are one or many winners (Figure 2C), the pattern storage is considered WTA.
The degree of pattern maintenance is measured by the duration after stimulus offset for which both order is preserved and some gradient of the input pattern remains; that is, there are non-winning survivors. The time of network stability is measured as the earliest time step at which the network activities stabilize for 20 ms (40 bins) and the activities no longer change from their final network states at the end of the simulation (5000 ms). Fluctuations within a margin of 3% are permitted, because the calculation of spiking rates is itself an estimate.
Number of Active Clusters. The number of active clusters is the number of groups of consecutive cells that are survivors. This is evaluated at the end of the simulation (5000 ms). If no cells are survivors, then the number of clusters is zero.
Frequency analysis
A spectral analysis is calculated by binning the spikes (0.5 ms bins), convolving these bins with a temporal Gaussian to smooth, and then taking the Fourier transform of the signal. The Fourier transform window is 500 ms. The calculated frequencies are also averaged over the entire simulation. Delta power is defined as the power of frequencies in the range 1–4 Hz.
All simulations were performed in MATLAB Simulink with a 0.02ms maximum variable step size using Dormand-Prince integration on four Intel Xeon quad-core processors (16 CPUs) in an Ubuntu × 64 environment.
Results
Varying Recurrent Connectivity
In a network with recurrent excitation and inhibition, these opposing forces must be balanced to prevent too much or too little network activity. If the network activity decays away after stimulus offset, then the system will not have a stable memory of the recent input. Conversely, if the entire circuit becomes strongly excited after a stimulus, then the activity will drown out the pattern from the input signal. This kind of instability can be compared with epileptic activity in models with more realistic brain anatomies. The balancing problem is influenced by multiple factors, including excitatory and inhibitory kernel size, synaptic rise and fall times, and proximity to soma. We examined this balance by simulation of recurrent networks across parametric variations.
Figure 3 depicts an exemplar simulation. One simulation or trial consists of testing network responses to a ramp stimulus (Figure 3B) presented for the first 1000 ms of a 5000 ms duration (Figure 3A). The transfer function of a neuron, altered by modulation, is depicted as a black dotted line (e.g., Figure 3D), which is compared with a transfer function without modulation, depicted as a solid gray line. The vertical thin dotted line over the transfer function is drawn at the lowest abscissa value for the peak of the hill function. Each network simulation is then evaluated as described in section “Evaluation of Network Dynamics”. The output spikes from a network of 20 cells (as in Figure 3C) are used to calculate the firing rates, or activities (Figure 3E) by using a windowing function. In this example, a contrast-enhanced pattern preserves the input order after the stimulus offset and is stored as STM (Figure 3F). This network is a spiking circuit with interneuron-mediated inhibition, where the excitation and inhibition are set to 0.14 pS and 4 fS, respectively, and the parameters threshold and slope are set to −1.5 and −4.0, respectively. The network dynamics of all circuits are treated and displayed in this way throughout the rest of the results.
Increasing the strength of inhibitory connections reduces the number of active cells in the stored network pattern (Figure 4). For a spiking circuit with global connectivity, the stored pattern shifts from WTA with many (18) winners (Figure 4A) to WTA with less (12) winners (Figure 4C) to a single winner (Figure 4E) for inhibitory strengths, gGABA in Equation (30), set to 0.4 fS (femtosiemens), 0.8 fS, and 3.2 fS, respectively, with excitation held at 0.16 pS (Figures 4A,C,E). For the rate-based circuit, the stored pattern similarly shifts from WTA with 15 winners to six winners (Figures 4B,D), then to a single winner (Figure 4C) for inhibitory strengths set to.05, 0.1, and 0.45, respectively, for the inhibitory gain coefficient C in Equation (1); with excitation held at 1.2 for the excitatory gain coefficient D.
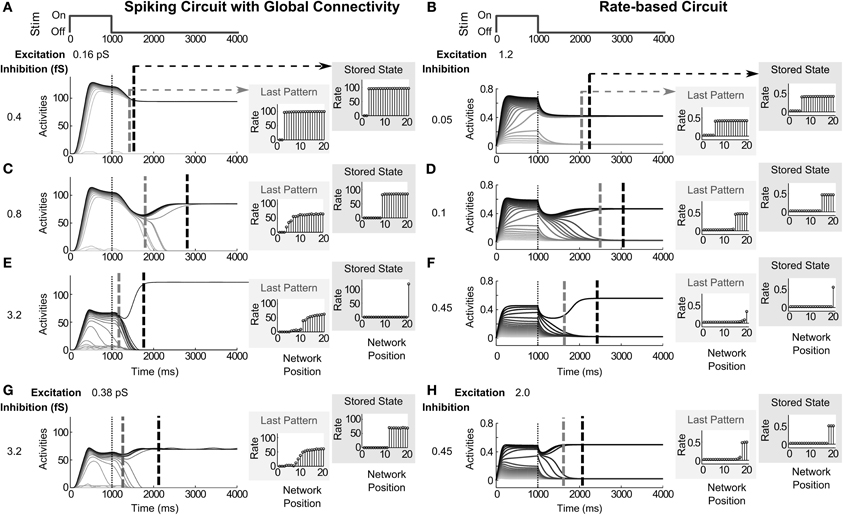
Figure 4. Modulating the strength of recurrent inhibition and excitation. Increasing the strength of inhibitory recurrence reduces the number of cells in the stored network pattern, while increasing excitatory recurrence reverses the effect. (A,C,E) For a spiking circuit with global connectivity, pattern storage shifts from WTA with many winners, 18 in (A), to less winners, 12 and 1 in (C,E), for inhibitory strengths of 0.4 fS, 0.8 fS, and 3.2 fS, respectively. (B,D,F) For the rate-based circuit, pattern storage similarly shifts from WTA with 15 winners to six winners, then to 1 winner for inhibitory strengths of 0.05, 0.1, and 0.45. Vertical dashed gray and dashed black lines across the activities denote the time of the last broadly distributed partially contrast-enhanced pattern and the time when the network stabilizes on its storage state, respectively. The vertical thin dotted line demarks the time of stimulus offset. The right plots show the (spike) rates across the network positions at those two times, labeled the last pattern and the stored state. (G) For the spiking circuit, by increasing recurrent excitation to 0.38 pS, pattern storage shifts from a WTA pattern with a single winner back up to multiple-winners (9). (H) For the rate-based circuit, by increasing recurrent excitation to 0.45, pattern storage shifts from a WTA with a single winner back up to three winners.
The two circuits also show a corresponding trend in the duration of pattern maintenance and the time until the network is stable. The vertical gray dashed lines in each of the network activities plots of Figures 4A–H denote the last time step, for which the network activities both preserve the rank order from the stimulus and preserve a partially contrast-enhanced pattern. The network patterns labeled as Last Pattern depict the patterns at that time step. The vertical black dashed lines in the activity plots of Figures 4A–H denote the time step at which each network stabilizes for more than 20 ms; that is, the activities stabilize for at least 20 ms and do not deviate through the rest of the simulation by more than 3% from the network pattern observed at 5000 ms, the end of the trial. The network patterns labeled as Stored State depict this final stable pattern.
In both the spiking and rate-based circuits, network dynamics are slower with an intermediate level of inhibition. For example, when inhibition is set to 0.8 fS (Figure 4C), a partially contrast-enhanced pattern is maintained for 799 ms whereas, when inhibition is lower (0.4 fS, Figure 4A) or higher (3.2, Figure 4E), the partially contrast-enhanced pattern is only maintained for 423 ms and 167 ms, respectively. In the same network trials, the network stabilizes at 2806 ms in the intermediate case (Figure 4C)—much later than 1526 ms with low inhibition and 1763 ms with high inhibition (Figures 4A,E).
While the recurrent inhibition is kept at the higher level (3.2 fS and 0.45 for the spiking and rate-based circuits), the recurrent excitation is now raised. Increasing the strength of excitatory recurrence, gAMPA−RE in Equation (29), to 0.38 pS in the same spiking circuit (Figure 4G) and to 2.0 for the excitatory gain coefficient D in Equation (1) in the rate-based circuit (Figure 4H) causes a shift from single winners back to multiple winners in the stored pattern of the network. An initial increase in firing rate occurs during the stimulus presentation at about 400 ms after its onset up to 115 Hz in the spiking circuit (Figure 4A) and 0.65 in the rate-based circuit (Figure 4B). In the low inhibitory case (Figures 4A,B), increasing the excitation does not recover this initial transient during the stimulus (Figures 4G,H).
To understand the effects of varying recurrent inhibition and excitation more completely, 441 simulations were run and used to construct parametric maps of the dynamics for varying connectivity strengths. Each result from a trial, as described in Figure 4, produces several possible data points outlined in Figure 5A. The Pattern Storage (left) column of Figure 5 evaluates the final storage state of the network at the end of the trial as a function of the recurrent strengths. The Order-preserving Pattern Persistence (middle) column summarizes the duration of preservation of both the rank order from the stimulus and a partially contrast-enhanced pattern. The Time to Stability (right) column expresses the time taken until each network stabilizes for more than 20 ms and does not deviate from the network pattern observed at the end of the trial. Across all four circuit variants, network dynamics show a similar dependence on the strengths of recurrent excitatory and inhibitory connections for rate-based (Figure 5B) and the three spiking models (Figures 5B,C,D,E). All the circuits require a baseline of recurrent excitatory strength to enable any pattern storage (Pattern Storage column of Figure 5). In the absence of inhibition, this value is approximately the same for all spiking circuits and increases gradually with increased inhibition.
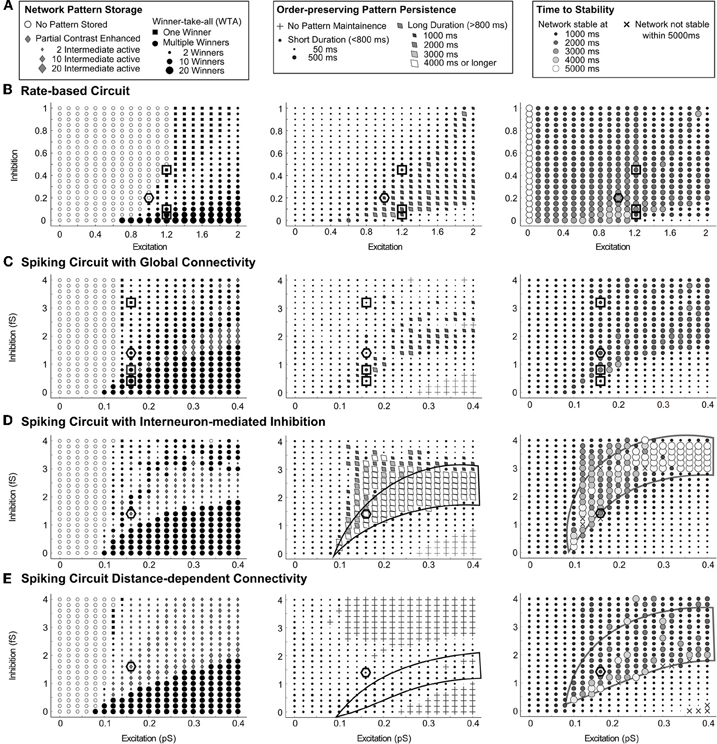
Figure 5. Parametric maps of connectivity strengths for various circuits. Network dynamics following temporary input stimulation show a similar dependence on the strengths of the recurrent excitatory and inhibitory connections. (A) The key for parts (B–E): the left column characterizes the type of network pattern storage at the end of the simulation time, the size of black circles indicating the number of winners, while the size of gray diamond indicates the number of non-winning survivors. The middle column describes the duration of order-preserving partial contrast-enhanced pattern persistence after the stimuli is removed. The right column summarizes the time until the network reaches stable pattern storage. Results for (B) the rate-based circuit, (C) the spiking circuit with global connectivity, (D) the spiking circuit with interneuron-mediated inhibition, and (E) the spiking circuit with distance-dependent connectivity. Parameters for individual simulations used in Figure 4 are highlighted by black squares. Recurrent parameters for Figures 6 and 7 are highlighted by black hexagons.
There is a region in which a balance of excitation and inhibition enables gradual network resolution in all four circuits. An order preserving and partially contrast-enhanced pattern lasts longer and the network reaches a stable pattern later inside this region than outside. In the middle column of Figure 5, this region is characterized by a long duration of pattern maintenance, made prominent as tilted diamonds, when it exceeds 800 ms. In the right column of Figure 5, this region corresponds with a later time for the network to reach a stable pattern, made prominent as larger and lighter circles as the time approaches 5000 ms. This balance is not a simple ratio of excitation to inhibition since the shape of this region has curvature and does not cross through the origin. For the interneuron-mediated circuit, the dynamics favor the persistence of partially contrast-enhanced patterns when the excitation is high in this region, as indicated by the white diamonds enclosed by a black line (Order-preserving Pattern Persistence column, Figure 5D. For the same circuit, the network activities stabilize after a longer duration (3000–4000 ms after the stimulus offset). When the inhibition is high in this region, the collection of large circles enclosed by a black line form to demark it (Time to Stability column, Figure 5D). For the distance-dependent circuit, the network dynamics show a similar pattern of pattern persistence with high excitation (Order-preserving Pattern Persistence column, Figure 5E). High inhibition again leads to a longer duration to achieve network stability (Time to Stability column, Figure 5E). These properties are not as clear in the rate-based circuit and the spiking circuit with global connectivity under the parameter ranges tested.
In this region of gradual dynamics, the spiking circuits do differ in their behavior. The circuit with global inhibitory connectivity generally resolves to WTA storage of one or more winners (left column, Figure 5C). The circuit in which inhibition is mediated by interneurons sustains partially contrast-enhanced patterns longer, which often stabilize as the stored pattern (left column, Figure 5D). In the case of the distance-dependent circuit, the network can fail to maintain the activity ordering in the input (crosses in middle column, Figure 5E). Instead, the network activities in the distance-dependent circuit often split into clusters. For example, cells with high input may form a cluster of activity and cells with a low input may form a cluster of activity, whereas the activity in the two clusters where cells receive intermediate input may be diminished or quenched to zero. This is discussed further in “Different Properties of Circuit Variants: Clusters in Stm and Oscillations”.
Varying the Transfer Function
To assess the impact of cell signaling, the strengths of the recurrent excitatory and inhibitory signals were varied. The size of the region of gradual dynamics with low excitation and low inhibition is narrower than the rest of the region with stronger recurrence. In Figure 5C, for example, the region enclosed by the black line narrows with decreasing recurrence from 0.4 pS of excitation and 2 fS of inhibition to 0.15 pS of excitation and 1 fS of inhibition. A change in the excitatory or inhibitory interaction strength has a larger effect on the network dynamics here than elsewhere, because a small change moves the system outside the region of gradual dynamics if it is narrow. The circuits were evaluated with recurrent strengths chosen to lie within this parameter range, because we expect a change in the feedback signal function to have a significant effect on network dynamics here. In the spiking circuits, the excitatory strength, gAMPA−RE in Eq. (29), is set to 0.14 pS and the inhibitory strength, gGABA in Eq. (30), is set equal to 1.6 fS, while in the rate-based circuit, the excitatory parameter D in Eq. (1) is set to 0.2 and the inhibitory parameter C in Eq. (1) is set to 1, (these parameter settings appear as hexagons in Figure 5).
For the rate-based circuit, the threshold and slope of the signal function were manipulated directly by changing the parameters S and T in Eq. (2). For the spiking circuits, it is known from previous work (Palma et al., 2011) that modulation of the three somatic AHP currents in spiking mammalian pyramidal cells can change the slope and threshold of its transfer functions. For the specific pyramidal model here, an increase in threshold of the transfer function occurs with conductance changes of −0.3 pS, +0.004 pS, and +0.0014 pS to fAHP, mAHP and sAHP, respectively, that is, gfAHP, gmAHP, and gsAHP, in Eqs. (25)–(27). To compare parametrically, we define this as a unit change in the abstract threshold T, where T = 0 for baseline AHP conductance. For example, applying this twice (−0.6 pS to fAHP, 0.008 pS to mAHP, etc.) would correspond with T = 2. In contrast, a steepening of the slope of the transfer function occurs with conductance changes of −0.04 pS, −0.0106 pS, and +0.0012 pS to fAHP, mAHP and sAHP, respectively. Likewise, we define this as a unit change in the abstract slope S.
Lowering the threshold of the transfer function causes a shift to the left in the hill function (Figures 6A,D). The lowest abscissa value of the hill function is depicted as a thin vertical dotted line (Figures 6A–D, left side). We expect a correlated decrease in the quenching threshold, since the quenching threshold abscissa covaries with the position of the leftmost peak of the hill function (see analysis in Section 3.6). The resultant decrease in quenching threshold allows more cells to survive the competition (see stored states in Figures 6A,D). Decreasing the slope of the transfer function causes a widening of the peak in the hill function (the dashed curves widen in the Hill Function column of Figures 6B,D) without a significant change to the position of the peak itself (the vertical dotted line in the Hill Function column Figures 6B,D). Of the two dashed vertical lines in the middle column of Figure 6, the gray lines denote the time of the last ordering-preserving partially contrast-enhanced pattern, while the black dashed lines denote the time at which the network reaches a stable pattern. A decrease in slope extends the persistence of order-preserving partially contrast-enhanced activity patterns, represented by the temporal position of gray dashed lines in the middle column, which shift later in Figures 6B,D compared to those in Figures 6A,C.
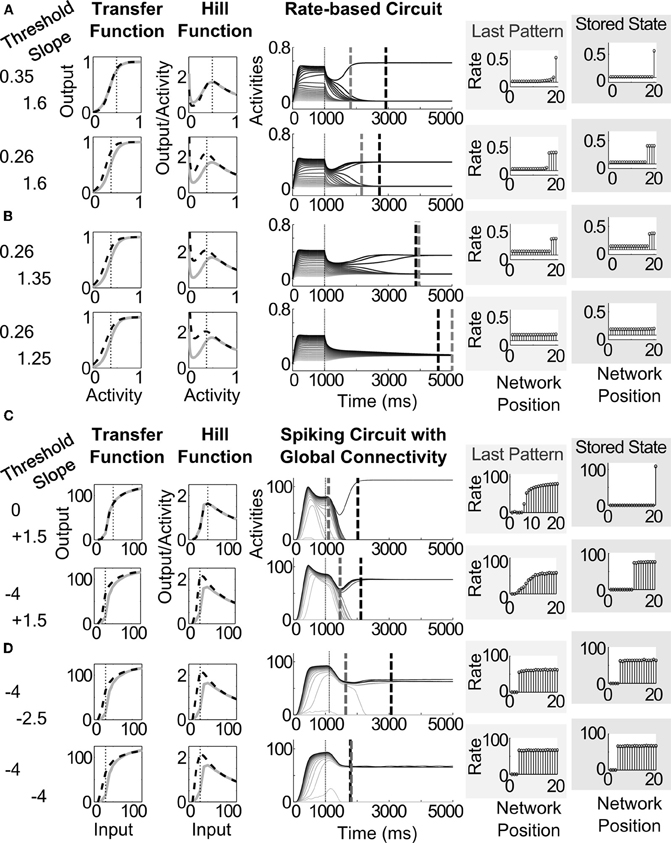
Figure 6. Pattern storage depends on sigmoid transfer function shape, changing the threshold and slope of the sigmoid transfer function by altering the conductances of AHP currents. (A) Decreasing threshold and (B) decreasing slope for the rate-based circuit, in parallel with (C) decreasing threshold and (D) decreasing slope for the spiking circuit with global connectivity. Left column shows the changes to the variables for threshold and slope. The resultant transfer functions and hill functions are depicted as black dashed lines over the corresponding functions under basal conditions shown in gray—that is with the strengths of AHP currents matching those in Table 2. Middle column depicts the activities of the network over the 5000 ms simulation. Dashed gray and dashed black lines across the activities denote the time of the last distributed partially contrast-enhanced pattern and the time when the network stabilizes on its storage state, respectively. The right plots show the rates across the network positions at those two times, labeled the last pattern and the stored state.
To understand the effect of changing the transfer function more completely, 289 simulations were carried out and used to construct parametric maps of these dynamics. Across all four circuit variants, the network dynamics show a similar dependence on the threshold and slope (Figure 7). As noted for the examples in (Figures 6A,D), the threshold of the transfer function systematically changes with the lowest abscissa value of the peak of the hill function in both rate-based and spiking cells (Figure 7A). A decrease in slope in both rate-based and spiking models increases the width around the peak of the hill function (Figure 7B). As a result, in all the circuits, when the threshold is high (left column of Figure 7, right side plots), the network activities are quenched and decay to zero. As the threshold is decreased (left column of Figure 7, left side of plots), the network patterns tend to include more winners.
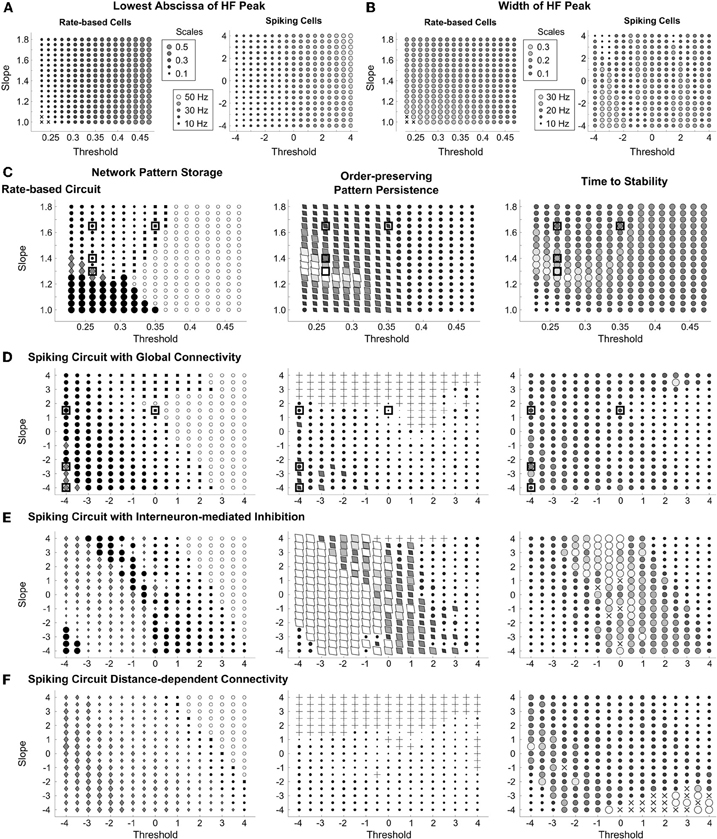
Figure 7. Parametric maps of transfer function modulation for various circuits. (A) The width of the hill function (HF) peak plotted as a function of threshold and slope for rate-based and spiking model excitatory cells; (B) the lowest abscissa value of the hill HF peak plotted as a function of threshold and slope for rate-based and spiking model cells; (C–F) these maps follow the same key and columns from Figure 5, but as a function of threshold and slope of the signal or transfer function. The left column characterizes the type of network pattern storage at the end of the simulation time. The middle column describes the duration of partially contrast-enhanced pattern persistence after the stimulus. The right column summarizes the time when the network reaches stable pattern storage. Results for (C) the rate-based circuit, (D) the spiking circuit with global connectivity, (E) the spiking circuit with interneuron-mediated inhibition, and (F) the spiking circuit with distance-dependent connectivity. Parameters for individual simulations used in Figure 6 are highlighted by black squares.
There is a region of gradual network transitions that depends on the shape of transfer functions (Order-preserving Pattern Persistence and Time to Stability columns, Figure 7). This region is important for modulation of network dynamics. The changes in transfer function shape can cause the same range of storage behaviors seen with different recurrent anatomies (Figures 5 and 7). This enables global signals from other sources, such as cholinergic modulation, to control network activity persistence and STM storage without manipulating excitatory and inhibitory connectivity. We evaluate this further in Sections “Cholinergic Modulation” and discuss the behavioral significance in Section “Discussion: The Role of Ach in Stm Storage and Vigilance Control”.
In the spiking circuits, the changes in transfer function are performed by manipulation of the AHP conductances, which can also have temporal effects that are not always found in the rate-based circuit. When the transfer function slope is steep (top half of plots in Figure 7), then the slow AHP current (sAHP) will be quite strong. A steeper slope is caused by an increase in sAHP from 0.2 pS up to 0.6 pS or higher. A strong sAHP also causes adaptation, or habituation, of cell firing, and thereby also an adaptation in the total inhibition across the network. This adaptation, if strong enough, can lead to a rebound effect in cell activity, in that, as the network inhibition weakens during the strong sAHP onset, cells that have fired less have the opportunity to rebound in the competition. This rebound effect can disrupt the order preservation in the network, and hence pattern maintenance (denoted as crosses at the top of plots, middle column of Figures 7D,F). Based on physiological measurements (Table 3), we do not expect rebounds to be the typical behavior of the system, but it does mean that AHP modulation has a limited range before it starts to perturb order preservation. We do not notice any rebounds from fAHP and mAHP (which would occur at bottom left and right of the plot in the middle column of Figure 7). The fAHP is too fast to cause a rebound effect on the time scale of the network competition, while mAHP is not changed as drastically as the sAHP during a modulation in transfer function shape.
Different Properties of Circuit Variants: Clusters in STM and Oscillations
While the circuit variants share the aforementioned similarities in dynamics, they also exhibit important differences. When the connectivity across the network is distance-dependent, the activities of cells have a tendency to form clusters, or cell assemblies. The manipulation of recurrent connectivity and transfer function can control the size and the number of clusters. Increasing inhibition in a distance-dependent circuit may cause the activities across a group of cells to be split into two clusters (Figure 8A). It is crucial to note that the region of most gradual network dynamics (Figure 5E, Order-preserving Pattern Persistence and Time to Stability columns) correspond to the transition between a larger cluster and two smaller clusters from the larger cluster split (exemplified in Figure 8A, and mapped in Figure 8B, left side). In other words, the network activities stabilize more slowly when the network pattern is close to resolving to either one or two clusters.
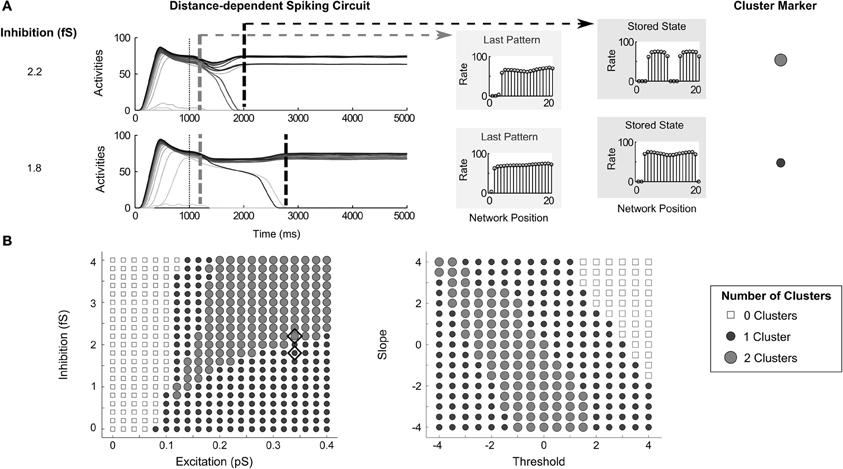
Figure 8. Clustering in distance-dependent circuit. (A) Network activities with inhibition set to 2.2 fS and 1.8 fS with excitation at 0.34pS. Dashed gray and dashed black lines denote the time of the last partially contrast-enhanced pattern and the time when the network stabilizes on its storage state, respectively. The right plots show the rates across the network positions at those two times, the last pattern, and the stored stable state; (B) the number of STM clusters in the network at steady state over parametric changes in recurrent excitatory and inhibitory strengths (left) as well as changes in transfer function (right). Diamonds indicate the parameters used for (A). Since the architecture is a ring network, clusters can span the connection between the cell with index 1 to the last cell with index 20.
By manipulating the transfer function shape (Figure 8B, right side), the pattern storage can transition from no stored activity (top right corner), to one small cluster (upper right band), to two small clusters (middle band), to two small clusters (lower left corner). Since the architecture is a ring network, the cell with highest input is adjacent to the cell of lowest input. Because of this, a cluster can span, or wrap around, the connection between the cell with index 1 and the last cell with index 20.
When the inhibition across the network is mediated indirectly by inhibitory interneurons, the network dynamics often store a partially contrast-enhanced pattern. This circuit variant also exhibits oscillations under some parameters. Specifically, with a high level of inhibition in the circuit, delta oscillations (that is, oscillations between 1–4 Hz) become apparent in the activity traces (Figure 9A). Fourier analysis of the spike output, when inhibition rises from 2.8 fS to 3.2 fS, reveals a shift from power dominance in the high frequencies (Figure 9B, left side)—around 80 Hz in the gamma range—to power dominance in the delta range (Figure 9B, right side). This corresponds to the physiologically observed increases in delta oscillations with increased GABA agonists (Lancel and Faulhaber, 1996). The delta power strengthens with increasing excitatory recurrence, but only appears when inhibitory strength exceeds 3 fS (Figure 9D). The time to stability is longer (map in Figure 9C, repeated from Figure 5) in the same parameter region that delta power is strong (Figure 9D). This is because the oscillation in the network is greater than 3% of the cell activity rates and the network is not considered stable until the end of the simulation (see Evaluation of Network Dynamics).
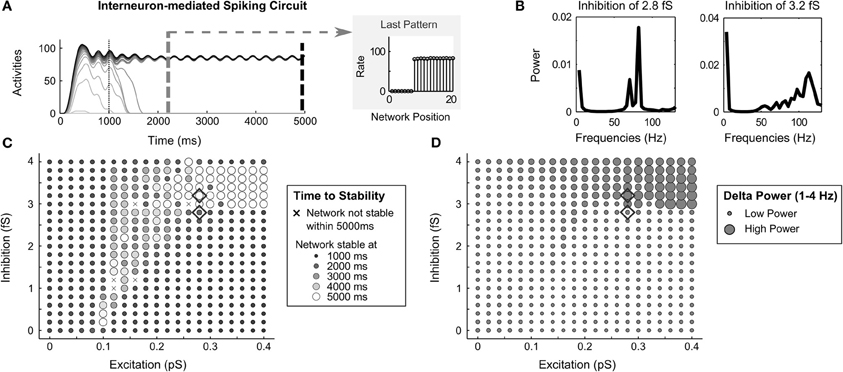
Figure 9. Oscillations in interneuron-mediated circuit. (A) a network oscillation of about 3.7 Hz in the Delta range (1–4 Hz) in the spike rate activities in the interneuron-mediated spiking circuit when the recurrent excitatory and inhibitory is strong; (B) Fourier analysis of average network frequencies over the entire 5000 ms simulation with inhibition of 3.2 fS and 2.8 fS; (C) the time to network stability; and (D) the average Delta power as a function of recurrent excitatory and inhibitory strengths. Diamonds denote corresponding parameters to the frequency plots in (B).
Cholinergic Modulation
To evaluate the ability of cholinergic signals to modulate network dynamics, we estimate the levels of ACh during different behavioral states (Table 4). We also estimate the effect of the transmitter on the three AHP currents (Table 3). and then apply this to the evaluation of network storage (Figure 10). The excitation and inhibition are chosen such that, at a basal level of ACh, that is the level of ACh expected in a waking though attentionally undemanding state, the network rapidly resolves to a WTA pattern with a single winning cell in response to the ramp stimulus. The recurrent excitation and inhibition are set to 0.14pS and 2.8 fS for the globally connected spiking circuit, to 0.14 pS and 3.8 fS for the interneuron-mediated spiking circuit, and to 0.12pS and 3.6 fS for the distance-dependent spiking circuit. The parameters for threshold and slope are initially held at 0.0 and 0.0 by setting the AHP currents to the values in Table 2 for the basal level of ACh.
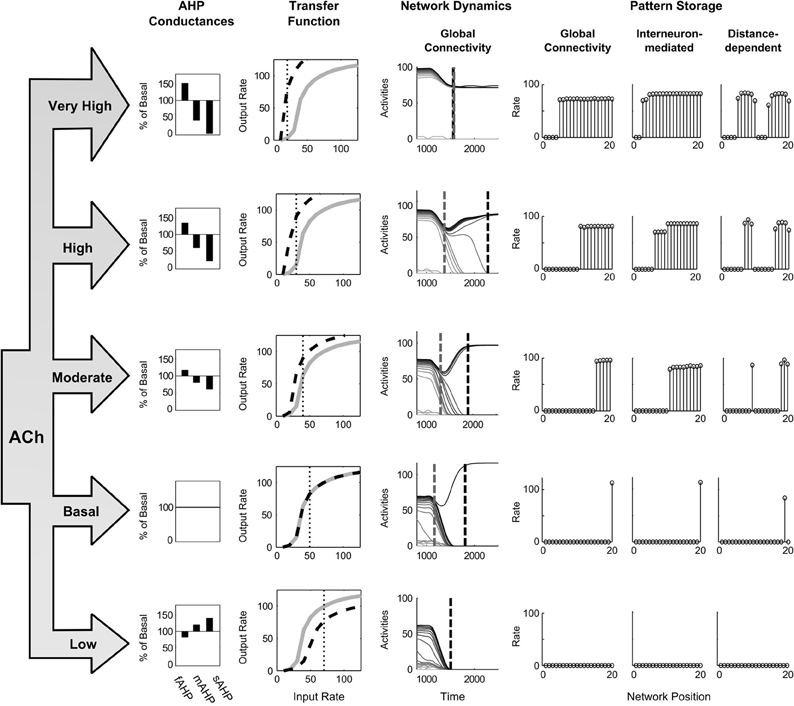
Figure 10. Changing the cholinergic modulation. The left side shows the behavioral levels of Acetylcholine, the corresponding changes in the three AHP currents, and the resultant transfer function shapes for the pyramidal spiking cell model. The right side depicts network dynamics at these ACh levels and the resulting STM stored states. Dashed gray and dashed black lines across the activities denote the time of the last partially contrast-enhanced pattern and the time when the network stabilizes on its storage state, respectively. The right plots show the rates across the network positions at those two times, the last pattern and the stored state.
The results show that increasing ACh from these starting conditions causes a decreased threshold and increased slope (Figure 10, Transfer Function column, moving from bottom to top), and thereby a smaller minimal abscissa of the hill function peak, and a lower quenching threshold. The resultant network dynamics store more items in STM (Figure 10, Pattern Storage column) by maintaining more items in order-preserving patterns for longer (Figure 10, Network Dynamics column). For the spiking circuit with distance-dependent connectivity, a single winner transitions to multiple clusters as ACh increases (Figure 10, right column of Pattern Storage). At a moderate level of ACh, the cluster of cells, which received more input, includes more cells (Figure 10, middle row of right column), but when ACh increases to very high values (Figure 10, top row of right column), the two clusters increase to be approximately the same size.
Analog Activity Normalization and STM Storage
To address whether the qualitative dynamics of the networks are sensitive to the intensity of stimuli, the same stimulus pattern was presented to the spiking circuit with global connectivity at two different magnitudes, the original ramp up to 200 Hz (Figure 11A), and a half intensity ramp up to 100 Hz (Figure 11B). The resultant parameter maps (Network Pattern Storage, Order-preserving Pattern Persistence, and Time to Stability columns of Figure 11) are nearly identical for both stimuli. We conclude that the parameter regimes of network dynamics, at least in the range we examined, are sensitive to the activity ordering, but normalize well enough to not be strongly dependent on the amplitude of the presented stimuli once they exceed the quenching threshold.
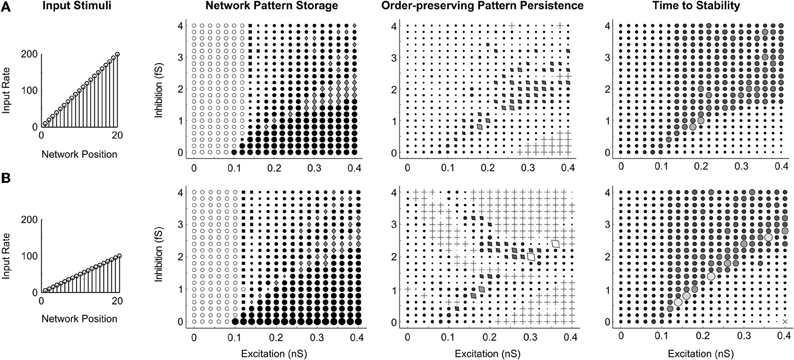
Figure 11. Processing with different stimuli strength. Parametric maps, as in Figure 5, indicate the type of network pattern storage at the end of the simulation time, the duration of partial contrast-enhanced pattern persistence after the stimuli is removed, and the time until the network reaches stable pattern storage: (A) for a ramp stimuli of input rates up to 200 Hz (shown before); and (B) for a ramp stimuli of half the magnitude with input rates up to 100 Hz.
Discussion: the Role of ACH in STM Storage and Vigilance Control
Palma et al. (2011) demonstrated how fast, medium, and slow AHP conductances can together independently control the threshold and slope of a sigmoidal signal function, and how ACh can alter the sigmoidal signal threshold, rather than just cause a change in excitability, as had previously been hypothesized. Building on these findings and a mathematical analysis of recurrent shunting on-center off-surround networks in Grossberg (1973), this paper analyses how changes in AHP currents, ACh, and recurrent connectivity impact the transformation of input patterns and their STM storage by recurrent circuits. The results show that, with an appropriate degree of recurrent excitation and inhibition, spiking networks maintain a partially contrast-enhanced pattern for 800 ms or longer after stimuli termination. After this intermediate period, network activities resolve to no stored pattern, or to WTA stored patterns with one or multiple winners. When inhibition is mediated by inhibitory interneurons, the partial contrast-enhanced pattern may also be stored at equilibrium. Strengthening inhibition prolongs a partially contrast-enhanced pattern by slowing the transition, while strengthening excitation causes more winners when the network stabilizes. Changes in the shape of sigmoidal transfer functions, determined by the collective state of AHP conductances, can control the maintenance of a partially contrast-enhanced pattern and the size of the pattern that is stored. Changes in AHP currents due to ACh influx can cause a decrease in the threshold and an increase in the slope of the transfer function which can lengthen the persistence of a partially contrast-enhanced pattern, increase the number of winners, or, if connectivity is distance-dependent, cause cell activities to store multiple clusters.
These properties clarify how activation of ACh by basal forebrain circuits, notably nucleus basalis of Meynert, may alter the brain's sensitivity to predictive mismatches, and thus the vigilance with which the learning or recognition categories is modulated in the brain. Adaptive Resonance Theory demonstrated how low vigilance could lead to the learning of general, or abstract, categories, whereas high vigilance could lead to the learning of specific, or concrete, categories (Carpenter and Grossberg, 1987, 1991). When a predictive error causes a mismatch to occur, the vigilance level is increased until the currently active category, that caused the mismatch, is reset and a memory search is triggered that may lead to learning of a new, and more concrete, category that better matches the input data. Grossberg and Versace (2008) proposed that ACh could act as a vigilance-regulating signal when it is released in response to mismatch-mediated activation of the nucleus basalis of Meynert. One source of the mismatch signals was proposed to be the nonspecific thalamus (Kraus et al., 1994). The current results clarify how this can happen by demonstrating the effects of ACh on input pattern transformation and storage in STM.
ACh slows the speed of network transitions to stability, hence allowing the competition between representations to increase the persistence of input patterns before settling on a stored representation. When connectivity strengths are distance-dependent, ACh increases can lead to more clusters. In the situation of category mismatch, this change could effectively reopen the competition between potential representations.
Recent behavioral and physiological data support a role for ACh in mammalian cortex in modulating the specificity in short-term and long-term pattern storage. While ACh is often considered to boost plasticity simply via excitability, recent evidence suggests that fluctuations in cortical ACh are not necessary for simple associative learning, but are necessary for learning mainly when there is featural overlap during perceptual categorization (Chiba et al., 1995; Atri et al., 2004; Botly and De Rosa, 2007; Hata et al., 2007; Winters et al., 2007), consistent with the idea that it can increase vigilance to achieve better categorical separation. Further support for this idea comes from lesions in rats of the nucleus basalis of Meynert which have little impact on learning rate, except when there is a high degree of interference between the categories to be learned, that is, when categories share the same features in a certain dimension (Botly and De Rosa, 2007, 2009). Similarly, studies in humans show that scopolamine, by competitively binding muscarinic receptors, diminishes learning of overlapping word pairs more than non-overlapping pairs (Atri et al., 2004). Meanwhile, associative learning studies in rats with combinations of light and tone has shown that the concentration of released ACh increases more during discrimination learning experiments in which an individual stimulus (A, e.g., light) signals reward and a compound stimulus (AB, e.g., light + tone) signals no reward, than during elemental discrimination, in which one stimulus (A, e.g., light) signals reward and another stimulus (B, e.g., tone) signals no reward (Hata et al., 2007). Finally, donepezil, which increases cortical ACh by inhibiting its degradation by Acetylcholinesterase (AChE), has been shown by fMRI to reduce the expanse of response in V1 from a pulsating visual stimulus (Silver et al., 2008). Taken together, these data suggest that increased ACh (and attention) refines perceptual representations by adding specificity. The model simulations of how the transformation and STM storage of input patterns is modulated by ACh clarify how this might occur.
Several other studies provide further findings, perspectives and questions. Recent studies of the effects of scopolamine on human memory formation suggest that high levels of ACh promote rapid encoding, whereas low levels of ACh support consolidation (Rasch et al., 2006). This parallels the rapid single instance learning and category refinement predicted in ART by mismatch and match, respectively. Similar studies with scopolamine make the claim that lowering ACh improves consolidation by preventing possible interference with conflicting information (Winters et al., 2007). Inference in both cases could be interpreted as learning of categories that are too general for the more difficult task. At the other end of the spectrum, representation specificity might be necessary for the detection of certain kinds of novelty. For example, when search after reset in ART fails to find a satisfactory alternative category, a new representation is rapidly formed. Indeed, a recent object discrimination study in rats shows that scopolamine reduces the novelty discrimination ratio (Ballaz, 2009).
Numerous data remain to be included in a complete model of the effects of ACh on pattern processing in neocortex. Crucially, experiments have shown that ACh release causes desynchronization between cortical cells (Goard and Dan, 2009) in conjunction with up-regulation of high gamma oscillations (Canolty et al., 2006). Recent experimental results also show that both this desynchronization (Pandya et al., 2005) and gamma oscillations regulation (Keizer et al., 2010) may be crucial for interference learning, as previously described. Adaptive Resonance Theory predicted that synchronous oscillations may occur during category learning (e.g., Grossberg, 1976, 1980). Grossberg and Versace (2008) refined this analysis to describe how gamma oscillations may occur in a match state that supports learning, whereas slower beta oscillations may occur in a mismatch state that triggers reset and search for a better matching category. While we not simulated here, these mechanics operate in conjunction with the effects of ACh on AHP currents and could also be regulated by such modulation.
Conflict of Interest Statement
The authors declare that the research was conducted in the absence of any commercial or financial relationships that could be construed as a potential conflict of interest.
Acknowledgments
Supported in part by CELEST, an NSF Science of Learning Center (SBE-0354378) and by the DARPA SyNAPSE program (HR0011-09-C-0001).
References
Abel, H. J., Lee, J. C. F., Callaway, J. C., and Foehring, R. C. (2004). Relationships between intracellular calcium and afterhyperpolarizations in neocortical pyramidal neurons. J. Neurophysiol. 91, 324–335.
Akins, P. T., Surmeier, D. J., and Kitai, S. T. (1990). Muscarinic modulation of a transient K+ conductance in rat neostriatal neurons. Nature 344, 240–242.
Arnold, H. M., Burk, J. A., Hodgson, E. M., Sarter, M., and Bruno, J. P. (2002). Differential cortical acetylcholine release in rats performing a sustained attention task versus behavioral control tasks that do not explicitly tax attention. Neuroscience 114, 451–460.
Atri, A., Sherman, S., Norman, K. A., Kirchhoff, B. A., Nicolas, M. M., Greicius, M. D., Cramer, S. C., Breiter, H. C., Hasselmo, M. E., and Stern, C. E. (2004). Blockade of central cholinergic receptors impairs new learning and increases proactive interference in a word paired-associate memory task. Behav. Neurosci. 118, 223–236.
Ballaz, S. J. (2009). Differential novelty detection in rats selectively bred for novelty-seeking behavior. Neurosci. Lett. 461, 45–48.
Barkai, E., and Hasselmo, M. E. (1994). Modulation of the input/output function of rat piriform cortex pyramidal cells. J. Neurophysiol. 72, 644–658.
Berzhanskaya, J., Grossberg, S., and Mingolla, E. (2007). Laminar cortical dynamics of visual form and motion interactions during coherent object motion perception. Spat. Vis. 20, 337–395.
Bock, D. D., Lee, W.-C. A., Kerlin, A. M., Andermann, M. L., Hood, G., Wetzel, A. W., Yurgenson, S., Soucy, E. R., Kim, H. S., and Reid, R. C. (2011). Network anatomy and in vivo physiology of visual cortical neurons. Nature 471, 177–182.
Bordey, A., Sontheimer, H., and Trouslard, J. (2000). Muscarinic activation of BK channels induces membrane oscillations in glioma cells and leads to inhibition of cell migration. J. Membr. Biol. 176, 31–40.
Bosking, W. H., Zhang, Y., Schofield, B., and Fitzpatrick, D. (1997). Orientation selectivity and the arrangement of horizontal connections in the tree shrew striate cortex. J. Neurosci. 7, 2112–2127.
Botly, L. C., and De Rosa, E. (2007). Cholinergic influences on feature binding. Behav. Neurosci. 121, 264–276.
Botly, L. C., and De Rosa, E. (2009). Cholinergic deafferentation of the neocortex using 192 igg-saporin impairs feature binding in rats. J. Neurosci. 29, 4120–4130.
Camperi, M., and Wang, X.-J. (1998). A model of visuospatial working memory in prefrontal cortex: recurrent network and cellular bistability. J. Comput. Neurosci. 5, 383–405.
Canolty, R. T., Edwards, E., Dalal, S. S., Soltani, M., Nagarajan, S. S., Kirsch, H. E., Berger, M. S., Barbaro, N. M., and Knight, R. T. (2006). High gamma power is phase-locked to theta oscillations in human neocortex. Science 313, 1626–1628.
Cantrell, A. R., and Catterall, W. A. (2001). Neuromodulation of Na+ channels: an unexpected form of cellular plasticity. Nat. Rev. Neurosci. 2, 397–407.
Carpenter, G. A. (1997). Distributed learning, recognition, and prediction by ART and ARTMAP neural networks. Neural Netw. 10, 1473–1494.
Carpenter, G. A., and Grossberg, S. (1987). A massively parallel architecture for a self-organizing neural pattern recognition machine. Comput. Vis. Graph. Image Process. 37, 54–115.
Carpenter, G. A., and Grossberg, S. (1991). Pattern Recognition by Self-Organizing Neural Networks. Cambridge, MA: MIT Press.
Chiba, A. A., Bucci, D. J., Holland, P. C., and Gallagher, M. (1995). Basal forebrain cholinergic lesions disrupt increments but not decrements in conditioned stimulus processing. J. Neurosci. 15, 7315–7322.
Chisum, H. J., Mooser, F., and Fitzpatrick, D. (2003). Emergent properties of Layer 2/3 neurons reflect the collinear arrangement of horizontal connections in tree shrew visual cortex. J. Neurosci. 23, 2947–2960.
Connors, B. W., and Gutnick, M. J. (1990). Intrinsic firing patterns of diverse neocortical neurons. Trends Neurosci. 13, 99–104.
Cox, D. H., Cui, J., and Aldrich, R. W. (1997). Allosteric gating of a large conductance ca-activated K+ channel. J. Gen. Physiol. 110, 257–281.
Crouzier, D., Baubichon, D., Bourbon, F., and Testylier, G. (2006). Acetylcholine release, EEG spectral analysis, sleep staging and body temperature studies: a multiparametric approach on freely moving rats. J. Neurosci. Methods 151, 159–167.
Curto, C., Sakata, S., Marguet, S., Itskov, V., and Harris, K. D. (2009). A simple model of cortical dynamics explains variability and state dependence of sensory responses in Urethane-Anesthetized auditory cortex. J. Neurosci. 29, 10600–10612.
de la Rocha, J., Marchetti, C., Schiff, M., and Reyes, A. D. (2008). Linking the response properties of cells in auditory cortex with network architecture: cotuning versus lateral inhibition. J. Neurosci. 28, 9151–9163.
Destexhe, A., Mainen, Z. F., and Sejnowski, T. J. (1994a). Synthesis of models for excitable membranes, synaptic transmission and neuromodulation using a common kinetic formalism. J. Comput. Neurosci. 1, 195–230.
Destexhe, A., Mainen, Z. F., and Sejnowski, T. J. (1994b). An efficient method for computing synaptic conductances based on a kinetic model of receptor binding. Neural Comput. 6, 14–18.
Dranias, M., Grossberg, S., and Bullock, D. (2008). Dopaminergic and non-dopaminergic value systems in conditioning and outcome-specific revaluation. Brain Res. 1238, 239–287.
Ellias, S., and Grossberg, S. (1975). Pattern formation, contrast control, and oscillations in the short term memory of shunting on-center off-surround networks. Biol. Cybern. 20, 69–98.
Elman, J. L. (1991). Distributed representations, simple recurrent networks, and grammatical structure. Mach. Learn. 7(2–3), 195–225.
Fellous, J.-M. M., Rudolph, M., Destexhe, A., and Sejnowski, T. J. (2003). Synaptic background noise controls the input/output characteristics of single cells in an in vitro model of in vivo activity. Neuroscience 122, 811–829.
Freeman, W. J. (1979). Nonlinear gain mediating cortical stimulus-response relations. Biol. Cybern. 33, 237–247.
Gil, Z., Connors, B., and Amitai, Y. (1999). Efficacy of thalamocortical and intracortical synaptic connections: quanta, innervation, and reliability. Neuron 23, 385–397.
Giocomo, L., and Hasselmo, M. (2007). Neuromodulation by glutamate and acetylcholine can change circuit dynamics by regulating the relative influence of afferent input and excitatory feedback. Mol. Neurobiol. 36, 184–200.
Goard, M., and Dan, Y. (2009). Basal forebrain activation enhances cortical coding of natural scenes. Nat. Neurosci. 12, 1444–1449.
Grossberg, S. (1968). Some physiological and biochemical consequences of psychological postulates. Proc. Natl. Acad. Sci. U.S.A 60, 758–765.
Grossberg, S. (1973). Contour enhancement, short-term memory, and constancies in reverberating neural networks. Stud. Appl. Math. 52, 213–257.
Grossberg, S. (1976). Adaptive pattern classification and universal recoding, II: feedback, expectation, olfaction, and illusions. Biol. Cybern. 23, 187–202.
Grossberg, S. (1988). Nonlinear neural networks: principles, mechanisms, and architectures. Neural Netw. 1, 17–61.
Grossberg, S., and Kazerounian, S. (2011). Laminar cortical dynamics of conscious speech perception: a neural model of phonemic restoration using subsequent context in noise. J. Acoust. Soc. Am. 130, 440–460.
Grossberg, S., and Levine, D. (1975). Some developmental and attentional biases in the contrast enhancement and short term memory of recurrent neural networks. J. Theor. Biol. 53, 341–380.
Grossberg, S., and Levine, D. (1976). On visual illusions in neural networks: line neutralization, tilt aftereffect, and angle expansion. J. Theor. Biol. 61, 477–504.
Grossberg, S., and Myers, C. W. (2000). The resonant dynamics of speech perception: interword integration and duration-dependent backward effects. Psychol. Rev. 107, 735–767.
Grossberg, S., and Pearson, L. (2008). Laminar cortical dynamics of cognitive and motor working memory, sequence learning and performance: toward a unified theory of how the cerebral cortex works. Psychol. Rev. 115, 677–732.
Grossberg, S., and Seidman, D. (2006). Neural dynamics of autistic behaviors: cognitive, emotional, and timing substrates. Psychol. Rev. 113, 483–525.
Grossberg, S., and Versace, M. (2008). Spikes, synchrony, and attentive learning by laminar thalamocortical circuits. Brain Res. 1218, 278–312.
Grossberg, S., and Williamson, J. R. (2001). A neural model of how horizontal and interlaminar connections of visual cortex develop into adult circuits that carry out perceptual groupings and learning. Cereb. Cortex 11, 37–58.
Hasselmo, M. E., Schnell, E., and Barkai, E. (1995). Dynamics of learning and recall at excitatory recurrent synapses and cholinergic modulation in rat hippocampal region CA3. J. Neurosci. 15, 5249–5262.
Hata, T., Kumai, K., and Okaichi, H. (2007). Hippocampal acetylcholine efflux increases during negative patterning and elemental discrimination in rats. Neurosci. Lett. 418, 127–132.
Hestrin, S., and Armstrong, W. E. (1996). Morphology and physiology of cortical neurons in layer i. J. Neurosci. 16, 5290–5300.
Hicks, G. A., and Marrion, N. V. (1998). Ca2+-dependent inactivation of large conductance Ca2+-activated K+ (BK) channels in rat hippocampal neurones produced by pore block from an associated particle. J. Physiol. 508, 721–734.
Hodgkin, A. L., and Huxley, A. F. (1952). A quantitative description of membrane current and its application to conduction and excitation in nerve. J. Physiol. 117, 500–544.
Hotson, J. R., and Prince, D. A. (1980). A calcium-activated hyperpolarization follows repetitive firing in hippocampal neurons. J. Neurophysiol. 43, 409–419.
Hsieh, C. Y., Cruikshank, S. J., and Metherate, R. (2000). Differential modulation of auditory thalamocortical and intracortical synaptic transmission by cholinergic agonist. Brain Res. 880, 51–64.
Keizer, A. W., Verschoor, M., Verment, R. S., and Hommel, B. (2010). The effect of gamma enhancing neurofeedback on the control of feature bindings and intelligence measures. Int. J. Psychophysiol. 75, 25–32.
Klink, R., and Alonso, A. (1997). Muscarinic modulation of the oscillatory and repetitive firing properties of entorhinal cortex layer II neurons. J. Neurophysiol. 77, 1813–1828.
Köhn, J., and Wörgötter, F. (1998). Employing the zeta-transform to optimize the calculation of the synaptic conductance of NMDA and other synaptic channels in network simulations. Neural Comput. 10, 1639–1651.
Kong, W.-J. J., Guo, C.-K. K., Zhang, S., Hao, J., Wang, Y.-J. J., and Li, Z.-W. W. (2005). The properties of ach-induced BK currents in guinea pig type ii vestibular hair cells. Hear. Res. 209, 1–9.
Kong, W.-J. J., Guo, C.-K. K., Zhang, X.-W. W., Chen, X., Zhang, S., Li, G.-Q. Q., Li, Z.-W. W., and Van Cauwenberge, P. (2007). The coupling of acetylcholine-induced BK channel and calcium channel in guinea pig saccular type ii vestibular hair cells. Brain Res. 1129, 110–115.
Köppen, A., Klein, J., Schmidt, B. H., van der Staay, F. J., and Löffelholz, K. (1996). Effects of nicotinamide on central cholinergic transmission and on spatial learning in rats. Pharmacol. Biochem. Behav. 53, 783–790.
Kraus, N., McGee, T., Littman, T., Nicol, T., and King, C. (1994). Nonprimary auditory thalamic representation of acoustic change. J. Neurophysiol. 72, 1270–1277.
Lancaster, B., and Adams, P. R. (1986). Calcium-dependent current generating the afterhyperpolarization of hippocampal neurons. J. Neurophysiol. 55, 1268–1282.
Lancel, M., and Faulhaber, J. (1996). The GABAA agonist THIP (gaboxadol) increases non-REM sleep and enhances delta activity in the rat. Neuroreport 7, 2241–2245.
Lau, P.-M., and Bi, G.-Q. (2005). Synaptic mechanisms of persistent reverberatory activity in neuronal networks. Proc. Natl. Acad. Sci. U.S.A. 102, 10333–10338.
Lee, J. C. F., Callaway, J. C., and Foehring, R. C. (2005). Effects of temperature on calcium transients and ca2+-dependent afterhyperpolarizations in neocortical pyramidal neurons. J. Neurophysiol. 93, 2012–2020.
Levitt, J. B., Yoshioka, T., and Lund, J. S. (1994). Intrinsic cortical connections in macaque visual area V2, evidence for interaction between different functional streams. J. Comp. Neurol. 342, 551–570.
Lima, P. A., and Marrion, N. V. (2007). Mechanisms underlying activation of the slow ahp in rat hippocampal neurons. Brain Res. 1150, 74–82.
Lorenzon, N. M., and Foehring, R. C. (1992). Relationship between repetitive firing and afterhyperpolarizations in human neocortical neurons. J. Neurophysiol. 67, 350–363.
Lorenzon, N. M., and Foehring, R. C. (1995). Characterization of pharmacologically identified voltage-gated calcium channel currents in acutely isolated rat neocortical neurons. J. Neurophysiol. 73, 1430–1442.
Marrosu, F., Portas, C., Mascia, M., Casu, M., Fa, M., Giagheddu, M., Imperato, A., and Gessa, G. (1995). Microdialysis measurement of cortical and hippocampal acetylcholine release during sleep-wake cycle in freely moving cats. Brain Res. 671, 329–332.
McCormick, D. A., Connors, B. W., Lighthall, J. W., and Prince, D. A. (1985). Comparative electrophysiology of pyramidal and sparsely spiny stellate neurons of the neocortex. J. Neurophysiol. 54, 782–806.
McCormick, D. A., Shu, Y., Hasenstaub, A., Sanchez-Vives, M., Badoual, M., and Bal, T. (2003). Persistent cortical activity: mechanisms of generation and effects on neuronal excitability. Cereb. Cortex 13, 1219–1231.
McCormick, D. A., and Williamson, A. (1989). Convergence and divergence of neurotransmitter action in human cerebral cortex. Proc. Natl. Acad. Sci. U.S.A. 86, 8098–8102.
Miller, P., Brody, C. D., Romo, R., and Wang, X.-J. (2003). A recurrent network model of somatosensory parametric working memory in the prefrontal cortex. Cereb. Cortex 13, 1208–1218.
Morishima, M., and Kawaguchi, Y. (2006). Recurrent connection patterns of corticostriatal pyramidal cells in frontal cortex. J. Neurosci. 26, 4394–4405.
Muller, W., Petrozzino, J. J., Griffith, L. C., Danho, W., and Connor, J. A. (1992). Specific involvement of ca(2+)-calmodulin kinase II in cholinergic modulation of neuronal responsiveness. J. Neurophysiol. 68, 2264–2269.
Nakajima, Y., Nakajima, S., Leonard, R. J., and Yamaguchi, K. (1986). Acetylcholine raises excitability by inhibiting the fast transient potassium current in cultured hippocampal neurons. Proc. Natl. Acad. Sci. U.S.A. 83, 3022–3026.
Ohki, K., Chung, S., Ch'ng, Y. H., Kara, P., and Reid, R. C. (2005). Functional imaging with cellular resolution reveals precise micro-architecture in visual cortex. Nature 433, 597–603.
Palma, J., Versace, M., and Grossberg, S. (2011). After-hyperpolarization currents and acetylcholine control sigmoid transfer functions in a spiking cortical model. J. Comput. Neurosci. 28, 1–28.
Pandya, P. K., Moucha, R., Engineer, N. D., Rathbun, D. L., Vazquez, J., and Kilgard, M. P. (2005). Asynchronous inputs alter excitability, spike timing, and topography in primary auditory cortex. Hear. Res. 203, 10–20.
Parikh, V., and Sarter, M. (2006). Cortical choline transporter function measured in vivo using choline-sensitive microelectrodes: clearance of endogenous and exogenous choline and effects of removal of cholinergic terminals. J. Neurochem. 97, 488–503.
Parikh, V., Kozak, R., Martinez, V., and Sarter, M. (2007). Prefrontal acetylcholine release controls cue detection on multiple timescales. Neuron 56, 141–154.
Pedarzani, P., and Storm, J. F. (1996). Evidence that ca/calmodulindependent protein kinase mediates the modulation of the Ca2+-dependent K+ current, Iahp, by acetylcholine, but not by glutamate, in hippocampal neurons. Pflügers Arch. 431, 723–728.
Perin, R., Berger, T. K., and Markram, H. (2011). A synaptic organizing principle for cortical neuronal groups. Proc. Natl. Acad. Sci. U.S.A. 108, 5419–5424.
Perrais, D., and Ropert, N. (1999). Effect of zolpidem on miniature IPSCs and occupancy of postsynaptic GABAA receptors in central synapses. J. Neurosci. 19, 578–588.
Phillips, R. G., and LeDoux, J. E. (1992). Differential contribution of amygdala and hippocampus to cued and contextual fear conditioning. Behav. Neurosci. 106, 274–285.
Pineda, J. C., Waters, R. S., and Foehring, R. C. (1998). Specificity in the interaction of HVA Ca2+-channel types with Ca2+-dependent AHPs and firing behavior in neocortical pyramidal neurons. J. Neurophysiol. 79, 2522–2534.
Povysheva, N. V., Gonzalez-Burgos, G., Zaitsev, A. V., Kroner, S., Barrionuevo, G., Lewis, D. A., and Krimer, L. S. (2006). Properties of excitatory synaptic responses in fast-spiking interneurons and pyramidal cells from monkey and rat prefrontal cortex. Cereb. Cortex 16, 541–552.
Power, J. M., and Sah, P. (2008). Competition between calcium activated K+-channels determines cholinergic action on firing properties of basolateral amygdala projection neurons. J. Neurosci. 28, 3209–3220.
Prakriya, M., Solaro, C. R., and Lingle, C. J. (1996). [Ca2+]i elevations detected by BK channels during Ca2+ influx and muscarine-mediated release of Ca2+ from intracellular stores in rat chromaffin cells. J. Neurosci. 16, 4344–4359.
Raizada, R., and Grossberg, S. (2001). Context-sensitive bindings by the laminar circuits of V1 and V2, A unified model of perceptual grouping, attention, and orientation contrast. Vis. Cogn. 8, 431–466.
Rasch, B. H., Born, J., and Gais, S. (2006). Combined blockade of cholinergic receptors shifts the brain from stimulus encoding to memory consolidation. J. Cogn. Neurosci. 18, 793–802.
Sarter, M., Hasselmo, M. E., Bruno, J. P., and Givens, B. (2005). Unraveling the attentional functions of cortical cholinergic inputs: interactions between signal-driven and cognitive modulation of signal detection. Brain Res. Rev. 48, 98–111.
Satake, T., Mitani, H., Nakagome, K., and Kaneko, K. (2008). Individual and additive effects of neuromodulators on the slow components of afterhyperpolarization currents in layer v pyramidal cells of the rat medial prefrontal cortex. Brain Res. 1229, 47–60.
Schmidt, K. E., Goebel, R., Löwel, S., and Singer, W. (1997). The perceptual grouping criterion of colinearity is reflected by anisotropies of connections in the primary visual cortex. Eur. J. Neurosci. 9, 1083–1089.
Schreiber, M., and Salkoff, L. (1997). A novel calcium-sensing domain in the BK channel. Biophys. J. 73, 1355–1363.
Schwindt, P. C., Spain, W. J., Foehring, R. C., Stafstrom, C. E., Chubb, M. C., and Crill, W. E. (1988a). Multiple potassium conductances and their functions in neurons from cat sensorimotor cortex in vitro. J. Neurophysiol. 59, 424–449.
Schwindt, P. C., Spain, W. J., Foehring, R. C., Stafstrom, C. E., Chubb, M. C., and Crill, W. E. (1988b). Slow conductances in neurons from cat sensorimotor cortex in vitro and their role in excitability changes. J. Neurophysiol. 59, 450–467.
Shapiro, M. S., Roche, J. P., Kaftan, E. J., Cruzblanca, H., Mackie, K., and Hille, B. (2000). Reconstitution of muscarinic modulation of the KCNQ2/KCNQ3 K(+) channels that underlie the neuronal M-current. J. Neurosci. 20, 1710–1721.
Silver, M. A., Shenhav, A., and D'Esposito, M. (2008). Cholinergic enhancement reduces spatial spread of visual responses in human early visual cortex. Neuron 60, 904–914.
Silver, M. R., Grossberg, S., Bullock, D., Histed, M. H., and Miller, E. K. (2011). A neural model of sequential movement planning and control of eye movements: item-order-rank working memory and saccade selection by the supplementary eye fields. Neural Netw. 26, 29–58.
Song, S., Sjöström, P. J., Reigl, M., Nelson, S., and Chklovskii, D. B. (2005). Highly nonrandom features of synaptic connectivity in local cortical circuits. PLoS Biol. 3, 507–519.
Soto, G., Kopell, N., and Sen, K. (2006). Network architecture, receptive fields, and neuromodulation: computational and functional implications of cholinergic modulation in primary auditory cortex. J. Neurophysiol. 96, 2972–2983.
Storm, J. F. (1987). Action potential repolarization and a fast afterhyperpolarization in rat hippocampal pyramidal cells. J. Physiol. 385, 733–759.
Storm, J. F. (1989). An after-hyperpolarization of medium duration in rat hippocampal pyramidal cells. J. Physiol. 409, 171–190.
Traub, R. D., Wong, R. K., Miles, R., and Michelson, H. (1991). A model of a CA3 hippocampal pyramidal neuron incorporating voltage-clamp data on intrinsic conductances. J. Neurophysiol. 66, 635–650.
Vogalis, F., Storm, J. F., and Lancaster, B. (2003). SK channels and the varieties of slow after-hyperpolarizations in neurons. Eur. J. Neurosci. 18, 3155–3166.
Wang, X. J., Liu, Y., Sanchez-Vives, M. V., and McCormick, D. A. (2003). Adaptation and temporal decorrelation by single neurons in the primary visual cortex. J. Neurophysiol. 89, 3279–3293.
Watt, A., van Rossum, M., MacLeod, K., Nelson, S., and Turrigiano, G. (2000). Activity coregulates quantal AMPA and NMDA currents at neocortical synapses. Neuron 26, 659–670.
Wersing, H., Beyn, W., and Ritter, H. (2001). Dynamical stability conditions for recurrent neural networks with unsaturating piecewise linear transfer functions. Neural Comput. 13, 1811–1825.
Williams, J. A., Comisarow, J., Day, J., Fibiger, H. C., and Reiner, P. B. (1994). State-dependent release of acetylcholine in rat thalamus measured by in vivo microdialysis. J. Neurosci. 14, 5236–5242.
Winters, B. D., Bartko, S. J., Saksida, L. M., and Bussey, T. J. (2007). Scopolamine infused into perirhinal cortex improves object recognition memory by blocking the acquisition of interfering object information. Learn. Mem. 14, 590–596.
Xie, X., Hahnloser, R. H. R., and Seung, H. S. (2002). Selectively grouping neurons in recurrent networks of lateral inhibition. Neural Comput. 14, 2627–2646.
Yi, Z., Tan, K. K., and Lee, T. H. (2003). Multistability analysis for recurrent neural networks with unsaturating piecewise linear transfer functions. Neural Comput. 15, 639–662.
Yoshimura, Y., Dantzker, J. L. M., and Callaway, E. M. (2005). Excitatory cortical neurons form fine-scale functional networks. Nature 433, 868–873.
Keywords: short-term memory, pattern processing, spiking neuron, after-hyperpolarization current, acetylcholine modulation, sigmoid signal, vigilance, Adaptive Resonance Theory
Citation: Palma J, Grossberg S and Versace M (2012) Persistence and storage of activity patterns in spiking recurrent cortical networks: modulation of sigmoid signals by after-hyperpolarization currents and acetylcholine. Front. Comput. Neurosci. 6:42. doi: 10.3389/fncom.2012.00042
Received: 25 January 2012; Accepted: 11 June 2012;
Published online: 29 June 2012.
Edited by:
Viktor Jirsa, Movement Science Institute, FranceReviewed by:
Greg Francis, Purdue University, USADaniel S. Levine, University of Texas at Arlington, USA
Copyright: © 2012 Palma, Grossberg and Versace. This is an open-access article distributed under the terms of the Creative Commons Attribution Non Commercial License, which permits non-commercial use, distribution, and reproduction in other forums, provided the original authors and source are credited.
*Correspondence: Stephen Grossberg, Graduate Program in Cognitive and Neural Systems, Center for Adaptive Systems, Center of Excellence for Learning in Education, Center for Computational Neuroscience and Neural Technology, Boston University, 677 Beacon Street, Boston, MA 02215, USA. e-mail: steve@bu.edu