Neurovascular photoacoustic tomography
- Department of Biomedical Engineering, Optical Imaging Laboratory, Washington University in St. Louis, St. Louis, MO, USA
Neurovascular coupling refers to the relationship between neuronal activities and downstream hemodynamic responses. Photoacoustic tomography (PAT), enabling comprehensive label-free imaging of hemodynamic activities with highly scalable penetration and spatial resolution, has great potential in the study of neurovascular coupling. In this review, we first introduce the technical basis of hemodynamic PAT – including label-free quantification of total hemoglobin concentration, blood oxygenation, and blood flow – as well as its applications in hemodynamic monitoring. Then, we demonstrate the potential application of PAT in neurovascular imaging by highlighting representative studies on cerebral vascular responses to whisker stimulation and Alzheimer’s disease. Finally, potential research directions and associated technical challenges are discussed.
Background and Motivation
Advances in brain imaging and sensing have greatly facilitated the understanding of neuronal activity and energetics. One classic technique is to use a microelectrode to directly record the activity of cortical neurons. However, this procedure is invasive, thereby limiting the number of recordings and discouraging chronic studies. Alternatively, the relationship between local neuronal activities and subsequent changes in cerebral hemodynamics, which is referred to as neurovascular coupling, has been widely used as a non-invasive pathway to study brain functions (Malonek and Grinvald, 1996 ; Wang et al., 2003 ). Clinical neuroimaging modalities (Girouard and Iadecola, 2006 ) [such as magnetic resonance imaging (MRI) and positron emission tomography (PET)] and high-resolution optical microscopy technologies (Devor et al., 2007 ; Srinivasan et al., 2009 ) [such as two-photon microscopy (TPM) and optical coherence tomography (OCT)] provide insights into neurovascular coupling at two distinct spatial scales. Photoacoustic tomography (PAT), a fast-growing technology capable of multi-scale imaging (Wang, 2009 ), is able to bridge the resolution and penetration gaps between clinical modalities at the organ level and optical microscopy technologies at the cellular level. Utilizing diffraction-limited optical focusing, optical-resolution photoacoustic microscopy (OR-PAM), a new embodiment of PAT, has achieved cellular (Hu et al., 2010 ) and even subcellular resolution (Maslov et al., 2010 ) in vivo. With more relaxed acoustic focusing, millimeter penetration with a tissue level resolution and centimeter penetration with an organ level resolution have been demonstrated by acoustic-resolution photoacoustic microscopy (AR-PAM) and macroscopy (AR-PAMac), respectively (Zhang et al., 2006 ; Song and Wang, 2007 ). Despite higher economic and computational expenses, ultrasound array based photoacoustic computed tomography (PACT) (Gamelin et al., 2008 ; Zemp et al., 2008 ) can improve the temporal resolution enough to enable real-time monitoring of acute hemodynamics while maintaining a similar penetration-to-resolution ratio. Figure 1 illustrates the high scalability of PAT, from the subcellular to the organ level. “Resolution” in the horizontal axis represents both the lateral and the axial resolutions. The axial resolution of PAT depends on time-resolved ultrasonic detection. It is directly related to the transducer bandwidth, which is usually linearly proportional to the center frequency of the transducer, f0. Thus, better axial resolution is achieved with greater f0, i.e., the axial resolution is inversely proportional to f0. The maximum penetration depth is also inversely proportional to f0 because the acoustic attenuation is approximately linearly proportional to f0. Within the optical penetration limit, the relative axial resolution – defined as the ratio of the penetration depth to the axial resolution – is roughly a constant of 200 (the slope of the red line in Figure 1 ), considered high enough to provide good-quality images (Wang, 2009 ). The lateral resolution of PAT is from optical or ultrasonic focusing, which depends on the center wavelength of the optical illumination or the acoustic detection and can deteriorate in the presence of strong optical or acoustic scattering of biological tissues. Besides the capability of multi-scale imaging with a single modality, PAT enables label-free vascular imaging with a high signal-to-noise ratio (SNR) by capitalizing on the optical absorption of endogenous hemoglobin, the primary carrier of oxygen in the blood. This unique feature allows PAT to avoid possible alterations to the intrinsic hemodynamics caused by exogenous angiographic agents (Hu and Wang, 2010 ) and, more importantly, to delineate vascular networks perfused with red blood cells (RBC), the functional vascular subset supporting neuronal activities and tissue metabolism (Hu et al., 2010 ). This article is mainly focused on the technical advantages of PAT for neurovascular imaging, supported with pilot studies. Potential prospects and associated technical challenges are also presented.
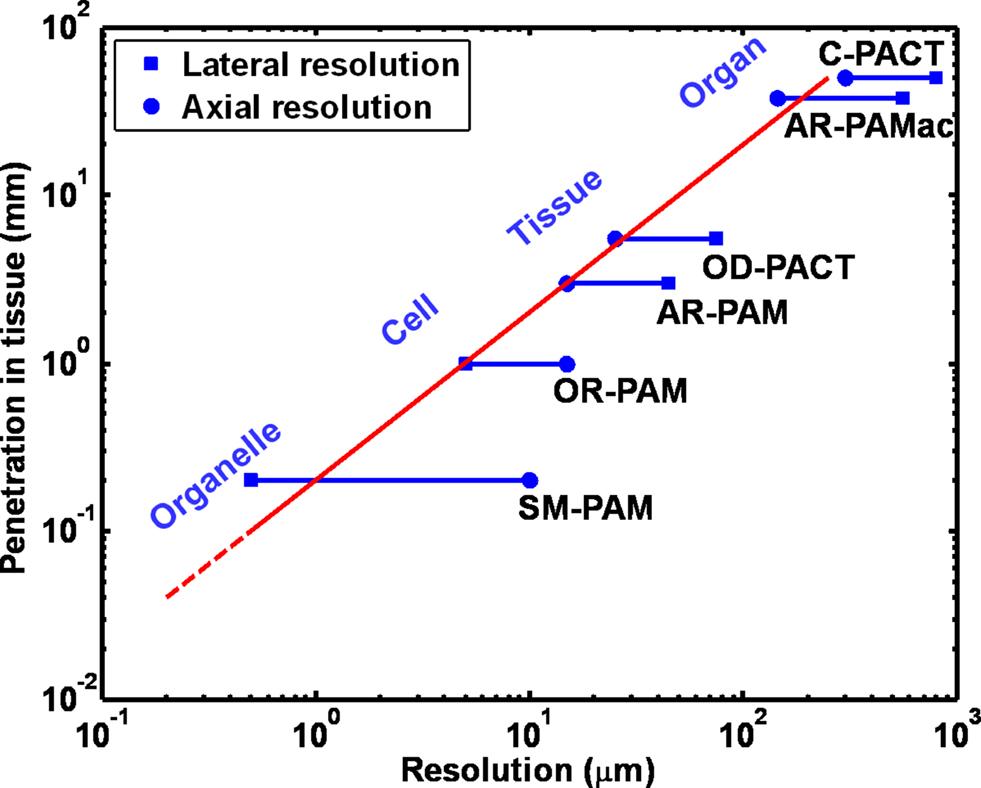
Figure 1. Multi-scale photoacoustic tomography with consistent imaging contrasts. SM-PAM: sub-micron photoacoustic microscopy (Maslov et al., 2010 ); OR-PAM: optical-resolution photoacoustic microscopy (Maslov et al., 2008 ); AR-PAM: acoustic-resolution photoacoustic microscopy (Zhang et al., 2006 ); OD-PACT: optical-detection-based photoacoustic computed tomography (Zhang et al., 2008a ); AR-PAMac: acoustic-resolution photoacoustic macroscopy (Song and Wang, 2007 ); C-PACT: circular photoacoustic computed tomography (Ku and Wang, 2005 ).
Technical Basis of PAT for Neurovascular Imaging
Three Major Embodiments
Similar to most of biomedical imaging modalities, PAT is an excitation-probing process. The typical photoacoustic excitation source is a nanosecond short-pulsed laser, although an intensity-modulated continuous-wave laser can also be used to produce photoacoustic signals (Maslov and Wang, 2008 ). Endogenous or exogenous optical absorbers (i.e., pigments or chromophores) in biological tissues are excited by the deposited photons, inducing thermal expansion. Consequently, these photoacoustic sources emit ultrasonic waves (referred to as photoacoustic waves). The photoacoustic waves are then detected by a high-frequency ultrasonic transducer to form a volumetric mapping of the spatially distributed photoacoustic sources, which are related to the optical absorption or molecular properties of the tissue (Wang, 2008b ).
According to the mechanisms of optical illumination and ultrasonic detection, PAT for neurovascular imaging can be classified into three major embodiments: PACT, AR-PAM and OR-PAM. Figure 2 shows their schematics, along with representative label-free cerebral vascular images acquired by each embodiment. In PACT (Figure 2 A-1), a pulsed laser beam from a wavelength-tunable laser system is expanded and homogenized to provide uniform illumination covering the entire region of interest (ROI). A circular-scanning single-element ultrasonic transducer (Wang et al., 2003 ) or a stationary transducer array (Li et al., 2010 ) is placed around the tissue to receive photoacoustic waves. With a generalized inverse spherical Radon transform, the spatial distribution of the photoacoustic sources can be reconstructed within the limits of acoustic resolution (Xu and Wang, 2006 ). Alternatively, the computational reconstruction can be avoided by point-scanning the dual foci of optical illumination and ultrasonic detection, which is referred to as photoacoustic microscopy (PAM). In PAM, the optical and ultrasonic foci are configured coaxially and confocally, and the lateral resolution is dominated by the more tightly focused part. In AR-PAM, ultrasound detection is tightly focused to achieve a relatively high spatial resolution in the optical diffusive regime (Wang and Wu, 2007 ). Figure 2 A-2 illustrates the most mature version of AR-PAM with dark-field optical illumination (Zhang et al., 2006 ). In the dark-field system, a pulsed laser beam is reshaped by a conical lens to form a ring pattern and then is weakly focused beneath the tissue to overlap the tight ultrasonic focus. The optical focus is 2 mm in diameter, which is much wider than the 50-µm ultrasonic focus; moreover, the optically dark zone above the tissue surface is ideal for placing the ultrasonic transducer in the acoustic/optical confocal configuration. To provide more detailed insight into neurovascular coupling, we can further refine the spatial resolution of PAT down to the capillary level, where the PAM technology is referred to as OR-PAM (Hu et al., 2009a ). In Figure 2 A-3, a diffraction-limited bright-field optical illumination, which is ten times smaller in diameter than the acoustic focus, is adopted to achieve optical resolution. A home-made acoustic-optical beam splitter, consisting of two right-angle prisms and a thin layer of silicone oil in between, aligns the optical illumination and the acoustic detection (Maslov et al., 2008 ). With OR-PAM, cortical microvasculature as small as single capillaries can be clearly resolved in a living adult mouse through the intact skull (Figure 2 B-3). However, the tissue penetration of OR-PAM is restricted to ∼1 mm due to the high optical scattering, and therefore the scalp needs to be removed. Taking advantage of the tissue property that ultrasonic scattering per unit path length is 100–1000 times weaker than optical scattering, AR-PAM is able to penetrate both the scalp and the skull of an adult mouse, at the expense of spatial resolution (Figure 2 B-2) (Stein et al., 2008 ). With a reduced ultrasonic frequency, PACT can even penetrate through the scalp and skull of an adult rat (Figure 2 B-1) (Wang et al., 2003 ).
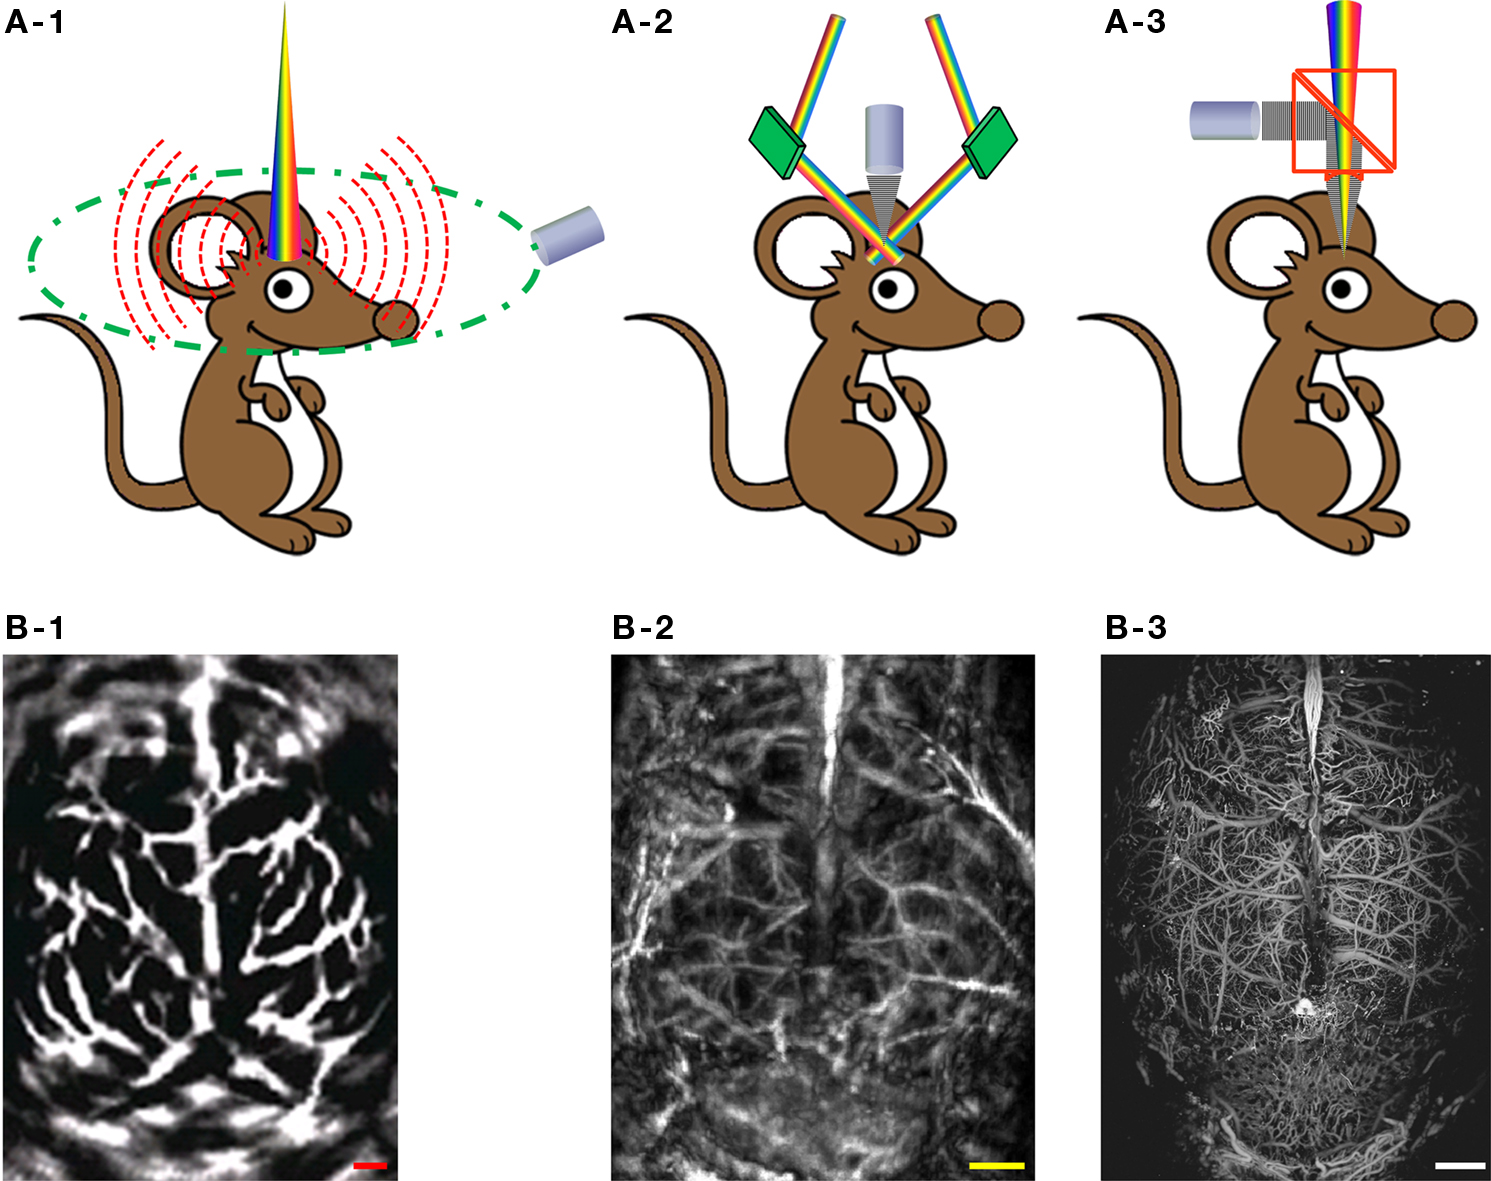
Figure 2. Three major embodiments of PAT for label-free cerebral vascular imaging. (A-1) Schematic of PACT. (A-2) Schematic of dark-field AR-PAM. (A-3) Schematic of OR-PAM. (B-1) PACT image of the cortical vasculature in a living adult rat with both the scalp and the skull intact. Excerpted from (Wang et al., 2003 ). (B-2) Dark-field AR-PAM image of the cortical vasculature in a living adult mouse with both the scalp and the skull intact. Excerpted from (Stein et al., 2008 ). (B-3) OR-PAM image of the cortical vasculature in a living adult mouse with the scalp removed and the skull intact. All scale bars are 1 mm.
Label-Free Photoacoustic Imaging and Monitoring of Hemodynamics
For label-free vascular imaging, PAT senses the two major endogenous chromophores in the blood stream, oxyhemoglobin (HbO2) and deoxyhemoglobin (HbR). Taking advantage of the oxygenation dependence in the optical absorption spectrum of hemoglobin, PAT at multiple (at least two) optical wavelengths can quantify the relative concentrations of HbO2 and HbR within single blood vessels, and subsequently the oxygen saturation (sO2) and the total relative concentration (HbT) of hemoglobin (Hu et al., 2009a ; Hu and Wang, 2010 ). Alternatively, relative HbT can also be directly measured by using a single isosbestic point in the hemoglobin absorption spectra, where the molar extinction coefficients of HbR and HbO2 are equal and thus the photoacoustic signal reflects the HbT but not the sO2. Among the mainstream neuroimaging modalities, only near-infrared spectroscopy (NIRS) and blood-oxygen-level-dependent (BOLD) MRI can assess sO2 with endogenous contrasts. However, NIRS suffers from poor spatial resolution, and BOLD MRI is sensitive only to HbR (Ogawa et al., 1990 ; Bunce et al., 2006 ).
Figures 3 A–C show non-invasive AR-PAM monitoring of blood-oxygenation dynamics in a living mouse cortex under hypoxic challenge (both the scalp and the skull were kept intact). The initial state of the experimental animal was hyperoxia, which served as a baseline. Then, the animal was subjected to three isolated hypoxic challenges by switching the inhalation gas from pure oxygen to hypoxic gas (5% O2, 5% CO2, and 90% N2). According to the mouse cortex image (Figure 3 A), a cross section containing five major vessels (Figure 3 B) was selected for hemodynamic imaging. A pixelwise normalization of the cross-sectional image acquired at a HbR-dominant wavelength (561 nm) to the oxygen-insensitive reference image acquired at an isosbestic wavelength (570 nm) was used to measure the hemodynamic response (Stein et al., 2009 ). The normalized dynamic oxygenation profile for each of the five vessels (Figure 3 C) clearly shows a dramatic increase (13–28%) in the ratiometric photoacoustic signal in response to each hypoxic challenge, which indicates the deoxygenation of hemoglobin.
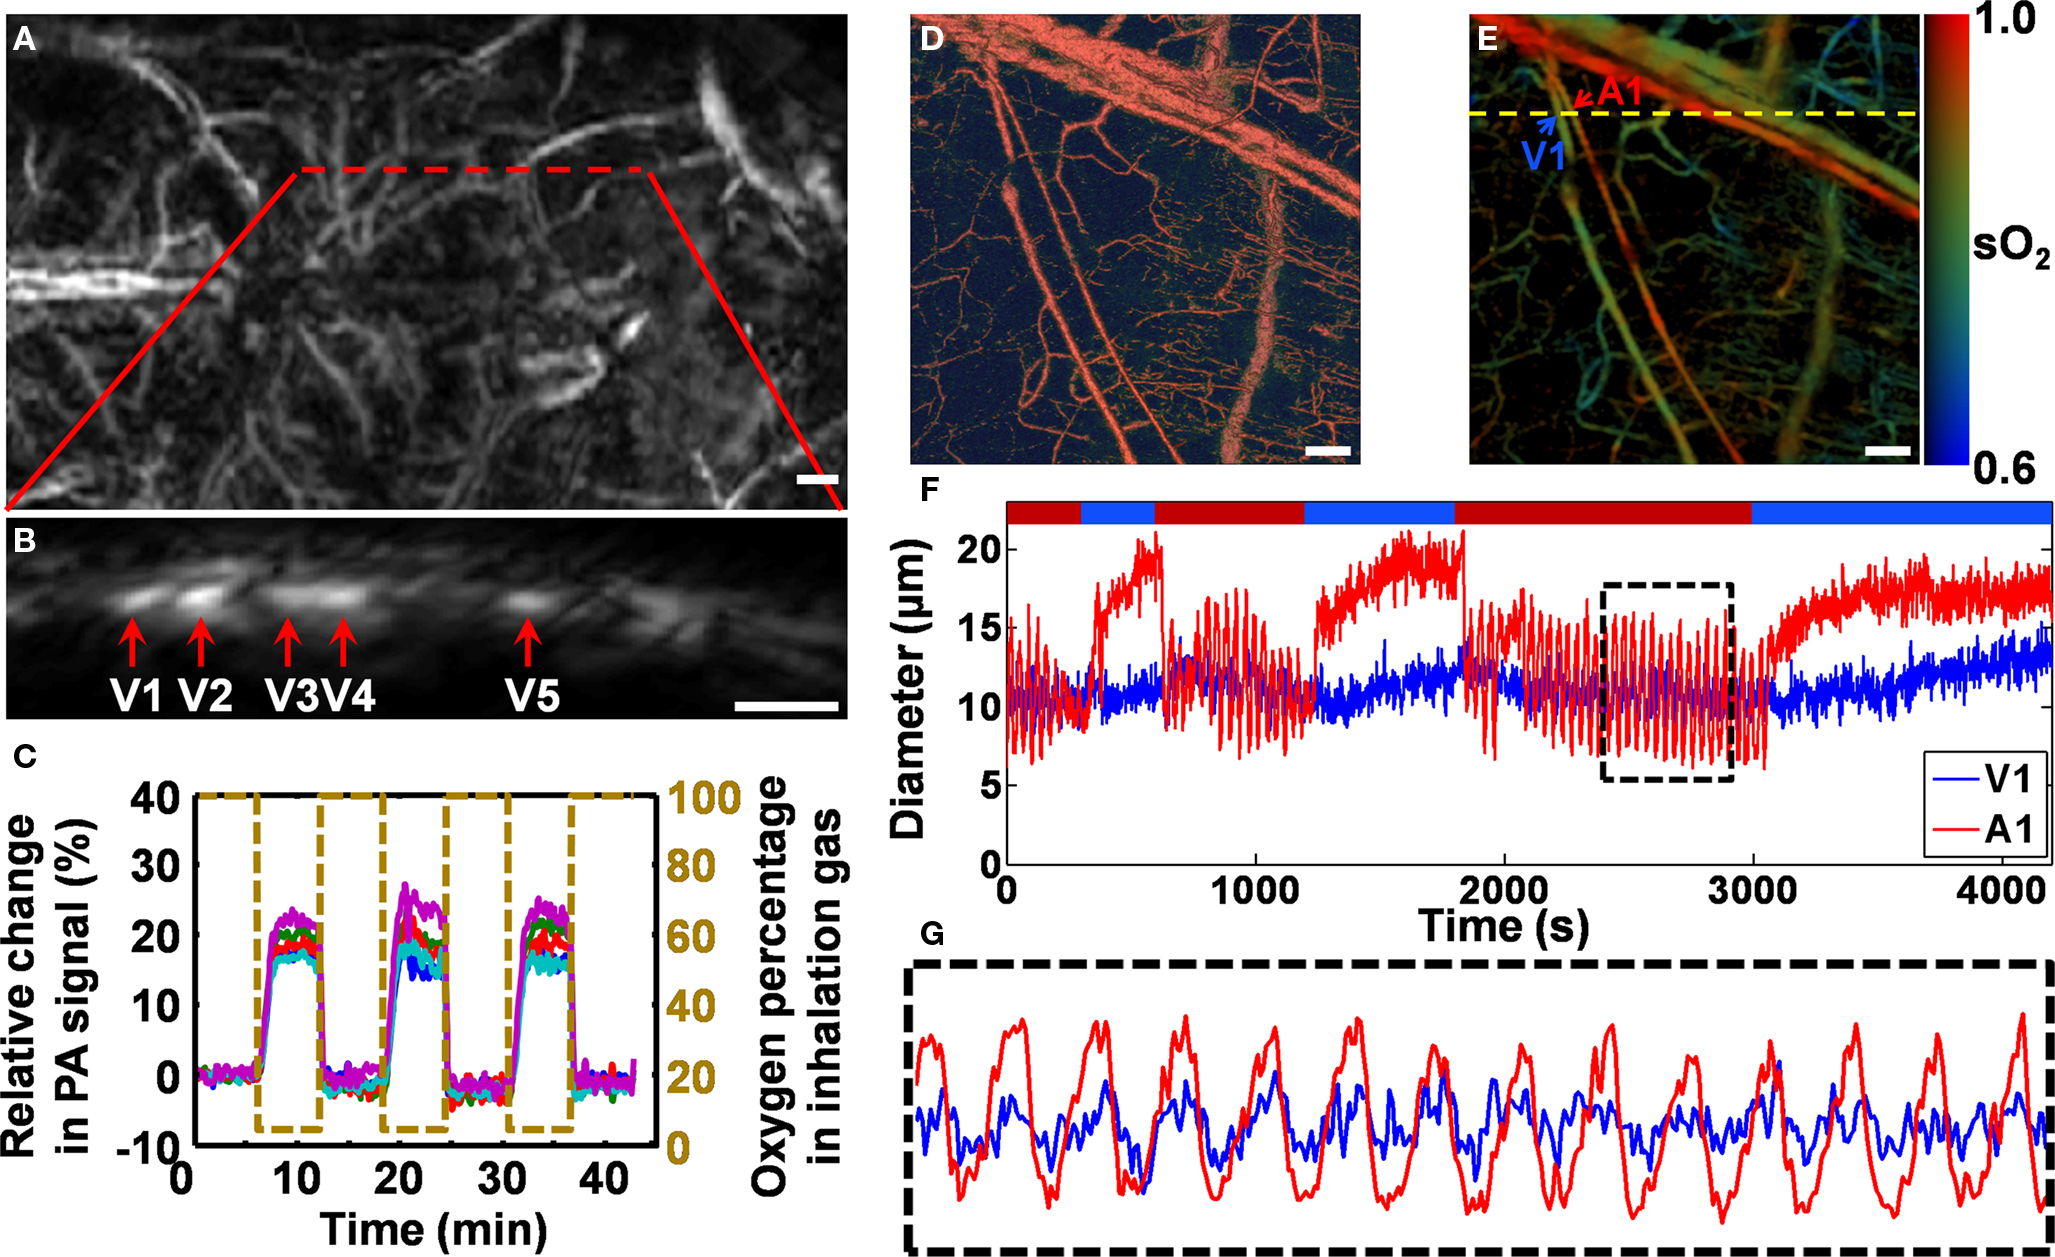
Figure 3. In vivo label-free photoacoustic monitoring of hemodynamics in rodent models. (A–C) AR-PAM monitoring of blood-oxygenation dynamics in a living mouse cortex under hypoxic challenge. Excerpted from (Stein et al., 2009 ). (A) Photoacoustic image of the mouse cortex vasculature through the intact scalp and skull. The red dashed line indicates the area over which the cross-sectional scanning was performed. (B) A representative cross-sectional image along the red dashed line in (A). (C) Ratiometric photoacoustic signals generated by a pixelwise normalization of the HbR data acquired at 561 nm to the oxygen-insensitive reference data acquired at 570 nm. (D–G) OR-PAM monitoring of vasomotion and vasodilation in response to switching the physiological state between hyperoxia and hypoxia. Excerpted from (Hu et al., 2009b ). (D) Structural image of a nude mouse ear in vivo acquired at 570 nm. (E) Vessel-by-vessel sO2 mapping of the same region using dual-wavelength measurements at 570 and 578 nm. The calculated sO2 values are shown in the color bar. A1 indicates a representative arteriole; V1 indicates a representative venule; the yellow dashed line shows the position of the cross-sectional scan. (F) Changes in the arteriolar and venular diameters in response to switching the physiological state. (G) Close-up of the boxed region in (F). Scale bars are 500 µm in (A) and (B), and 50 µm in (D) and (E).
Taking advantage of the single-RBC resolution and sensitivity of OR-PAM, we can also accurately trace hemodynamic changes in microvessel diameter, such as vasomotion and vasodilation in response to tissue oxygen variation (Figures 3 D–G) (Hu et al., 2009b ). Similar to the oxygenation dynamic monitoring experiment, a cross section containing an arteriole–venule pair was selected according to the sO2 mapping acquired using dual-wavelength OR-PAM measurements (A1 and V1 in Figure 3 E) for a 70-min monitoring. During the cross-sectional monitoring, the physiological state of the animal was switched between hyperoxia and hypoxia (indicated by the red and blue time segments, respectively, in Figure 3 F) by alternating the inhalation gas between pure oxygen and hypoxic gas (5% O2, 5% CO2, and 90% N2). Vasomotion under hyperoxia and vasodilation under hypoxia are clearly represented by the diameter oscillation and expansion of the vessel cross section, respectively (Figure 3 F). Compared with arteriole A1, venule V1 had a much weaker vasomotion but a similar oscillation frequency (Figure 3 G).
Besides the above two important hemodynamic parameters that are closely associated with neuronal metabolism, blood flow is also a key parameter in the study of neurovascular physiology and diseases, such as stroke. Recently, blood flow measurement using Doppler photoacoustics has been actively studied (Brunker and Beard, 2010 ; Fang et al., 2007a ,b ; Fang and Wang, 2009 ; Yao and Wang, 2010 ). The photoacoustic Doppler effect was first observed in small light-absorbing particles flowing in clear media (Fang et al., 2007a ) and later extended to tissue-mimicking phantoms (Brunker and Beard, 2010 ; Fang et al., 2007b ; Fang and Wang, 2009 ) and in vivo (Yao and Wang, 2010 ). Doppler photoacoustics, similar to traditional photoacoustics, involves both optics and ultrasound. Whenever there is a relative motion between the photoacoustic source and the ultrasonic transducer, the detected photoacoustic signal undergoes a Doppler frequency shift. Doppler photoacoustics bridges the spatial gap between Doppler optics and Doppler ultrasound. Because RBCs have a much higher optical absorption than the extravascular background (Wang, 2008a ) it also can potentially lower background noise and increase detection sensitivity.
The cerebral metabolic rate of oxygen consumption (CMRO2) is essential for investigating brain functions and visualizing neuronal activities. Combining the currently available photoacoustic measurements of HbT, sO2, vessel diameter, and blood flow, PAT has the potential to become the first single modality that enables independent quantification of CMRO2 at high spatial resolution without the use of an exogenous contrast agent (Wang, 2008a ).
Pilot Studies
Cerebral Vascular Responses to Whisker Stimulation
In rodent models, barrels of the somatosensory cortex are spatially and functionally discrete, each corresponding to a single contralateral whisker, forming an ideal system for the study of neurovascular coupling. In one of the very first neurovascular studies using photoacoustics, Wang et al. (2003) used a single-element transducer based PACT system to observe the hemodynamic counterparts of neuronal activities in response to mechanical stimulation of the whisker pad of a rat.
As shown in Figure 4 , to maximize the hemodynamic response due to whisker stimulation, all whiskers on the right side of the rat snout were deflected simultaneously at a distance of 10 mm from the whisker pad, with a stimulation frequency of 10 Hz and an oscillation amplitude of 8 mm. The whisker stimulation started 0.5 s before the photoacoustic data collection at each scanning position and lasted for 4.5 s. Subtracting the control image without whisker stimulation from the functional image with whisker stimulation produced a functional map of the vascular response evoked by the whisker stimulation. The PACT-imaged vascular patterns (in gray in Figure 4 ) in the activated regions match well with the functional differential signals (in blue and red in Figure 4 ), indicating that the functional signals detected by PACT did represent the hemodynamic changes induced by whisker stimulation. It is worth pointing out that with higher-resolution systems, such as OR-PAM, the activity of individual barrels may be visualized.
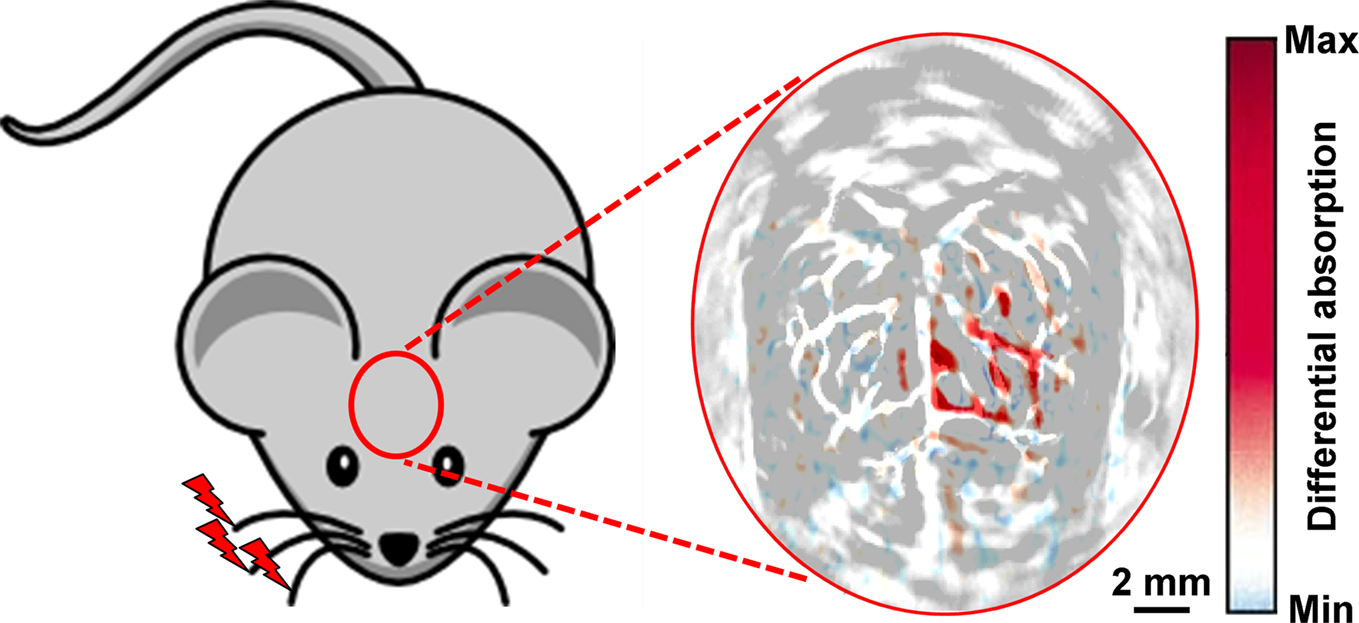
Figure 4. In vivo PACT image of the cerebral vascular response to right-side whisker stimulation in an adult rat model, acquired with both the scalp and the skull intact. The hemodynamic response due to whisker stimulation is shown in blue and red and is superimposed on the cortical vascular image shown in gray. Excerpted from (Wang et al., 2003 ).
Intravital Imaging of Amyloid Plaques
Amyloid plaques are hypothesized to play a major role in the pathogenesis of Alzheimer’s disease (AD), but the underlying mechanisms are still elusive and need extensive animal studies. Although clinical neuroimaging technologies such as PET have improved the diagnosis of AD (Klunk et al., 2004 ), their spatial resolutions are inadequate for imaging subtle microscopic changes due to AD progression or treatment. OR-PAM, capable of detecting not only endogenous but also exogenous optical absorption contrasts with superb sensitivity and cellular level resolution, provides a potential solution.
Recently, we validated OR-PAM imaging of amyloid plaques with established fluorescence microscopy and TPM (Hu et al., 2009c ). For in vitro validation, a Congo red-stained brain section from a 10-month-old APPswe/PS1dE9 (APP/PS1) mouse was first imaged using conventional fluorescence microscopy (Figure 5 A). Then, a 1 × 1 mm2 ROI (enclosed by a red dashed box in Figure 5 A) was imaged by OR-PAM for comparison (inset, Figure 5 A). All the amyloid plaques visualized using fluorescence microscopy were also observed with OR-PAM, suggesting that OR-PAM has the sensitivity and spatial resolution required to image amyloid plaques. For in vivo validation, a 10-month-old APP/PS1 mouse was injected with Congo red through the cisterna magna. Twenty-four hours after injection, an open-skull cranial window was created over the parietal cortex, and dye labeling was confirmed by fluorescence microscopy (Figure 5 B). A ROI (enclosed by a yellow dashed box in Figure 5 B) containing a variety of amyloid plaques and blood vessels was selected for dual-wavelength (523 and 570 nm) imaging with OR-PAM, followed by imaging with TPM. Images acquired using OR-PAM and TPM were directly compared, revealing excellent correlation in plaque distribution (arrows in Figures 5 C,D). It should be noted that the imaged plaque sizes are slightly different in the two imaging modalities, which is likely due to the differences in imaging contrast and sensitivity between the two techniques. However, since each plaque can serve as its own reference, measures of relative plaque growth are expected to be similar.
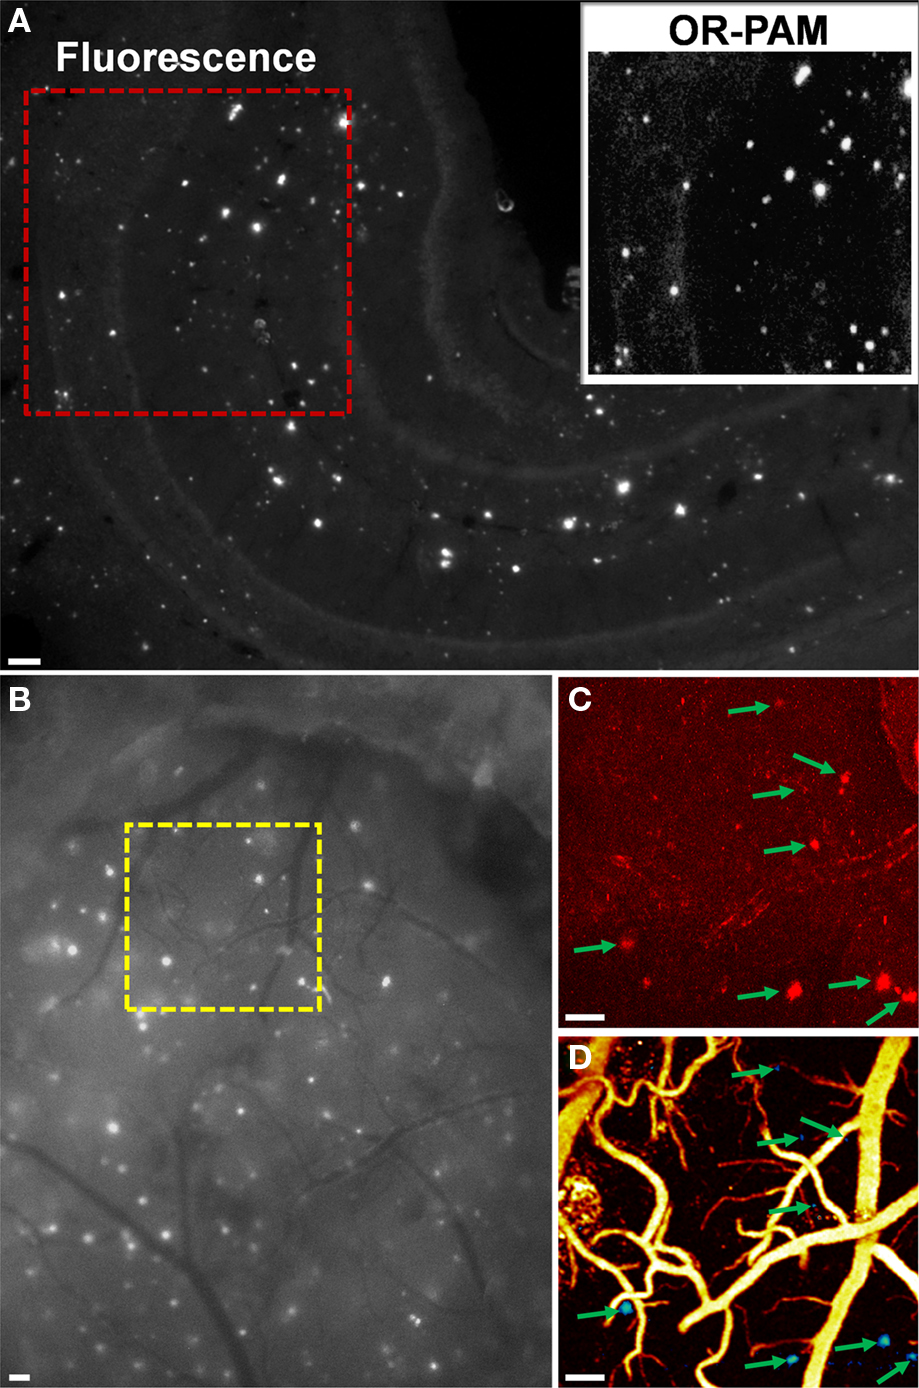
Figure 5. (A) Entire hippocampus of a Congo red-stained brain section from a 10-month-old APP/PS1 mouse imaged using conventional fluorescence microscopy. Inset: OR-PAM image of the red-boxed region for comparison. (B) Exposed cortical region of a Congo red-injected 10-month-old APP/PS1 mouse imaged using conventional fluorescence microscopy through a cranial window. The region of interest marked by the yellow dashed box was imaged by TPM in (C) and dual-wavelength OR-PAM in (D), respectively. In (D), amyloid plaques are colored blue and blood vessels are colored yellow. Arrows indicate plaques. All scale bars are 100 µm. Excerpted from (Hu et al., 2009c ).
Some other photoacoustic studies on neurovascular disease and physiology, such as epilepsy and hindpaw stimulation in rodent models, are not covered here (Stein et al., 2008 ; Zhang et al., 2008b ).
Prospects and Challenges
Providing high-sensitivity label-free vascular imaging and characterization at multiple spatial scales, PAT holds the potential to play an important role in neurovascular studies. Several future prospects and associated challenges are envisaged.
(i) Real-time PAT. Potential methods include galvanometer based optical-scanning OR-PAM (Xie et al., 2009 ), voice coil based mechanical-scanning AR-PAM (Harrison et al., 2009 ), and ultrasound array based non-scanning PACT (Gamelin et al., 2008 ; Li et al., 2010 ). Although the temporal resolution of PAT has been advanced to as fast as ∼1 frame/s (Li et al., 2010 ), it is still not fast enough to catch some fast neurovascular responses. Two major bottlenecks are the rates of data acquisition and laser repetition (Hu and Wang, 2010 ).
(ii) CMRO2 quantification. For a localized vascular system, we can estimate the relative CMRO2 using

where  ,
,  ,
,  , and
, and  are the sO2, relative HbT, cross-sectional area, and flow velocity of the feeder/draining vessels of the local system, respectively (Wang, 2008a
). As discussed in Section “Technical basis of PAT for neurovascular imaging”, all the above parameters are measurable via PAT. A major technical challenge in CMRO2 quantification is the fluence compensation in the sO2 calculation (Hu and Wang, 2010
). In PAT, the detected signal amplitude is proportional to the product of local optical absorption coefficient and optical fluence. The wavelength dependences of optical fluence must be compensated for before we can apply the known optical absorption spectra of HbR and HbO2 to calculate sO2. Poor fluence compensation can lead to inaccuracy (Stein et al., 2009
).
are the sO2, relative HbT, cross-sectional area, and flow velocity of the feeder/draining vessels of the local system, respectively (Wang, 2008a
). As discussed in Section “Technical basis of PAT for neurovascular imaging”, all the above parameters are measurable via PAT. A major technical challenge in CMRO2 quantification is the fluence compensation in the sO2 calculation (Hu and Wang, 2010
). In PAT, the detected signal amplitude is proportional to the product of local optical absorption coefficient and optical fluence. The wavelength dependences of optical fluence must be compensated for before we can apply the known optical absorption spectra of HbR and HbO2 to calculate sO2. Poor fluence compensation can lead to inaccuracy (Stein et al., 2009
).
(iii) Multimodal imaging. Established neuroimaging technologies, such as TPM and MRI, provide fruitful anatomical, functional, or molecular information that is highly complementary to photoacoustic contrasts. Taking advantage of the high scalability of PAT, it would be convenient and powerful to fuse PAT and the existing neuroimaging technologies into a multi-contrast system.
(iv) Effective absorption contrast agents. Although low-quantum-yield fluorochromes can be used as photoacoustic contrast agents for molecular imaging (Razansky et al., 2007 ), SNR is usually presented as a limiting factor due to the unoptimized optical absorption property. For instance, although OR-PAM has demonstrated in vivo transcranial imaging of single capillaries (Hu et al., 2009a ), which are similar to or even smaller than the size of amyloid plaques in rodent models, transcranial imaging of amyloid plaques still requires further improvements in the optical absorption of amyloid-specific dyes (Hu et al., 2009c ). To extend the scope of PAT from neurovascular coupling to more general neuronal activities, we must develop more effective absorption contrast agents.
In conclusion, PAT bridges the spatial gap between biological microscopy and clinical imaging. Both the spatial resolution and the tissue penetration of PAT are highly scalable. The combination of scalability and endogenous hemoglobin contrast enables label-free, multi-scale, multi-parameter vascular imaging, making PAT a promising tool for neurovascular study.
Conflict of Interest Statement
L. V. Wang has a financial interest in Microphotoacoustics, Inc. and Endra, Inc., which, however, did not support this work.
Acknowledgments
The authors appreciate Prof. James Ballard’s close reading of the manuscript. This work was sponsored by National Institutes of Health Grants R01 EB000712, EB000712A2S1, R01 EB00071207S2, R01 EB008085, R01 CA113453901, U54 CA136398, and 5P60 DK02057933. L.V.W. has a financial interest in Microphotoacoustics, Inc. and Endra, Inc., which, however, did not support this work.
References
Brunker, J., and Beard, P. (2010). Pulsed Photoacoustic Doppler Flowmetry Using a Cross Correlation Method. Proceedings of SPIE 7564, San Francisco.
Bunce, S. C., Izzetoglu, M., Izzetoglu, K., Onaral, B., and Pourrezaei, K. (2006). Functional near-infrared spectroscopy. IEEE Eng. Med. Biol. Mag. 25, 54–62.
Devor, A., Tian, P., Nishimura, N., Teng, I. C., Hillman, E. M., Narayanan, S. N., Ulbert, I., Boas, D. A., Kleinfeld, D., and Dale, A. M. (2007). Suppressed neuronal activity and concurrent arteriolar vasoconstriction may explain negative blood oxygenation level-dependent signal. J. Neurosci. 27, 4452–4459.
Fang, H., Maslov, K., and Wang, L. V. (2007a). Photoacoustic Doppler effect from flowing small light-absorbing particles. Phys. Rev. Lett. 99, 184501.
Fang, H., Maslov, K., and Wang, L. V. (2007b). Photoacoustic Doppler flow measurement in optically scattering media. Appl. Phys. Lett. 91, 3.
Fang, H., and Wang, L. V. (2009). M-mode photoacoustic particle flow imaging. Opt. Lett. 34, 671–673.
Gamelin, J., Aguirre, A., Maurudis, A., Huang, F., Castillo, D., Wang, L.V., and Zhu, Q. (2008). Curved array photoacoustic tomographic system for small animal imaging. J. Biomed. Opt. 13, 024007.
Girouard, H., and Iadecola, C. (2006). Neurovascular coupling in the normal brain and in hypertension, stroke, and Alzheimer disease. J. Appl. Physiol. 100, 328–335.
Harrison, T., Ranasinghesagara, J. C., Lu, H., Mathewson, K., Walsh, A., and Zemp, R. J. (2009). Combined photoacoustic and ultrasound biomicroscopy. Opt. Express 17, 22041–22046.
Hu, S., Maslov, K., Tsytsarev, V., and Wang, L. V. (2009a). Functional transcranial brain imaging by optical-resolution photoacoustic microscopy. J. Biomed. Opt. 14, 040503.
Hu, S., Maslov, K., and Wang, L. V. (2009b). Noninvasive label-free imaging of microhemodynamics by optical-resolution photoacoustic microscopy. Opt. Express 17, 7688–7693.
Hu, S., Rao, B., Maslov, K., and Wang, L. V. (2010). Label-free photoacoustic ophthalmic angiography. Opt. Lett. 35, 1–3.
Hu, S., Yan, P., Maslov, K., Lee, J.-M., and Wang, L. V. (2009c). Intravital imaging of amyloid plaques in a transgenic mouse model using optical-resolution photoacoustic microscopy. Opt. Lett. 34, 3899–3901.
Hu, S., and Wang, L.V. (2010). Photoacoustic imaging and characterization of the microvasculature. J. Biomed. Opt. 15, 011101.
Klunk, W. E., Engler, H., Nordberg, A., Wang, Y., Blomqvist, G., Holt, D. P., Bergstrom, M., Savitcheva, I., Huang, G. F., Estrada, S., Ausen, B., Debnath, M. L., Barletta, J., Price, J. C., Sandell, J., Lopresti, B. J., Wall, A., Koivisto, P., Antoni, G., Mathis, C. A., and Langstrom, B. (2004). Imaging brain amyloid in Alzheimer’s disease with Pittsburgh Compound-B. Ann. Neurol. 55, 306–319.
Ku, G., and Wang, L. V. (2005). Deeply penetrating photoacoustic tomography in biological tissues enhanced with an optical contrast agent. Opt. Lett. 30, 507–509.
Li, C., Aguirre, A., Gamelin, J., Maurudis, A., Zhu, Q., and Wang, L. V. (2010). Real-time photoacoustic tomography of cortical hemodynamics in small animals. J. Biomed. Opt. 15, 010509.
Malonek, D., and Grinvald, A. (1996). Interactions between electrical activity and cortical microcirculation revealed by imaging spectroscopy: implications for functional brain mapping. Science 272, 551–554.
Maslov, K., Ku, G., and Wang, L. V. (2010). Photoacoustic Microscopy with Submicron Resolution. Proceedings of SPIE 7564, San Francisco.
Maslov, K., and Wang, L. V. (2008). Photoacoustic imaging of biological tissue with intensity-modulated continuous-wave laser. J. Biomed. Opt. 13, 024006.
Maslov, K., Zhang, H. F., Hu, S., and Wang, L. V. (2008). Optical-resolution photoacoustic microscopy for in vivo imaging of single capillaries. Opt. Lett. 33, 929–931.
Ogawa, S., Lee, T. M., Nayak, A. S., and Glynn, P. (1990). Oxygenation-sensitive contrast in magnetic resonance image of rodent brain at high magnetic fields. Magn. Reson. Med. 14, 68–78.
Razansky, D., Vinegoni, C., and Ntziachristos, V. (2007). Multispectral photoacoustic imaging of fluorochromes in small animals. Opt. Lett. 32, 2891–2893.
Song, K. H., and Wang, L. V. (2007). Deep reflection-mode photoacoustic imaging of biological tissue. J. Biomed. Opt. 12, 060503.
Srinivasan, V. J., Sakadzic, S., Gorczynska, I., Ruvinskaya, S., Wu, W., Fujimoto, J. G., and Boas, D. A. (2009). Depth-resolved microscopy of cortical hemodynamics with optical coherence tomography. Opt. Lett. 34, 3086–3088.
Stein, E. W., Maslov, K., and Wang, L. V. (2008). Noninvasive mapping of the electrically stimulated mouse brain using photoacoustic microscopy. Proc. SPIE 6856.
Stein, E. W., Maslov, K., and Wang, L. V. (2009). Noninvasive, in vivo imaging of blood-oxygenation dynamics within the mouse brain using photoacoustic microscopy. J. Biomed. Opt. 14, 020502.
Wang, L. V. (2008b). Tutorial on photoacoustic microscopy and computed tomography. IEEE J. Sel. Top. Quantum Electron. 14, 171–179.
Wang, L. V. (2009). Multiscale photoacoustic microscopy and computed tomography. Nat. Photon 3, 503–509.
Wang, X., Pang, Y., Ku, G., Xie, X., Stoica, G., and Wang, L. V. (2003). Noninvasive laser-induced photoacoustic tomography for structural and functional in vivo imaging of the brain. Nat. Biotechnol. 21, 803–806.
Xie, Z., Jiao, S., Zhang, H. F., and Puliafito, C. A. (2009). Laser-scanning optical-resolution photoacoustic microscopy. Opt. Lett. 34, 1771–1773.
Xu, M., and Wang, L. V. (2006). Photoacoustic imaging in biomedicine. Rev. Sci. Instrum. 77, 041101.
Yao, J., and Wang, L. V. (2010). Transverse Flow Velocity Measurement with Photoacoustic Doppler Bandwidth Broadening. Proceedings of SPIE 7564, San Francisco.
Zemp, R. J., Song, L., Bitton, R., Shung, K. K., and Wang, L. V. (2008). Realtime photoacoustic microscopy in vivo with a 30-MHz ultrasound array transducer. Opt. Express. 16, 7915–7928.
Zhang, E., Laufer, J., and Beard, P. (2008a). Backward-mode multiwavelength photoacoustic scanner using a planar Fabry-Perot polymer film ultrasound sensor for high-resolution three-dimensional imaging of biological tissues. Appl. Opt. 47, 561–577.
Zhang, Q., Liu, Z., Carney, P. R., Yuan, Z., Chen, H., Roper, S. N., and Jiang, H. (2008b). Non-invasive imaging of epileptic seizures in vivo using photoacoustic tomography. Phys. Med. Biol. 53, 1921–1931.
Keywords: photoacoustic tomography, neurovascular coupling, hemodynamics, whisker stimulation, Alzheimer’s disease
Citation: Hu S and Wang LV (2010) Neurovascular photoacoustic tomography. Front. Neuroenerg. 2:10. doi: 10.3389/fnene.2010.00010
Received: 02 March 2010;
Paper pending published: 30 March 2010;
Accepted: 26 May 2010;
Published online: 17 June 2010
Edited by:
David Boas, Massachusetts General Hospital, USA; Massachusetts Institute of Technology, USA; Harvard Medical School, USAReviewed by:
Sava Sakadzic, Harvard University, USAMyles Jones, University of Sheffield, UK
Copyright: © 2010 Hu and Wang. This is an open-access article subject to an exclusive license agreement between the authors and the Frontiers Research Foundation, which permits unrestricted use, distribution, and reproduction in any medium, provided the original authors and source are credited.
*Correspondence: Lihong V. Wang, Department of Biomedical Engineering, Optical Imaging Laboratory, Washington University in St. Louis, One Brookings Drive, St. Louis, MO 63130-4899, USA. e-mail: lhwang@biomed.wustl.edu