Cerebral oxygen delivery and consumption during evoked neural activity
- 1 Department of Radiology, University of Pittsburgh, Pittsburgh, PA, USA
- 2 Center for Science and Engineering, University of Electro-communications, Tokyo, Japan
- 3 Department of Neurobiology, University of Pittsburgh, Pittsburgh, PA, USA
Increases in neural activity evoke increases in the delivery and consumption of oxygen. Beyond observations of cerebral tissue and blood oxygen, the role and properties of cerebral oxygen delivery and consumption during changes in brain function are not well understood. This work overviews the current knowledge of functional oxygen delivery and consumption and introduces recent and preliminary findings to explore the mechanisms by which oxygen is delivered to tissue as well as the temporal dynamics of oxygen metabolism. Vascular oxygen tension measurements have shown that a relatively large amount of oxygen exits pial arterioles prior to capillaries. Additionally, increases in cerebral blood flow (CBF) induced by evoked neural activation are accompanied by arterial vasodilation and also by increases in arteriolar oxygenation. This increase contributes not only to the down-stream delivery of oxygen to tissue, but also to delivery of additional oxygen to extra-vascular spaces surrounding the arterioles. On the other hand, the changes in tissue oxygen tension due to functional increases in oxygen consumption have been investigated using a method to suppress the evoked CBF response. The functional decreases in tissue oxygen tension induced by increases in oxygen consumption are slow to evoked changes in CBF under control conditions. Preliminary findings obtained using flavoprotein autofluorescence imaging suggest cellular oxidative metabolism changes at a faster rate than the average changes in tissue oxygen. These issues are important in the determination of the dynamic changes in tissue oxygen metabolism from hemoglobin-based imaging techniques such as blood oxygenation-level dependent functional magnetic resonance imaging (fMRI).
Introduction
The wide-spread use of imaging methods that are sensitive to the cerebral oxygenation level of blood, such as blood oxygenation-level dependent functional magnetic resonance imaging (BOLD fMRI), has sparked significant interest in the properties and role of oxygen delivery and consumption in the brain, particularly during changes in brain function. In general, oxygen is transported to the brain by blood and it is delivered to tissue at the capillary level by diffusion. In tissue, oxygen diffuses until it is used up in cellular mitochondria. With increases in neural activity, the cerebral metabolic rate of oxygen consumption  increases (Herscovitch et al., 1985
; Fox et al., 1988
; Fiat et al., 1993
; Davis et al., 1998
; Kim et al., 1999
; Mayhew et al., 2000
; Hyder et al., 2001
; Shulman et al., 2001
; Boas et al., 2003
). In addition, the delivery (or supply) of oxygen to tissue also increases through increases in cerebral blood flow (CBF) (Buxton and Frank, 1997
; Davis et al., 1998
; Hyder et al., 1998
; Kim et al., 1999
; Lauritzen, 2001
; Zheng et al., 2002
). The increase in CBF is produced at least in part by the dilation of feeding arteries, and hence, increases in cerebral blood volume (CBV) have also been observed (Berwick et al., 2005
; Vanzetta et al., 2005
; Hillman et al., 2007
; Kim et al., 2007
). This general picture appears to be coherent because it is expected that increases in neural activity (e.g., synaptic transmission and firing rate) require additional energy, which is supplied by increases in oxidative metabolism. As a result, blood flow increases to satisfy the consumption (or demand) of tissue oxygen. However, the role and properties of oxygen delivery and consumption have remained unclear. For instance, steady-state increases in oxygen delivery have been consistently observed to exceed the state-state increases in oxygen consumption by a ratio between 2 and 3 (Uludag et al., 2004
). It is this disproportionate ratio that is exploited to image brain function in humans and animals using methods like BOLD fMRI. Fueling our lack of understanding is the fact that neural activity is a highly dynamic process and dynamic measurements of oxygen consumption (and delivery) have been largely unavailable. As a result, the use of blood oxygenation methods to interpret and quantify brain function remains uncertain. Because these processes are not simple and many important variables are not routinely measured, models have been employed to explore, interpret and quantify the dynamics of this process (Zheng et al., 2002
; Valabregue et al., 2003
; Huppert et al., 2007
; Boas et al., 2008
). However, the dynamic properties of tissue oxygen consumption with changes in brain function have been difficult to measure, leaving this portion of the model to educated assumptions.
increases (Herscovitch et al., 1985
; Fox et al., 1988
; Fiat et al., 1993
; Davis et al., 1998
; Kim et al., 1999
; Mayhew et al., 2000
; Hyder et al., 2001
; Shulman et al., 2001
; Boas et al., 2003
). In addition, the delivery (or supply) of oxygen to tissue also increases through increases in cerebral blood flow (CBF) (Buxton and Frank, 1997
; Davis et al., 1998
; Hyder et al., 1998
; Kim et al., 1999
; Lauritzen, 2001
; Zheng et al., 2002
). The increase in CBF is produced at least in part by the dilation of feeding arteries, and hence, increases in cerebral blood volume (CBV) have also been observed (Berwick et al., 2005
; Vanzetta et al., 2005
; Hillman et al., 2007
; Kim et al., 2007
). This general picture appears to be coherent because it is expected that increases in neural activity (e.g., synaptic transmission and firing rate) require additional energy, which is supplied by increases in oxidative metabolism. As a result, blood flow increases to satisfy the consumption (or demand) of tissue oxygen. However, the role and properties of oxygen delivery and consumption have remained unclear. For instance, steady-state increases in oxygen delivery have been consistently observed to exceed the state-state increases in oxygen consumption by a ratio between 2 and 3 (Uludag et al., 2004
). It is this disproportionate ratio that is exploited to image brain function in humans and animals using methods like BOLD fMRI. Fueling our lack of understanding is the fact that neural activity is a highly dynamic process and dynamic measurements of oxygen consumption (and delivery) have been largely unavailable. As a result, the use of blood oxygenation methods to interpret and quantify brain function remains uncertain. Because these processes are not simple and many important variables are not routinely measured, models have been employed to explore, interpret and quantify the dynamics of this process (Zheng et al., 2002
; Valabregue et al., 2003
; Huppert et al., 2007
; Boas et al., 2008
). However, the dynamic properties of tissue oxygen consumption with changes in brain function have been difficult to measure, leaving this portion of the model to educated assumptions.
A thorough understanding of cerebral oxygen delivery and consumption is important not only to understand this fundamental metabolic process but also for the quantification of the changes in blood oxygen saturation which are then used to calculate the changes in tissue oxygen metabolism. This physiological parameter can be very useful in research and clinical studies to assess the functional state of tissue. In this work, we will overview the current knowledge of functional oxygen delivery and consumption and introduce recent findings to explore the role of the large delivery of oxygen to tissue and the temporal dynamics of oxygen consumption. Specifically, previously reported data from our group (Vazquez et al., 2010
) will be used in combination with a model of the transport of oxygen to aid in the investigation of these questions. These data will also be used to explore the impact of vascular wall  measurements on the longitudinal gradient of oxygen along the cerebro-vascular tree. Preliminary findings of the functional changes in tissue
  as a function of depth over superficial layers will also be explored. Lastly, preliminary findings of the dynamic changes in cellular oxidative metabolism with evoked function obtained using flavoprotein autofluorescence imaging (FAI) are also presented.
Background
The mammalian brain is very sensitive to the amount of oxygen. This is exemplified by the disruption of brain function within minutes after discontinuing oxygen supply (e.g., respiratory arrest). Oxygen in air is present at a concentration of 20.9% under standard temperature and pressure (i.e., 25°C and 1 atm). It is transported from air to the lungs by respiration and it dissolves in blood where it mostly binds hemoglobin in red blood cells. The ability of a medium such as blood (plasma) to dissolve oxygen is described by Henry’s Law and the solubility coefficient (α), which has been determined to be 1.39 × 10⁻³ mM/mmHg (Popel, 1989 ). In the lungs, the inspired oxygen tension is about 150 mmHg under standard body temperature and pressure (i.e., 37°C and fully saturated water vapor gas), setting an upper bound for the oxygen tension of blood. A single hemoglobin molecule is able to bind four oxygen molecules such that the total concentration of oxygen in blood depends mostly on the concentration of hemoglobin, although free oxygen dissolved in blood plasma, reported as the partial pressure or tension of oxygen in blood, also contributes a small amount. The affinity of oxygen to hemoglobin depends on the blood oxygen tension and it is described by the oxygen dissociation curve (ODC) (Popel, 1989 ; Jensen, 2004 ). It is worth noting that the ODC is influenced by temperature, pH and carbon dioxide tension (the latter two compose the Bohr effect). A common expression for the ODC is the Hill equation (Eq. 1) which is parametrized by the P50 (the oxygen tension at which blood hemoglobin is 50% saturated by oxygen) and the Hill coefficient (h). The kinetics of the association and dissociation of oxygen from hemoglobin have been determined to take tens of milliseconds under normal conditions (Gibson et al., 1955 ; Popel, 1989 ). Hence, if an instantaneous equilibrium is assumed, the total concentration of blood concentration can be described by Eq. 1 as the sum of the oxygen dissolved in plasma (Cp) and the oxygen bound to hemoglobin, where [Hb] is the concentration of hemoglobin in blood. Using the values in Table 1 , an arterial oxygen tension of 100 mmHg would correspond to a dissolved oxygen concentration (Cp) of 0.14 mM and a total oxygen concentration (Cc) of 6.56 mM.
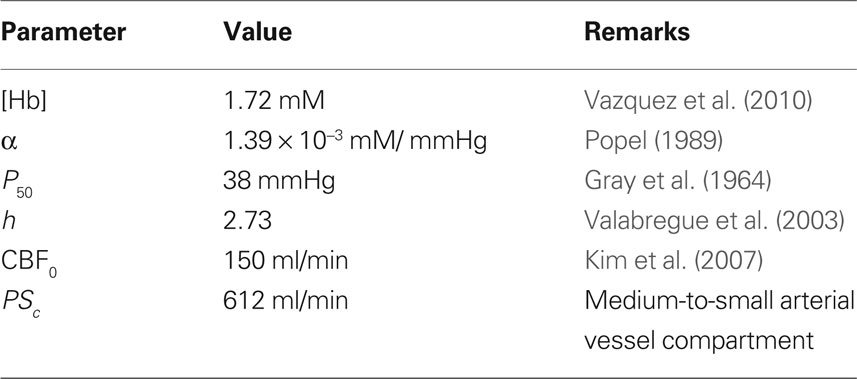
Table 1. Parameter values used for the model described in Eqs 1–3.
A relatively simple model can be used to describe the transport of oxygen by conservation of mass assuming that a single vascular compartment with a linear axial and radial oxygen gradient is a reasonable approximation (Eq. 2 and Figure 1
) (Valabregue et al., 2003
). In this fashion, the average amount of oxygen (represented by the product of the compartment’s volume Vc and the average oxygen concentration Cc) is described by the average amount of oxygen entering the compartment upstream (CBF Ca), the amount of oxygen leaving the compartment down-stream (CBF Cv) and the amount of oxygen delivered to tissue (represented by the right-most term in Eq. 2). In the latter term, the transport of oxygen out of the vascular space (orthogonal to the direction of flow) is related to the product of the oxygen permeability and surface area of exchange (PSc) (see Table 1
). Similarly, the average amount of oxygen in a tissue compartment (represented by the product of the tissue compartment volume Vt and the average tissue oxygen concentration Ct) can be simply described by the difference between the amount entering the tissue compartment and the amount of oxygen consumed  (Eq. 3). A more in-depth description of this model (Eqs 1–3) and its assumptions can be found in (Popel, 1989
; Valabregue et al., 2003
).
(Eq. 3). A more in-depth description of this model (Eqs 1–3) and its assumptions can be found in (Popel, 1989
; Valabregue et al., 2003
).
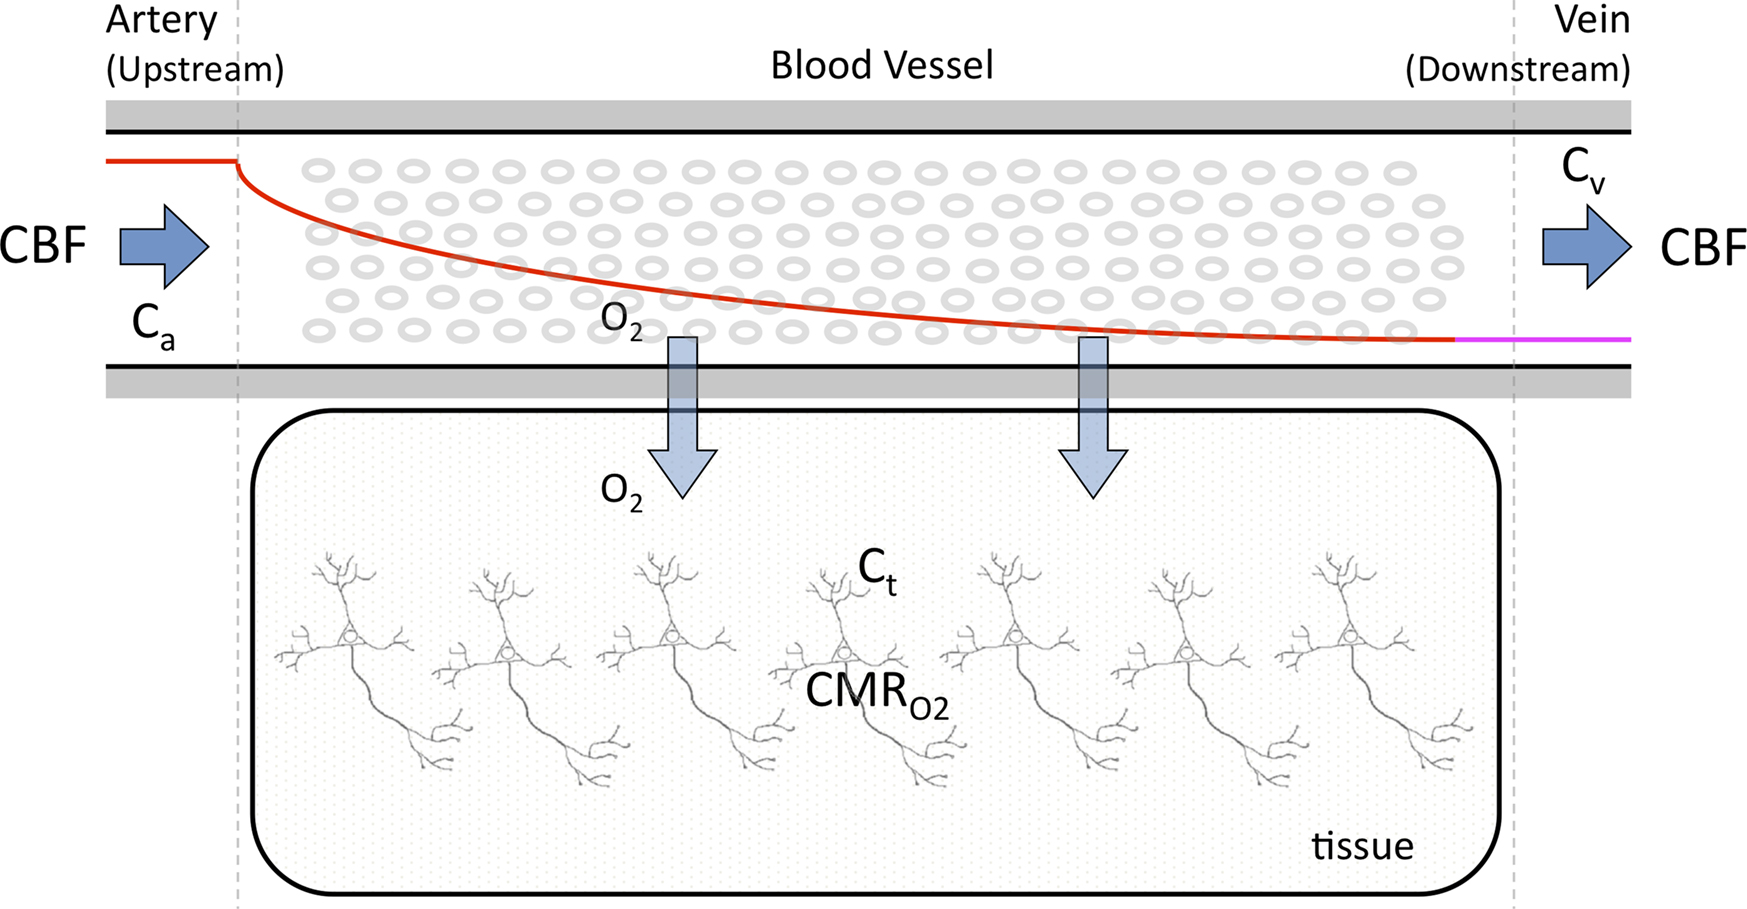
Figure 1. Simplified diagram of the transport of oxygen from blood to tissue. The model in Eqs 2 and 3 consists of a vessel compartment and a tissue compartment, respectively, where the amount of oxygen per unit time is conserved in each compartment. The model implemented in this work assumed a linear intra-vascular oxygen gradient to be a reasonable approximation.
Cerebral oxygen tension is classically measured using polarographic oxygen microelectrodes (Fatt, 1976
; Siesjö, 1978
). A significant advantage of this method is that it can quantify the absolute tension of free dissolved oxygen with good spatial resolution (typical volumes of about 10 µm in radius or greater). A significant disadvantage of this method is its single point measurement and invasiveness since the electrode must be physically placed at the desired sampling location. In addition, the measurement of intra-vascular  is generally limited to the surface of blood vessels which may not necessarily indicate the intra-vascular
  especially for larger arteries where the vascular wall is thick (a promising new method might overcome some of these shortcomings (Yaseen, et al., 2009
)). Although other methods can be used to measure oxygen tension (e.g., phosphorescence quenching), most reports overviewed below used oxygen microelectrodes to measure oxygen tension in blood vessels and tissue.
especially for larger arteries where the vascular wall is thick (a promising new method might overcome some of these shortcomings (Yaseen, et al., 2009
)). Although other methods can be used to measure oxygen tension (e.g., phosphorescence quenching), most reports overviewed below used oxygen microelectrodes to measure oxygen tension in blood vessels and tissue.
Oxygen Delivery
Oxygen is transported to the brain by the arterial vasculature and most of the blood oxygen is exchanged into tissue in cerebral capillaries by diffusion. Therefore, a longitudinal or axial oxygen concentration gradient exists between cerebral arteries and veins. In addition, the venous (or down-stream) concentration of oxygen directly depends on the flow rate. A few reports of the arterial and venous cerebral oxygen tension in the literature show that the largest drop in vascular  occurs in tissue across capillaries (17 mmHg) (Vovenko, 1999
) and between pre-penetrating pial arterioles and post-emerging pial venules (44 mmHg; Figure 2
, Small Artery to Small Vein locations, or SmArt to SmVen, respectively).
occurs in tissue across capillaries (17 mmHg) (Vovenko, 1999
) and between pre-penetrating pial arterioles and post-emerging pial venules (44 mmHg; Figure 2
, Small Artery to Small Vein locations, or SmArt to SmVen, respectively).
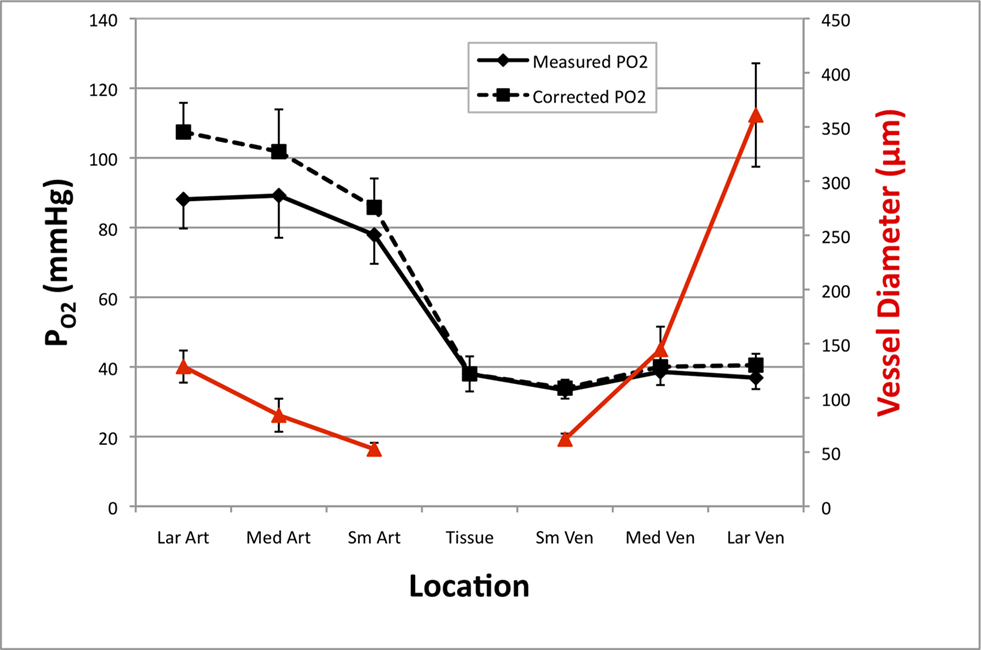
Figure 2. Average resting cerebral  gradient in tissue and pial vasculature (solid black line).
  measurements were obtained from the vessel wall and the intra-vascular
  (corrected) was estimated using oxygen gradient and wall thickness estimates from the literature (dashed black line). The average vessel diameter is also presented (solid red line) with its corresponding axis on the right. In the horizontal axis, “Lar” was used to denote the largest visible branch of the targeted pial artery (“Art”) and vein (“Ven”). These locations are also referred to as large artery and large vein, respectively. “Sm” was used to denote the targeted pre-penetrating arterial branch (also called small artery) and post-emerging venous branch (small vein). “Med” was used to denote the branch location of measurement between the “Lar” and “Sm” locations in each artery and vein (also referred to as medium artery and medium vein). Error bars indicate the standard error (n = 6, 6, 9, 9, 9, 6, and 6 for LarArt, MedArt, SmArt, Tissue, SmVen, MedVen, and LarVen, respectively). This data was adapted from Vazquez et al. (2010)
.
(corrected) was estimated using oxygen gradient and wall thickness estimates from the literature (dashed black line). The average vessel diameter is also presented (solid red line) with its corresponding axis on the right. In the horizontal axis, “Lar” was used to denote the largest visible branch of the targeted pial artery (“Art”) and vein (“Ven”). These locations are also referred to as large artery and large vein, respectively. “Sm” was used to denote the targeted pre-penetrating arterial branch (also called small artery) and post-emerging venous branch (small vein). “Med” was used to denote the branch location of measurement between the “Lar” and “Sm” locations in each artery and vein (also referred to as medium artery and medium vein). Error bars indicate the standard error (n = 6, 6, 9, 9, 9, 6, and 6 for LarArt, MedArt, SmArt, Tissue, SmVen, MedVen, and LarVen, respectively). This data was adapted from Vazquez et al. (2010)
.
Interestingly, the gradient of oxygen is decreasing along the traversal of blood within the arterial tree becoming significantly lower in small pre-penetrating pial arterioles (Vovenko, 1999
; Vazquez et al., 2010
). Specifically, in a report by Vovenko (1999)
the resting arterial oxygen tension dropped by 23 mmHg prior to entering the capillaries. In a recent study by our group (Vazquez et al., 2010
), the arterial oxygen tension dropped by 11 mmHg in the pial surface prior to the arteries penetrating into the cortex (Figure 2
, medium to small artery locations). Similar measurements in other tissues (e.g., muscle) have also shown a similar efflux of oxygen from arterial vessels (Duling and Berne, 1970
). In many studies, vascular  measurements are made at the vessel wall, which underestimates the intra-luminal vascular
  A conventional correction to
  measurements at the vessel wall considers the wall thickness and the gradient of oxygen across the wall (Ivanov et al., 1999
). In a study by Duling and Berne (1970)
these two parameters were measured in cerebral arteries and they found an average
measurements at the vessel wall considers the wall thickness and the gradient of oxygen across the wall (Ivanov et al., 1999
). In a study by Duling and Berne (1970)
these two parameters were measured in cerebral arteries and they found an average  gradient of about 1 mmHg/µm and an average wall thickness of 15% of the intra-luminal diameter. These findings were used to perform a zero-order correction of our arterial
  measurements obtained at the vessel wall and, as a result, the longitudinal
  gradient along the arterial tree slightly steepened to 16 mmHg (from 101.8 to 85.8 mmHg, Figure 2
). In addition, the study by Vovenko, was performed under a microscope at high magnification using sharp microelectrodes that were carefully positioned inside the vessel wall in close proximity to the luminal space to avoid this potential source of error. In both studies a significant decrease in arterial
gradient along the arterial tree slightly steepened to 16 mmHg (from 101.8 to 85.8 mmHg, Figure 2
). In addition, the study by Vovenko, was performed under a microscope at high magnification using sharp microelectrodes that were carefully positioned inside the vessel wall in close proximity to the luminal space to avoid this potential source of error. In both studies a significant decrease in arterial  was observed, hence showing that, similar to other tissues, cerebral arteries are indeed permeable to oxygen. The significance of this arterial oxygen gradient is that it allows for the control of the delivery of oxygen to down-stream vasculature through increases in blood flow.
It has been long hypothesized that this delivery of oxygen by the arterial vasculature serves to satisfy the metabolic demands of vascular cells and also the demands of surrounding tissue (Tsai et al., 2003
). However, recall that the total efflux of oxygen depends on that bound to hemoglobin and the ODC. In arteries,  is relatively high but the total amount of oxygen transported to tissue is not as large as that in capillaries. Nonetheless, measurements of the radial arterial
  gradient beyond the vascular wall have shown that the oxygen tension in tissue surrounding arteries is significantly larger than the
  in capillaries (Duling et al., 1979
; Sharan et al., 2008
). This gradient was observed to take tens of micrometers to equilibrate with the average tissue oxygen tension. These findings indicate that sufficient oxygen escapes arterial blood and reaches surrounding tissue for consumption and that capillaries are not the sole source of oxygen delivery. However, the functional role of this source of oxygen is unclear.
in capillaries (Duling et al., 1979
; Sharan et al., 2008
). This gradient was observed to take tens of micrometers to equilibrate with the average tissue oxygen tension. These findings indicate that sufficient oxygen escapes arterial blood and reaches surrounding tissue for consumption and that capillaries are not the sole source of oxygen delivery. However, the functional role of this source of oxygen is unclear.
Lastly, after the passage of blood through arteries and capillaries, it enters the venous vasculature where it continually pools with blood from other cortical areas as the branching order decreases. In contrast to the arterial vasculature, no significant differences in oxygen tension were reported along the venous tree although significant variability in the oxygen tension within the draining venous tree was reported (Vovenko, 1999
; Vazquez et al., 2010
). Interestingly, both studies by Vovenko and our group reported a larger average  in the largest sampled venous location compared to the smallest sampled venous location (by 3–5 mmHg) although these differences were not statistically significant. To account for potential errors stemming from vascular wall measurements, the radial oxygen gradient in veins was measured to be 0.1 mmHg/µm (Vovenko, 1999
; Tsai et al., 2003
). In addition, the venous vascular wall is thinner than that of arteries (about 10% of the venous lumen diameter) (Burton, 1954
). These values were also used to perform a zero-order correction of the venous
in the largest sampled venous location compared to the smallest sampled venous location (by 3–5 mmHg) although these differences were not statistically significant. To account for potential errors stemming from vascular wall measurements, the radial oxygen gradient in veins was measured to be 0.1 mmHg/µm (Vovenko, 1999
; Tsai et al., 2003
). In addition, the venous vascular wall is thinner than that of arteries (about 10% of the venous lumen diameter) (Burton, 1954
). These values were also used to perform a zero-order correction of the venous  measurements and small increases in the venous
  were obtained (Figure 2
). Such increases in venous
were obtained (Figure 2
). Such increases in venous  have also been reported in other tissues (Tsai et al., 2003
). In the brain, this increase in venous
have also been reported in other tissues (Tsai et al., 2003
). In the brain, this increase in venous  has been attributed to the presence of arterio-venous shunts and the draining of blood from other parts of the brain with different metabolic demands (Tsai et al., 2003
).
has been attributed to the presence of arterio-venous shunts and the draining of blood from other parts of the brain with different metabolic demands (Tsai et al., 2003
).
Arterial  Changes During Increased Neural Activity
It is well-known that increases in neural activity induce increases in CBF and that this dynamic process is responsible for the hyper-oxygenation of both tissue and the down-stream venous vasculature. However, changes in arterial oxygenation with increases in neural activity had not been investigated. To this end, our group investigated the impact of evoked neural activity on arterial, tissue and venous  in the isoflurane-anesthetized rat (Vazquez et al., 2010
). The neural stimulus consisted of electrical stimulation of the rat’s forelimb with the following parameters: 1 ms pulses at a frequency of 3 Hz, amplitude of 1.5 mA, total duration of 20 s, repeated every 80 s. These parameters have been shown to produce consistent neural responses and robust hemodynamic responses (Masamoto et al., 2009
). CBF was measured using a laser Doppler flowmeter (LDF) and it was observed to increase by 44 ± 12% (n = 9; standard error reported unless otherwise stated) over the last 10 s of the stimulation period, in part due to increases in the vascular diameter of arteries of about 5%. More importantly,
in the isoflurane-anesthetized rat (Vazquez et al., 2010
). The neural stimulus consisted of electrical stimulation of the rat’s forelimb with the following parameters: 1 ms pulses at a frequency of 3 Hz, amplitude of 1.5 mA, total duration of 20 s, repeated every 80 s. These parameters have been shown to produce consistent neural responses and robust hemodynamic responses (Masamoto et al., 2009
). CBF was measured using a laser Doppler flowmeter (LDF) and it was observed to increase by 44 ± 12% (n = 9; standard error reported unless otherwise stated) over the last 10 s of the stimulation period, in part due to increases in the vascular diameter of arteries of about 5%. More importantly,  was measured in pial arteries, pial veins and tissue locations using oxygen microelectrodes and, upon stimulation, vascular
  was observed to increase in pial arteries and veins at all the locations sampled (Figure 3
). The average arterial oxygen tension was observed to increase by 4 ± 1 (n = 6), 5 ± 1 (n = 6) and 11 ± 2 mmHg (n = 9) at the large, medium and small pial artery locations, respectively, during the last 10 s of the stimulation period. Note that the arterial longitudinal gradient decreased on average from 16 mmHg at rest to 10 mmHg during stimulation conditions. The average venous
was observed to increase in pial arteries and veins at all the locations sampled (Figure 3
). The average arterial oxygen tension was observed to increase by 4 ± 1 (n = 6), 5 ± 1 (n = 6) and 11 ± 2 mmHg (n = 9) at the large, medium and small pial artery locations, respectively, during the last 10 s of the stimulation period. Note that the arterial longitudinal gradient decreased on average from 16 mmHg at rest to 10 mmHg during stimulation conditions. The average venous  was observed to increase by 7 ± 2 (n = 9), 7 ± 2 (n = 6) and 5 ± 2 mmHg (n = 6) at the small, medium and large pial vein locations, respectively. Temporally, the earliest average increase in vascular
  was observed in medium and small pial arteries.
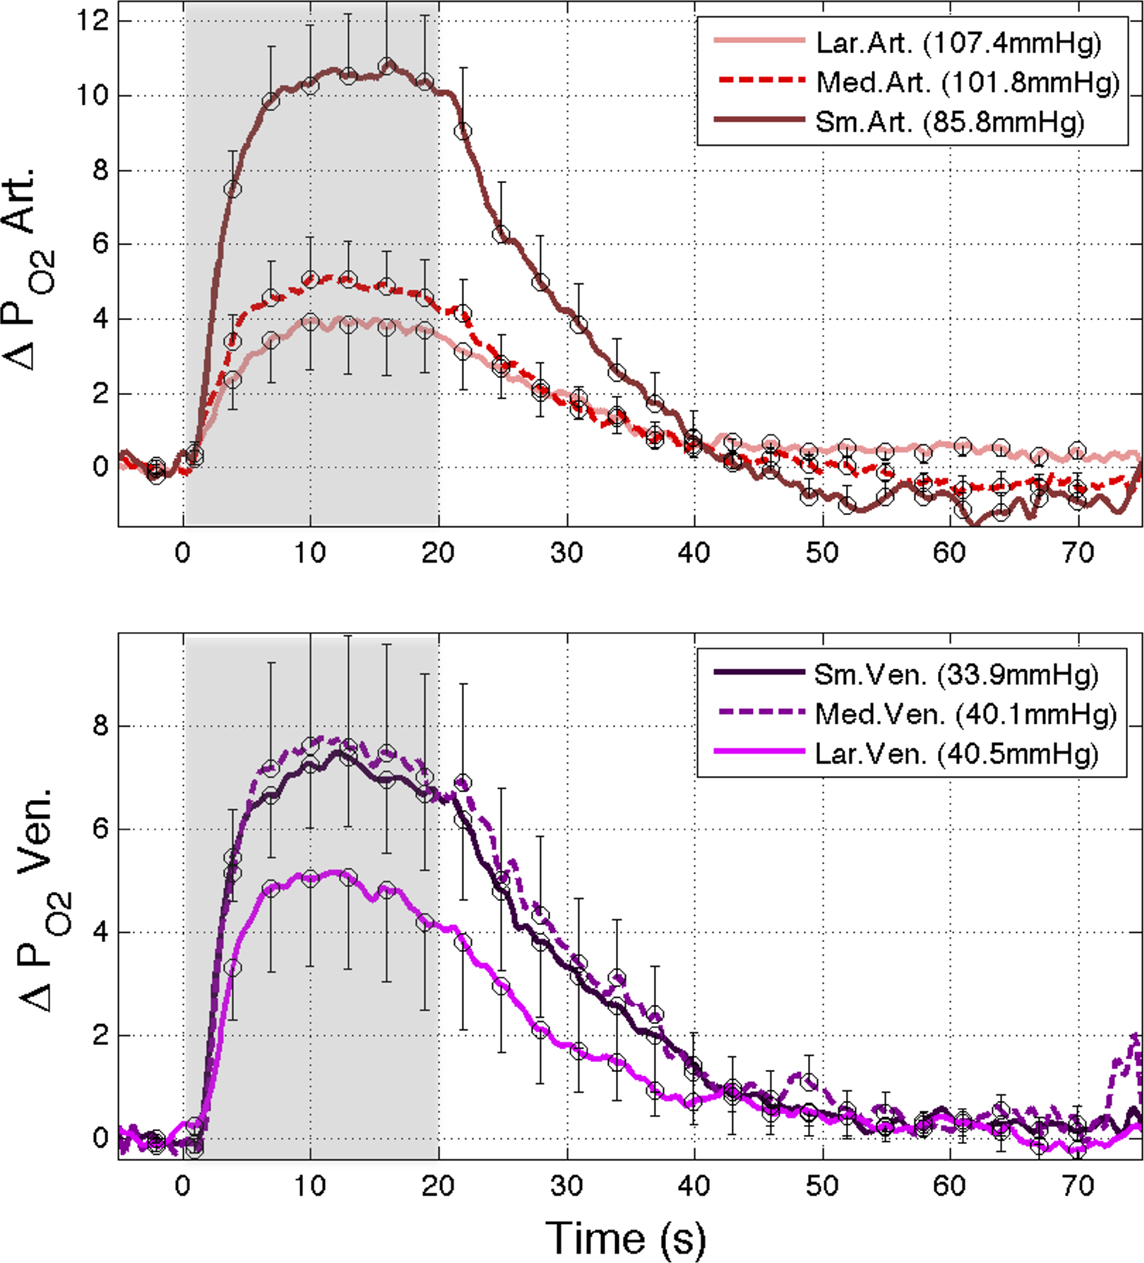
Figure 3. (Top) Change in oxygen tension at sampled large, medium and small pial arteries (labeled LarArt, MedArt, and SmArt, respectively) due to evoked somato-sensory stimulation (gray bars) relative to their respective pre-stimulation level. The small pial artery measured consisted of a pre-penetrating arterial branch just prior to its intra-cortical penetrating location over the activate area. The medium and large locations sampled consisted of the parent branches of the sample small artery sampled. (Bottom) Change in oxygen tension at the vessel wall of sampled small, medium and large pial veins (labeled SmVen, MedVen, and LarVen, respectively) relative to their respective pre-stimulation level. Similar to the small artery location, the small pial vein location was selected just after its intra-cortical emerging location over the active area and the medium and large vein locations corresponded to parent branches. The corresponding baseline for each location sampled  is reported in the legend. Error bars indicate the standard error (n = 6, 6, 9, 9, 9, 6, and 6 for LarArt, MedArt, SmArt, Tissue, SmVen, MedVen, and LarVen, respectively). This data was adapted from Vazquez et al. (2010)
.
is reported in the legend. Error bars indicate the standard error (n = 6, 6, 9, 9, 9, 6, and 6 for LarArt, MedArt, SmArt, Tissue, SmVen, MedVen, and LarVen, respectively). This data was adapted from Vazquez et al. (2010)
.
In summary, the longitudinal arterial  gradient was observed to decrease with increase in function. This is due, at least in part, to the functional increase in CBF. In general, an increase in arterial oxygen tension will also increase the extra-vascular oxygen tension (Figure 1
). To investigate the mechanism(s) behind the decrease in the longitudinal arterial gradient, our experimental data were used in combination with the model in Eqs 1 and 2 to estimate the required increases in extra-vascular to describe the data. For this exercise, the LDF data was assumed to represent CBF, the medium artery
gradient was observed to decrease with increase in function. This is due, at least in part, to the functional increase in CBF. In general, an increase in arterial oxygen tension will also increase the extra-vascular oxygen tension (Figure 1
). To investigate the mechanism(s) behind the decrease in the longitudinal arterial gradient, our experimental data were used in combination with the model in Eqs 1 and 2 to estimate the required increases in extra-vascular to describe the data. For this exercise, the LDF data was assumed to represent CBF, the medium artery  was used to represent the input of the vascular compartment (Ca) and the tissue
  was used as an estimate of the extra-vascular
  (Ct). The model was then used to compare the predicted output
  (Cv) with the measured small artery
  data (Figure 1
). The values considered for the parameters of the model are listed in Table 1
. Considering only the steady-state changes, it was calculated that a large increase in the extra-vascular
data (Figure 1
). The values considered for the parameters of the model are listed in Table 1
. Considering only the steady-state changes, it was calculated that a large increase in the extra-vascular  is necessary to describe the small artery
  data (output) and lower resting extra-vascular
  levels. Recall that the tissue level was measured in these experiments at a depth of 300 µm which includes capillary exchange (Figure 4
, top panel, and Table 1
). The change in the extra-vascular
levels. Recall that the tissue level was measured in these experiments at a depth of 300 µm which includes capillary exchange (Figure 4
, top panel, and Table 1
). The change in the extra-vascular  was calculated to decrease as the resting extra-vascular
  level increased.
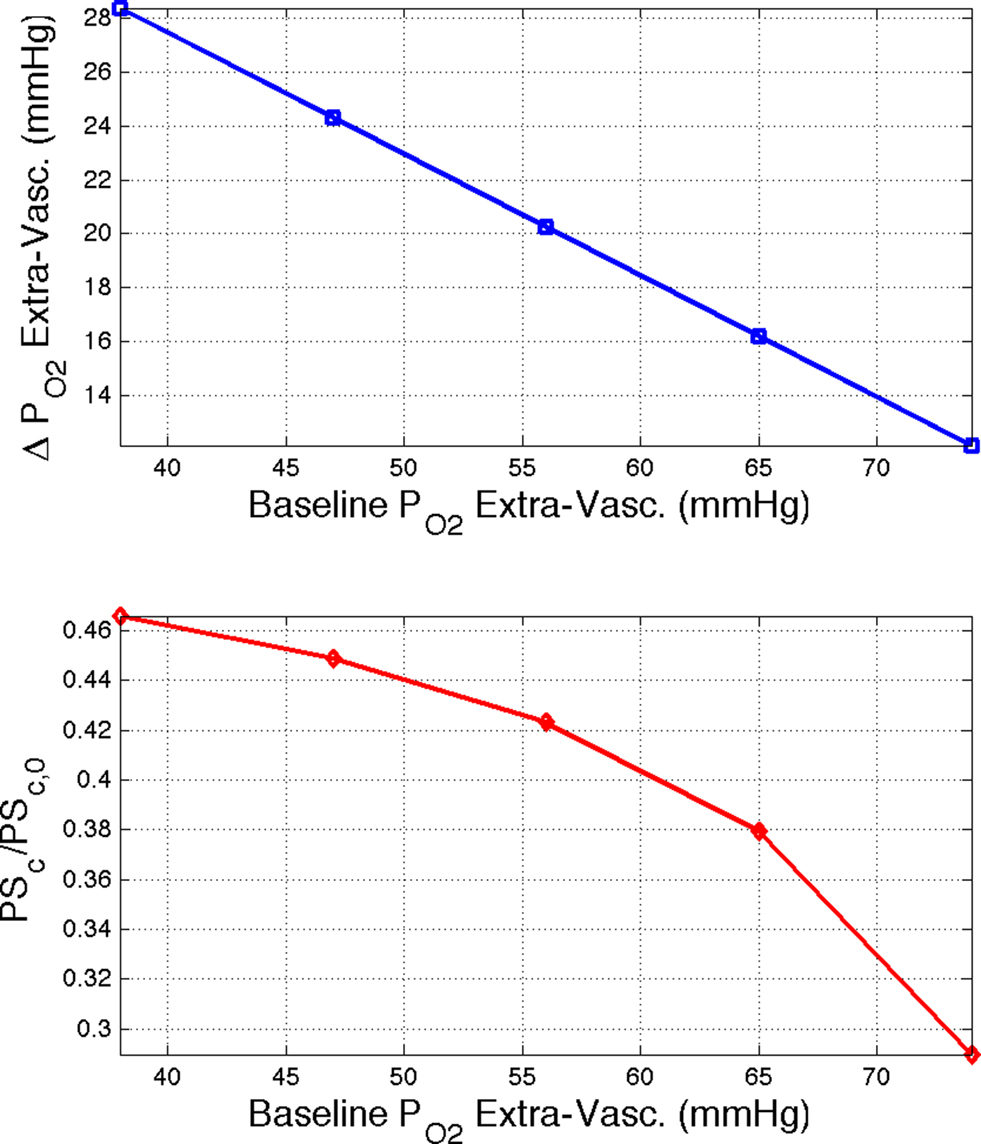
Figure 4. (Top) Model prediction of the increase in the extra-vascular  (Ct) necessary to represent the increase in medium artery
  (input, Ca) and small artery
  (output, Cv) considering the measured increase in CBF and a constant PSc (Eq. 2, Figure 1
). A higher extra-vascular
(output, Cv) considering the measured increase in CBF and a constant PSc (Eq. 2, Figure 1
). A higher extra-vascular  level requires a smaller activation-evoked increase in extra-vascular
  to describe the data (i.e., small artery ). (Bottom) Model prediction of the decrease in PSc (i.e., oxygen permeability) necessary to describe the increase in medium and small artery
  during increased neural activity while maintaining the extra-vascular
  level constant.
Another possibility is that the extra-vascular  level does not change and that the increases in CBF (i.e., blood velocity) impact the permeability of oxygen. Under these assumptions, the relative change in PS was calculated to significantly drop with increases in CBF and this decrease grows as the resting extra-vascular
  level increases (Figure 4
, bottom panel). Decreases in oxygen permeability with increases in blood flow have been reported (Tsai et al., 2003
; Lamkin-Kennard et al., 2004
; Chen et al., 2006
), though not of this magnitude. To determine which mechanism(s) contribute to significant hyper-oxygenation in arteries, it is necessary to assess the baseline
level increases (Figure 4
, bottom panel). Decreases in oxygen permeability with increases in blood flow have been reported (Tsai et al., 2003
; Lamkin-Kennard et al., 2004
; Chen et al., 2006
), though not of this magnitude. To determine which mechanism(s) contribute to significant hyper-oxygenation in arteries, it is necessary to assess the baseline  at the pial surface as well as the magnitude of superficial tissue
  changes with increased brain activity, if any. The
  of tissue is known to be heterogeneous, including that of the pial surface. This has been attributed to the relative heterogeneous distribution of capillaries, arteries and veins in the brain (Popel, 1989
; Tsai et al., 2003
). Nonetheless, preliminary tissue
of tissue is known to be heterogeneous, including that of the pial surface. This has been attributed to the relative heterogeneous distribution of capillaries, arteries and veins in the brain (Popel, 1989
; Tsai et al., 2003
). Nonetheless, preliminary tissue  measurements at the pial surface and deeper in tissue performed in our laboratory have shown that the surface
  level is higher than that at 300 µm in depth, but the functional increase in tissue
  is somewhat smaller at the surface compared to deeper in tissue (Figure 5
). Other reports in the literature have also found a higher tissue
is somewhat smaller at the surface compared to deeper in tissue (Figure 5
). Other reports in the literature have also found a higher tissue  near or at the pial surface (Masamoto et al., 2004
; Sharan et al., 2008
). Therefore, we conclude that the increase in arterial
near or at the pial surface (Masamoto et al., 2004
; Sharan et al., 2008
). Therefore, we conclude that the increase in arterial  requires a decrease in the arterial permeability of oxygen in addition to the increase in CBF which contribute to the hyper-oxygenation of surrounding tissue.
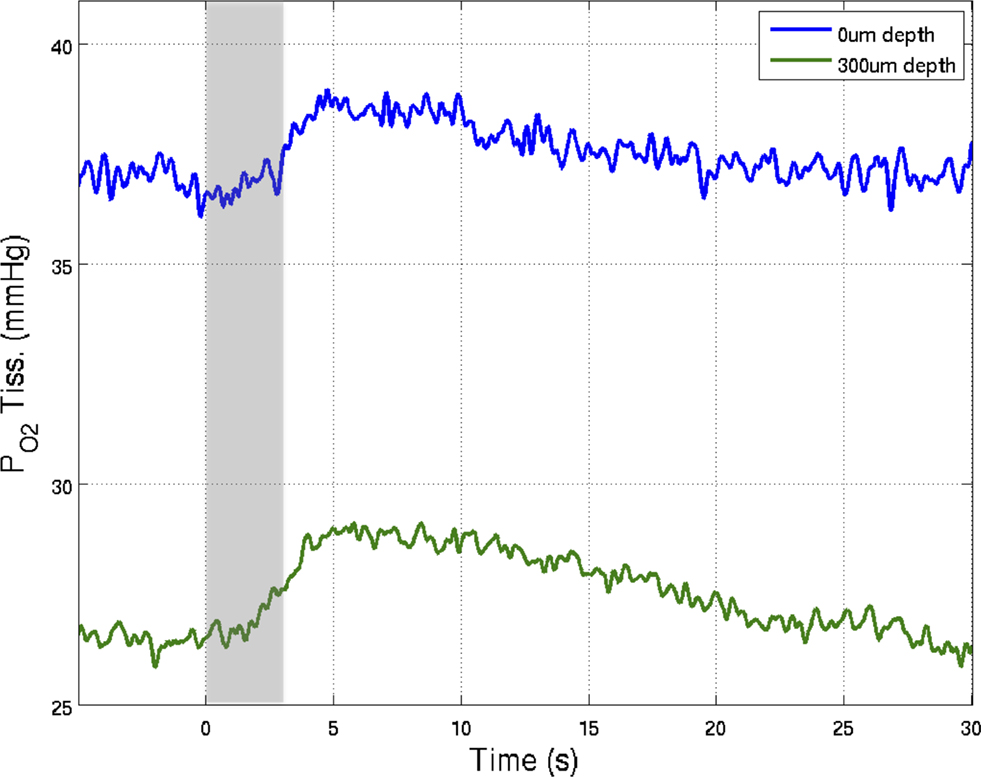
Figure 5. Preliminary measurements of the increase in tissue  that result from increases in somato-sensory stimulation at two different depth locations: at the cortical surface (0 µm, blue line) and 300 µm below the surface (green line). In this experiment, the stimulation period was significantly shorter (3 s), hence the changes in
  were not as large as those in Figure 3
. Although these functional responses were not obtained simultaneously, CBF changes were recorded at both depths using LDF and the evoked CBF responses were essentially the same. The at the surface was about 10 mmHg larger than that at 300 µm depth.
were not as large as those in Figure 3
. Although these functional responses were not obtained simultaneously, CBF changes were recorded at both depths using LDF and the evoked CBF responses were essentially the same. The at the surface was about 10 mmHg larger than that at 300 µm depth.
Tissue Oxygen Delivery During Increased Neural Activity
The increase in arterial oxygen tension supplies the sub-serving tissues with a relatively large amount of oxygen. Computer simulation work performed by our group determined that, given an estimate of the tissue  response, both the upstream arterial
  and the intra-cortical area of exchange (by way of an increase in CBV) need to increase in order to fully describe the measured changes in tissue
  (Vazquez et al., 2008
). The data and simulation work in that study found that the delivery of oxygen required a peak increase of 14 mmHg in tissue
(Vazquez et al., 2008
). The data and simulation work in that study found that the delivery of oxygen required a peak increase of 14 mmHg in tissue  to describe the data. The increase in oxygen delivery can be allocated as contributions from CBF increases alone (6 mmHg for a constant input oxygenation), increases in the input arterial oxygenation (4 mmHg for an increase of 10 mmHg in arterial
  ) and other mechanisms (4 mmHg), such as an increase in exchange area. The data in Figure 3
shows similar increases in arterial oxygenation and the residual increase in oxygen delivery can be attributed to increases in exchange area (CBV). In fact, functional increases in intra-cortical blood volume have been measured using MRI in similar experiments (Kim et al., 2007
). Alternatively, another mechanism to increase the delivery of oxygen can be through a shift in the ODC due to pH increases and the binding of CO2 to hemoglobin (i.e., the Bohr effect). To examine this mechanism, our previous simulation work was expanded to consider the possibility of shifts in the blood P50 (Eq. 1) as the sole source of the increases in tissue oxygen delivery (i.e., no arterial or exchange area increases). The results from this simulation show that an average increase in P50 from 38 to 43.7 mmHg was necessary to fully describe the measured changes in tissue
) and other mechanisms (4 mmHg), such as an increase in exchange area. The data in Figure 3
shows similar increases in arterial oxygenation and the residual increase in oxygen delivery can be attributed to increases in exchange area (CBV). In fact, functional increases in intra-cortical blood volume have been measured using MRI in similar experiments (Kim et al., 2007
). Alternatively, another mechanism to increase the delivery of oxygen can be through a shift in the ODC due to pH increases and the binding of CO2 to hemoglobin (i.e., the Bohr effect). To examine this mechanism, our previous simulation work was expanded to consider the possibility of shifts in the blood P50 (Eq. 1) as the sole source of the increases in tissue oxygen delivery (i.e., no arterial or exchange area increases). The results from this simulation show that an average increase in P50 from 38 to 43.7 mmHg was necessary to fully describe the measured changes in tissue  (Figure 6
). Under resting conditions, arterio-venous differences in blood pH and
(Figure 6
). Under resting conditions, arterio-venous differences in blood pH and  are about −0.05 and 6 mmHg, respectively (Vovenko, 1999
), which would in turn increase the P50 of blood by about 1.5 mmHg (Severinghaus, 1979
). Measurements of the changes in cerebral pH and/or
are about −0.05 and 6 mmHg, respectively (Vovenko, 1999
), which would in turn increase the P50 of blood by about 1.5 mmHg (Severinghaus, 1979
). Measurements of the changes in cerebral pH and/or  with function are necessary to determine if this mechanism contributes to the delivery of oxygen to tissue. Interestingly, this mechanism has also been proposed as that responsible for the slight increases in the venous
  longitudinal gradient (Tsai et al., 2003
).
longitudinal gradient (Tsai et al., 2003
).
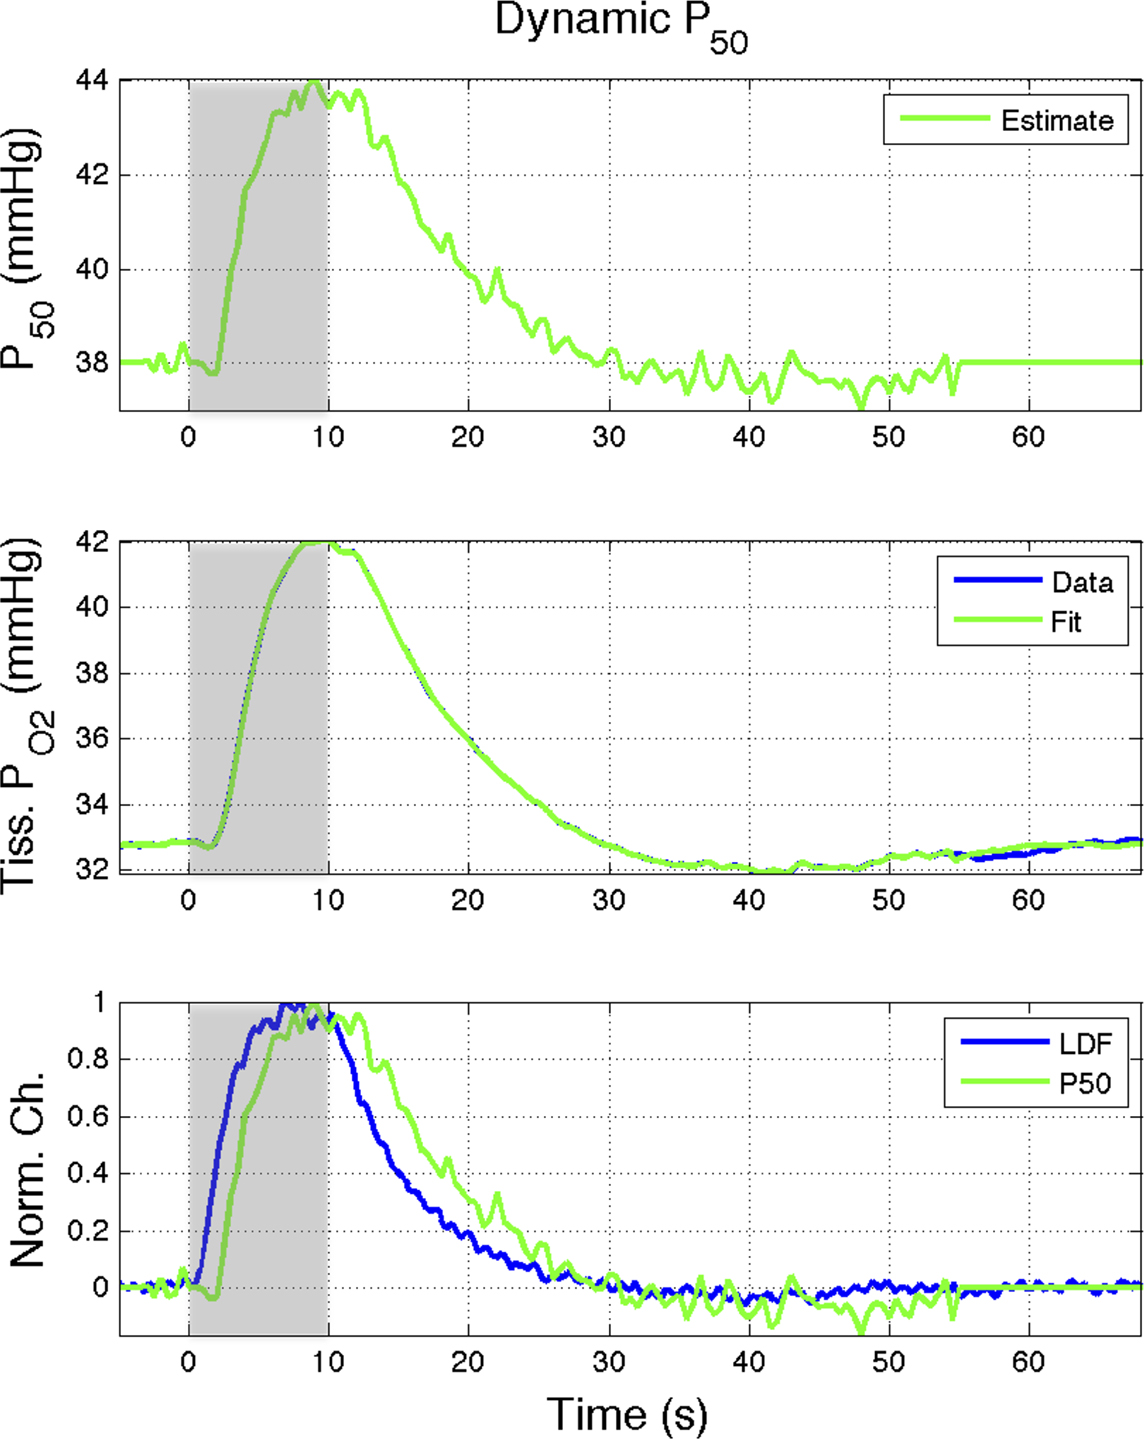
Figure 6. Effect of the blood P50 (Eq 1) on the delivery of oxygen to tissue. A 15% increase in P50 (top panel) was found to represent the tissue  data (middle panel; Vazquez et al., 2008
). (Bottom panel) The estimated changes in P50 were temporally similar to the changes in CBF measured in that study although lagged the CBF response (measured using LDF) by about 1.5 s at 50% amplitude. Increases of this magnitude are not likely to be physiological; however, this mechanism may contribute to the hyper-oxygenation of tissue during increases in neural activity.
data (middle panel; Vazquez et al., 2008
). (Bottom panel) The estimated changes in P50 were temporally similar to the changes in CBF measured in that study although lagged the CBF response (measured using LDF) by about 1.5 s at 50% amplitude. Increases of this magnitude are not likely to be physiological; however, this mechanism may contribute to the hyper-oxygenation of tissue during increases in neural activity.
Oxygen Consumption
Oxygen in tissue is consumed in mitochondria as part of oxidative metabolism. Although this metabolic pathway yields much more energy than glycolysis, the role of oxidative metabolism in satisfying the energetic needs of neural tissue during increased function has been extensively debated (Shulman et al., 2001
). This is partly due to the lack of adequate methods to directly measure oxidative metabolism. For example, methods such as O15-PET and O17-NMR are directly sensitive to  but require a steady-state of exogenous label to reach tissue (Herscovitch et al., 1985
; Fiat et al., 1993
). Nonetheless, these and similar techniques have been used to show measurable increases in oxidative metabolism with increases in neural activity (Hyder et al., 2001
; Rothman et al., 2003
). Much of the scientific interest to measure functional changes in cerebral metabolism stem not only from its physiologically relevant role in maintaining function, but also in part due to its sensitivity to spiking activity. Thompson et al. (2003)
measured the changes in tissue oxygen tension and spiking activity with visual stimulation in the primary visual cortex of cats. They showed that increases in spiking activity to preferred-oriented visual stimuli were accompanied by decreases in tissue oxygen tension due to a dominant metabolic response. On the other hand, this
but require a steady-state of exogenous label to reach tissue (Herscovitch et al., 1985
; Fiat et al., 1993
). Nonetheless, these and similar techniques have been used to show measurable increases in oxidative metabolism with increases in neural activity (Hyder et al., 2001
; Rothman et al., 2003
). Much of the scientific interest to measure functional changes in cerebral metabolism stem not only from its physiologically relevant role in maintaining function, but also in part due to its sensitivity to spiking activity. Thompson et al. (2003)
measured the changes in tissue oxygen tension and spiking activity with visual stimulation in the primary visual cortex of cats. They showed that increases in spiking activity to preferred-oriented visual stimuli were accompanied by decreases in tissue oxygen tension due to a dominant metabolic response. On the other hand, this  -driven decrease was not evident during the presentation of non-preferred orientation visual stimuli which did not elicit significant changes in spiking activity.
Changes in Tissue  Induced by Changes in
The dynamic changes of tissue oxygen tension can be measured using oxygen microelectrodes as done by Thompson and others (Ances et al., 2001
; Thompson et al., 2003
; Masamoto et al., 2003
). However, this method does not directly measure the functional changes in  because the tissue oxygen tension is also manipulated by the concomitant CBF response. Because
  and CBF modulate the oxygen tension of tissue in opposite fashion, the dynamics of oxidative metabolism have been difficult to measure even when using oxygen specific methods such as oxygen microelectrodes. One solution to overcome this difficulty is to suppress the evoked CBF response. For this purpose, our group implemented an experimental condition which relies on the administration of a clinical vasodilator, sodium nitroprusside (sNP) (Fukuda et al., 2006
; Nagaoka et al., 2006
; Masamoto et al., 2008
). This agent dilates the vasculature effectively suppressing evoked increases in CBF (and CBV) due to neural stimulation. However, the delivery of this agent significantly reduces the systemic blood pressure (its intended clinical use). To verify that this agent does not disrupt neural function, measurements of local field potential and spiking activity with evoked stimulation prior to, during and after the administration of the agent were performed. These experiments showed that the evoked spiking and local field potential activity during the agent administration was not significantly different than the activity prior to or after agent administration (Fukuda et al., 2006
; Masamoto et al., 2008
).
and CBF modulate the oxygen tension of tissue in opposite fashion, the dynamics of oxidative metabolism have been difficult to measure even when using oxygen specific methods such as oxygen microelectrodes. One solution to overcome this difficulty is to suppress the evoked CBF response. For this purpose, our group implemented an experimental condition which relies on the administration of a clinical vasodilator, sodium nitroprusside (sNP) (Fukuda et al., 2006
; Nagaoka et al., 2006
; Masamoto et al., 2008
). This agent dilates the vasculature effectively suppressing evoked increases in CBF (and CBV) due to neural stimulation. However, the delivery of this agent significantly reduces the systemic blood pressure (its intended clinical use). To verify that this agent does not disrupt neural function, measurements of local field potential and spiking activity with evoked stimulation prior to, during and after the administration of the agent were performed. These experiments showed that the evoked spiking and local field potential activity during the agent administration was not significantly different than the activity prior to or after agent administration (Fukuda et al., 2006
; Masamoto et al., 2008
).
Our group has used this suppressed-CBF condition to investigate the  response properties to evoked neural activity. In these experiments, BOLD fMRI and optical imaging of intrinsic signal (OIS) were used to represent the oxygenation of blood, and oxygen microelectrodes to represent the oxygenation of tissue, in anesthetized rats and cats (Fukuda et al., 2006
; Nagaoka et al., 2006
; Moon et al., 2007
; Masamoto et al., 2008
). OIS was implemented using 620 nm transmitted light which is sensitive to the absorption of light by deoxygenated hemoglobin and therefore has similar sensitivity to BOLD fMRI. In one of these reports (Masamoto et al., 2008
), both tissue
response properties to evoked neural activity. In these experiments, BOLD fMRI and optical imaging of intrinsic signal (OIS) were used to represent the oxygenation of blood, and oxygen microelectrodes to represent the oxygenation of tissue, in anesthetized rats and cats (Fukuda et al., 2006
; Nagaoka et al., 2006
; Moon et al., 2007
; Masamoto et al., 2008
). OIS was implemented using 620 nm transmitted light which is sensitive to the absorption of light by deoxygenated hemoglobin and therefore has similar sensitivity to BOLD fMRI. In one of these reports (Masamoto et al., 2008
), both tissue  and OIS were measured during evoked somato-sensory stimulation for 10 s under control and suppressed-CBF conditions in the isoflurane-anesthetized rat. Somato-sensory stimulation under control conditions evoked an increase in CBF of 48 ± 10% (n = 5; measured using LDF), while under suppressed-CBF conditions, the magnitude of the CBF response was significantly diminished, showing increases of 3–4% over baseline. More importantly, under suppressed-CBF conditions, the dynamic decreases in tissue
  and in blood oxygenation (measured by OIS) induced by increases in
  were considerably slow, taking over 10 s to peak (blue lines in Figures 7
A,B). In fact, the
were considerably slow, taking over 10 s to peak (blue lines in Figures 7
A,B). In fact, the  -driven decreases in tissue
  under suppressed-CBF conditions (blue line in Figure 7
C) appear to be slower than the evoked CBF response measured by LDF under control conditions (green line in Figure 7
C). In addition, the magnitude of the decreases in tissue
under suppressed-CBF conditions (blue line in Figure 7
C) appear to be slower than the evoked CBF response measured by LDF under control conditions (green line in Figure 7
C). In addition, the magnitude of the decreases in tissue  due to evoked increases in
  was found to be very well correlated with the field potential responses of individual stimuli (Masamoto et al., 2008
). These data were supplied to the model described by Eqs 1–3 to estimate the dynamic changes in
was found to be very well correlated with the field potential responses of individual stimuli (Masamoto et al., 2008
). These data were supplied to the model described by Eqs 1–3 to estimate the dynamic changes in  The results obtained showed that the calculated dynamics lagged changes in CBF by 2.2 s (measured as the time-to-50% peak during the response onset) (Vazquez et al., 2008
). Collectively, these results suggest that temporal dynamics of the average
The results obtained showed that the calculated dynamics lagged changes in CBF by 2.2 s (measured as the time-to-50% peak during the response onset) (Vazquez et al., 2008
). Collectively, these results suggest that temporal dynamics of the average  response are as slow as those of the hemodynamic response, if not slower.
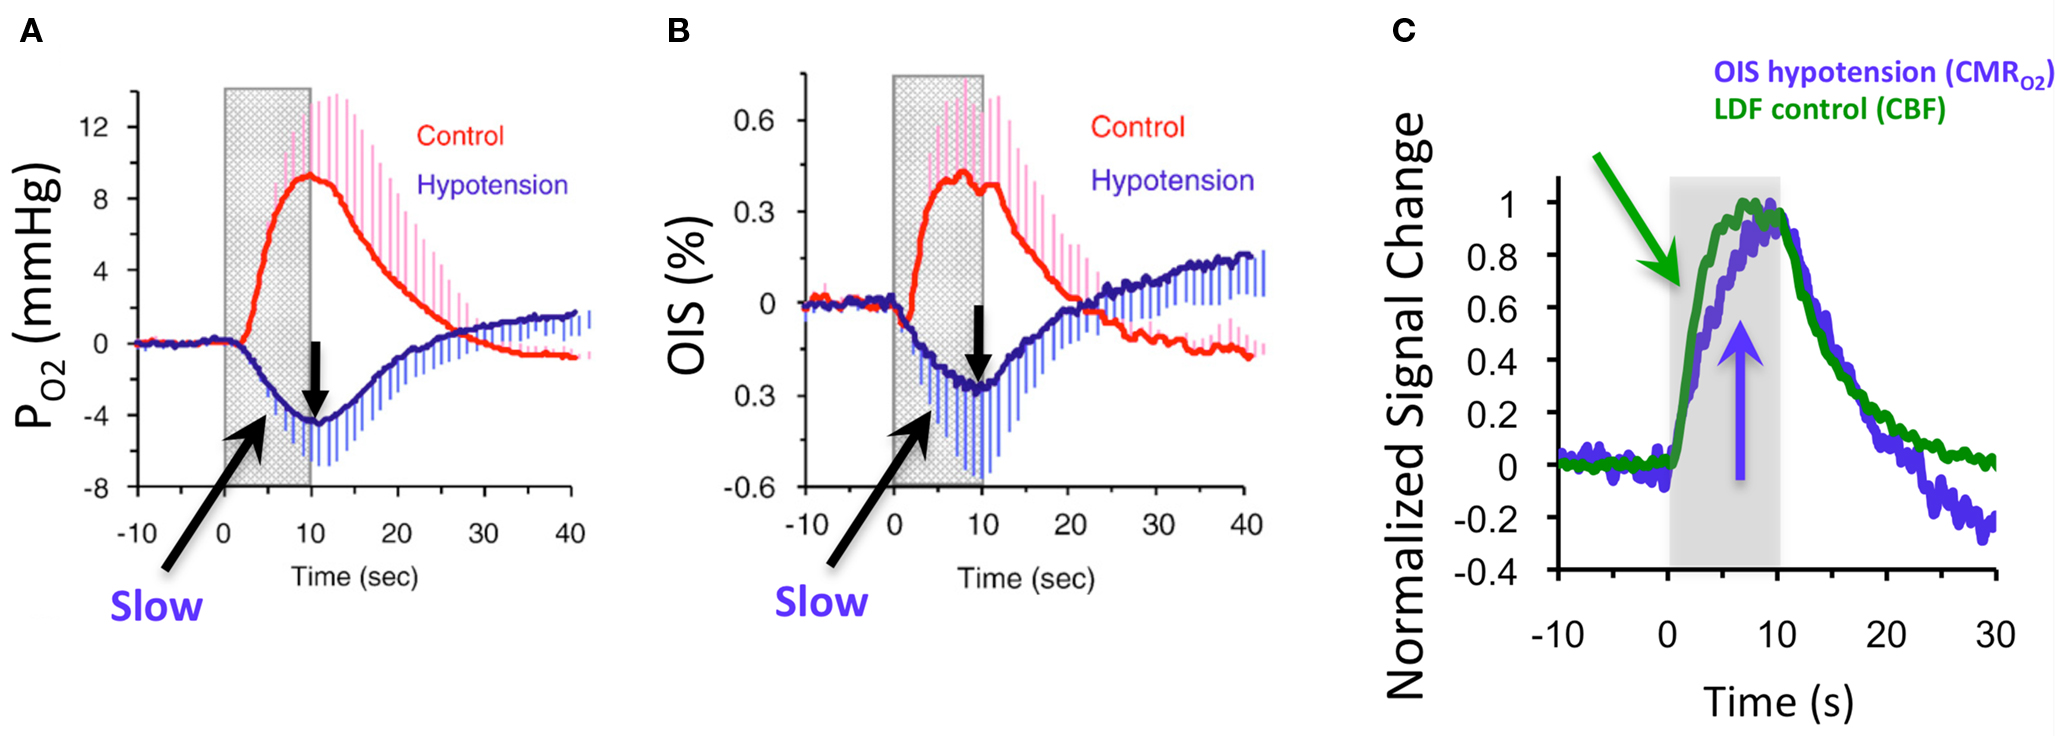
Figure 7. Averaged tissue  (A) and blood oxygenation ((B), OIS) changes to forelimb somato-sensory stimulation (1 ms, 1. 2 mA electrical pulses delivered at 6 Hz for 10 s indicated by gray bars) under control (red lines) and suppressed-CBF conditions (blue lines). (C) Normalized time series (baseline to peak) show that the CBF response under control conditions measured by LDF is faster than
  -induced blood oxygenation (OIS) changes. This data was adapted from Masamoto et al. (2008)
.
-induced blood oxygenation (OIS) changes. This data was adapted from Masamoto et al. (2008)
.
Dynamics of Cellular  Changes Measured Using FAI
In general, two methods are known to be sensitive to the cellular oxidative metabolic rate, both of which are light-based and invasive. One relies on the absorption of light by cytochrome-c, a mitochondrial protein responsible for transporting electrons between complexes III and IV in the electron transport chain of the TCA cycle (Chance, 1968 ). The other relies on the fluorescence of tissue proteins that also participate in cellular metabolism. Much of the intrinsic fluorescence of living tissues, or autofluorescence, stems from the reduced form of the coenzyme nicotinamide adenine dinucleotide (NADH) and the oxidized form of flavin adenine dinucleotide (FAD) (Chance, 1968 ; Huang et al., 2002 ). These proteins are directly involved in the TCA cycle as proton carriers for the electron transport chain where NADH and FADH2 are oxidized to NAD and FAD, respectively. While NADH is fluorescent, NAD+ is not, and the metabolic rate could be assessed by decreases in the fluorescence of NADH (Huang et al., 2002 ; Reinert et al., 2004 ). Different from NADH, its analog FADH2 is not fluorescent, but its oxidized form (FAD, also called flavoprotein) is fluorescent; hence, increases in the metabolic rate can be assessed by increases in the fluorescence of FAD (Hassinen and Chance, 1968 ; Huang et al., 2002 ; Reinert et al., 2004 ). More importantly, FAD fluorescence changes in vivo are generally larger and easier to detect than that of NADH, although its concentration in tissue is lower (Reinert et al., 2004 ).
Flavoprotein autofluorescence measurements were pioneered by Dr. Britton Chance and has been extensively used to investigate muscle function and ex vivo cellular function in various tissues (Chance et al., 1962
, 1979
; Garland et al., 1967
; Chance, 1968
; Shuttleworth et al., 2003
; Kasischke et al., 2004
; Skala et al., 2007
). Recently, FAI was adapted by several groups to image brain functional metabolism in vivo. Shibuki et al. (2003)
implemented and verified the signal source of this method in rat brain slices and in vivo. They stimulated the rat cortex directly with a metal electrode and observed large sub-linear increases in FAD fluorescence as a function of stimulus frequency (as large as 20% for 100 Hz stimuli). They also used a more natural mechanical stimulus of the hind limb (50 Hz vibration) that lasted 1 s and produced increases in FAD fluorescence of about 3% in the somato-sensory cortex. The increase in fluorescence peaked 1 s after stimulation onset and was followed by an equally large decrease in signal that took longer to subside. They hypothesized that the signal decrease was due to the stimulus-evoked CBF (and CBV) response that absorbed the FAD fluorescence emission. To investigate this possibility, they applied a nitric oxide inhibitor (NG-nitro-l-arginine) topically onto the cortex to reduce the CBF response and this condition indeed reduced the magnitude of the negative portion of the autofluorescence response. In another study, Reinert et al. (2004)
studied FAI in the cerebellar cortex of mice using direct electrical stimulation and also found large increases in FAD fluorescence that were followed by a significant and prolonged decrease in fluorescence. They attributed this bi-phasic response to a time-dependent change in the metabolic cascade (a fast initial oxidation of FAD followed by a larger overall reduction in FAD) and to different metabolic contributions from neurons and glial cells. Lastly, Husson et al. (2007)
demonstrated the use of FAI to map the orientation domains in the cat visual cortex. In this study, the spatial specificity of the orientation map obtained by FAI was estimated to be about 300 µm while the specificity of the map obtained by OIS (using 610 nm wavelength light) was estimated to be about 450 µm, suggesting that metabolic imaging is more specific to the neuronal activation sites than hemodynamic imaging. Collectively, these studies have demonstrated the sensitivity and feasibility of this method to map functional metabolic responses in vivo. This method was recently implemented in our laboratory to investigate the temporal dynamics of the  response.
Preliminary FAI experiments have been performed in our laboratory during somato-sensory stimulation in isoflurane-anesthetized rats. The goal of these experiments is to determine the temporal evolution of the functional  response with increases in neural activity. Hence, these experiments have been carried out under suppressed-CBF conditions to avoid potential artifacts stemming from the stimulation-evoked vascular (CBF and CBV) response. Images were acquired using an epi-fluorescence microscope with filtered excitation light of 470 ± 20 nm and emission band at 525 ± 25 nm at 10 frames per second. Somato-sensory stimulation at a frequency of 12 Hz for 4 s shows that the FAI signal increase (brightening) is localized to the forelimb somato-sensory area and that it is sustained during the stimulation period (Figure 8
). More importantly, FAI vascular response artifacts have been mitigated under suppressed-CBF conditions as evidenced by the gray-background intensity of the blood vessels. Therefore, we believe that the data presented, are mostly sensitive to the changes in the cellular oxidative metabolic rate. To further investigate the temporal differences between tissue and blood oxygenation signals driven by changes in
response with increases in neural activity. Hence, these experiments have been carried out under suppressed-CBF conditions to avoid potential artifacts stemming from the stimulation-evoked vascular (CBF and CBV) response. Images were acquired using an epi-fluorescence microscope with filtered excitation light of 470 ± 20 nm and emission band at 525 ± 25 nm at 10 frames per second. Somato-sensory stimulation at a frequency of 12 Hz for 4 s shows that the FAI signal increase (brightening) is localized to the forelimb somato-sensory area and that it is sustained during the stimulation period (Figure 8
). More importantly, FAI vascular response artifacts have been mitigated under suppressed-CBF conditions as evidenced by the gray-background intensity of the blood vessels. Therefore, we believe that the data presented, are mostly sensitive to the changes in the cellular oxidative metabolic rate. To further investigate the temporal differences between tissue and blood oxygenation signals driven by changes in  FAI and OIS signals were measured in separate experiments using a longer stimulation period (15 s of forelimb stimulation at a frequency of 3 Hz). The FAI signal showed very fast temporal changes reaching 90% of peak amplitude within 1.5 s of stimulation onset and a rise time constant of 0.5 s for the onset portion of the response (Figure 9
, left panel). A sustained plateau period was observed in the FAI response followed by a decrease during and after the stimulation period. By contrast, the changes in blood oxygenation measured by OIS showed slower temporal changes, reaching 90% of the peak decrease in 5 s with a rise time constant of 1.9 s (Figure 9
, right panel). This method and the properties of the measured FAI responses are currently under investigation in our laboratory. To summarize, the temporal evolution of the activation-evoked changes in FAI under suppressed-CBF conditions is significantly faster than that of OIS or tissue
FAI and OIS signals were measured in separate experiments using a longer stimulation period (15 s of forelimb stimulation at a frequency of 3 Hz). The FAI signal showed very fast temporal changes reaching 90% of peak amplitude within 1.5 s of stimulation onset and a rise time constant of 0.5 s for the onset portion of the response (Figure 9
, left panel). A sustained plateau period was observed in the FAI response followed by a decrease during and after the stimulation period. By contrast, the changes in blood oxygenation measured by OIS showed slower temporal changes, reaching 90% of the peak decrease in 5 s with a rise time constant of 1.9 s (Figure 9
, right panel). This method and the properties of the measured FAI responses are currently under investigation in our laboratory. To summarize, the temporal evolution of the activation-evoked changes in FAI under suppressed-CBF conditions is significantly faster than that of OIS or tissue  signals (Figure 7
), indicating that the changes in cellular oxidative metabolism are indeed rapid and take significantly longer to be reflected in the average oxygen tension of tissue and blood.
signals (Figure 7
), indicating that the changes in cellular oxidative metabolism are indeed rapid and take significantly longer to be reflected in the average oxygen tension of tissue and blood.
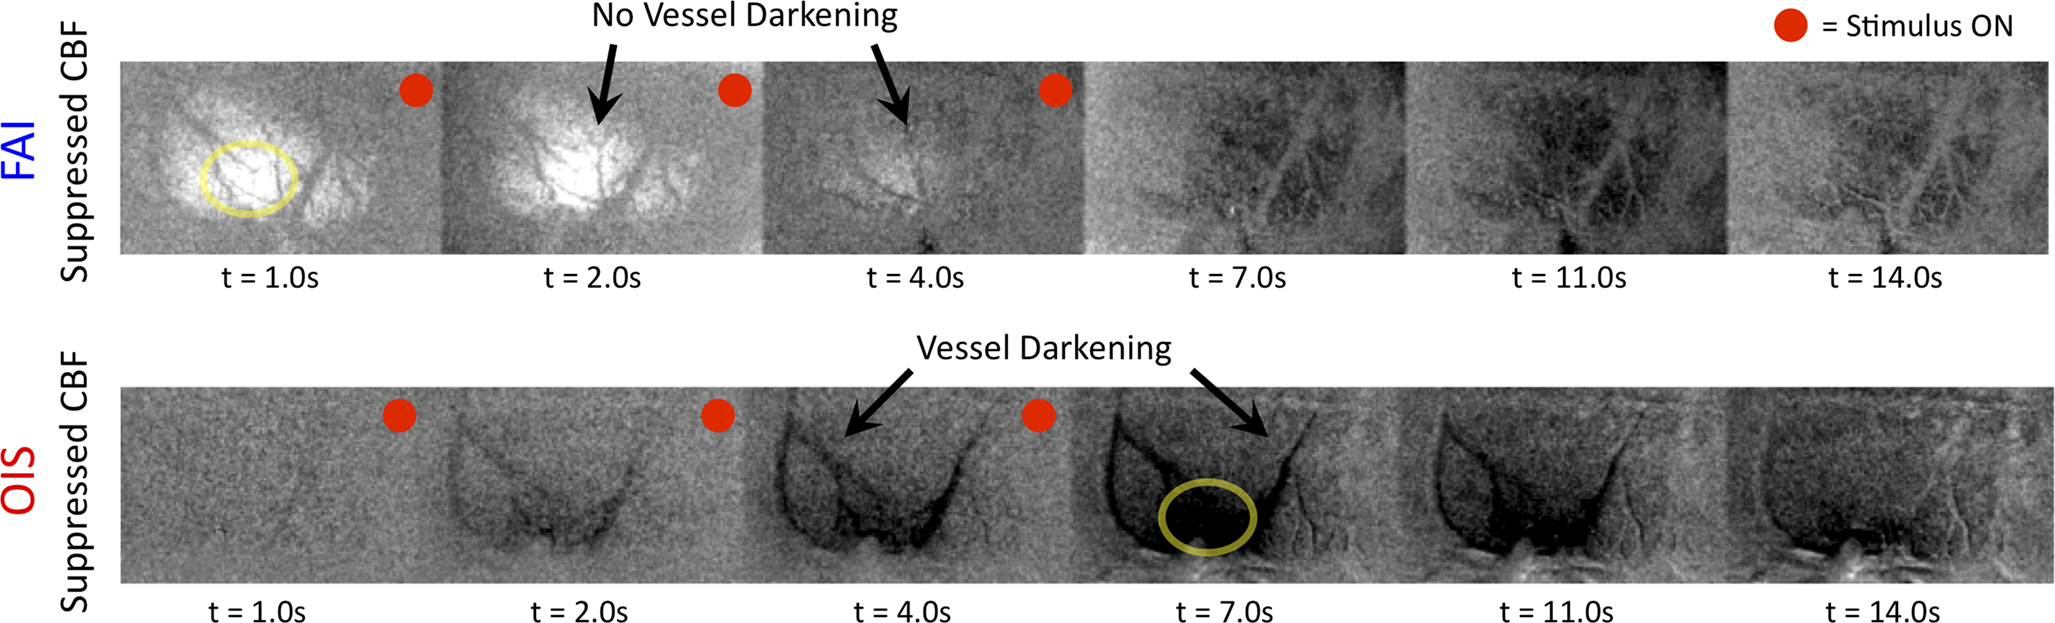
Figure 8. Average FAI and OIS image sequence during somato-sensory stimulation of the rat forelimb (electrical pulses delivered at a frequency of 12 Hz for 4 s) under suppressed-CBF conditions. Each frame shown consists of the average of 10 consecutive images (effective resolution of 1 s; the time of the last image averaged indicated under each image) that have been subtracted from an average pre-stimulation image. Frames with a red-dot on the top-right corner indicate frames acquired during stimulation.
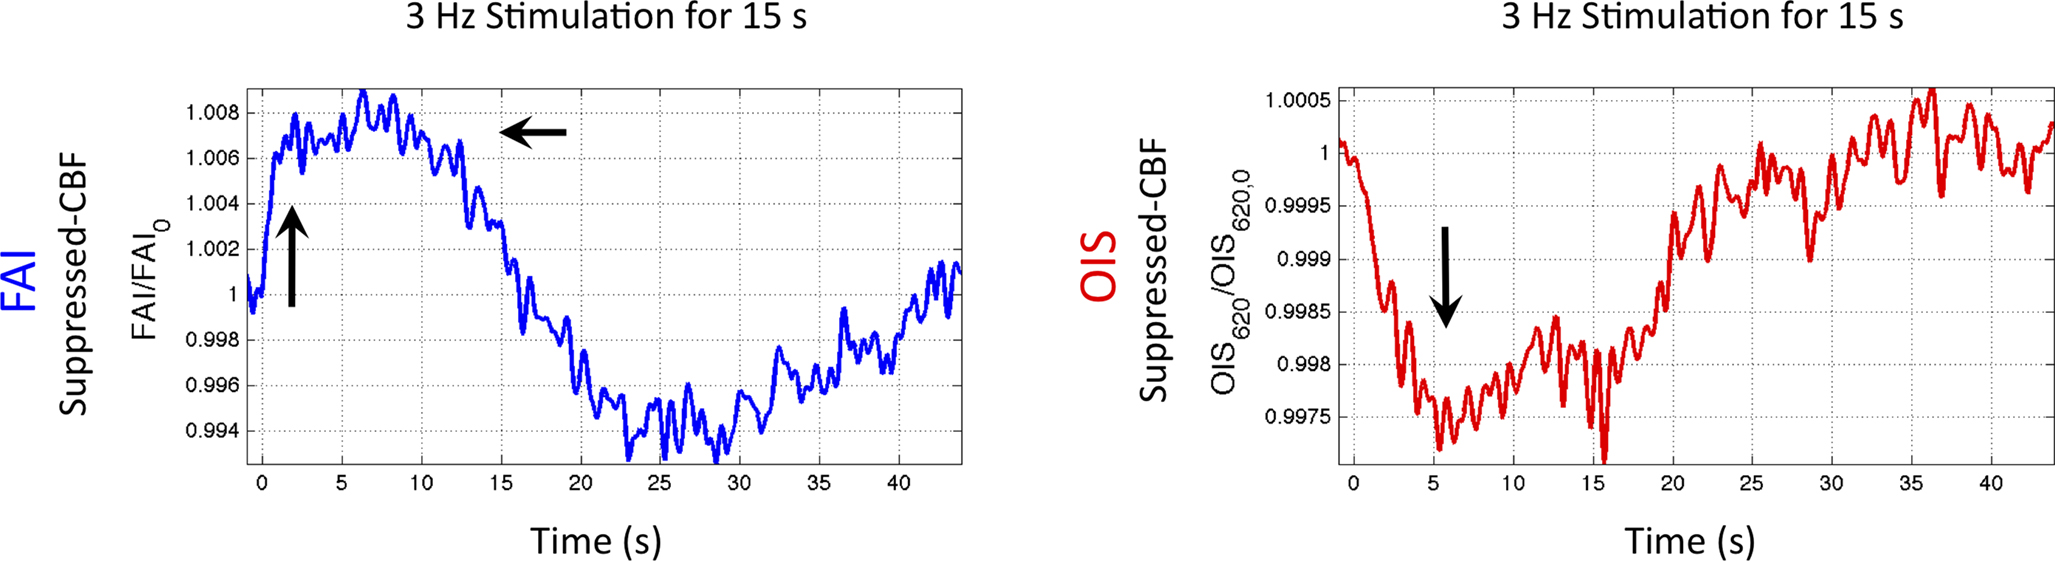
Figure 9. Changes in oxidative metabolism induced by somato-sensory stimulation (3 Hz for 15 s) as detected in tissue and blood oxygenation using FAI (left panel) and OIS (right panel), respectively. These time series were averaged over a ROI covering the forelimb area in one animal. The FAI signal reached 90% peak in less than 2 s, while OIS signal took about 5 s to reach 90% peak.
Concluding Remarks
Increases in neural activity evoke increases in both CBF and  These increases have been thought to reflect the metabolic demands of tissue. However, in terms of oxidative metabolism, the delivery of oxygen largely exceeds the consumption of oxygen in tissue. The delivery of oxygen is driven by the increases in CBF and its associated increases in CBV, but additional mechanisms are necessary to describe observations of tissue oxygen delivery. Arterial blood is highly saturated with oxygen and measurements of the vascular oxygen tension have shown that a relatively large amount of oxygen diffuses out of arteries prior to capillaries. This oxygen gradient along the arterial vasculature allows the mechanisms regulating CBF to also regulate the delivery of oxygen to sub-serving areas. In addition, neurally-evoked increases in CBF are also accompanied by increases in the arteriolar oxygen tension. This increase in arterial oxygenation contributes not only to the down-stream delivery of oxygen to tissue, but also to delivery of additional oxygen to extra-vascular spaces surrounding the arterioles. The supply of arterial oxygen to tissue has been hypothesized as necessary to homogenize the distribution of tissue oxygen. Nonetheless, other mechanisms beyond the increase in CBF and upstream oxygenation are necessary to fully describe the delivery of oxygen to tissue during evoked neural activity. While measurements of the tissue oxygen tension with increases in neural activity indicate that the role of CBF is not to maintain a constant average tissue oxygen tension, it is possible that the transient increases in tissue oxygen are necessary to maintain a minimum intra-cellular oxygen tension. Further study is necessary to determine the role of oxygen delivery to tissue with changes in neural activity, particularly in combination with the temporal dynamics of
The dynamics of tissue oxygen consumption have been difficult to measure because  and CBF modulate the oxygenation of tissue in opposite fashion. By suppressing the neurally-evoked CBF response, functional decreases in tissue oxygen tension elicited by increases in have been consistently observed.
  Moreover, the temporal evolution of the tissue
  changes are consistently slower than the neurally-evoked changes in CBF elicited by the same stimulus under normal conditions. Preliminary experiments performed using FAI indicate that cellular oxidative metabolism changes at a faster rate than the average changes in tissue and blood oxygenation. This may be due to the small volume occupied by mitochondria, but formal experiments are necessary to determine the relationship between cellular oxidative metabolism and blood oxygenation. Nonetheless, this method shows great promise at elucidating the functional properties and dynamics of
The findings described in this work have considerable implications for the quantification of the changes in  (and blood oxygen saturation) from hemoglobin-based imaging techniques like BOLD fMRI and deoxygenated hemoglobin-weighted OIS. The models used to calculate
  from blood oxygenation data typically assume that arterial blood is fully saturated with oxygen and that the delivery and consumption of oxygen is rapid such that changes in venous blood oxygen saturation reflect the changes in tissue oxygen consumption. In this review, experimental support is presented for arterial oxygen saturation levels that are high but not 100%, particularly at the level of intra-cortical arteries. It is our opinion that for typical fMRI studies, where voxel sizes span millimeters, an arterial oxygen saturation level near 100% is probably a reasonable assumption. However, for intra-cortical voxels in higher resolution studies (e.g., voxel sizes of hundreds of micrometers), the arterial oxygen saturation level has dropped significantly and the assumption of fully saturated arterial blood may introduce significant errors to the
  calculation. This can be potentially corrected if the input oxygen saturation is known. Notwithstanding, lower-resolution calibrated fMRI studies or ROI-wide analyses of calibrated fMRI data are not likely to be significantly impacted by this source of error. Another potential issue is that of blood volume changes. Traditionally, arterial blood was thought to be fully saturated with oxygen and does not contribute a BOLD signal change regardless of arterial blood volume changes, such that only changes in venous blood volume and saturation contribute to the BOLD signal (Buxton et al., 2004
; Davis et al., 1998
; Kim et al., 1999)
. There is a growing consensus that the changes in arterial volume are significantly larger than those of venous volume (which, like capillary blood volume, appear to be small) (Lee et al., 2001
; Kim et al., 2007
; Vazquez et al., 2010
). As a result, changes in arterial volume (and saturation) likely contribute a BOLD signal change. The impact and/or necessity of arterial BOLD signal contributions to traditional calibrated fMRI models needs to be investigated. Lastly, the temporal scale of the changes in cellular oxidative metabolism (as indicated by FAI) and blood oxygenation (as indicated by OIS and
calculation. This can be potentially corrected if the input oxygen saturation is known. Notwithstanding, lower-resolution calibrated fMRI studies or ROI-wide analyses of calibrated fMRI data are not likely to be significantly impacted by this source of error. Another potential issue is that of blood volume changes. Traditionally, arterial blood was thought to be fully saturated with oxygen and does not contribute a BOLD signal change regardless of arterial blood volume changes, such that only changes in venous blood volume and saturation contribute to the BOLD signal (Buxton et al., 2004
; Davis et al., 1998
; Kim et al., 1999)
. There is a growing consensus that the changes in arterial volume are significantly larger than those of venous volume (which, like capillary blood volume, appear to be small) (Lee et al., 2001
; Kim et al., 2007
; Vazquez et al., 2010
). As a result, changes in arterial volume (and saturation) likely contribute a BOLD signal change. The impact and/or necessity of arterial BOLD signal contributions to traditional calibrated fMRI models needs to be investigated. Lastly, the temporal scale of the changes in cellular oxidative metabolism (as indicated by FAI) and blood oxygenation (as indicated by OIS and  ) is significantly different, even though the temporal changes between tissue
  and blood oxygenation are closer. These findings suggest that calculated
  values using traditional calibrated fMRI models over transition regions are largely underestimated with respect to cellular oxidative metabolism, but to a lesser extent with respect to the average oxygenation of tissue. At least several models have been published that incorporate an arterial compartment and non-steady
  dynamics (Zheng et al., 2005
; Huppert et al., 2007
; Uludag et al., 2009
). The error introduced by these assumptions needs to be evaluated to determine appropriate models that can accurately quantify the changes in tissue
dynamics (Zheng et al., 2005
; Huppert et al., 2007
; Uludag et al., 2009
). The error introduced by these assumptions needs to be evaluated to determine appropriate models that can accurately quantify the changes in tissue 
Materials and Methods
The experimental methods for the vascular  measurements are reported in Vazquez et al. (2010)
, and those of the tissue
measurements are reported in Vazquez et al. (2010)
, and those of the tissue  measurements recorded under control and suppressed-CBF conditions are reported in Masamoto et al. (2008) and Vazquez et al. (2008)
. Only new, previously unreported studies are described in this section. Five male Sprague-Dawley rats were used in this work (n = 2 for the tissue
measurements recorded under control and suppressed-CBF conditions are reported in Masamoto et al. (2008) and Vazquez et al. (2008)
. Only new, previously unreported studies are described in this section. Five male Sprague-Dawley rats were used in this work (n = 2 for the tissue  depth experiments and n = 3 for the FAI experiments) following an experimental protocol approved by the University of Pittsburgh Institutional Animal Care and Use Committee. The experimental procedure used was similar to our previous studies (Masamoto et al., 2008
; Vazquez et al., 2010
). Briefly, the animals were initially anesthetized using isoflurane (5% for induction, 2% for surgery), nitrous oxide (50–65%) and oxygen (35–50%) for intubation and placement of catheters in the femoral artery and femoral vein. The respiration rate and volume were controlled using a ventilator. After intubation, the animals were placed in a stereotaxic frame and the skull was exposed over the somato-sensory area. A well was made using dental acrylic surrounding an area 5 mm × 7 mm on the left side of the skull, centered 3.5 mm lateral and 1.5 mm rostral from Bregma. The skull in this area was then removed using a dental drill. The dura matter was resected and the CSF fluid was released around the fourth ventricle area to minimize herniation. The well and the CSF release areas were then filled with 1.0% agarose gel at body temperature
1
. Two needle electrodes were placed in the right forepaw between digits 2 and 4 for electrical stimulation. The anesthesia and breathing mixture were then changed to isoflurane (1.2–1.4%), oxygen (∼10%) and air (∼90%) for experimental recording. Rectal temperature was maintained at 37°C throughout with a DC temperature control module. The arterial blood pressure, respiration rate, heart rate, rectal temperature, end-tidal CO2 tension and isoflurane level were monitored and recorded using a polygraph data acquisition software.
depth experiments and n = 3 for the FAI experiments) following an experimental protocol approved by the University of Pittsburgh Institutional Animal Care and Use Committee. The experimental procedure used was similar to our previous studies (Masamoto et al., 2008
; Vazquez et al., 2010
). Briefly, the animals were initially anesthetized using isoflurane (5% for induction, 2% for surgery), nitrous oxide (50–65%) and oxygen (35–50%) for intubation and placement of catheters in the femoral artery and femoral vein. The respiration rate and volume were controlled using a ventilator. After intubation, the animals were placed in a stereotaxic frame and the skull was exposed over the somato-sensory area. A well was made using dental acrylic surrounding an area 5 mm × 7 mm on the left side of the skull, centered 3.5 mm lateral and 1.5 mm rostral from Bregma. The skull in this area was then removed using a dental drill. The dura matter was resected and the CSF fluid was released around the fourth ventricle area to minimize herniation. The well and the CSF release areas were then filled with 1.0% agarose gel at body temperature
1
. Two needle electrodes were placed in the right forepaw between digits 2 and 4 for electrical stimulation. The anesthesia and breathing mixture were then changed to isoflurane (1.2–1.4%), oxygen (∼10%) and air (∼90%) for experimental recording. Rectal temperature was maintained at 37°C throughout with a DC temperature control module. The arterial blood pressure, respiration rate, heart rate, rectal temperature, end-tidal CO2 tension and isoflurane level were monitored and recorded using a polygraph data acquisition software.
Tissue  Depth Experiments
An optical imaging experiment (620 ± 5 nm transmitted light) was initially performed to map the somato-sensory area for  microelectrode placement (Vazquez et al., 2010
). Tissue
microelectrode placement (Vazquez et al., 2010
). Tissue  measurements were performed using an oxygen microelectrode (APOX, Unisense, Aarhaus, Denmark) with tip diameter of 30 µm. The oxygen microelectrode was penetrated as close as possible to the activation focus location to a depth of 300 µm perpendicular to the cortical surface using a micromanipulator. A LDF probe (Perimed, Stockholm, Sweden) was placed over the cortical surface covering the tissue
  probe location. The changes in tissue
  and LDF were recorded during somato-sensory stimulation (1 ms pulses at 1.5 mA for 3 s at a frequency of 6 Hz repeated every 35 s, 10 times) at this depth (300 µm) and also at the cortical surface (0 µm). The oxygen microelectrode was calibrated before and after each experiment with 0%, 21%, and 100% oxygen in saline solution at 37°C. In addition, the stability of the current reading was checked before and after each experiment to ensure reliable measurements.
FAI and OIS Experiments
Flavoprotein autofluorescence images were acquired over a 5.5 × 4.1 mm2 area using an epi-fluorescence macroscope (MVX-10, Olympus, Tokyo, Japan) and a digital cooled-CCD camera (CoolSnap HQ2, Photometrics, Princeton, NJ, USA) during somato-sensory stimulation of the rat forelimb. A mercury lamp light source coupled to a low-noise power supply (Opti-quip, Inc.) was used. The transmitted light was filtered between 450 and 490 nm while the camera recorded the fluorescence emission between 500 and 550 nm at 10 frames per second. Images were acquired under suppressed-CBF conditions, which required the intra-venous infusion of sNP (2 mg/kg in saline) (Masamoto et al., 2008 ). The infusion rate of the sNP was adjusted to maintain a mean arterial blood pressure between 40 and 45 mmHg over the course of the stimulation experiment. Two different forelimb stimulation experiments were performed: (1) 1 ms, 1.5 mA pulses at a frequency of 12 Hz for 4 s every 16 s repeated 10 times; (2) 1 ms, 1.5 mA pulses every 3 Hz for 15 s every 45 s repeated eight times. The infusion of the agent was terminated after approximately 30 min. FAI experiments were followed by optical imaging OIS experiments. Oblique light guides transmitting filtered red light (620 nm) were used for illumination and a matching barrier filter was placed prior to the camera. Prior to averaging, a ROI was outlined over the skull or dental acrylic to regress out unwanted fluctuations stemming from fluctuations in the light source from all the acquired images. The data from all the trials in an experiment were then averaged and a ROI time series were generated. The activation area ROI was obtained by thresholding a difference image obtained by averaging the images 2 s prior to stimulation onset and the two images obtained 2 s immediately after stimulation onset.
Conflict of Interest Statement
The authors declare that the research was conducted in the absence of any commercial or financial relationships that could be construed as a potential conflict of interest.
Acknowledgments
This work was supported by NIH grants F32-NS056682 and RO1-EB003375. The authors would like to thank Dr. Kenneth Reinert and Dr. Timothy Ebner for their help in the implementation of flavoprotein autofluoresncence imaging in our laboratory and Dr. Ping Wang and Ms. Michelle Tasker for their assistance in experimental data collection.
Footnote
- ^ This preparation opens the possibility of oxygen in room air being supplied through the craniotomy. In our experiments, we observed while placing the PO2 probes that the PO2 gradient would settle close to the pial surface PO2 level a few hundred micrometers over the cortical surface. In addition, in placing the PO2 probes over the superior surface of arteries, the PO2 reading would increase prior to the probe reaching an artery. These observations indicated that a significant amount of oxygen is not likely supplied through the craniotomy.
References
Ances, B. M., Buerk, D. G., Greenberg, J. H., and Detre, J. A. (2001). Temporal dynamics of the partial pressure of brain tissue oxygen during functional forepaw stimulation in rats. Neurosci. Lett. 306, 106–110.
Ances, B. M., Wilson, D. F., Greenberg, J. H., and Detre, J. A. (2001). Dynamic changes in cerebral blood flow, O2 tension, and calculated cerebral metabolic rate of O2 during functional activation using oxygen phosphorescence quenching. J. Cereb. Blood Flow Metab. 21, 511–516.
Berwick, J., Johnston, D., Jones, M., Martindale, J., Redgrave, P., and McLoughlin, N., Schiessl, I., and Mayhew, J. E. (2005). Neurovascular coupling investigated with two- dimensional optical imaging spectroscopy in rat whisker barrel cortex. Eur. J. Neurosci. 22, 1655–1666.
Boas, D. A., Jones, S. R., Devor, A., Huppert, T. J., and Dale, A. M. (2008). A vascular anatomical network model of the spatio-temporal response to brain activation. Neuroimage 40, 1116–1129.
Boas, D. A., Strangman, G., Culver, J. P., Hoge, R. D., Jasdzewski, G., and Poldrack, R. A., Rosen, B. R., and Mandeville, J. B. (2003). Can the cerebral metabolic rate of oxygen be estimated with near-infrared spectroscopy? Phys. Med. Biol. 48, 2405–2418.
Burton, A. C. (1954). Relation of structure to function of the tissues of the wall of blood vessels. Physiol. Rev. 34, 619–642.
Buxton, R. B., and Frank, L. R. (1997). A model for the coupling between cerebral blood flow and oxygen metabolism during neural stimulation. J. Cereb. Blood Flow Metab. 17, 64–72.
Buxton, R. B., Uludag, K., Dubowitz, D. J., and Liu, T. T. (2004). Modeling the hemodynamic response to brain activation. Neuroimage 23(Suppl. 1), S220–S233.
Chance, B., Cohen, P., Jobsis, F., and Schoener, B. (1962). Intracellular oxidation-reduction states in vivo. Science 137, 499–508.
Chance, B., Legallais, V., and Schoener, B. (1962). Metabolically linked changes in fluorescence emission spectra of cortex of rat brain, kidney and adrenal gland. Nature 195, 1073–1075.
Chance, B., Schoener, B., Oshino, R., Itshak, F., and Nakase, Y. (1979). Oxidation-reduction ratio studies of mitochondria in freeze-trapped samples. NADH and flavoprotein fluorescence signals. J. Biol. Chem. 254, 4764–4771.
Chen, X., Jaron, D., Barbee, K. A., and Buerk, D. G. (2006). The influence of radial RBC distribution, blood velocity profiles, and glycocalyx on coupled NO/O2 transport. J. Appl. Physiol. 100, 482–492.
Davis, T. L., Kwong, K. K., Weisskoff, R. M., and Rosen, B. R. (1998). Calibrated functional MRI: mapping the dynamics of oxidative metabolism. Proc. Natl. Acad. Sci. U.S.A. 95, 1834–1839.
Duling, B. R., and Berne, R. M. (1970). Longitudinal gradients in periarteriolar oxygen tension. A possible mechanism for the participation of oxygen in local regulation of blood flow. Circ. Res. 27, 669–678.
Duling, B. R., Kuschinsky, W., and Wahl, M. (1979). Measurements of the perivascular in the vicinity of the pial vessels of the cat. Pflugers Arch, 383, 29–34.
Fatt, I. (1976). The Polarographic Oxygen Sensor: Its Theory of Operation and Its Application in Biology, Medicine, and Technology. Cleveland, OH: CRC Press.
Fiat, D., Dolinsek, J., Hankiewicz, J., Dujovny, M., and Ausman, J. (1993). Determination of regional cerebral oxygen consumption in the human: 17O natural abundance cerebral magnetic resonance imaging and spectroscopy in a whole body system. Neurol. Res. 15, 237–248.
Fox, P. T., Raichle, M. E., Mintun, M. A., and Dence, C. (1988). Nonoxidative glucose consumption during focal physiologic neural activity. Science 241, 462–464.
Fukuda, M., Wang, P., Moon, C. H., Tanifuji, M., and Kim, S. G. (2006). Spatial specificity of the enhanced dip inherently induced by prolonged oxygen consumption in cat visual cortex: implication for columnar resolution functional MRI. Neuroimage 30, 70–87.
Garland, P. B., Chance, B., Ernster, L., Lee, C. P., and Wong, D. (1967). Flavoproteins of mitochondrial fatty acid oxidation. Proc. Natl. Acad. Sci. U.S.A. 58, 1696–1702.
Gibson, Q. H., Kreuzer, F., Meda, E., and Roughton, F. J. (1955). The kinetics of human haemoglobin in solution and in the red cell at 37 degrees C. J. Physiol. (Lond.) 129, 65–89.
Gray, L. H., and Steadman, J. M. (1964). Determination of the oxyhaemoglobin dissociation curves for mouse and rat blood. J. Physiol. 175, 161–171.
Hassinen, I., and Chance, B. (1968). Oxidation–reduction properties of the mitochondrial flavoprotein chain. Biochem. Biophys. Res. Commun. 31, 895–900.
Herscovitch, P., Mintun, M. A., and Raichle, M. E. (1985). Brain oxygen utilization measured with oxygen-15 radiotracers and positron emission tomography: generation of metabolic images. J. Nucl. Med. 26, 416–417.
Hillman, E. M., Devor, A., Bouchard, M. B., Dunn, A. K., Krauss, G. W., and Skoch, J., Bacskai, B. J., Dale, A. M., and Boas, D. A. (2007). Depth-resolved optical imaging and microscopy of vascular compartment dynamics during somatosensory stimulation. Neuroimage 35, 89–104.
Huang, S., Heikal, A. A., and Webb, W. W. (2002). Two-photon fluorescence spectroscopy and microscopy of NAD(P)H and flavoprotein. Biophys. J. 82, 2811–2825.
Huppert, T. J., Allen, M. S., Benav, H., Jones, P. B., and Boas, D. A. (2007). A multicompartment vascular model for inferring baseline and functional changes in cerebral oxygen metabolism and arterial dilation. J. Cereb. Blood Flow Metab. 27, 1262–1279.
Husson, T. R., Mallik, A. K., Zhang, J. X., and Issa, N. P. (2007). Functional imaging of primary visual cortex using flavoprotein autofluorescence. J. Neurosci. 27, 8665–8675.
Hyder, F., Shulman, R. G., and Rothman, D. L. (1998). A model for the regulation of cerebral oxygen delivery. J. Appl. Physiol. 85, 554–564.
Hyder, F., Kida, I., Behar, K. L., Kennan, R. P., Maciejewski, P. K., and Rothman, D. L. (2001). Quantitative functional imaging of the brain: towards mapping neuronal activity by BOLD fMRI. NMR. Biomed. 14, 413–431.
Ivanov, K. P., Sokolova, I. B., and Vovenko, E. P. (1999). Oxygen transport in the rat brain cortex at normobaric hyperoxia. Eur. J. Appl. Physiol. Occup. Physiol. 80, 582–587.
Jensen, F. B. (2004). Red blood cell pH, the Bohr effect, and other oxygenation-linked phenomena in blood O2 and CO2 transport. Acta Physiol. Scand. 182, 215–227.
Kasischke, K. A., Vishwasrao, H. D., Fisher, P. J., Zipfel, W. R., and Webb, W. W. (2004). Neural activity triggers neuronal oxidative metabolism followed by astrocytic glycolysis. Science 305, 99–103.
Kim, S. G., Rostrup, E., Larsson, H. B., Ogawa, S., and Paulson, O. B. (1999). Determination of relative from CBF and BOLD changes: significant increase of oxygen consumption rate during visual stimulation. Magn. Reson. Med. 41, 1152–1161.
Kim, T., Hendrich, K. S., Masamoto, K., and Kim, S. G. (2007). Arterial versus total blood volume changes during neural activity-induced cerebral blood flow change: implication for BOLD fMRI. J. Cereb. Blood Flow Metab. 27, 1235–1247.
Lamkin-Kennard, K. A., Jaron, D., and Buerk, D. G. (2004). Impact of the Fahraeus effect on NO and O2 biotransport: a computer model. Microcirculation 11, 337–349.
Lauritzen, M. (2001). Relationship of spikes, synaptic activity, and local changes of cerebral blood flow. J. Cereb. Blood Flow Metab. 21, 1367–1383.
Lee, S. P., Duong, T. Q., Yang, G., Iadecola, C., and Kim, S. G. (2001). Relative changes of cerebral arterial and venous blood volumes during increased cerebral blood flow: implications for BOLD fMRI. Magn. Reson. Med. 45, 791–800.
Masamoto, K., Fukuda, M., Vazquez, A., and Kim, S. G. (2009). Dose-dependent effect of isoflurane on neurovascular coupling in rat cerebral cortex. Eur. J. Neurosci. 30, 242–250.
Masamoto, K., Kurachi, T., Takizawa, N., Kobayashi, H., and Tanishita, K. (2004). Successive depth variations in microvascular distribution of rat somatosensory cortex. Brain Res. 995, 66–75.
Masamoto, K., Omura, T., Takizawa, N., Kobayashi, H., Katura, T., and Maki, A., Kawaguchi, H., and Tanishita, K. (2003). Biphasic changes in tissue partial pressure of oxygen closely related to localized neural activity in guinea pig auditory cortex. J. Cereb. Blood Flow Metab. 23, 1075–1084.
Masamoto, K., Vazquez, A., Wang, P., and Kim, S. G. (2008). Trial-by-trial relationship between neural activity, oxygen consumption, and blood flow responses. Neuroimage 40, 442–450.
Mayhew, J., Johnston, D., Berwick, J., Jones, M., Coffey, P., and Zheng, Y. (2000). Spectroscopic analysis of neural activity in brain: increased oxygen consumption following activation of barrel cortex. Neuroimage 12, 664–675.
Moon, C. H., Fukuda, M., Park, S. H., and Kim, S. G. (2007). Neural interpretation of blood oxygenation level- dependent fMRI maps at submillimeter columnar resolution. J. Neurosci. 27, 6892–6902.
Nagaoka, T., Zhao, F., Wang, P., Harel, N., Kennan, R. P., and Ogawa, S., Kim, S. G. (2006). Increases in oxygen consumption without cerebral blood volume change during visual stimulation under hypotension condition. J. Cereb. Blood Flow Metab. 26, 1043–1051.
Reinert, K. C., Dunbar, R. L., Gao, W., Chen, G., and Ebner, T. J. (2004). Flavoprotein autofluorescence imaging of neuronal activation in the cerebellar cortex in vivo. J. Neurophysiol. 92, 199–211.
Rothman, D. L., Behar, K. L., Hyder, F., and Shulman, R. G. (2003). In vivo NMR studies of the glutamate neurotransmitter flux and neuroenergetics: implications for brain function. Annu. Rev. Physiol. 65, 401–427.
Severinghaus, J. W. (1979). Simple, accurate equations for human blood O2 dissociation computations. J. Appl. Physiol. 46, 599–602.
Sharan, M., Vovenko, E. P., Vadapalli, A., Popel, A. S., and Pittman, R. N. (2008). Experimental and theoretical studies of oxygen gradients in rat pial microvessels. J. Cereb. Blood Flow Metab. 28, 1597–1604.
Shibuki, K., Hishida, R., Murakami, H., Kudoh, M., Kawaguchi, T., and Watanabe, M., Watanabe, S., Kouuchi, T., and Tanaka, R. (2003). Dynamic imaging of somatosensory cortical activity in the rat visualized by flavoprotein autofluorescence. J. Physiol. (Lond.) 549(Pt 3), 919–927.
Shulman, R. G., Hyder, F., and Rothman, D. L. (2001). Lactate efflux and the neuroenergetic basis of brain function. NMR Biomed. 14, 389–396.
Shuttleworth, C. W., Brennan, A. M., and Connor, J. A. (2003). NAD(P)H fluorescence imaging of postsynaptic neuronal activation in murine hippocampal slices. J. Neurosci. 23, 3196–3208.
Skala, M. C., Riching, K. M., Gendron-Fitzpatrick, A., Eickhoff, J., Eliceiri, K. W., White, J. G., and Ramanujam, N. (2007). In vivo multiphoton microscopy of NADH and FAD redox states, fluorescence lifetimes, and cellular morphology in precancerous epithelia. Proc. Natl. Acad. Sci. U.S.A. 104, 19494–19499.
Thompson, J. K., Peterson, M. R., and Freeman, R. D. (2003). Single-neuron activity and tissue oxygenation in the cerebral cortex. Science 299, 1070–1072.
Tsai, A. G., Johnson, P. C., and Intaglietta, M. (2003). Oxygen gradients in the microcirculation. Physiol. Rev. 83, 933–963.
Uludag, K., Dubowitz, D. J., Yoder, E. J., Restom, K., Liu, T. T., and Buxton, R. B. (2004). Coupling of cerebral blood flow and oxygen consumption during physiological activation and deactivation measured with fMRI. Neuroimage 23, 148–155.
Uludag, K., Muller-Bierl, B., and Ugurbil, K. (2009). An integrative model for neuronal activity-induced signal changes for gradient and spin echo functional imaging. Neuroimage 48, 150–165.
Valabregue, R., Aubert, A., Burger, J., Bittoun, J., and Costalat, R. (2003). Relation between cerebral blood flow and metabolism explained by a model of oxygen exchange. J. Cereb. Blood Flow Metab. 23, 536–545.
Vanzetta, I., Hildesheim, R., and Grinvald, A. (2005). Compartment-resolved imaging of activity-dependent dynamics of cortical blood volume and oximetry. J. Neurosci. 25, 2233–2244.
Vazquez, A. L., Fukuda, M., Tasker, M. L., Masamoto, K., and Kim, S. G. (2010). Changes in cerebral arterial, tissue and venous oxygenation with evoked neural stimulation: implications for hemoglobin-based functional neuroimaging. J. Cereb. Blood Flow Metab. 30, 428–439.
Vazquez, A. L., Masamoto, K., and Kim, S. G. (2008). Dynamics of oxygen delivery and consumption during evoked neural stimulation using a compartment model and CBF and tissue P(O2) measurements. Neuroimage 42, 49–59.
Vovenko, E. (1999). Distribution of oxygen tension on the surface of arterioles, capillaries and venules of brain cortex and in tissue in normoxia: an experimental study on rats. Pflugers Arch. 437, 617–623.
Yaseen, M. A., Srinivasan, V. J., Sakadzic, S., Wu, W., Ruvinskaya, S., and Vinogradov, S. A., and Boas, D. A. (2009). Optical monitoring of oxygen tension in cortical microvessels with confocal microscopy. Opt. Express 17, 22341–22350.
Zheng, Y., Johnston, D., Berwick, J., Chen, D., Billings, S., and Mayhew, J. (2005). A three-compartment model of the hemodynamic response and oxygen delivery to brain. Neuroimage 28, 925–939.
Keywords:
 oxygen, hemoglobin, CBF,
  , flavoprotein, fMRI
Citation: Vazquez AL, Masamoto K, Fukuda M and Kim S-G (2010) Cerebral oxygen delivery and consumption during evoked neural activity. Front. Neuroenerg. 2:11. doi: 10.3389/fnene.2010.00011
Received: 01 March 2010;
Paper pending published: 05 April 2010;
Accepted: 26 May 2010;
Published online: 18 June 2010
Edited by:
David Boas, Massachusetts General Hospital, USA; Massachusetts Institute of Technology, USA; Harvard Medical School, USAReviewed by:
Fahmeed Hyder, Yale University, USAAbbas Yaseen, Harvard University, USA
Copyright: © 2010 Vazquez, Masamoto, Fukuda and Kim. This is an open-access article subject to an exclusive license agreement between the authors and the Frontiers Research Foundation, which permits unrestricted use, distribution, and reproduction in any medium, provided the original authors and source are credited.
*Correspondence: Alberto L. Vazquez, 3025 E Carson St, McGowan Institute Room 159 BIRC, Pittsburgh, PA 15203, USA. e-mail: alv15@pitt.edu