High-resolution optical functional mapping of the human somatosensory cortex
- 1 Berlin NeuroImaging Center, Charité Universitätsmedizin Berlin, Berlin, Germany
- 2 Max Planck Institute for Human Cognitive and Brain Sciences, Leipzig, Germany
- 3 NIRx Medizintechnik GmbH, Berlin, Germany
- 4 Day Care Clinic for Cognitive Neurology, University Hospital Leipzig, Leipzig, Germany
- 5 Berlin School of Mind and Brain, Humboldt University Berlin, Germany
- 6 Center for Stroke Research Berlin, Universitätsmedizin Berlin, Germany
Non-invasive optical imaging of brain function has been promoted in a number of fields in which functional magnetic resonance imaging (fMRI) is limited due to constraints induced by the scanning environment. Beyond physiological and psychological research, bedside monitoring and neurorehabilitation may be relevant clinical applications that are yet little explored. A major obstacle to advocate the tool in clinical research is insufficient spatial resolution. Based on a multi-distance high-density optical imaging setup, we here demonstrate a dramatic increase in sensitivity of the method. We show that optical imaging allows for the differentiation between activations of single finger representations in the primary somatosensory cortex (SI). Methodologically our findings confirm results in a pioneering study by Zeff et al. (2007) and extend them to the homuncular organization of SI. After performing a motor task, eight subjects underwent vibrotactile stimulation of the little finger and the thumb. We used a high-density diffuse-optical sensing array in conjunction with optical tomographic reconstruction. Optical imaging disclosed three discrete activation foci one for motor and two discrete foci for vibrotactile stimulation of the first and fifth finger, respectively. The results were co-registered to the individual anatomical brain anatomy (MRI) which confirmed the localization in the expected cortical gyri in four subjects. This advance in spatial resolution opens new perspectives to apply optical imaging in the research on plasticity notably in patients undergoing neurorehabilitation.
Introduction
Imaging techniques such as BOLD-contrast magnetic resonance imaging (fMRI) and positron emission tomography (PET) offer the possibility to assess brain activity on the basis of the vascular–metabolic response and localize such activation with a resolution of millimeters. Optical imaging (OI) has been successfully advocated to also non-invasively assess changes in cortical hemodynamics in response to functional stimulation. The methodology is especially suited for experimental designs in which the constraints of an MR-scanner environment limit performance of a specific task or are not suited for the specific group of subjects. This applies to infants but also to patients, who may need continuous monitoring or direct interaction with the examiner to be motivated to perform a task. Furthermore, the low methodological constraints render OI an ideal tool for some tasks, for instance when complex motor tasks or straight posture are required (Miyai et al., 2001 ). Not least the advantages enable long-term measurements as, e.g., in sleep (Olopade et al., 2007 ) or applications in field research (Grocott et al., 2007 ). Beyond that, optical imaging operates interference-free with other modalities, therefore a simultaneous approach, with electrophysiological techniques such as electroencephalography (EEG) and magnetoencephalography (MEG) is easily feasible and allows investigating neurovascular coupling. In sum, its non-invasiveness requiring no exposure to radiation, magnetic fields or contrast agents and device portability allow a flexible handling in a clinical diagnostic, prognostic, and rehabilitative environment (Miyai et al., 2001 ).
One major methodological shortcoming of OI is spatial resolution. Typically in the range of few centimeters, topographical assignment of the activations is hampered by a sparse spatial sampling over the scalp. In the most commonly used next-neighbor approach, the individual measurement channels are defined by a pair of light-emitting and light-detecting probe separated by an inter-optode distance (IOD) of 2–4 cm. These discrete measurement points are then interpolated into a topographic map of functional activation, which is superimposed onto the brain area covered by the probe array. To enhance the spatial resolution a multi-distance approach using several sources and detectors has been proposed. Since light attenuation of multiple neighbors with different IODs is assessed, this approach yields measurements of overlapping photon paths with different sampled target depths (Barbour et al., 2001 ; Boas et al., 2004 ). The differential sensitivity of the volumes interrogated by light, leads to a rough depth discrimination and facilitates the separation of signals from superficial and deeper layers. Thus sensitivity to the cerebro-cortical signal is augmented. Also such an approach enhances lateral resolution. A pioneering study (Zeff et al., 2007 ) recently demonstrated the feasibility of retinotopic mapping of the primary visual cortex, based on eccentricity and angular stimulation (see also White and Culver, 2010 ). The study proves that state-of-the-art technology and advanced analytical tools enhance spatial resolution dramatically in non-invasive optical imaging, opening an entirely new perspective for the application in basic and clinical research.
Here, we extend the use of high-density optical imaging to another sensory system and test whether this technique is sensitive enough to functionally map the somatotopic organization of the somatosensory cortex. The somatosensory system consists of two major cortical representations, the primary (SI) and the secondary somatosensory cortex (SII), both of which have been shown to be somatotopically organized. While SII is located in the deeper part of the inferior parietal cortex, which is not accessible to non-invasive optical techniques, the SI hand area can be regarded an ideal candidate for optical imaging access, due to its superficial location at the posterior wall of the central sulcus. The idea of somatotopy has long been established. Based on the observation that motor convulsion or dysesthesia ‘march’ along typical routes over the body in some simple focal epileptic seizures and that these ‘routes’ are highly reproducible within and between patients, Jackson postulated a somatotopic organization of the somatosensory and motor cortex already in the 19th century (Jackson, 1863 ). In 1931, cortical somatotopic organization was first experimentally proven in humans by applying electrical stimulation to precentral and postcentral cortices (Foerster, 1931 ). Finally, the term “somatotopy” was introduced by Penfield (Penfield and Boldrey, 1937 ). With respect to somatosensation, he applied electrical stimulation to the surface of the postcentral gyrus in patients undergoing brain surgery. Based on the patients’ reports of thereby elicited sensations, the idea of the sensory homunculus was established (Penfield and Boldrey, 1937 ; Penfield and Rasmussen, 1950 ). The gross anatomy (head, arm, trunk, and leg) is clearly differentially represented by areas of contralateral sensory (SI) and primary motor (M1) cortices. The representations follow a latero-medial sequence along the precentral and postcentral gyri, respectively. The representational organization within the hand sub-division is more complex and still partly controversial. In SI a basic somatotopic arrangement was found using MEG (Baumgartner et al., 1991 ; Hari et al., 1993 ; Nakamura et al., 1998 ), EEG (Buchner et al., 1995 ) and fMRI studies differing in type of stimulation, number of fingers stimulated and spatial resolution (Sakai et al., 1995 ; Wolf et al., 1996 ; Gelnar et al., 1998 ; Kurth et al., 1998 ; Stippich et al., 1999 ; Francis et al., 2000 ; Nelson and Chen, 2008 ; Schweizer et al., 2008 ; Weibull et al., 2008 ). The few studies covering the entire SI finger area at a high spatial resolution found a map similar to that described by Penfield. The thumb is represented in the most lateral, anterior, and inferior position, followed by the other fingers ordered along the central sulcus in a superior to medial direction (Maldjian et al., 1999 ; Kurth et al., 2000 ; van Westen et al., 2004 ; Schweizer et al., 2008 ).
Since somatosensory stimulation and training of motor skills may substantially alter the extent and the more fine-grained somatotopy of the homunculus, the investigation into training or rehabilitation induced changes would profit from an undemanding assessment, available in a clinical setting. In the current study we therefore addressed the question whether high-density diffuse-optical imaging of the sensory SI hand areal is spatially sensitive enough to somatotopically differentiate and map the representations of thumb (first) and little (fifth) finger to vibrotactile stimulation.
Materials and Methods
Subjects
Eight right-handed volunteers (mean age 31.3 ± 4.5 years, three females) without any history of neurological or psychiatric disorders were investigated. The study was approved by the local ethics committee at Charité University Hospital Berlin and written consent was obtained from each subject prior to investigation.
Stimuli and Procedure
Participants were seated in an EEG chair in a sound-attenuated, dimly lit room. Somatosensory stimulation was elicited by vibrotactile stimuli applied by rotating brushes (10 mm diameter surface) mounted into a glove at the position of the tips of the first and fifth finger. The timing of brushes was controlled by Cogent (Wellcome Department of Imaging Neuroscience, London, UK), a stimulus toolbox that runs in the Matlab environment (The Mathworks, Natick, MA, USA). During the experiment each subject received 24 runs of a 5-s vibrotactile stimulus on either the first or fifth finger of the left hand (Figure 1 D). The application of the tactile stimuli was temporally jittered (mean SOA 20 s, range 16–24 s) and appeared in a pseudo-randomized sequence to avoid stimulus expectation and to optimize the data for an analysis based on the sluggish vascular response (Birn et al., 2002 ).
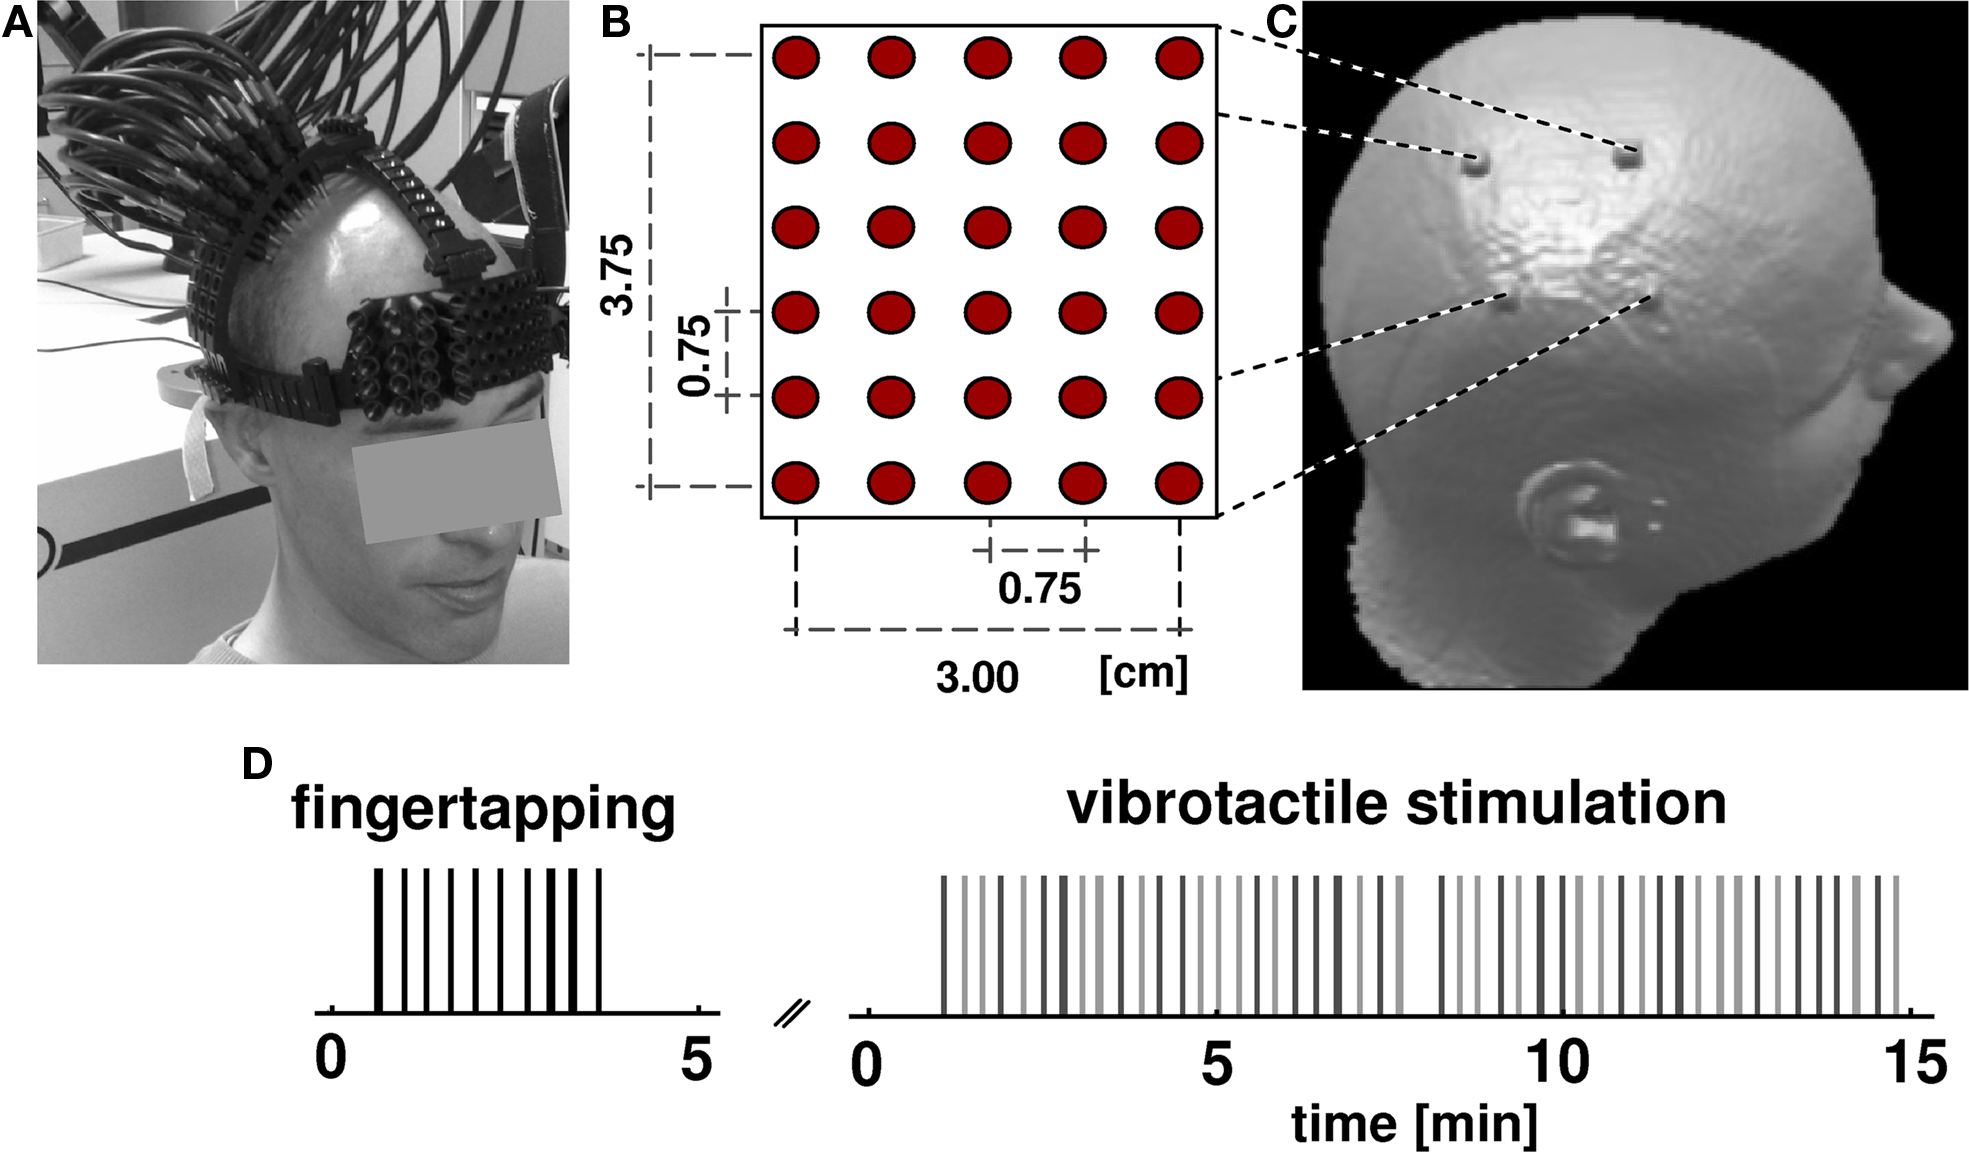
Figure 1. Experimental design. (A) Subjects wore an open scaffolding fiber optic holder, consisting of semi-elastic plastic stripes running along the head circumference just above the ears and along the midline. Arched support members which positioned the fiber optic tips over the right pericentral region were attached to this support structure. Fibers were individually spring loaded to maintain a mild constant pressure onto the skin to provide stable optical contact. (B) The optical probes form a rectangular array of 30 fibers with inter-optode distance of 0.75 cm. (C) After NIRS acquisition, subjects received an anatomical MR scan with fiducial marks positioned at the corner of the probe array allowing the subsequent alignment of functional optical and structural MRI data. (D) Subjects underwent two consecutive sessions, a finger tapping task and vibrotactile stimulation. In both tasks the occurrence of an event (vertical bars: black for tapping, light gray for first finger, dark gray for fifth finger) was jittered over time. The whole optical imaging procedure took less than 20 min.
Prior to vibrotactile stimulation subjects performed 10 repetitions of self-paced finger tapping of the left hand without wearing the glove to assess the motor areas. The timing of finger tapping was guided by the noise of the rotating brushes, to exclude confounding auditory and arousal effects. The finger-tapping experiment was identical to the somatosensory experiment with respect to timing and temporal jitter. Activation in the motor area is a robust signal that has been reported in a number of studies (Obrig et al. 1996 ). In the present study finger tapping served as a control condition. Because the motor homunculus is located on the precentral gyrus we expected the somatosensory activation to be posterior to the motor response. OI data were continuously acquired during vibrotactile stimulation and tapping tasks.
To project functional activation patterns on the individual brain anatomy, an anatomical T1-weighted MPRAGE MRI scan was acquired for each individual subject (TR = 94 ms, TE = 4 ms, flip angle 12°, voxel size 1 × 1 × 1 mm 1.5 T, Magnetom Vision, Siemens, Erlangen, Germany). For a subsequent co-registration of OT-results and anatomical structures the corners of the imaging grid were marked on the scalp. Before MR scanning, vitamin-E capsules were fixed at the marked head positions using double-sided self adhesive tape (Figure 1 C).
Optical Imaging Data Acquisition
Optical imaging was performed using a DYNOT 232 optical tomography imager (NIRx Medizintechnik GmbH, Berlin, Germany). To achieve high spatial sampling of about 0.75-cm IOD, a rectangular array consisting of 30 fibers was arranged over the right pericentral area using an open scaffolding structure and individually spring-loaded fibers. This design allowed for an easy access of the fiber tips for parting the hair before placing an optode and also ensured stable optical contact. Five horizontal and six vertical rows of probes covered an area of 3.00 cm × 3.75 cm (Figures 1 A,B). The imager employs time-multiplexed source illumination and utilizes each optical fiber as both source and detector. The resulting 900 source-detector combinations with variable IODs (0–4.80 cm distance) sample different sub-volumes beneath the probe array and allow investigating functional activation by means of an optical tomography approach (Barbour et al., 2001 ). For the vibrotactile and finger-tapping task data at two wavelengths (760 and 830 nm) were acquired continuously at a rate of 1.9 Hz.
Data Analysis
The first task was to locate the optical probe array with respect to cortical anatomy. Anatomical MR-images of each subject were segmented using standard routines implemented in the Statistical Parametric Mapping software (SPM8, Wellcome Trust, University College London, UK). Images were divided into gray and white matter following SPM’s Bayesian algorithm on the tissue probability maps for white and gray matter. This yielded the voxels of gray matter underneath the pad. The localization of the fiducials was determined from raw images. Based on the individual three-dimensional gray matter maps the fiducial marks of the probe array were then projected on the calculated gray matter surface. The localization of the central sulcus was judged by four independent experts based on the preprocessed anatomical MR-images. For this purpose the individual’s anatomical image was rotated so as to provide a perpendicular view onto the area enclosed by the fiducial marks (similar to the perspective seen in Figure 1 C). The topographic view of the anatomical cortex reconstruction was then subjected to a 2-D transformation to superimpose the fiducials’ location with the corners of the optical reconstruction map. Subjects for whom the central sulcus and/or the presumed activation areas were located outside the area enclose by the fiducial marks were excluded from further analysis.
Next, optical imaging data of both tasks were band pass-filtered between 0.033 and 0.5 Hz (Butterworth, second order). From these we reconstructed volumetric image time series of HbO and HbR concentration changes using the normalized-difference method described in Barbour et al. (2001) and Pei et al. (2001) , as implemented in NAVI software package (NIRx Medical Technologies LLC, Glen Head, NY, USA). The algorithm achieves fast image reconstruction by truncated singular value decomposition (tSVD) inversion of a pre-calculated image operator. The operator, or weight matrix, is generated by solving the optical diffusion equation on a finite element method (FEM) mesh which was obtained from a generic anatomical MRI image of the human head and which considered the specific source-detector configuration of our experiment.
The depth-sensitivity of the true 3-D image reconstruction allows for ready distinction of extra-cerebral artifacts from cerebral activity. Stimulus-related activity was observed only in subsurface areas, which were selected as regions of interest (ROI) for further processing and display. No further method of surface–signal correction, such as a nearest-neighbor signal subtraction (Zeff et al., 2007 ), was employed. All data sets were carefully checked for motion artifacts; however, because of the rigid mounting of the fibers and the relatively short experimental period, no correction for any such artifacts was deemed necessary.
Images were reconstructed on a sub-volume of this FEM mesh being congruent with the region of the optical fiber array on the subject. For both, the finger-tapping task and the vibrotactile stimulation, a general linear model (GLM) was calculated to estimate the effect of hemodynamic changes within this specific three-dimensional sub-volume. For the tapping task a design matrix consisting of a 0–1 boxcar predictor was convolved with a hemodynamic response function with a peak at 5 s (Boynton et al., 1996 ). For the vibrotactile data two independent predictors were applied for stimulation periods of first and fifth digit, respectively. Thus, for each voxel of the sub-volume T-values were derived for HbR and HbO data in each condition. To assess the maxima of activation for the two tactile and the motor conditions we created a series of two-dimensional images of the area covered by the probe array. This roughly corresponds to a slice orientation tangential to the head surface as can be constructed by 3D-MR datasets. A further sub-division of the volume into concentric shells parallel to the optical head model surface was not necessary because size and position revealed a rather planar surface of the probe array. For each condition T-value maps based on the changes in HbR were derived from layers of a medium depth (mean 5.4 mm, SD 1.65 mm). The maps showing a strong hemodynamic response were averaged and superimposed on the corresponding anatomical image and finally thresholded at 90% of the absolute maximum (Figure 2 ).
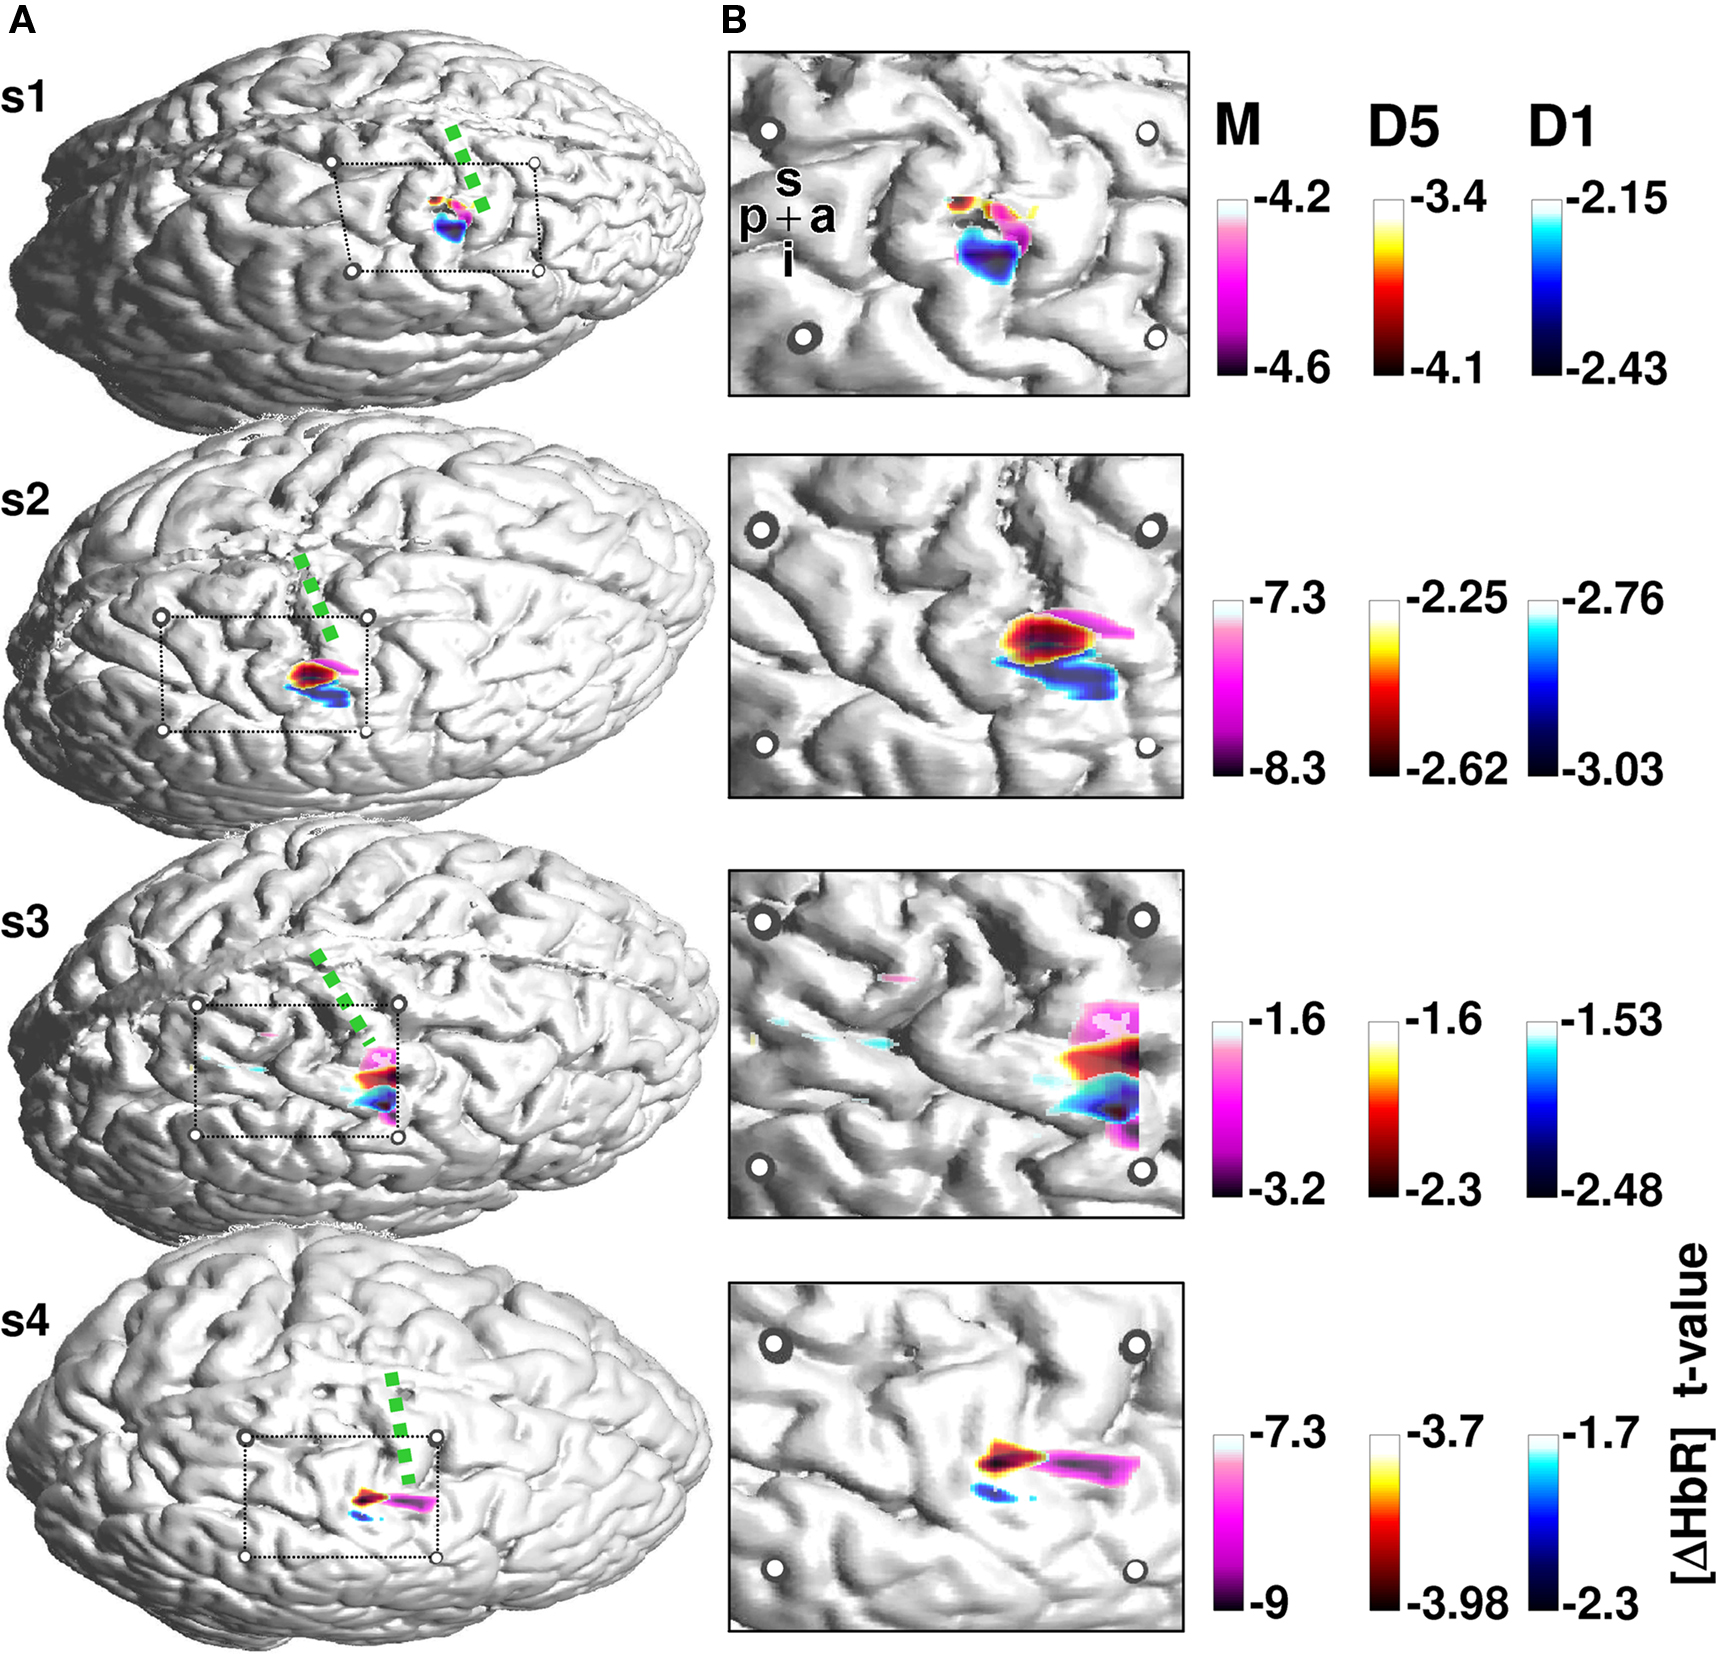
Figure 2. Activation maps for the finger tapping and vibrotactile finger stimulation. (A) Individual cortical anatomy of the four subjects (s1–s4) recovered from anatomical MRI. Circles represent the positions of the fiducial marks projected onto the cortical surface. These allow the location of the cortical area covered by the optical array. The array covers the pre and postcentral gyrus. Precentral gyrus is denoted with a green dotted line. HbR T-maps for finger tapping (pink) and vibrotactile stimulation of first (blue) and fifth (red) finger, respectively, were superimposed on the anatomical image. (B) Magnified section of the probe array with underlying anatomical structures and thresholded T-values. Letters p, a, i, s denote the posterior to anterior and inferior to superior directions of the images.
Results
Three of eight subjects were excluded from the analysis because the probe array for these subjects was not localized over the pericentral region and hence did not include the putative hand area of the motor and somatosensory homunculus.
One subject revealed no focal motor activation during finger-tapping; therefore we do not report on the results of this subject.
Figure 2 shows the activation maps for the remaining four subjects. T-value maps based on HbR-changes were superimposed on individual anatomical images. The four subjects show a maximum hemodynamic response to finger tapping located on the precentral gyrus. In contrast, the hemodynamic response to somatosensory stimulation is located on the postcentral gyrus. Besides this anterior-posterior differentiation, the localization of the activation to first versus fifth finger stimulation differed with respect to their maximal amplitude.
Across all four subjects the activation elicited by stimulation of the fifth finger was located more superior along the central sulcus compared to first finger stimulation. The temporal evolution of the hemodynamic response is illustrated in Figure 3 . Mean changes of HbR and HbO across all runs are shown for the 5 s stimulation period and the ensuing 8 s of rest. Data for first and fifth finger of subject 2 are shown. Clearly both conditions led to an increase in HbO (red) and a decrease in HbR (blue) with the typical vascular response latency peaking 5–7 s after stimulus onset (0 s on the time axis). After thresholding of the results at their absolute maxima, maps revealed different locations of the activation patterns of first and fifth finger stimulation. Vibrotactile stimulation of the first finger led to a more inferior and anterior activation pattern compared to the pattern of the fifth finger in a lateral 2D-view of the brain. This differential localization held for both HbO and HbR. Although HbO and HbR showed slight differences with respect to size and temporal dynamics of the activation patterns, both parameters followed typical dynamics of the vascular response with an increased focal oxygenation resulting from a rise of blood volume and flow velocity. The latter overcompensates the oxygen uptake and thus yields an increased washout of HbR. The anatomical structures subjacent to the fiber array confirmed that the hemodynamic changes to first and fifth finger stimulation originated from the postcentral gyrus.
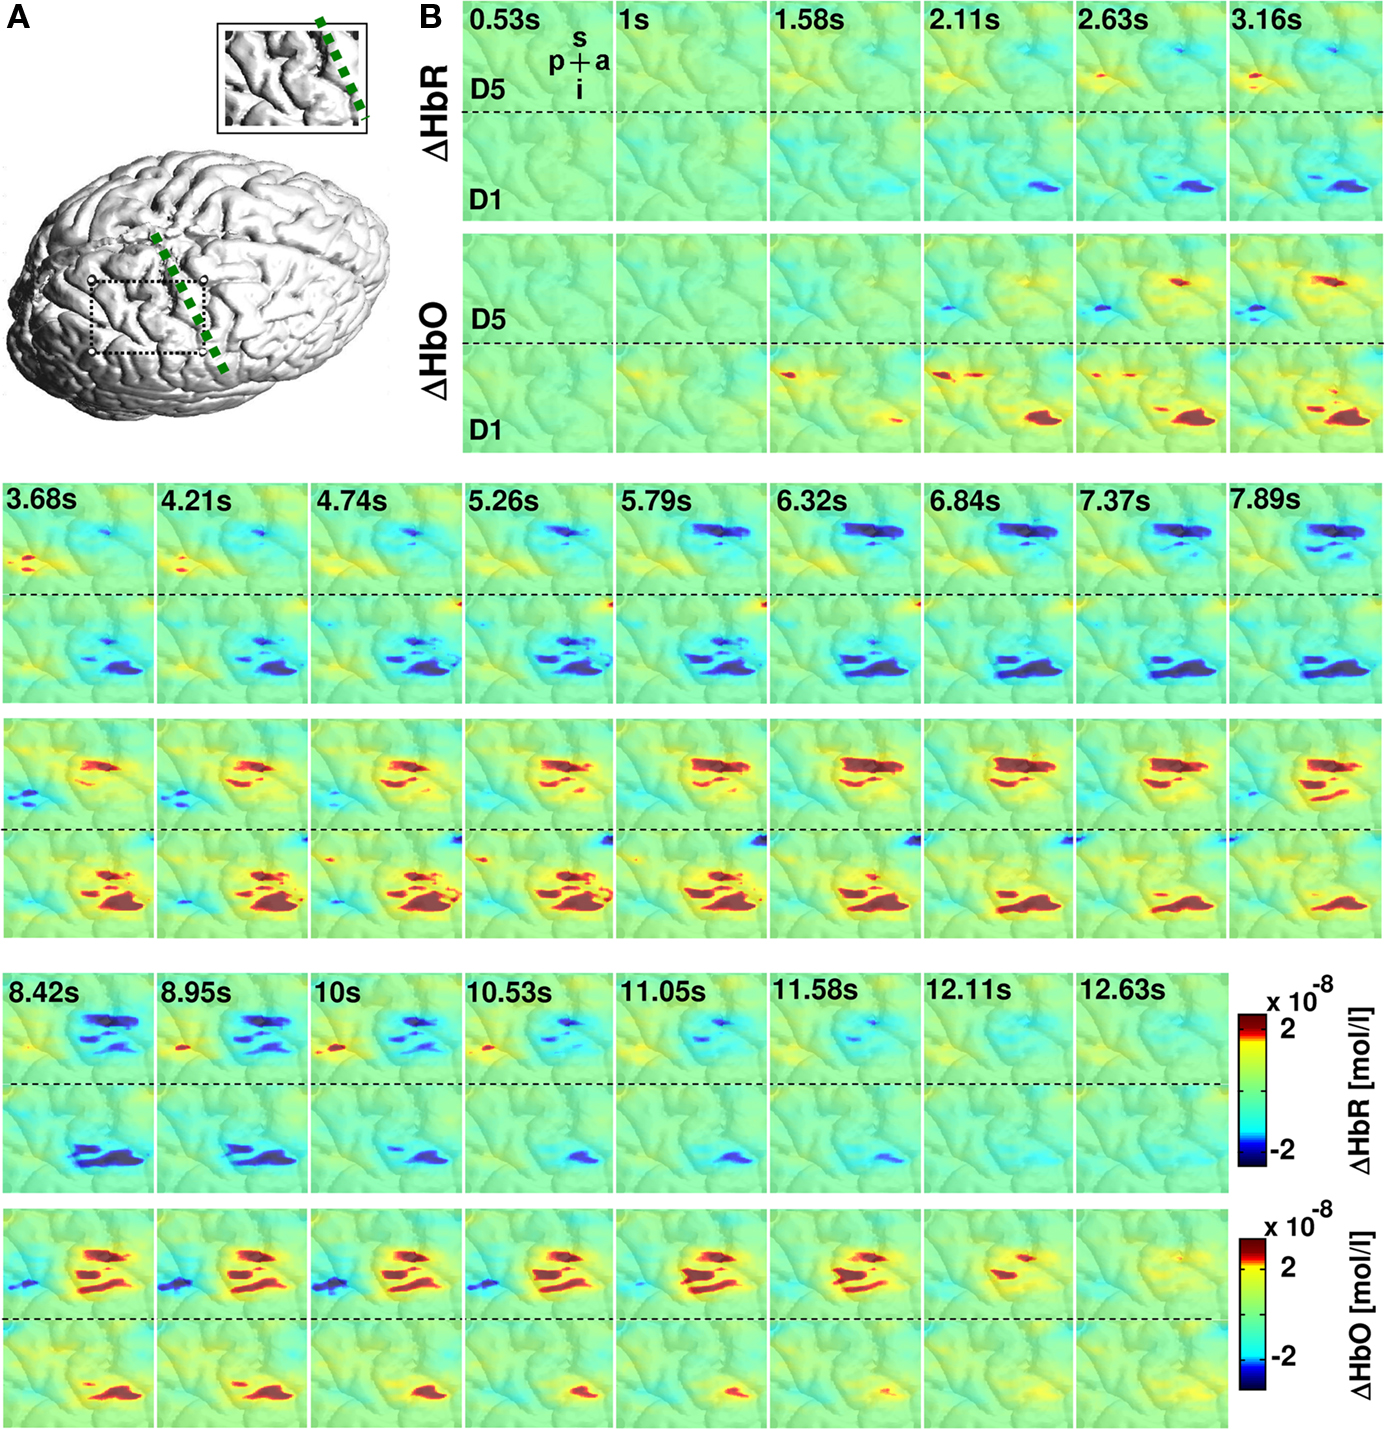
Figure 3. Hemodynamic changes in response to vibrotactile stimulation. (A) Cortical surface rendering of subject 2 with an inset showing the area covered by the probe array. (B) Colored panels depict the averaged hemodynamic changes from this subject for HbR (upper row) and HbO (lower row) to 5-s vibrotactile stimulation of the fifth and first finger. The vibrotactile stimulation started at 0 s. Vibrotactile stimulation of first and fifth finger yielded to a decrease in HbR (blue) and an increase in HbO (red) with a hemodynamic peak latency of 5–7 s. Letters p, a, i, s denote the posterior to anterior and inferior to superior directions of the images.
Discussion
We demonstrated that high-density optical imaging allows for a fine-grained resolution of functional cortical activations in the pericentral motor and somatosensory cortices. The data showed spatially separated activations in response to vibrotactile stimulation posterior to those during motor performance. Also a differentiation between somatosensory representations of the first and fifth finger was unequivocally seen in four subjects. The spatial distribution is in line with the well-known anatomical homuncular organization in the pre and postcentral gyrus which was shown by the projection of the functional imaging results onto the individuals’ structural MRIs. Our results confirm reports of similar approaches using high-density optical imaging (Zeff et al., 2007 ; White and Culver, 2010 ) and extend the application of the methodology to the somatosensory system. First we discuss the findings with regard to previous work on non-invasive imaging of the homuncular organization of the somatosensory cortex, followed by the discussion of relevant limitations and, more importantly, the perspectives of this approach.
Electrophysiological methods provided the first successful demonstration that the homuncular organization is accessible to non-invasive techniques in healthy adults. MEG (Baumgartner et al., 1991 ; Hari et al., 1993 ; Nakamura et al., 1998 ) and EEG (Buchner et al., 1995 ) located differential sources in the pericentral region notably also providing first evidence that this representation can be altered by plastic changes in disease (Elbert et al., 1998 ; Braun et al., 2003 ). While these latter findings show the high sensitivity of MEG and EEG to subtle changes in source amplitude and orientation, the same sensitivity constitutes a fundamental limitation of electrophysiological imaging related to the inverse problem of all localization approaches. With the advent of blood oxygen level dependence-(BOLD) fMRI, a number of groups used the inherent advantage of MRI supplying a high-resolution structural image on which the functional activation can be individually mapped (Sakai et al., 1995 ; Lin et al., 1996 ; Gelnar et al., 1998 ; Kurth et al., 1998 ; Stippich et al., 1999 ; Francis et al., 2000 ; Nelson and Chen, 2008 ; Schweizer et al., 2008 ; Weibull et al., 2008 ). Some of these studies were able to produce functional maps highly similar to Penfield’s invasively assessed maps. In these images stimulation of the thumb results in the most lateral, anterior and inferior position, followed by the other fingers orderly along the central sulcus in a superior to medial direction (Maldjian et al., 1999 ; Kurth et al., 2000 ; van Westen et al., 2004 ; Schweizer et al., 2008 ).
Our results confirm that sensitivity of optical imaging is sufficient to detect similarly subtle differences in the lateral distribution of activation foci. Sensitivity to a functional activation paradigm across studies is somewhat arbitrary depending on the exact stimulation protocol, individual anatomy, and a number of issues of the analytical tools and assumptions. A key question is how such an approach can be useful for future research. Here, one apparent concern is the rather high exclusion rate of half of our subjects. Three subjects were excluded due to a wrong localization of the pad with respect to cortical anatomy. This is somewhat at odds with the comparatively small inter-individual variance of the central sulcus with reference to the 10–20 system. Using magnetic resonance imaging, Steinmetz et al. (1989) reported a 1.2 cm rostral to caudal variation of the central sulcus (16 subjects) when relating cortical anatomy to the grid referenced by the external bony landmarks. This point, determined in sagittal slices 4 cm from midline and with respect to the line defined by the vertex point (Cz) and the pre-auricular point, referred to the location of the middle finger representation of the motor and sensory homunculi. Another MR-study reported inter-individual variances of the same order, when cortical anatomy was related to the 10–10 system (Koessler et al., 2009 ). Across 16 subjects the standard deviations of the C4 electrode position, close to the central sulcus, was below 10 mm (SD for C4: x = 4.6 mm, y = 8.3 mm, z = 6.4 mm). It may be possible that our projection of the optical probes and the cortical surface has added to the variance of the pad’s location in the excluded subjects. Additionally, the central sulcus was located by a rather simple expert-rating approach using preprocessed representations of individuals’ brain surface. Since the focus in this paper is on the approach rather than an anatomical question, we used this quite conservative inclusion criterion. In clinical applications structural imaging data will be available in most patients, thus information on the individual anatomy and more importantly individual lesions will usually allow for an informed positioning of the probe array. Furthermore powerful novel projection algorithms have been proposed (Okamoto et al., 2004 ; Custo et al., 2010 ) for low-density imaging and are currently being developed for high-density tomographic data.
Another subject was excluded since motor performance did not elicit reliable activation. There are two reasons for using a reliable response to finger tapping as an inclusion criterion. Firstly, motor-related activation has been shown to be much more robust not only in optical (Obrig et al., 1996 ) but also in BOLD-contrast imaging, partially due to the fact that somatosensory feedback is inherent to natural motor performance. Additionally the hemodynamic response to finger tapping was expected to project to the precentral gyrus (M1 and premotor areas). Hence to judge the potential of high-resolution optical imaging we considered it mandatory to differentiate in both an anterior-posterior and a medio-lateral dimension.
What are the limitations of the approach? Clearly parts of the brain located in deep sulcal structures with some distance to the surface cannot be reached by optical approaches. The resolution of sub-divisions of SI, as it has been shown in primates (Merzenich et al., 1978 ; Kaas et al., 1979 ; Nelson et al., 1980 ; Sur et al., 1982 ; Pons et al., 1985 ), may be beyond the lateral resolution even of high-density optical approaches. The somatotopic organization is most pronounced in area 3b, and in area 3a located on the posterior wall of the central sulcus. These factors may contribute to the issue of precision of our approach. For high-resolution MRI differentiations of the sub-divisions of SI have been reported (Eickhoff et al., 2005 ; Schweizer et al., 2008 ). Refining co-registration with structural MRI and re-localizing the center of the image pad to optimally cover the area of interest may enhance the accuracy of the here presented approach. However, considering some fundamental limitations of diffuse-optical tomography we think that such sub-differentiation will be beyond even more sophisticated methodological approaches. The limitations inherent to non-invasive optical imaging can be divided into three fields. (i) The underlying physical principles of photon transport in strongly scattering media restrict the precision of the reconstruction of the sampled tissue. This is due to the fact that strong assumptions concerning the background optical properties are mandatory. Deviations from the assumed optical properties in the individual clearly limit precision. (ii) Anatomically, the variability of gyral structure and the thickness of the extra-cerebral tissue reduce the spatial accuracy of the derived activation foci. Since optical imaging does not supply anatomical information, the measured activation pattern can only be projected onto a gyral map when relying on external landmarks and cranio–cerebral correlations with the 10–10/10–20 electrode placement system (Okamoto et al., 2004 ) or when a structural MRI is performed in the individual subject. (iii) Physiologically, systemic changes in hemodynamics must be considered. This notorious issue in optical imaging may lead to a contamination of the vascular response with respect to amplitude but also timing (Boden et al., 2007 ). In high-resolution approaches this may be considered a lesser issue, since the high focality of the response is an intrinsic argument for the cortical origin of the detected changes. However, when comparing amplitude and temporal dynamics between groups or in their development over time, this may introduce another source of noise.
Bearing these issues in mind, we are confident that future application of high-density optical imaging is complementary to vascular (fMRI) and electrophysiological imaging (EEG). As it has been demonstrated in a large number of studies, optical imaging has a potential in applications in which fMRI application is problematic, notably in infant research. The present approach may be specifically suited to be applied in clinical and rehabilitative research. In a multimodal scenario structural and potentially functional information can be gathered in an initial MRI-based assessment. During the course of rehabilitative therapy optical imaging could serve as a convenient tool to monitor plasticity in a predefined region of interest. Another promising perspective is the simultaneous application high-density optical imaging with EEG or MEG (Obrig et al., 2002 ; Mackert et al., 2004 ). Beyond basic issues of neurovascular coupling (Koch et al., 2009 ) the respective strengths of a high sensitivity to brief events (EEG) and the integration over slower processes inherent to vascular techniques like optical imaging has as yet not been fully explored. The latter may be of relevance especially when plastic changes during stimulation and training are the focus of research. Our present data and the pioneering work of other groups (Zeff et al., 2007 ; White and Culver, 2010 ) can be considered a huge step towards an increase of reliability and applicability of optical imaging in such fields of research.
Conflict of Interest Statement
The authors declare that the research was conducted in the absence of any commercial or financial relationships that could be construed as a potential conflict of interest.
Acknowledgments
Financial support of the EU (NEST 012778, EFRE 20002006 2/6, nEUROpt 201076), and BMBF (BNIC, Bernstein Center for Computational Neuroscience, German-Polish cooperation FK: 01GZ0710) are gratefully acknowledged. Support was also provided by NIH grants R42NS050007, R44NS049734 to R. L. Barbour.
References
Barbour, R. L., Graber, H. L., Pei, Y., Zhong, S., and Schmitz, C. H. (2001). Optical tomographic imaging of dynamic features of dense-scattering media. J. Opt. Soc. Am. A. Opt. Image Sci. Vis. 18, 3018–3036.
Baumgartner, C., Doppelbauer, A., Sutherling, W. W., Zeitlhofer, J., Lindinger, G., Lind, C., and Deecke, L. (1991). Human somatosensory cortical finger representation as studied by combined neuromagnetic and neuroelectric measurements. Neurosci. Lett. 134, 103–108.
Birn, R. M., Cox, R. W., and Bandettini, P. A. (2002). Detection versus estimation in event-related fMRI: choosing the optimal stimulus timing. Neuroimage 15, 252–264.
Boas, D. A., Chen, K., Grebert, D., and Franceschini, M. A. (2004). Improving the diffuse optical imaging spatial resolution of the cerebral hemodynamic response to brain activation in humans. Opt. Lett. 29, 1506–1508.
Boden, S., Obrig, H., Kohncke, C., Benav, H., Koch, S. P., and Steinbrink, J. (2007). The oxygenation response to functional stimulation: is there a physiological meaning to the lag between parameters? Neuroimage 36,100–107.
Boynton, G. M., Engel, S. A., Glover, G. H., and Heeger, D. J. (1996). Linear systems analysis of functional magnetic resonance imaging in human V1. J. Neurosci. 16, 4207–4221.
Braun, C., Schweizer, R., Heinz, U., Wiech, K., Birbaumer, N., and Topka, H. (2003). Task-specific plasticity of somatosensory cortex in patients with writer’s cramp. Neuroimage 20, 1329–1338.
Buchner, H., Adams, L., Muller, A., Ludwig, I., Knepper, A., Thron, A., Niemann, K., and Scherg, M. (1995). Somatotopy of human hand somatosensory cortex revealed by dipole source analysis of early somatosensory evoked potentials and 3D-NMR tomography. Electroencephalogr. Clin. Neurophysiol. 96, 121–134.
Custo, A., Boas, D. A., Tsuzuki, D., Dan, I., Mesquita, R., Fischl, B., Grimson, W. E., and Wells, W. (2010). Anatomical atlas-guided diffuse optical tomography of brain activation. Neuroimage 49, 561–567.
Eickhoff, S., Walters, N. B., Schleicher, A., Kril, J., Egan, G. F., Zilles, K., Watson, J. D., and Amunts, K. (2005). High-resolution MRI reflects myeloarchitecture and cytoarchitecture of human cerebral cortex. Hum. Brain Mapp. 24, 206–215.
Elbert, T., Candia, V., Altenmuller, E., Rau, H., Sterr, A., Rockstroh, B., Pantev, C., and Taub, E. (1998). Alteration of digital representations in somatosensory cortex in focal hand dystonia. Neuroreport 9, 3571–3575.
Francis, S. T., Kelly, E. F., Bowtell, R., Dunseath, W. J., Folger, S. E., and McGlone, F. (2000). fMRI of the responses to vibratory stimulation of digit tips. Neuroimage 11, 188–202.
Gelnar, P. A., Krauss, B. R., Szeverenyi, N. M., and Apkarian, A. V. (1998). Fingertip representation in the human somatosensory cortex: an fMRI study. Neuroimage 7, 261–283.
Grocott, M., Richardson, A., Montgomery, H., and Mythen, M. (2007). Caudwell Xtreme Everest: a field study of human adaptation to hypoxia. Crit. Care 11, 151.
Hari, R., Karhu, J., Hamalainen, M., Knuutila, J., Salonen, O., Sams, M., and Vilkman, V. (1993). Functional organization of the human first and second somatosensory cortices: a neuromagnetic study. Eur. J. Neurosci. 5, 724–734.
Jackson, H. J. (1863). Convulsive spasms of the right hand and arm preceding epileptic seizures. Med. Times. Gaz. 1, 589.
Kaas, J. H., Nelson, R. J., Sur, M., Lin, C. S., and Merzenich, M. M. (1979). Multiple representations of the body within the primary somatosensory cortex of primates. Science 204, 521–523.
Koch, S. P., Werner, P., Steinbrink, J., Fries, P., and Obrig, H. (2009). Stimulus-induced and state-dependent sustained gamma activity is tightly coupled to the hemodynamic response in humans. J. Neurosci. 29, 13962–13970.
Koessler, L., Maillard, L., Benhadid, A., Vignal, J. P., Felblinger, J., Vespignani, H., and Braun, M. (2009). Automated cortical projection of EEG sensors: anatomical correlation via the international 10-10 system. Neuroimage 46, 64–72.
Kurth, R., Villringer, K., Mackert, B. M., Schwiemann, J., Braun, J., Curio, G., Villringer, A., and Wolf, K. J. (1998). fMRI assessment of somatotopy in human Brodmann area 3b by electrical finger stimulation. Neuroreport 9, 207–212.
Kurth, R., Villringer, K., Curio, G., Wolf, K. J., Krause, T., Repenthin, J., Schwiemann, J., Deuchert, M., and Villringer, A. (2000). fMRI shows multiple somatotopic digit representations in human primary somatosensory cortex. Neuroreport 11, 1487–1491.
Lin, W., Kuppusamy, K., Haacke, E. M., and Burton, H. (1996). Functional MRI in human somatosensory cortex activated by touching textured surfaces. J. Magn. Reson. Imaging 6, 565–572.
Mackert, B. M., Wubbeler, G., Leistner, S., Uludag, K., Obrig, H., Villringer, A., Trahms, L., and Curio, G. (2004). Neurovascular coupling analyzed non-invasively in the human brain. Neuroreport 15, 63–66.
Maldjian, J. A., Gottschalk, A., Patel, R. S., Detre, J. A., and Alsop, D. C. (1999). The sensory somatotopic map of the human hand demonstrated at 4 Tesla. Neuroimage 10, 55–62.
Merzenich, M. M., Kaas, J. H., Sur, M., and Lin, C. S. (1978). Double representation of the body surface within cytoarchitectonic areas 3b and 1 in “SI” in the owl monkey (Aotus trivirgatus). J. Comp. Neurol. 181, 41–73.
Miyai, I., Tanabe, H. C., Sase, I., Eda, H., Oda, I., Konishi, I., Tsunazawa, Y., Suzuki, T., Yanagida, T., and Kubota, K. (2001). Cortical mapping of gait in humans: a near-infrared spectroscopic topography study. Neuroimage 14, 1186–1192.
Nakamura, A., Yamada, T., Goto, A., Kato, T., Ito, K., Abe, Y., Kachi, T., and Kakigi, R. (1998). Somatosensory homunculus as drawn by MEG. Neuroimage 7, 377–386.
Nelson, A. J., and Chen, R. (2008). Digit somatotopy within cortical areas of the postcentral gyrus in humans. Cereb. Cortex 18, 2341–2351.
Nelson, R. J., Sur, M., Felleman, D. J., and Kaas, J. H. (1980). Representations of the body surface in postcentral parietal cortex of Macaca fascicularis. J. Comp. Neurol. 192, 611–643.
Obrig, H., Hirth, C., Junge-Hulsing, J. G., Doge, C., Wolf, T., Dirnagl, U., and Villringer, A. (1996). Cerebral oxygenation changes in response to motor stimulation. J. Appl. Physiol. 81, 1174–1183.
Obrig, H., Israel, H., Kohl-Bareis, M., Uludag, K., Wenzel, R., Muller, B., Arnold, G., and Villringer, A. (2002). Habituation of the visually evoked potential and its vascular response: implications for neurovascular coupling in the healthy adult. Neuroimage 17, 1–18.
Okamoto, M., Dan, H., Sakamoto, K., Takeo, K., Shimizu, K., Kohno, S., Oda, I., Isobe, S., Suzuki, T., Kohyama, K., and Dan, I. (2004). Three-dimensional probabilistic anatomical cranio-cerebral correlation via the international 10-20 system oriented for transcranial functional brain mapping. Neuroimage 21, 99–111.
Olopade, C. O., Mensah, E., Gupta, R., Huo, D., Picchietti, D. L., Gratton, E., and Michalos, A. (2007). Noninvasive determination of brain tissue oxygenation during sleep in obstructive sleep apnea: a near-infrared spectroscopic approach. Sleep 30, 1747–1755.
Pei, Y., Graber, H. L., and Barbour, R. L. (2001). Influence of systematic errors in reference states on image quality and on stability of derived information for DC optical imaging. Appl. Opt. 40, 5755–5769.
Penfield, W., and Boldrey, E. (1937). Somatic motor and sensory representation in the cerebral cortex of man as studied by electrical stimulation. Brain Res. 60, 389–443.
Penfield, W., and Rasmussen, T. (1950). The Cerebral Cortex of Man. A Clinical Study of Localization of Function. New York: Macmillan Company.
Pons, T. P., Garraghty, P. E., Cusick, C. G., and Kaas, J. H. (1985). A sequential representation of the occiput, arm, forearm and hand across the rostrocaudal dimension of areas 1, 2 and 5 in macaque monkeys. Brain Res. 335, 350–353.
Sakai, K., Watanabe, E., Onodera, Y., Itagaki, H., Yamamoto, E., Koizumi, H., and Miyashita, Y. (1995). Functional mapping of the human somatosensory cortex with echo-planar MRI. Magn. Reson. Med. 33, 736–743.
Schweizer, R., Voit, D., and Frahm, J. (2008). Finger representations in human primary somatosensory cortex as revealed by high-resolution functional MRI of tactile stimulation. Neuroimage 42, 28–35.
Steinmetz, H., Furst, G., and Meyer, B. U. (1989). Craniocerebral topography within the international 10-20 system. Electroencephalogr. Clin. Neurophysiol. 72, 499–506.
Stippich, C., Hofmann, R., Kapfer, D., Hempel, E., Heiland, S., Jansen, O., and Sartor, K. (1999). Somatotopic mapping of the human primary somatosensory cortex by fully automated tactile stimulation using functional magnetic resonance imaging. Neurosci. Lett. 277, 25–28.
Sur, M., Nelson, R. J., and Kaas, J. H. (1982). Representations of the body surface in cortical areas 3b and 1 of squirrel monkeys: comparisons with other primates. J. Comp. Neurol. 211, 177–192.
van Westen, D., Fransson, P., Olsrud, J., Rosen, B., Lundborg, G., and Larsson, E. M. (2004). Fingersomatotopy in area 3b: an fMRI-study. BMC Neurosci. 5, 28.
Weibull, A., Bjorkman, A., Hall, H., Rosen, B., Lundborg, G., and Svensson, J. (2008). Optimizing the mapping of finger areas in primary somatosensory cortex using functional MRI. Magn. Reson. Imaging 26, 1342–1351.
White, B. R., and Culver, J. P. (2010). Phase-encoded retinotopy as an evaluation of diffuse optical neuroimaging. Neuroimage 49, 568–577.
Wolf, T., Lindauer, U., Obrig, H., Dreier, J., Back, T., Villringer, A., and Dirnagl, U. (1996). Systemic nitric oxide synthase inhibition does not affect brain oxygenation during cortical spreading depression in rats: a noninvasive near-infrared spectroscopy and laser-Doppler flowmetry study. J. Cereb. Blood Flow Metab. 16, 1100–1107.
Keywords: near-infrared spectroscopy, optical imaging, optical tomography, somatotopy, somatosensory system, vibrotactile stimulation
Citation: Koch SP, Habermehl C, Mehnert J, Schmitz CH, Holtze S, Villringer A, Steinbrink J and Obrig H (2010) High-resolution optical functional mapping of the human somatosensory cortex. Front. Neuroenerg. 2:12. doi: 10.3389/fnene.2010.00012
Received: 25 February 2010;
Paper pending published: 30 March 2010;
Accepted: 26 May 2010;
Published online: 14 June 2010
Edited by:
David Boas, Massachusetts General Hospital, USA; Massachusetts Institute of Technology, USA; Harvard Medical School, USAReviewed by:
Theodore Huppert, University of Pittsburgh Medical Center, USAJoseph P. Culver, Harvard Medical School, USA
Copyright: © 2010 Koch, Habermehl, Mehnert, Schmitz, Holtze, Villringer, Steinbrink and Obrig. This is an open-access article subject to an exclusive license agreement between the authors and the Frontiers Research Foundation, which permits unrestricted use, distribution, and reproduction in any medium, provided the original authors and source are credited.
*Correspondence: Stefan P. Koch, Berlin NeuroImaging Center, Department of Neurology, Charité University Hospital, Chariteplatz 1, 10117 Berlin, Germany. e-mail: stefan.koch@charite.de