Linear superposition of sensory-evoked and ongoing cortical hemodynamics
- The Centre for Signal Processing in NeuroImaging and Systems Neuroscience, Department of Psychology, University of Sheffield, Sheffield, South Yorkshire, UK
Modern non-invasive brain imaging techniques utilize changes in cerebral blood flow, volume and oxygenation that accompany brain activation. However, stimulus-evoked hemodynamic responses display considerable inter-trial variability even when identical stimuli are presented and the sources of this variability are poorly understood. One of the sources of this response variation could be ongoing spontaneous hemodynamic fluctuations. To investigate this issue, 2-dimensional optical imaging spectroscopy was used to measure cortical hemodynamics in response to sensory stimuli in anesthetized rodents. Pre-stimulus cortical hemodynamics displayed spontaneous periodic fluctuations and as such, data from individual stimulus presentation trials were assigned to one of four groups depending on the phase angle of pre-stimulus hemodynamic fluctuations and averaged. This analysis revealed that sensory evoked cortical hemodynamics displayed distinctive response characteristics and magnitudes depending on the phase angle of ongoing fluctuations at stimulus onset. To investigate the origin of this phenomenon, “null-trials” were collected without stimulus presentation. Subtraction of phase averaged “null trials” from their phase averaged stimulus-evoked counterparts resulted in four similar time series that resembled the mean stimulus-evoked response. These analyses suggest that linear superposition of evoked and ongoing cortical hemodynamic changes may be a property of the structure of inter-trial variability.
Introduction
The changes in blood flow, volume and oxygenation that accompany brain activation are collectively referred to as the hemodynamic response. Cerebral hemodynamics are of interest to cognitive neuroscience as they form the basis of non-invasive human brain imaging techniques such as Blood Oxygenation Level Dependent (BOLD) fMRI (Kwong et al., 1992; Ogawa et al., 1992). However, stimulus-evoked hemodynamic responses are known to display considerable inter-trial variability (Aguirre et al., 1998); and the sources of this variation are poorly understood. The ubiquitous low frequency fluctuations in “resting state” hemodynamics (Biswal et al., 1995; Mayhew et al., 1996; Lowe et al., 1998; Obrig et al., 2000; Spitzer et al., 2001; Greicius et al., 2003; Majeed et al., 2009) could be one possible source of the variation in subsequent stimulus-evoked responses. Understanding whether ongoing and evoked hemodynamics sum linearly is an important prerequisite for developing methods to reduce inter-trial variability. In the case of multiple successive stimulus presentations (Malonek et al., 1997) both linear (Martindale et al., 2003) and non-linear (Cannestra et al., 1998) summation has been reported. In the case of ongoing and evoked hemodynamics, a recent study suggests that ongoing hemodynamic activity may contribute to the variation in stimulus-evoked hemodynamic responses (Fox et al., 2006b), in a similar fashion to that in which resting cortical activity contributes to the variance in evoked neural responses (Arieli et al., 1996). Fox and colleagues measured task related BOLD signal changes in motor cortex and found inter-trial variability. Subsequent subtraction of coherent spontaneous BOLD fluctuations from the cortex contralateral to that activated by the task, reduced inter-trial variability and therefore suggested a superposition of evoked and ongoing hemodynamics. Another approach for examining the role of spontaneous pre-stimulus fluctuations in the trial-to-trial variability of stimulus-evoked neurophysiological data, is to group trials based on some property of their pre-stimulus time series, average trials in each group and examine whether the mean groups responses differ (Sauseng et al., 2007). To investigate whether this approach could confirm and extend the findings of Fox et al. (2006b) we first recorded whisker pad stimulus-evoked cortical hemodynamics in the rodent barrel cortex of anesthetized rodents with 2-dimensional optical imaging spectroscopy (2D-OIS, Devor et al., 2003; Berwick et al., 2005, 2008). This allowed measurement of the individual components of the hemodynamic response (oxyhemoglobin, deoxyhemoglobin and total hemoglobin) at a higher temporal resolution than that afforded by fMRI. Data was examined on a trial by trial basis and grouped based on pre-stimulus hemodynamics. As hemodynamic fluctuations are oscillatory in nature (Mayhew et al., 1996), an identical magnitude of hemodynamics occurs at two distinct phases (e.g., 0° and 180°). Therefore if trials were grouped based on the magnitude of hemodynamic activity at stimulus onset, information regarding whether the fluctuation was “rising” or “falling” at this time point would be lost. Therefore the metric of pre-stimulus hemodynamic activity chosen to “classify” individual trials, was not the magnitude of pre-stimulus hemodynamic activities but their phase angle at stimulus onset. Individual trials were then averaged according to the phase of their pre-stimulus hemodynamic fluctuations. This revealed that cortical hemodynamics display distinct responses to sensory stimuli depending on the phase of pre-stimulus fluctuations. To investigate the origin of this phenomenon, null trials of identical duration were collected where no stimuli were presented. Phase averaged “null trial data” was then used to investigate whether ongoing and evoked hemodynamics linearly superpose by examining times series produced by subtracting phase averaged “null trial data” from phase averaged stimulus-evoked trials.
Materials and Methods
Animal Preparation (N = 6)
Female Hooded Lister rats weighing between 250 g and 400 g were kept in a 12-h dark/light cycle environment at a temperature of 22°C with food and water ad libitum. Prior to surgery, animals were anesthetized with urethane (1.25 g/kg i.p.). Rectal temperature was maintained at 37°C throughout surgical and experimental procedures using a homeothermic blanket (Harvard). Animals were tracheotomized to allow artificial ventilation and measurement of end-tidal CO2. Ventilation parameters were adjusted to maintain blood gas measurements and end-tidal CO2 within physiological limits. The femoral vein and artery were cannulated to allow drug infusion and measurement of mean arterial blood pressure respectively. Phenylephrine (0.13–0.26 mg/hr) was infused to maintain blood pressure between physiological limits (MABP, 100–110 mmHg). Animals were placed in a stereotaxic frame (Kopf Instruments) and the skull overlying the somatosensory cortex was thinned to translucency with a dental drill under constant cooling with saline. A plastic “well” was attached to the thinned skull and filled with saline (37°C) to reduce specularities from the skull surface. All procedures were carried out in accord with Home Office regulations.
2D Optical Imaging Spectroscopy Estimates of Hemoglobin Changes
Images of the cortical surface were collected with a high-speed CCD camera. The cortex was sequentially illuminated with four wavelengths (two pairs) of light (495 ± 31 and 587 ± 9 nm FWHM; 559 ± 16 nm and 575 ± 14 FWHM ) with a Lambda DG-4 high-speed filter changer (Sutter Instrument, Novato, CA, USA) and stabilized 300W xenon arc light source (Figure 1). The wavelengths in each pair are chosen such that they sample a similar same tissue volume. However, for each of the two wavelengths in each pair, one is associated with a greater absorption co-efficient for oxyhemoglobin than deoxyhemoglobin and the other is associated with a greater absorption co-efficient for deoxyhemoglobin than oxyhemoglobin. The camera data collection (30 Hz) was synchronized to filter changing such that each subsequent image was collected with a different wavelength of cortical illumination. This “multi-wavelength” optical imaging data was subject to spectral analysis using a modified beer Lambert law that corrects for the wavelength dependency of photon path length (Mayhew et al., 1999) and has been used previously to analyze this form of spectroscopic data (Berwick et al., 2005, 2008). This allowed estimation of changes in total hemoglobin concentration (Hbt), oxyhemoglobin concentration (HbO2) and deoxyhemoglobin concentration (Hbr). As data from each of the four wavelengths of illumination were required for spectral estimates of hemoglobin changes the effective sampling frequency was that of the camera frame rate divided by 4 (30/4 = 7.5). The baseline value of cortical Hbt was set at 104 μM which was estimated by a previous MRI study in rodent (Kennerley et al., 2005).
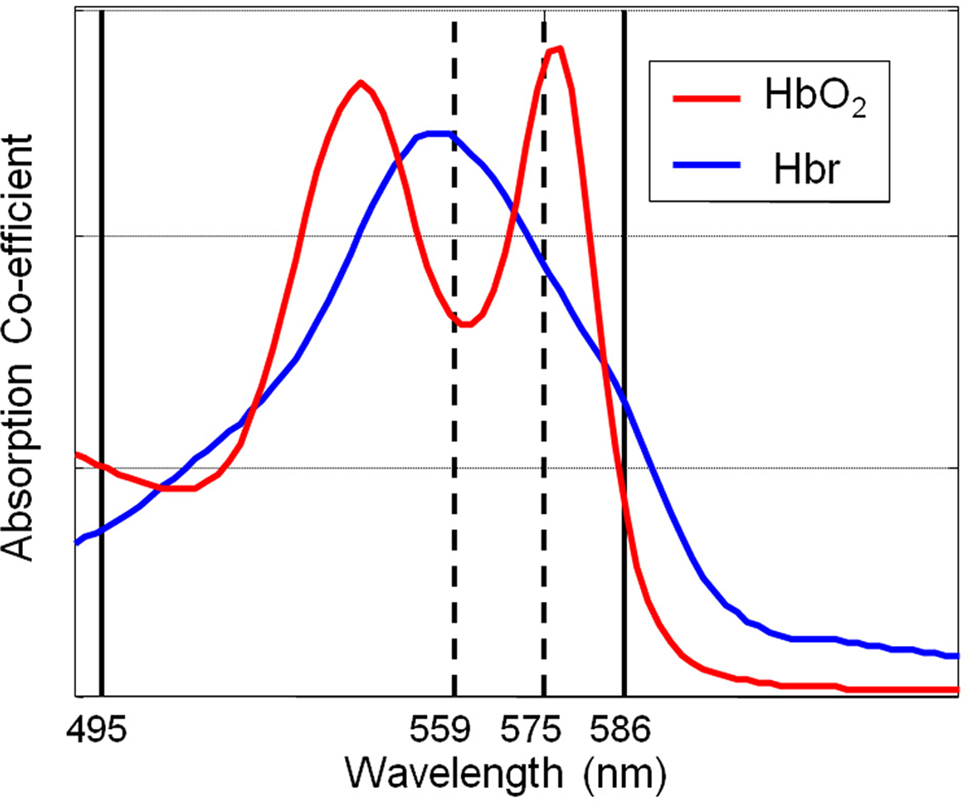
Figure 1. A schematic diagram of the absorption spectra of oxyhemoglobin (HbO2) and deoxyhemoglobin (Hbr) displaying the choices of wavelengths of filters for the incident illumination used for optical imaging spectroscopy.
Stimulus Presentation, Paradigms and Data Analysis
All stimulus presentation was controlled through a 1401plus (CED Ltd, UK) running custom-written code with stimulus onset time locked to the CCD camera. Electrical stimulation of the whole whisker pad was delivered via stainless steel electrodes inserted in an anterior direction each side of the whisker pad (Mayhew et al., 2000; Jones et al., 2001, 2002, 2004, 2005; Sheth et al., 2003). All electrical stimuli were presented for 3 s at 1 Hz with a 0.3 ms individual pulse width at an intensity of 1.2 mA (Jones et al., 2004, 2005, 2008). No change in MABP, heart rate or PCO2 were observed at this stimulus intensity suggesting that the measured hemodynamic responses were not contaminated by systemic physiological changes. Trials were 24-s long with a 1-s inter-trial interval. Stimulation occurred on the 8th second of each trial. Experimental runs consisted of 30 trials. In each experimental run, either stimuli were presented or else data with identical parameters were collected without presenting stimuli. 6–9 experimental runs (180–270 trials) where stimuli were presented (termed “stimulus-evoked”) and 6–8 experimental runs (180–240 trials) where stimuli were not presented (termed “nulls”) were collected for each animal (n = 6).
For each animal, trial averaged images of total Hbt changes following stimulus presentation were analyzed using a signal source separation algorithm (Molgedey and Schuster, 1994) as previously described (Zheng et al., 2001). This procedure has been shown on numerous occasions to localize spatially discrete activations of barrel cortex which show excellent concordance with cytochrome oxidase histology in tangential (Jones et al., 2001, 2002) and coronal sections (Jones et al., 2004). “Barrel maps” were registered with images of cortical surface for selection of a region of interest (ROI). A parenchymal ROI was selected in the center of the active barrel region avoiding overlying surface vasculature. This ROI was used to provide time series of hemodynamics for each “stimulus-evoked” or “null” trial for each animal.
Trial Averaging According to Phase of Spontaneous Pre-Stimulus Hemodynamic Fluctuations
A Hilbert transform (Matlab™ function “Hilbert”) was used to calculate the phase of the ongoing pre-stimulus fluctuations in Hbt. Briefly, this technique assumes the time series to be the real part of a complex signal and determines the imaginary part. The phase is calculated as the inverse tangent of the ratio of the imaginary and real signals (Pikovsky et al., 2001). This allows calculation of the instantaneous phase of an ongoing time series even if the time series is not precisely sinusoidal (Haslinger et al., 2006) and has been extensively used to characterize EEG data (Le Van Quyen et al., 2001; Le Van Quyen and Bragin, 2007). For clarity phase angle is expressed in degrees (rather than radians) and between 0 and 360. Trials were then assigned to one of four groups (0–90°; 90–180°; 180–270°; 270–360°) based on the phase of the ongoing fluctuations in Hbt immediately before stimulus onset. In the case of trials in which stimuli were not presented, phase was calculated for an identical period (8 s) of the time series and trials were again averaged based on the phase found at the 8-s time point (corresponding to the time of stimulus onset in the stimulus presentation trials. Again trials were then assigned to one of four groups (0°–90°; 90°–180°; 180°–270°; 270°–360° and averaged).
Results
The Trial and Animal Averaged Whisker Evoked Cortical Hemodynamic Response
Trial and animal averaging revealed the characteristic cortical hemodynamic response elicited by stimulation of the whisker pad as measured by optical imaging spectroscopy (Figure 2). Following stimulus onset there was an increase in total Hbt and an increase in oxyhemoglobin (HbO2) concentration. Changes in deoxyhemoglobin (Hbr) concentration were biphasic displaying a small early increase shortly after stimulus onset, then decreasing below pre-stimulus baseline.
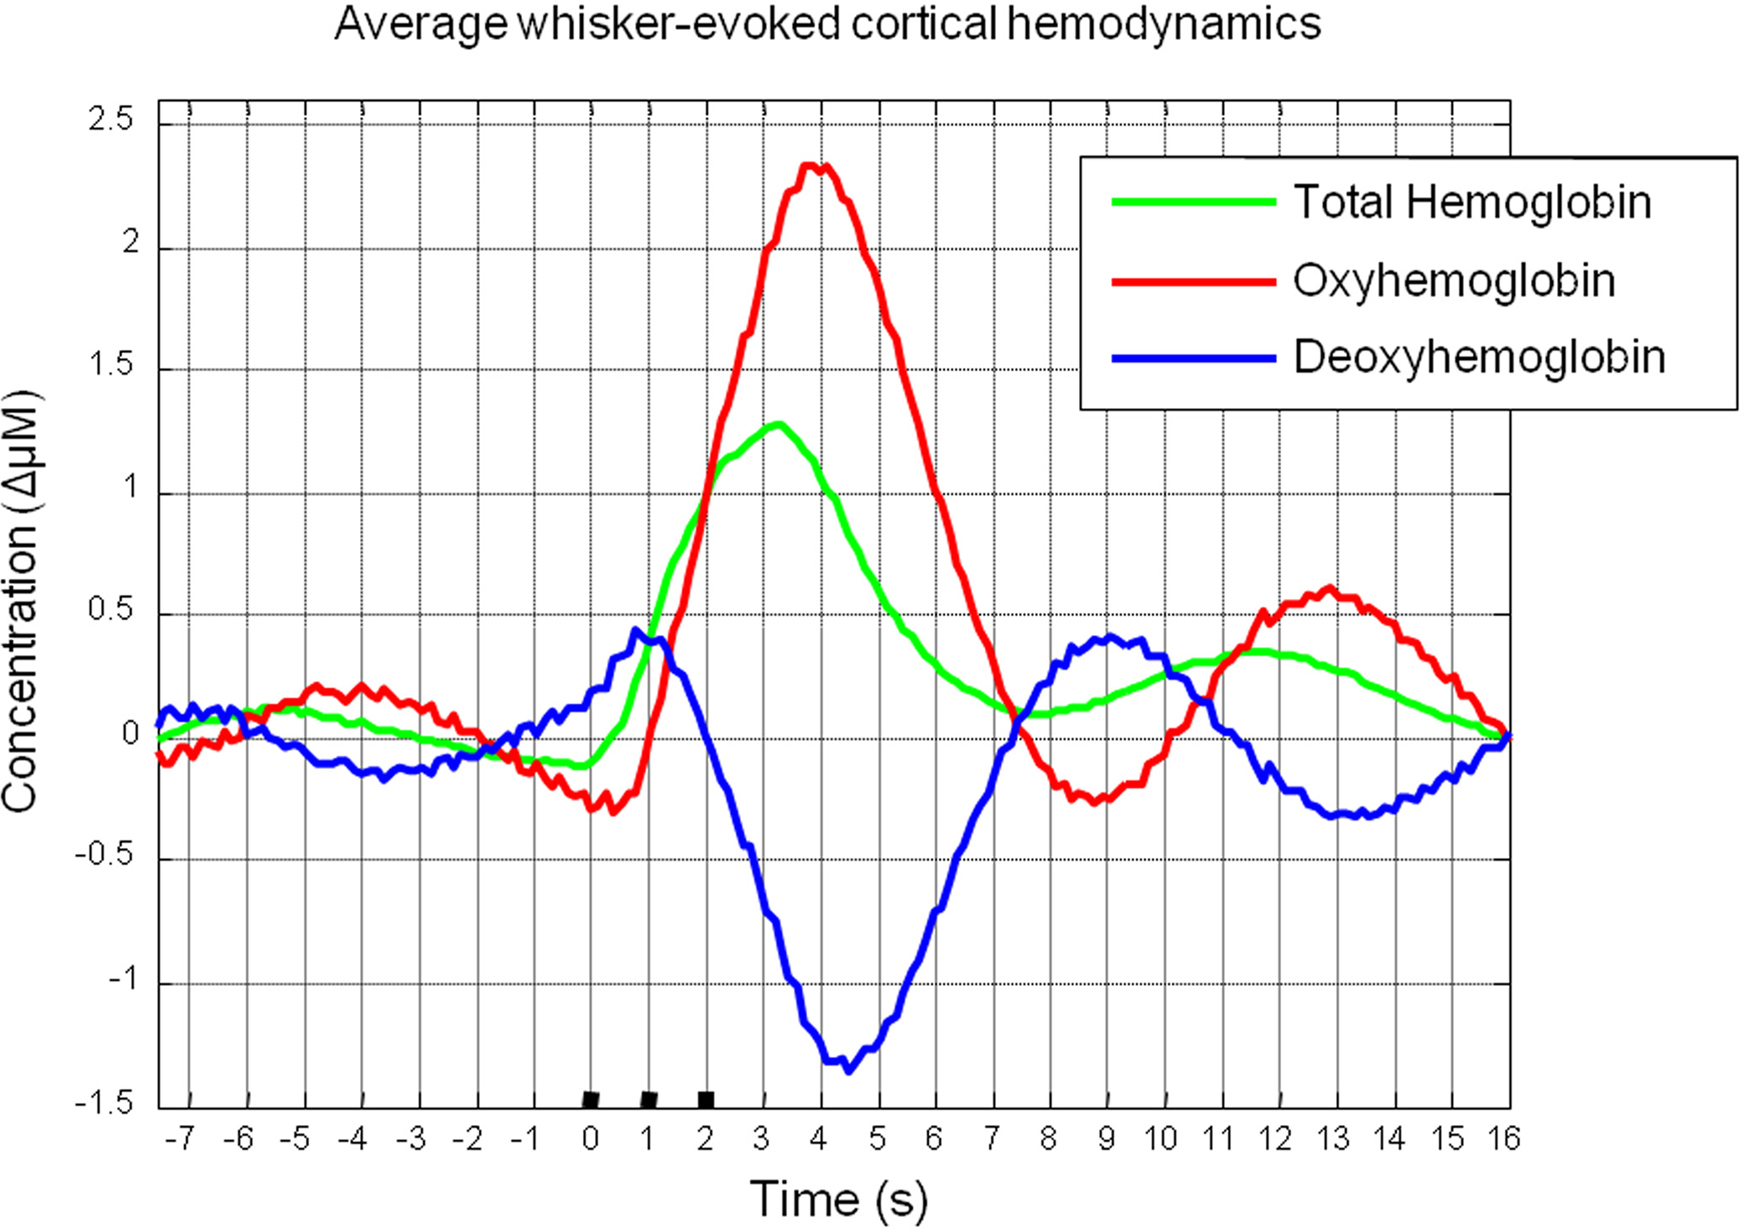
Figure 2. Mean cortical hemodynamics in response to sensory stimuli as measured by optical imaging spectroscopy. Changes in Total Hemoglobin (Hbt), oxyhemoglobin (HbO2) and deoxyhemoglobin (Hbr) following presentation of electrical whisker pad stimuli (3 s, 1 Hz, 1.2 mA).
Individual Trial Data Displays Inter-Trial Variability and Spontaneous Pre-Stimulus Fluctuations
However, examination of individual trials suggested that stimulus-evoked hemodynamic responses displayed considerable inter-trial variability (Figure 3). Twenty trials of the stimulus-evoked changes in hemodynamics from a single subject are shown for example (Figure 3). Individual trial data show variability in response magnitude and contain low frequency spontaneous fluctuations in the pre-stimulus “baseline” period. Indeed examination of trials in which stimuli were not presented reveals low frequency fluctuations in Hbt, HbO2 and Hbr (Figure 4A). The frequency of these low frequency fluctuations was ~0.1 Hz (Figure 4B) as previously reported (Mayhew et al., 1996; Spitzer et al., 2001; Majeed et al., 2009). Hbt fluctuations led those of HbO2, while HbO2 and Hbr were approximately in anti-phase (Figure 4A). It can be observed that hemodynamics contain low frequency fluctuations with higher frequency “noise” superimposed on the time series (Figures 4A,B). These higher frequency fluctuations are orders of magnitude lower than the predominant fluctuations at ~ 0.1 Hz (Figure 4C). The data were smoothed using a Savitzky–Golay filter with a 3rd order polynominal to remove higher frequency components from the data. It can be seen that this does not alter the phase, frequency or magnitude of the data (Figure 4C). It simply removes the higher frequency “noise” which is well outside the frequency range of the low frequency fluctuations (Figure 4) and therefore do not require more sophisticated removal techniques. The source of this higher frequency component is most likely to be due to breathing as animals are artificially respirated at a rate of between 1–2 Hz and in individual animals (e.g., Figure 4E) a peak at similar frequency (~1.2 Hz in this case) can be seen in the Fourier transform of both the end-tidal CO2 trace and the cortical hemodynamics.
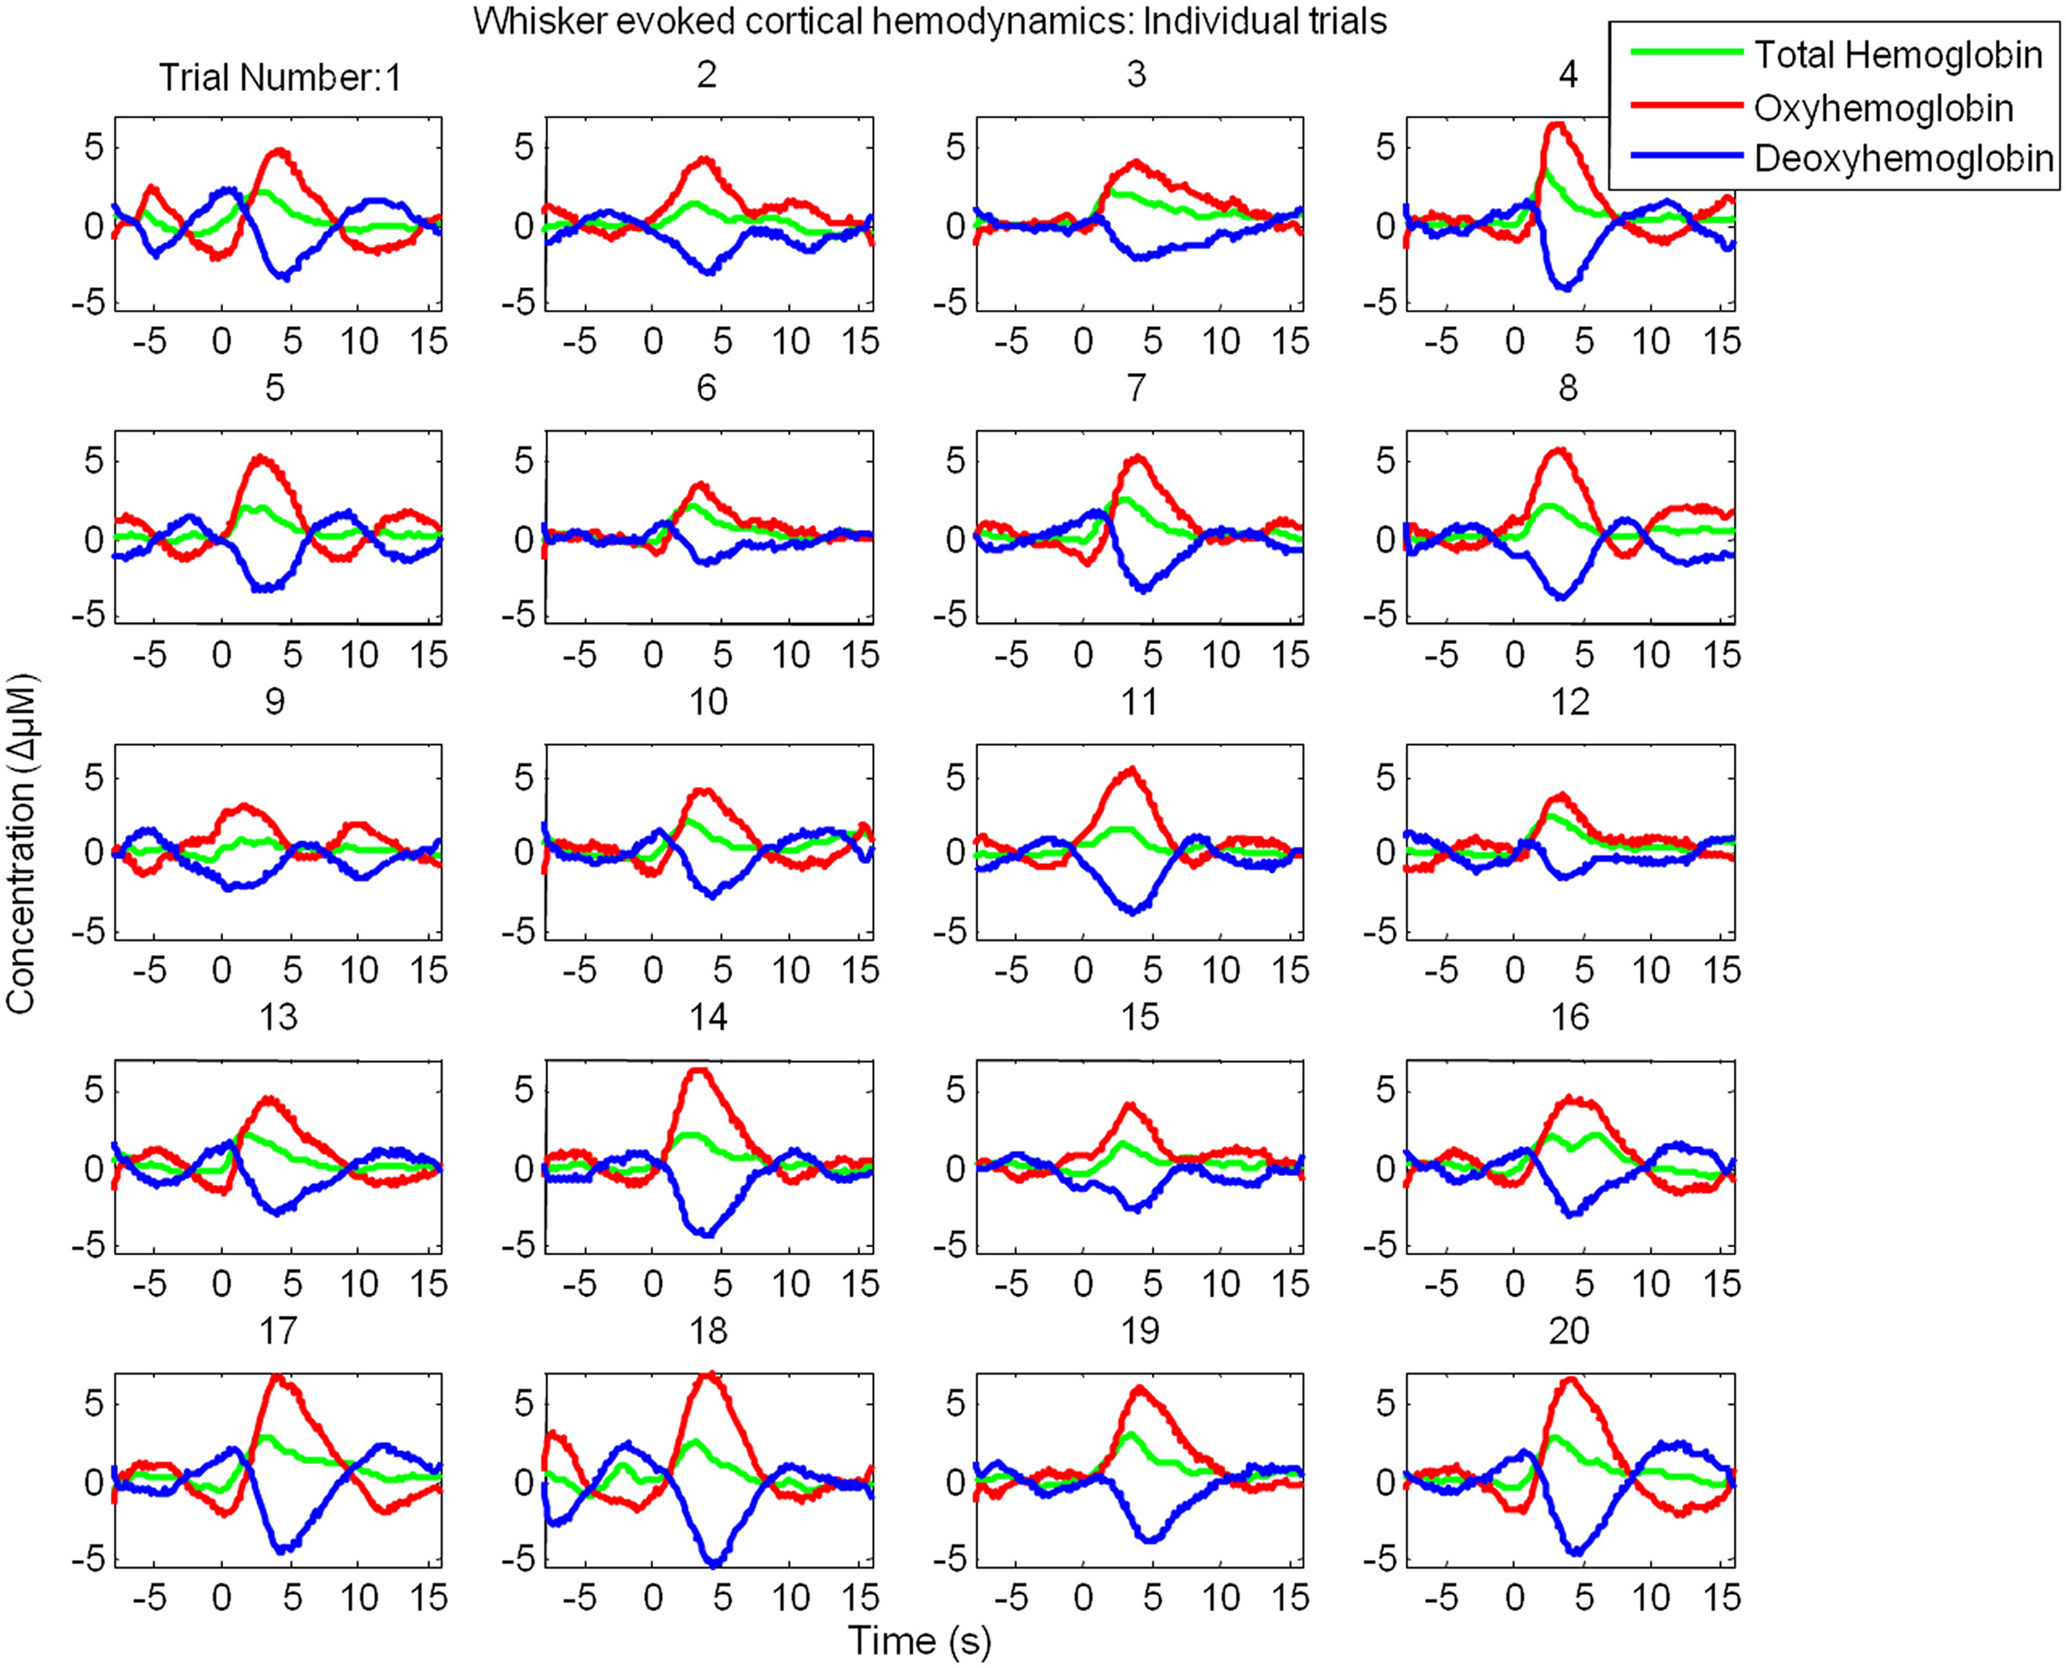
Figure 3. Cortical hemodynamic responses display considerable inter-trial variability. Twenty individual “un-averaged” trials of the changes in Total Hemoglobin (Hbt), oxyhemoglobin (HbO2) and deoxyhemoglobin (Hbr) following presentation of electrical whisker pad stimuli (3 s, 1 Hz, 1.2 mA) as measured by optical imaging spectroscopy.
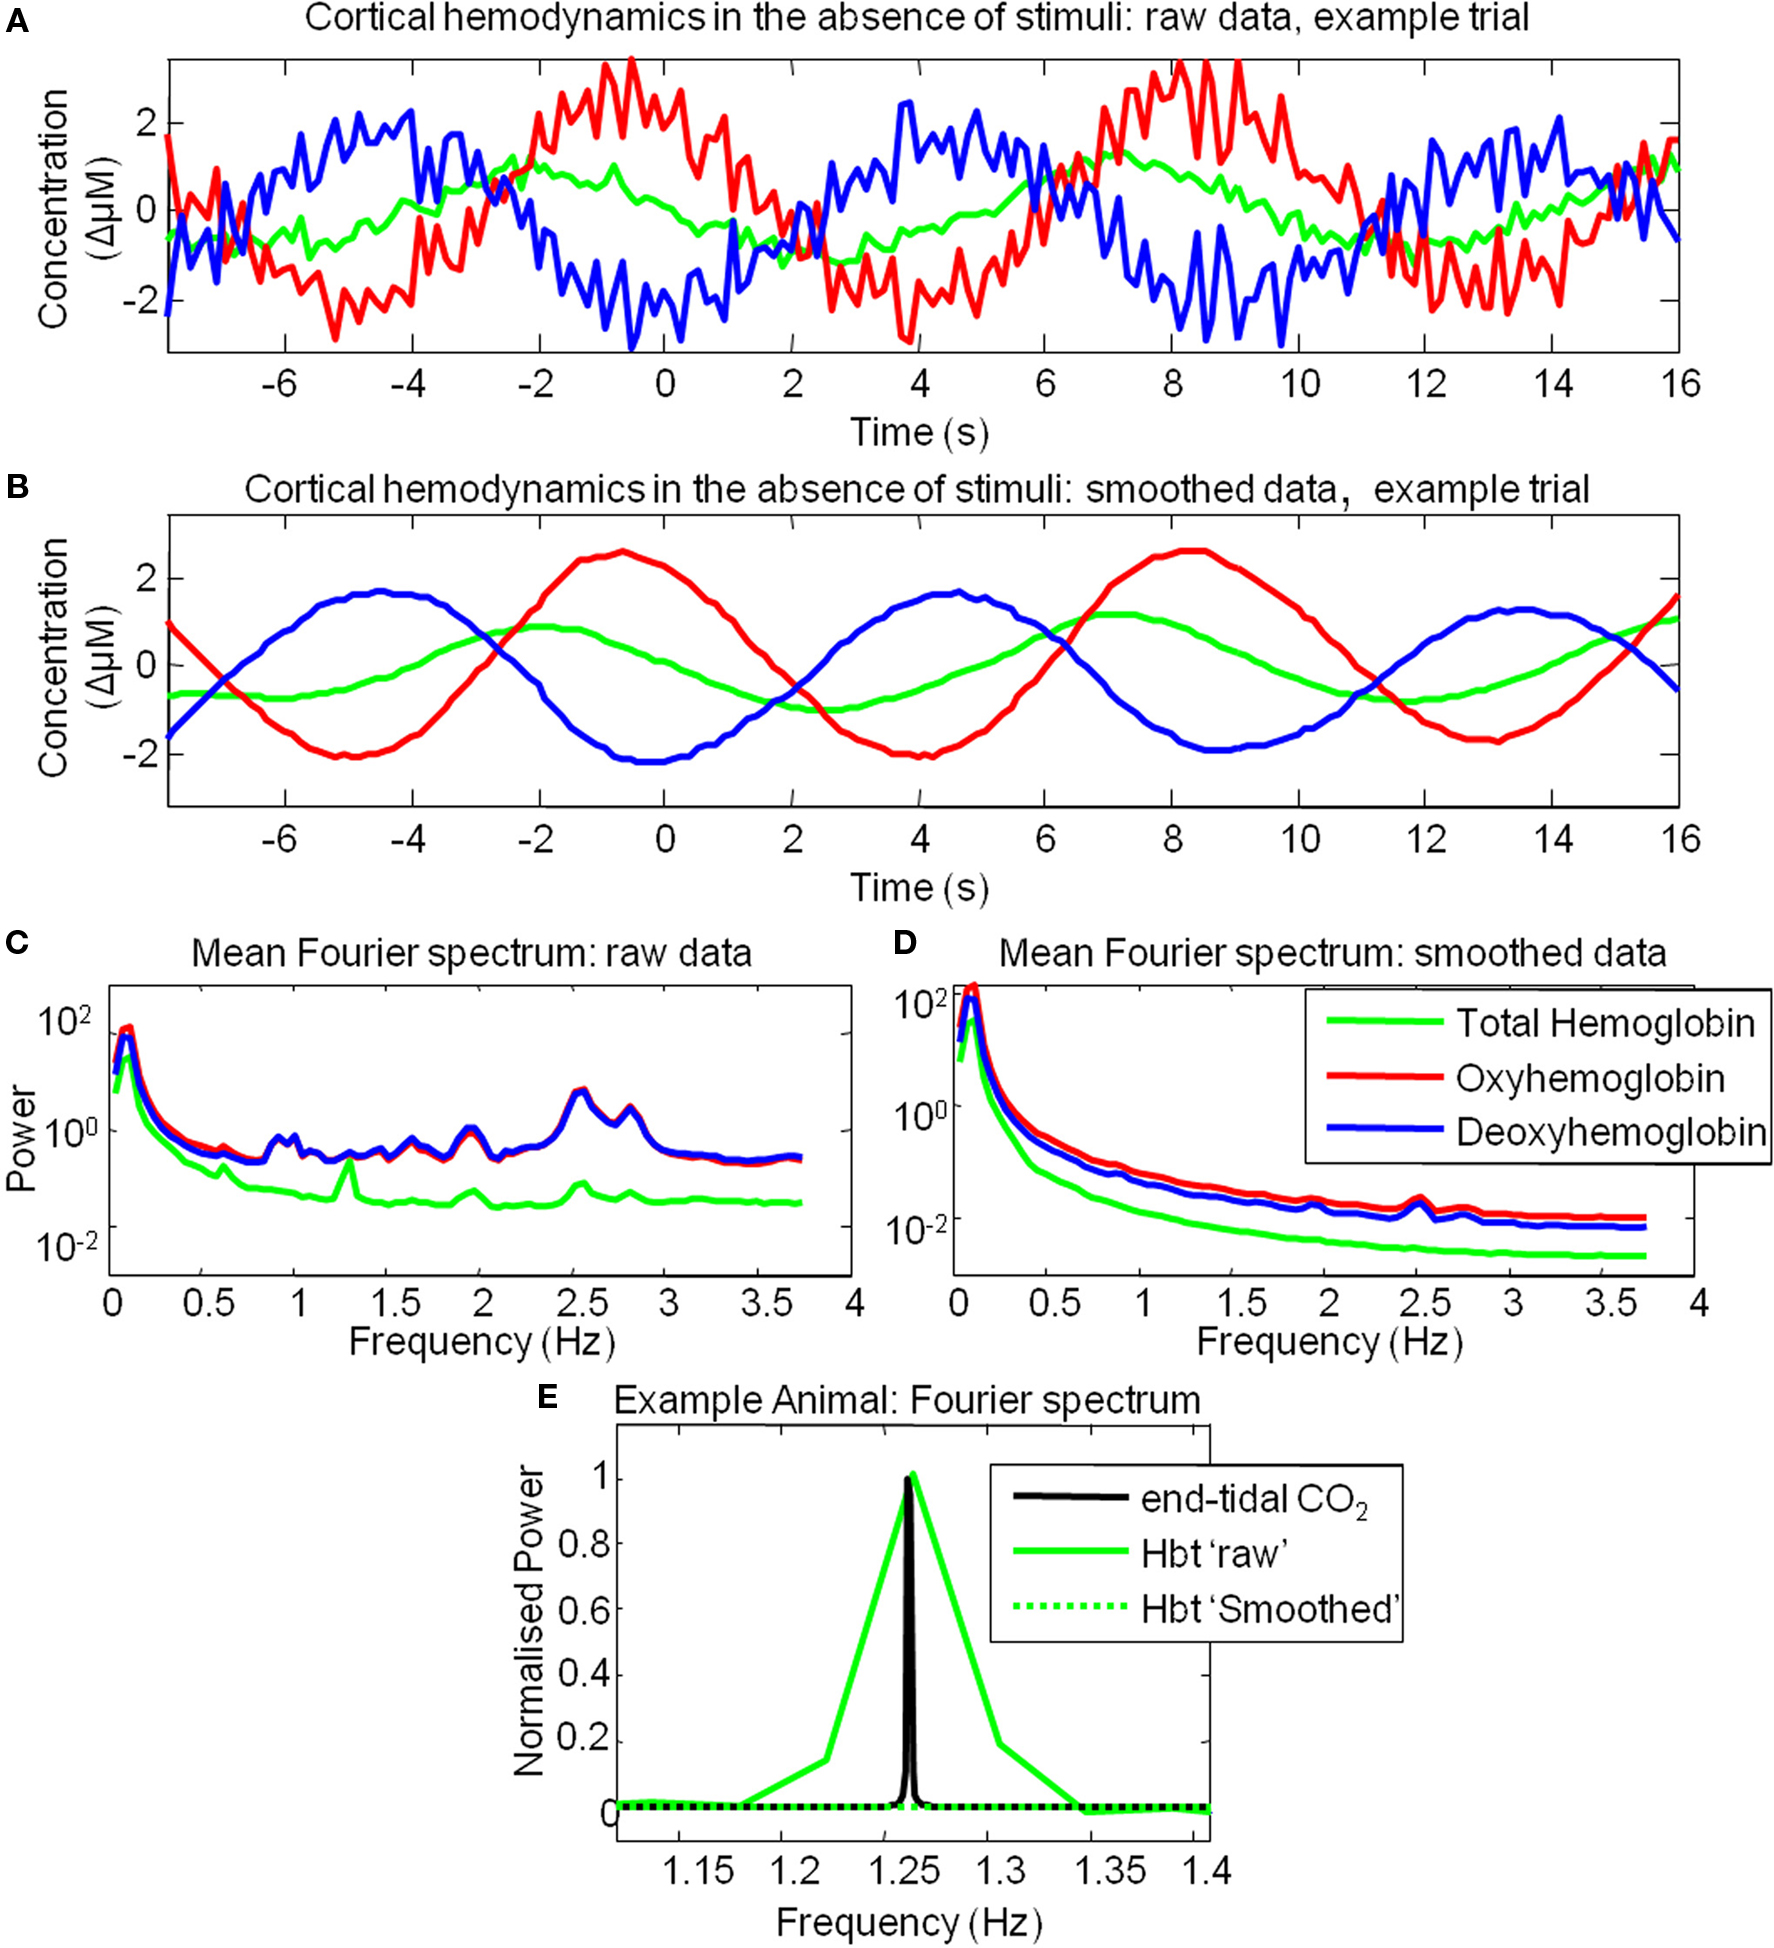
Figure 4. Cortical hemodynamics display low frequency fluctuations in the absence of stimulus presentation. (A) The time series of the changes in Total Hemoglobin (Hbt), oxyhemoglobin (HbO2) and deoxyhemoglobin (Hbr) from of a single example trial where stimulus was not presented. (B) The same data as (A) smoothed with a Savitzky–Golay filter. (C) Mean power spectra of all trials in which stimuli were not presented. (D) Mean power spectra of all trials in which stimuli were not presented following smoothing procedure. (E) Fourier spectrum of total Hbt and end-tidal PCO2 measurements from an example animal.
Averaging Trials According to the Phase of Spontaneous Pre-Stimulus Hemodynamic Fluctuations at Stimulus Onset
Data was examined on a trial by trial basis and grouped based on pre-stimulus hemodynamics. The question arises as to which metric of pre-stimulus hemodynamics to use to classify trials. As hemodynamic fluctuations are oscillatory in nature (Mayhew et al., 1996; Majeed et al., 2009) at any particular time point their time series could be classified by phase or magnitude. As an identical magnitude of hemodynamics could occur at two distinct phases (e.g., 0° and 180°), if trials were grouped based on the magnitude of hemodynamic activity at stimulus onset, information regarding whether the fluctuation was “rising” or “falling” at this time point would be lost. Therefore the metric of pre-stimulus hemodynamic activity chosen to “classify” individual trials, was their phase angle at stimulus onset. The Hilbert transform was used to calculate the phase of each data point of the pre-stimulus period of Hbt (Figure 5). The Hilbert transform is advantageous in that it can track the instantaneous phase of a time series even if the time series is not perfectly sinusoidal or periodic, from as little data as 3 data points. However, this means that this method could be relatively sensitive to noise. Notwithstanding, reasonable estimates of phase of the raw data can be obtained (Figure 5A) albeit with “noise” commensurate with that in the original time series and “difficulty” at some time points. As such, before the Hilbert transform was used to estimate phase the data was first smoothed using a Savitzky–Golay filter with a 3rd order polynominal to remove higher frequency components (Figures 4,5). Following filtering, it can clearly be seen that the Hilbert transform is accurately tracking the ongoing phase of the predominant 0.1 Hz component (Figure 5D).
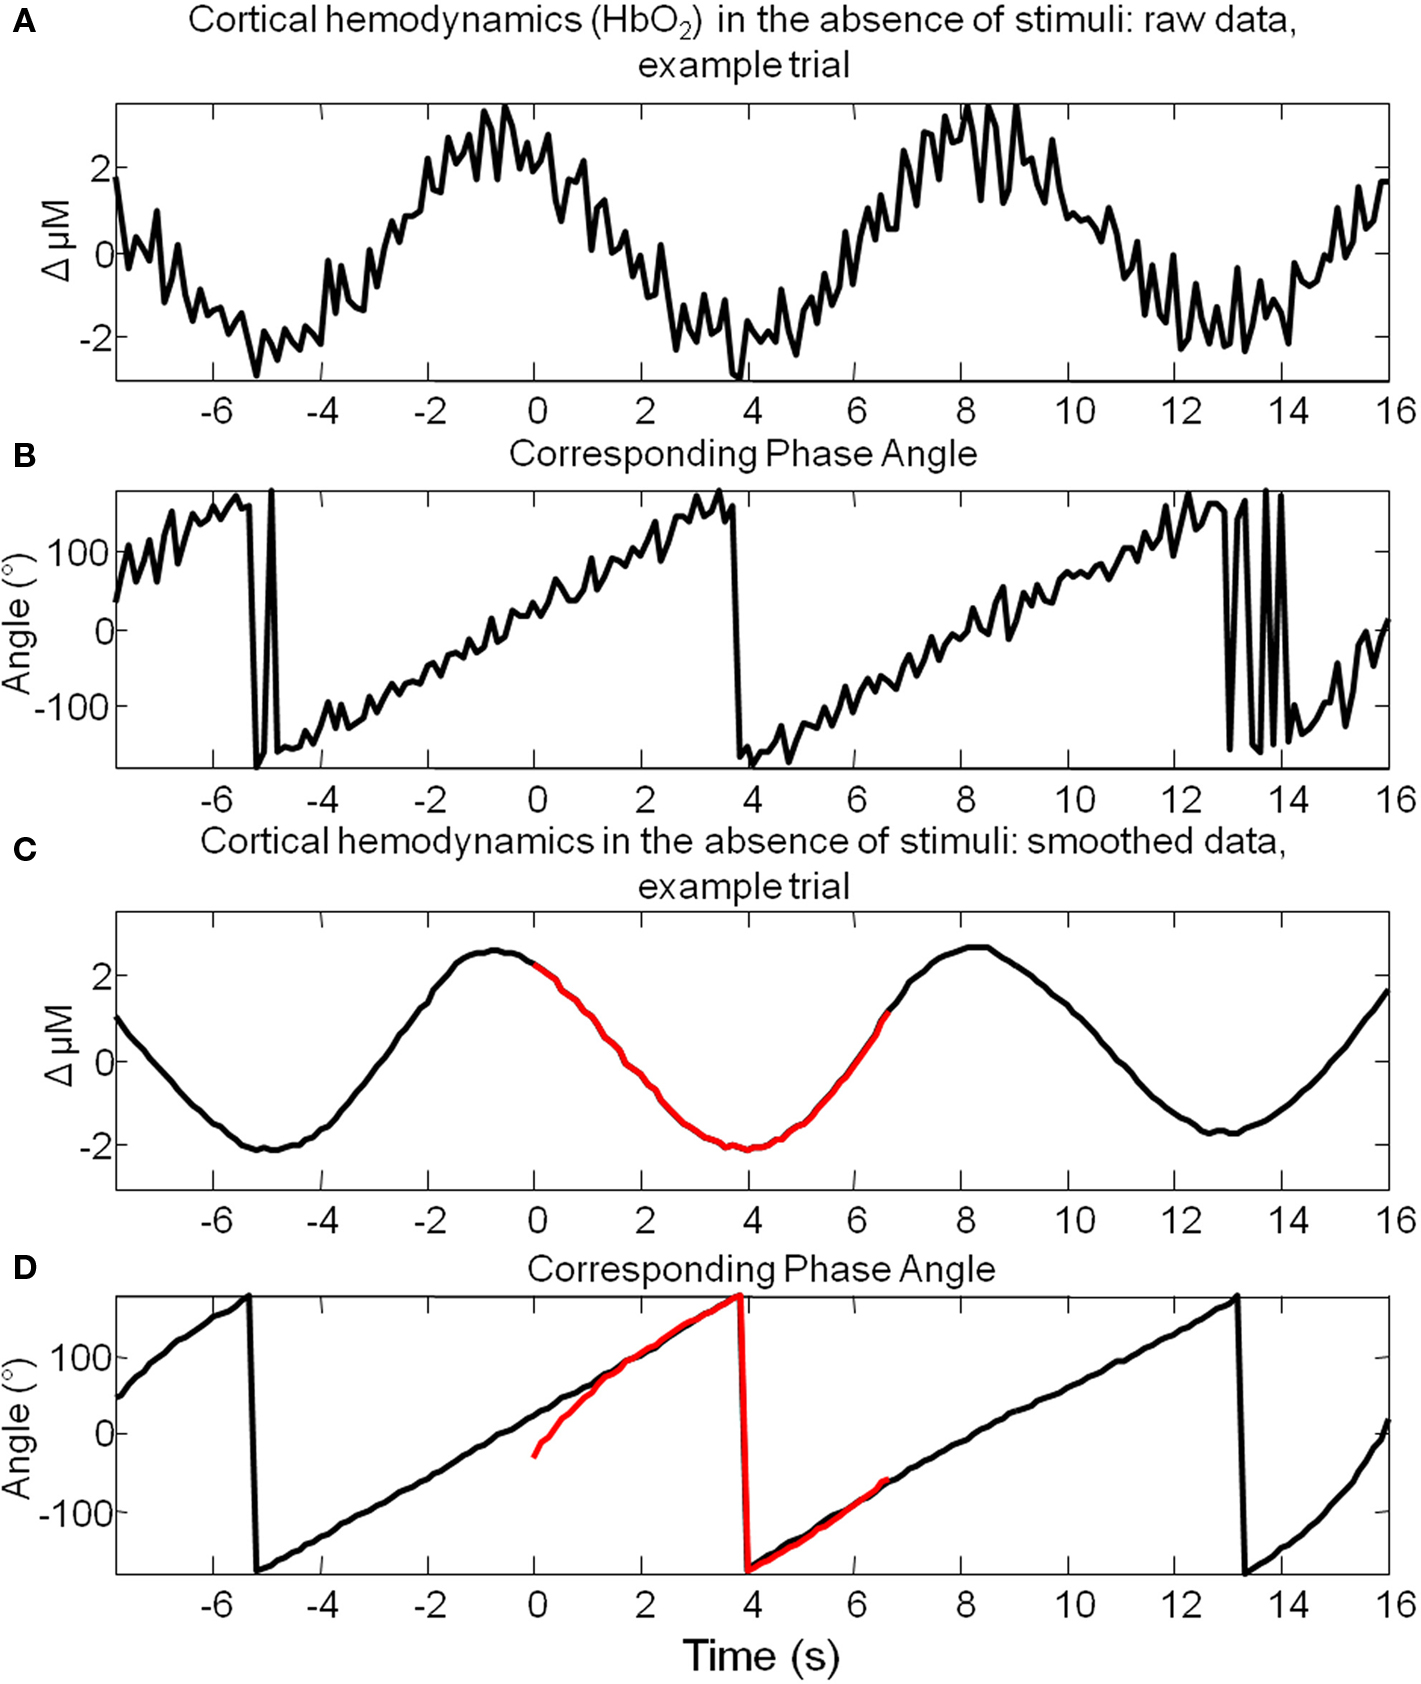
Figure 5. Hilbert transform allows estimation of the instantaneous phase of spontaneous cortical hemodynamic fluctuations. (A) The time series of the changes in oxyhemoglobin (HbO2) from a single example trial where stimuli were not presented. (B) The phase angle for each time point of the data presented in (A) calculated using the Hilbert transform. (C) The same data as that presented in (A), smoothed with a Savitzky–Golay filter. (D) The phase angle for each time point of the data presented in (C) calculated using the Hilbert transform. A small section of (C) is highlighted in red and the phase calculated from these time points alone is highlighted in red in (D). This suggests that a commensurate estimate of phase can be obtained after tracking only several seconds of data to that obtained by tracking the phase of the data for 8 s preceding these time points.
A total of 1404 trials were taken from six animals and were ranked according to their phase at the time point of stimulus onset. Phase was calculated for the 8-s pre-stimulus period for each trial. To demonstrate this was a sufficient time period to reliably estimate the phase at the time point of stimulus onset, an 8-s subsection of a longer time series is shown (highlighted in red Figure 5C). After several seconds (~2 s) the estimate of phase for this segment (Figure 5D) is similar than that obtained by tracking the phase of the time series preceding this segment. This suggests that 8 s is a sufficient time period to estimate the phase of these fluctuations. Trials regardless of subject origin were then assigned to one of four groups according to the phase angle of the spontaneous hemodynamic fluctuations (0°–90°; 90°–180°; 180°–270°; 270°–360°) in Hbt at the single time point before stimulus onset. Examination of the pre-stimulus time series in each of the phase groups suggests that the analysis procedure is effective (Figure 6B) in that each mean phase averaged time series differs from one another and appears to display an expected appropriate time course. To illustrate this further an artificial sine wave is shown for comparison (Figure 6A). Furthermore this averaging procedure does not alter the frequency of the low frequency components as the Fourier spectrum of the pre-stimulus phase averaged time series is similar to that observed for data collected in the absence of stimuli (Figure 6C compared to Figure 4C).
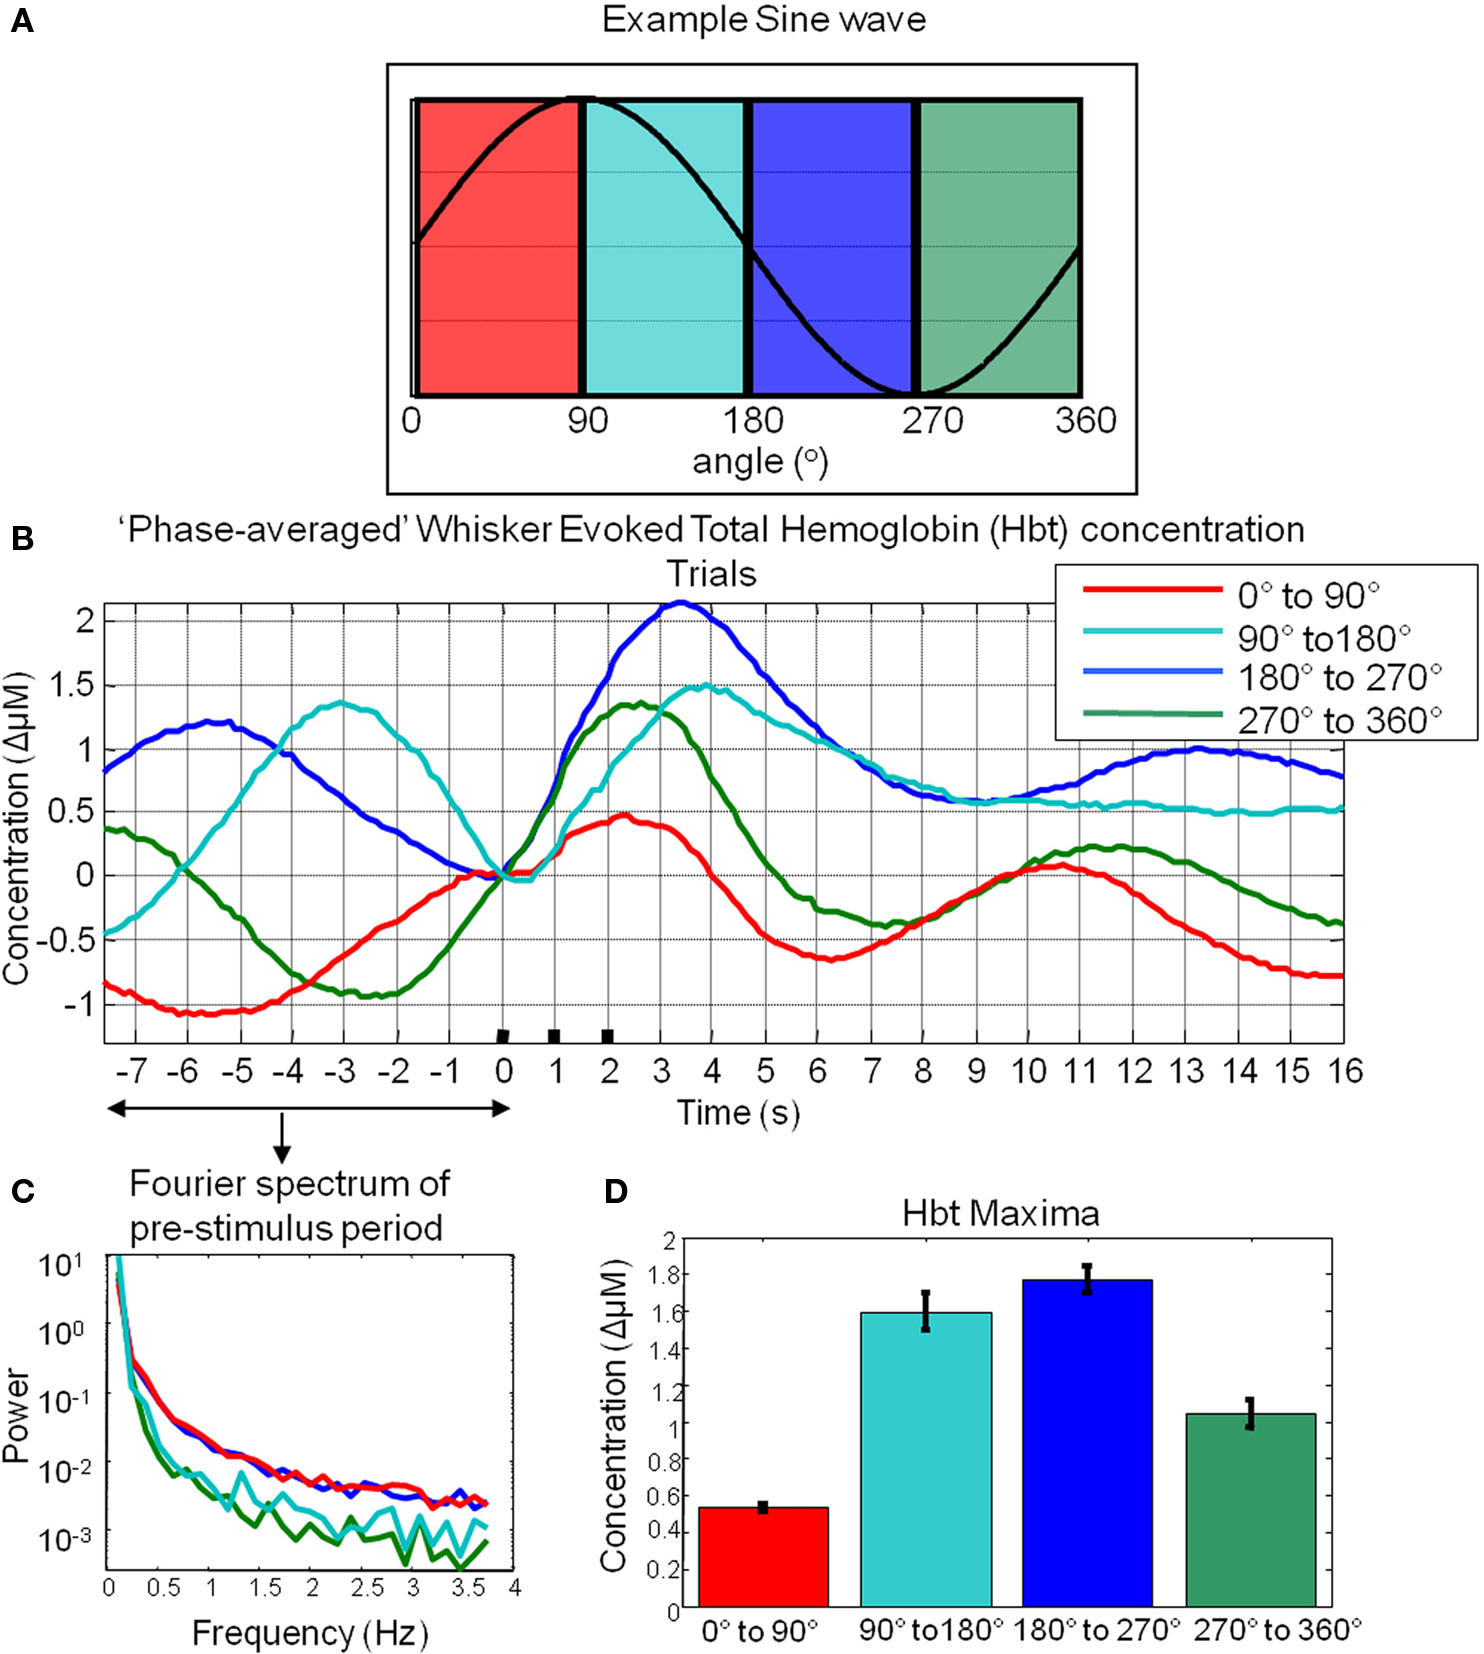
Figure 6. Cortical total hemoglobin responses to sensory stimuli. (A) An artificial sine wave with respect to angle in degrees is shown for reference. (B) Hbt responses to sensory stimuli were grouped based on the phase of their pre-stimulus fluctuations at stimulus onset and averaged. (C) Power spectra of pre-stimulus fluctuations following phase averaging procedure. (D) Mean maxima of Hbt changes evoked by sensory stimuli depending on the phase of pre-stimulus fluctuations at stimulus onset.
Subsequent “phase-averaged” total hemoglobin responses evoked by sensory stimuli were of differing magnitudes (Figure 6D). The magnitude of the stimulus-evoked increases in Hbt was smallest in the 0°–90° group, followed by in the 270°–360° group and 90°–180° group and was largest in the 180°–270° group (Figure 6). Trials were treated as subjects for statistical analyses. An independent groups ANOVA suggested that Hbt maxima differed significantly in these phase groups (F = 86.614, df error = 1284, p = 0.000). Bonferroni corrected post hoc tests suggested the Hbt maxima in each phase group differed significantly (p = 0.000) from one another apart from between the 90°–180°group and the 180°–270° group (p = 0.520).
“Null” Trials in Which Stimuli were Not Presented
To investigate the possible origin of this phenomenon, data from trials in which no stimuli were presented were also averaged based on the phase of their Hbt fluctuations at a time point that corresponded to stimulus onset (8 s in each trial) in the stimulus presentation trials. This resulted in phase averaged time series that were identical to phase averaged stimulus-evoked responses during the “pre-stimulus” period (compare Figure 7A and Figure 7B). However, the time series differed after stimulus presentation with the phase averaged null trials providing an indication of the average “behavior” of the hemodynamics for each phase group had a stimulus not occurred. In the case of the phase averaged “null” trials there appears to be a slight dampening of the fluctuations after a certain period (approximately 10 s). This is because the fluctuations are not perfectly sinusoidal and periodic and as such, averaging trials together that are grouped for phase at a certain time point does not result in an infinite time series of unvarying amplitude. To investigate whether the differences in stimulus-evoked responses in each phase group were due to superposition of ongoing and evoked hemodynamics, phase averaged “nulls” were subtracted from phase averaged stimulus-evoked responses. This subtraction resulted in four similar time series that closely resembled the time series of the mean of all trials without phase averaging (Figure 7C). Slight differences between the “phase averaged responses” and the mean response may have been due to non-identical trial numbers in each of the phase groups. Similar phenomenon could be observed in the other components of the hemodynamic response as measured by optical imaging spectroscopy, oxyhemoglobin (HbO2, Figure 8A) and deoxyhemoglobin (Hbr, Figure 9A). When changes in oxyhemoglobin concentration were averaged on the basis of their phase at stimulus onset they also displayed differences in magnitudes (Figure 8). Likewise, subtraction of phase averaged HbO2 null trials from phase averaged stimulus-evoked trials also resulted in four similar time series. A commensurate phenomenon was observed for changes in Hbr (Figure 9).
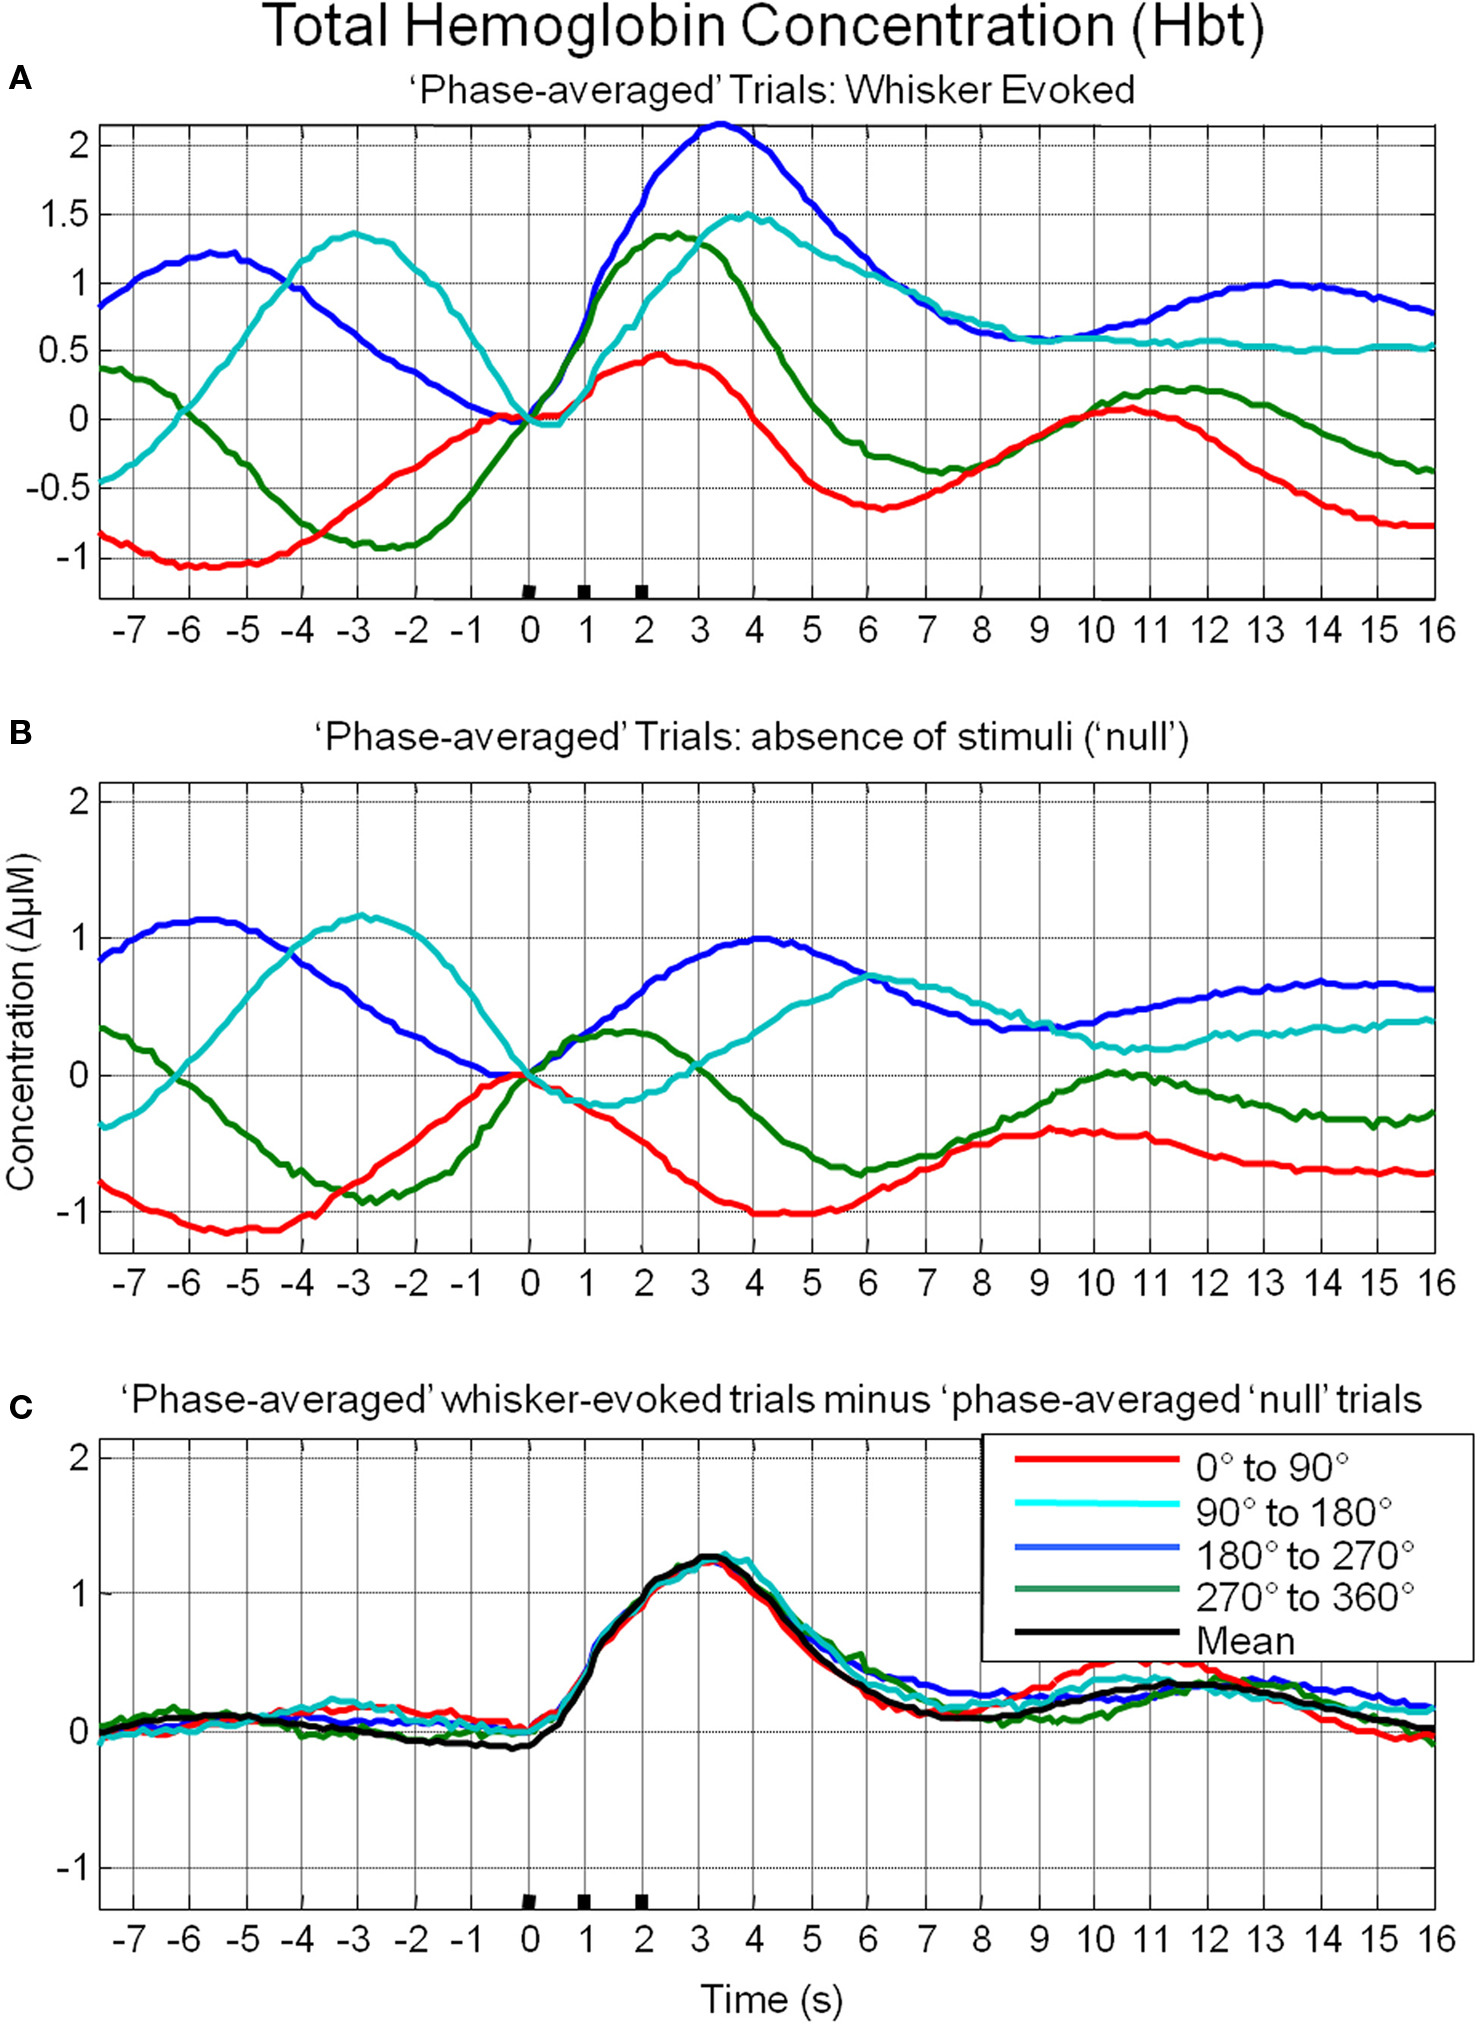
Figure 7. Linear superposition of sensory-evoked and ongoing cortical total hemoglobin concentration changes (Hbt). (A) Hbt responses to sensory stimuli were grouped based on the phase of their pre-stimulus fluctuations at stimulus onset and averaged. (B) Hbt trial data without presentation of sensory stimuli (“nulls”) are grouped based on the phase of their pre-stimulus fluctuations at the same time point within each trial and averaged. (C) Subtraction of the phase averaged stimulus-evoked responses from their phase averaged null counterpart results in four similar time series.
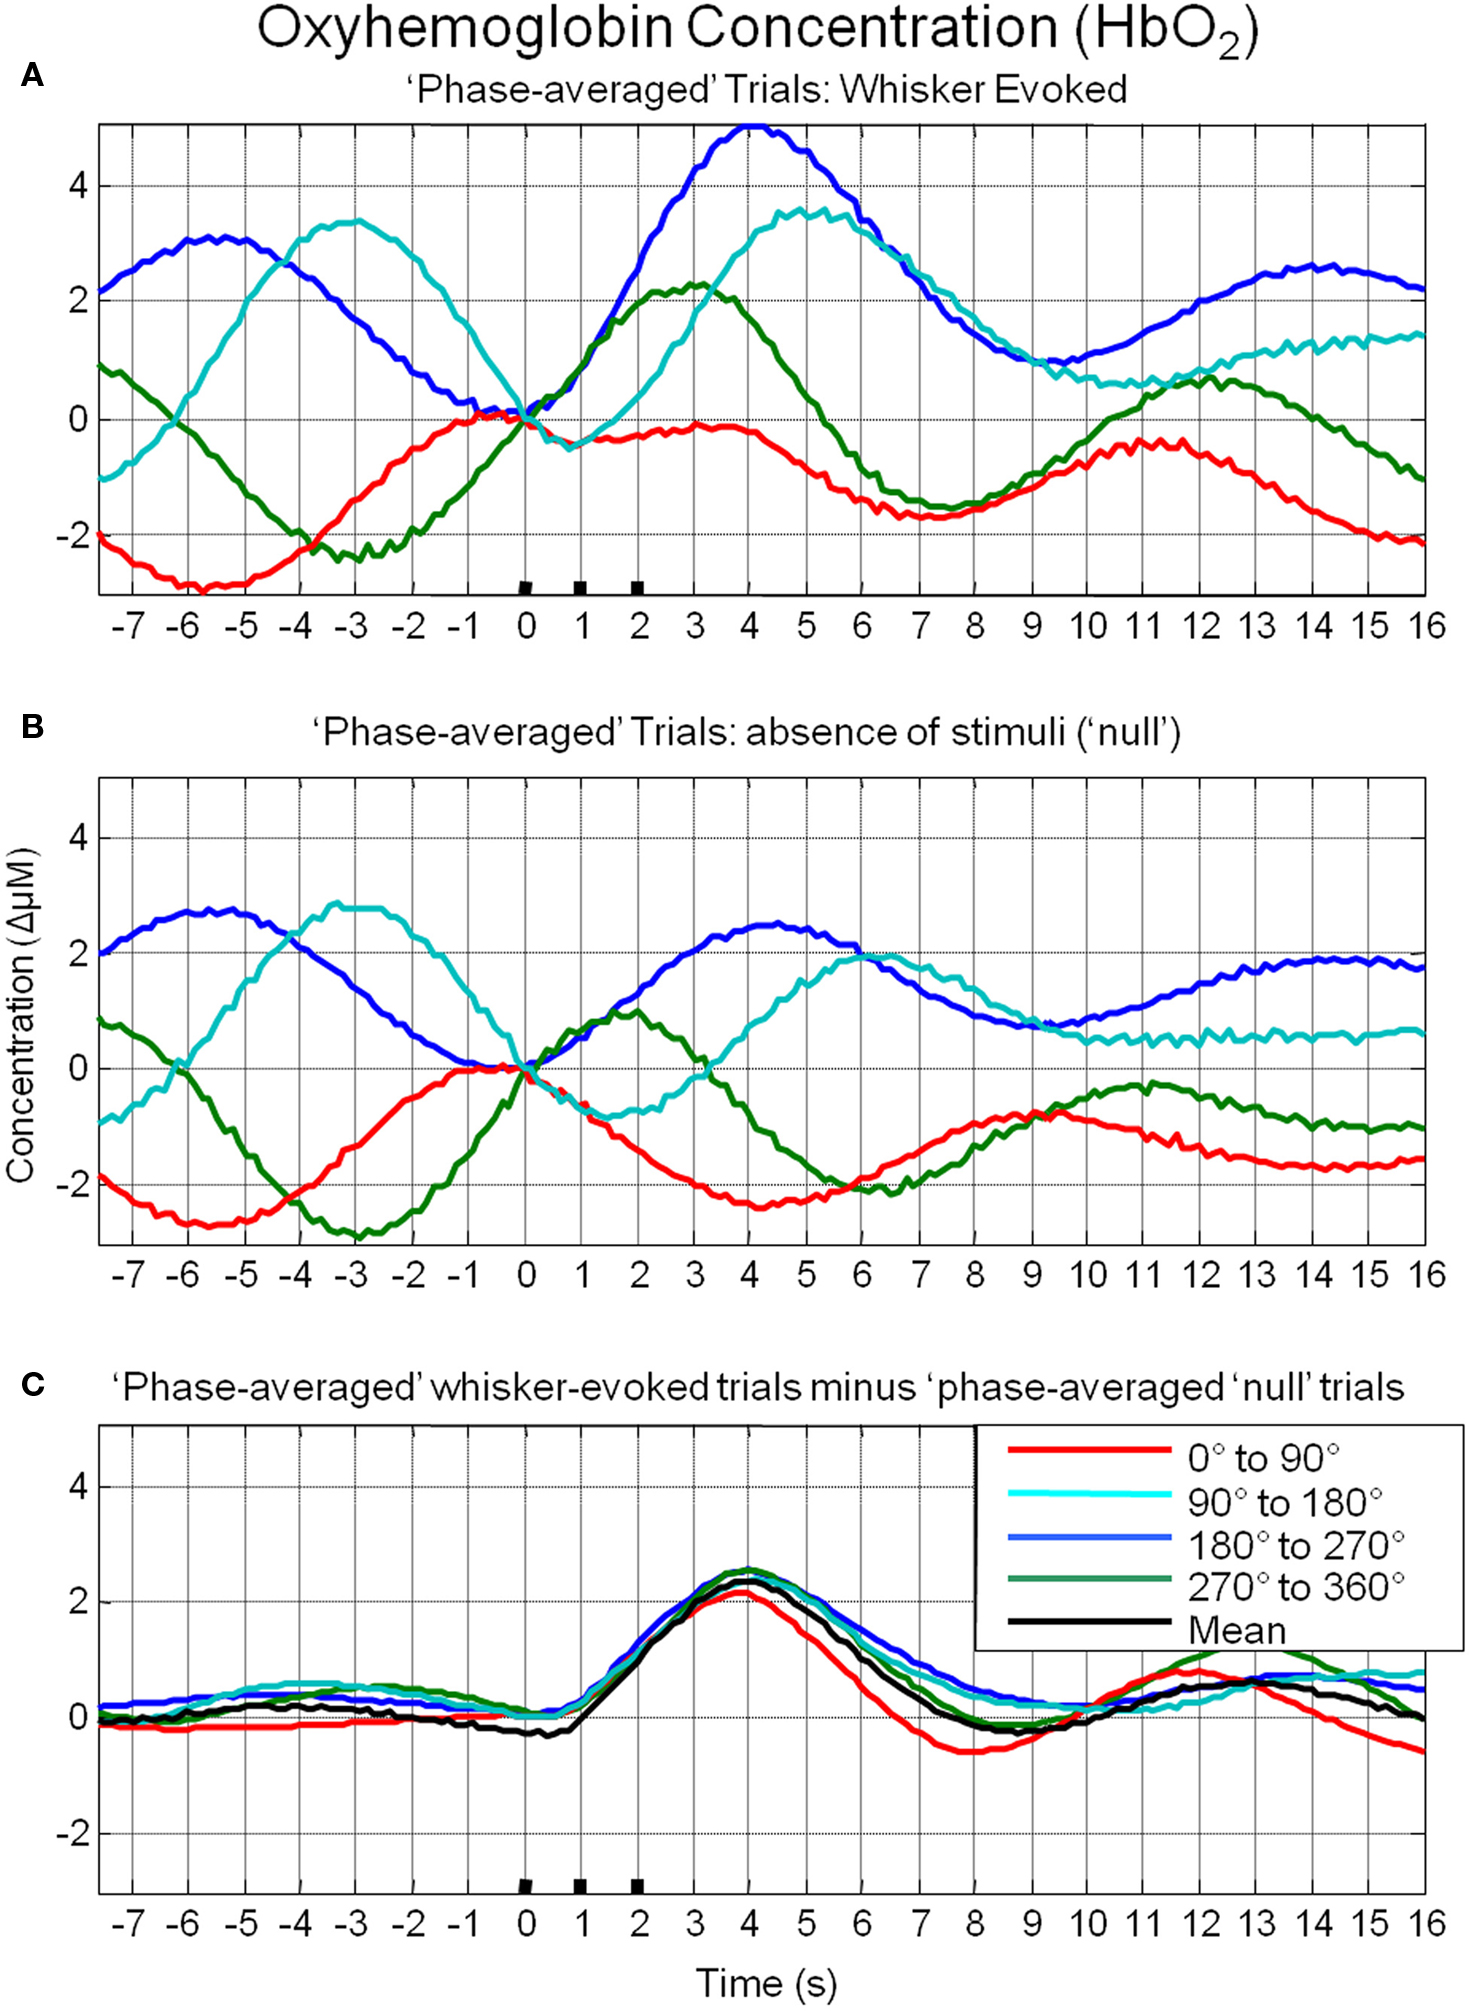
Figure 8. Linear superposition of sensory-evoked and ongoing cortical oxyhemoglobin concentration changes (HbO2). (A) HbO2 responses to sensory stimuli were grouped based on the phase of their pre-stimulus fluctuations at stimulus onset and averaged. (B) HbO2 trial data without presentation of sensory stimuli (“nulls”) are grouped based on the phase of their pre-stimulus fluctuations at the same time point within each trial and averaged. (C) Subtraction of the phase averaged stimulus-evoked responses from their phase averaged null counterpart results in four similar time series.
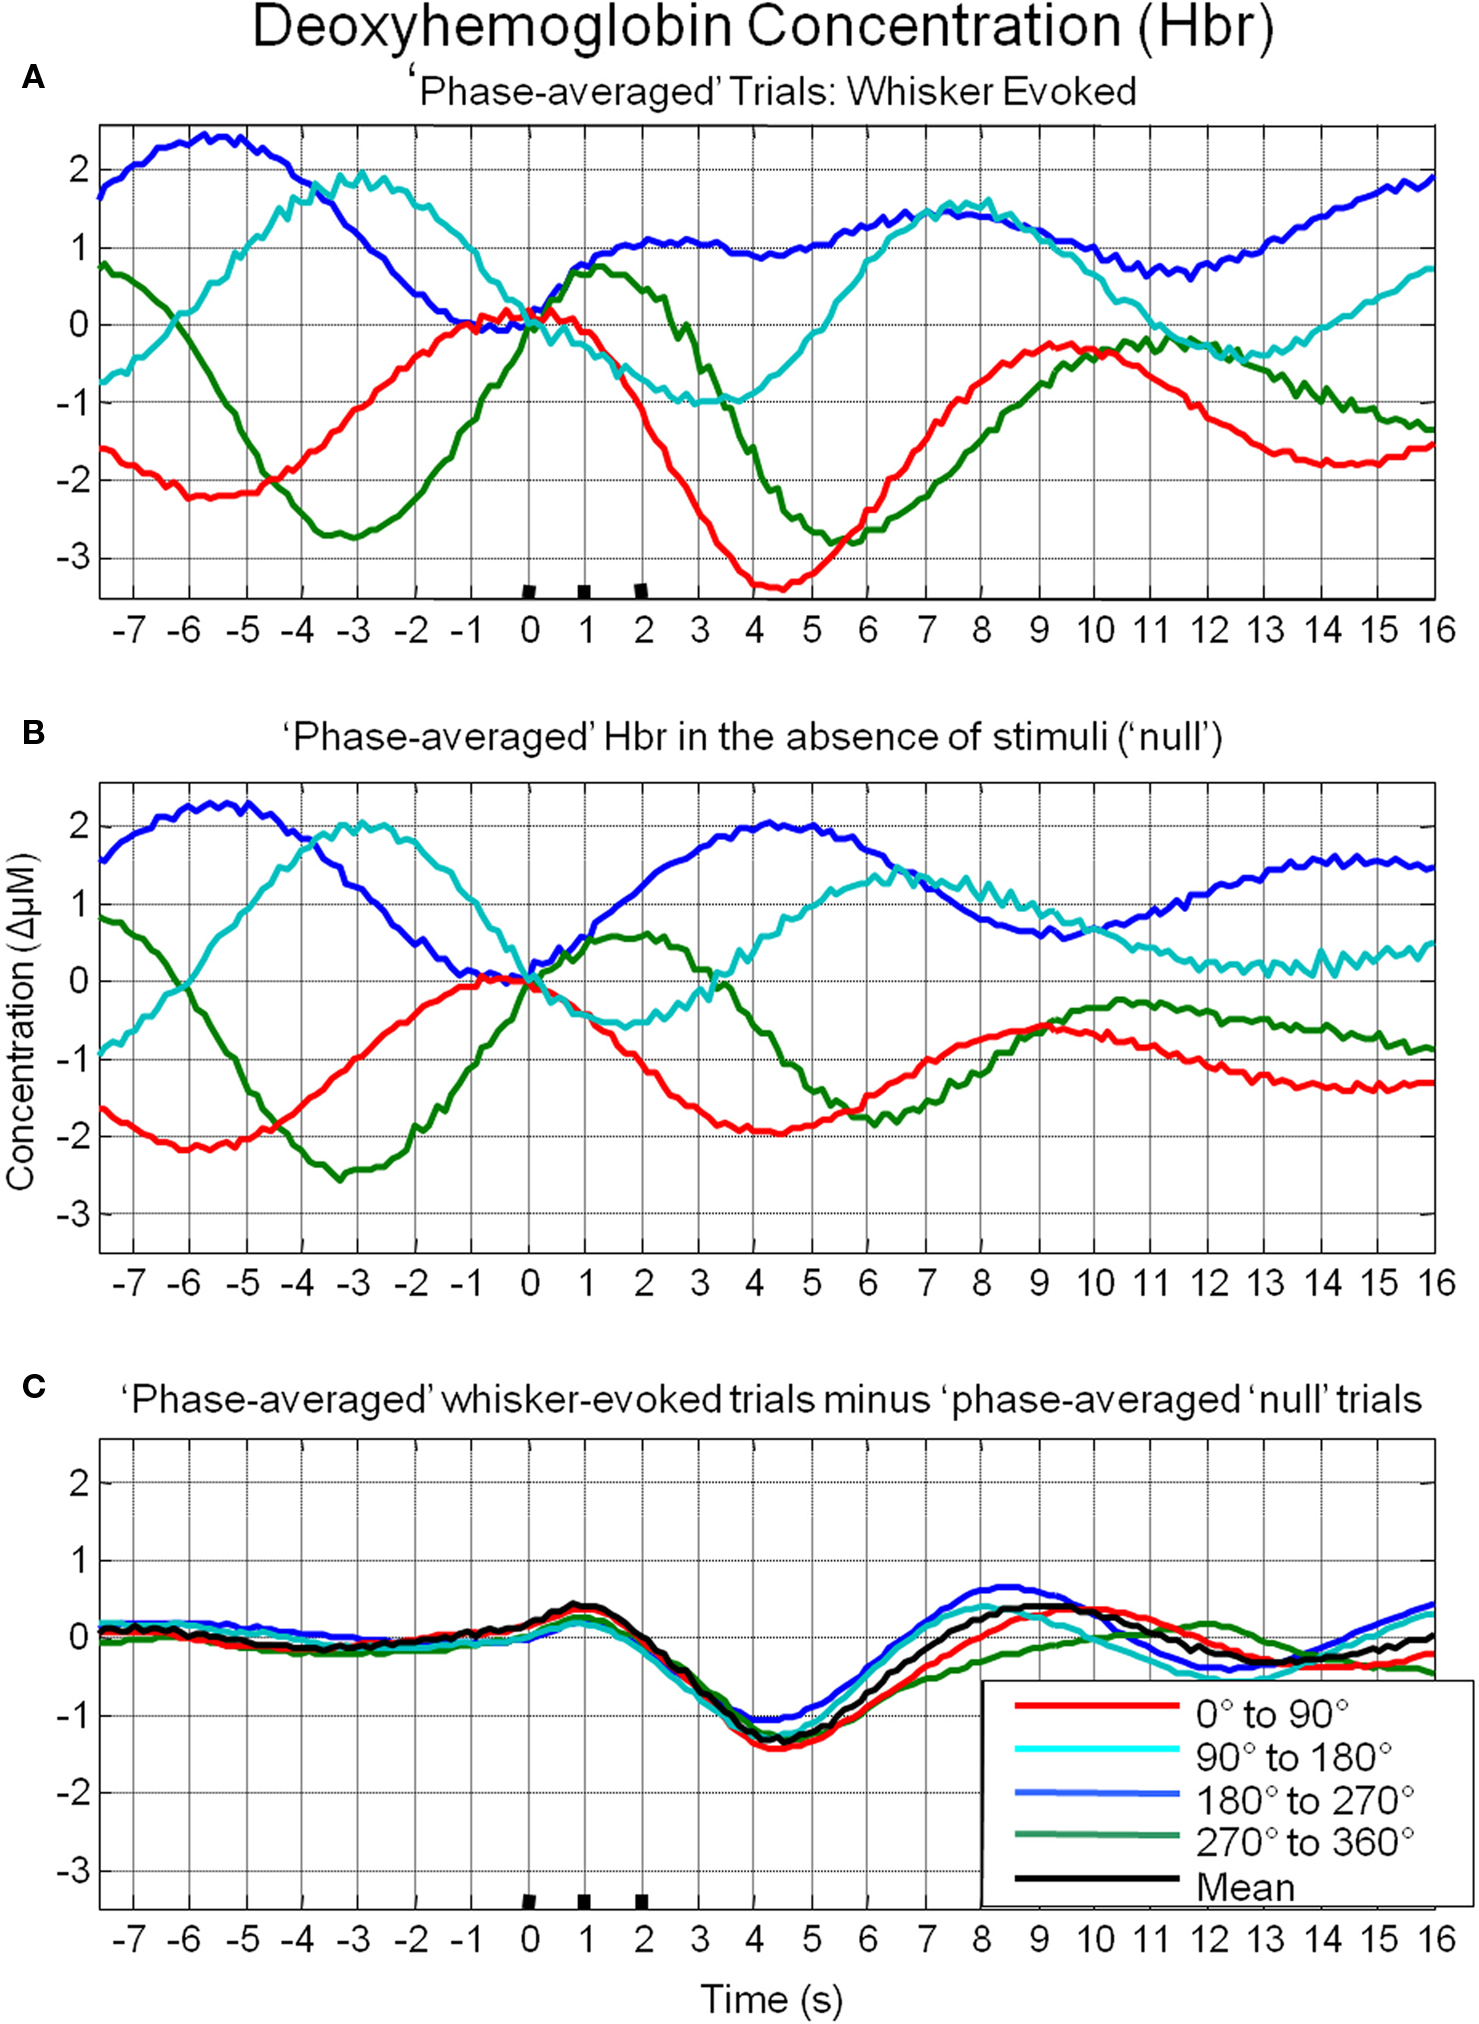
Figure 9. Linear superposition of sensory-evoked and ongoing cortical deoxyhemoglobin concentration changes (Hbr). (A) Hbr responses to sensory stimuli were grouped based on the phase of their pre-stimulus fluctuations at stimulus onset and averaged. (B) Hbr trial data without presentation of sensory stimuli (“nulls”) are grouped based on the phase of their pre-stimulus fluctuations at the same time point within each trial and averaged. (C) Subtraction of the phase averaged stimulus-evoked responses from their phase averaged null counterpart results in four similar time series.
An additional analysis was performed to investigate whether these phenomena were due to simply averaging subsets of trials rather than the suggested averaging of trials based on their phase at stimulus onset (Figure 10). Trials were randomly allocated to four groups and averaged. It can be clearly seen that in case of stimulus-evoked responses, group averaging resulted in four similar time series that closely resembled the mean of all trials. In the case of trials where stimuli were not presented, this resulted in time series in which little remnants of spontaneous fluctuations remained. Unsurprisingly, subtraction of the phase averaged stimulus-evoked responses from their phase averaged null counterparts produced little alteration of the “group-averaged” time series.
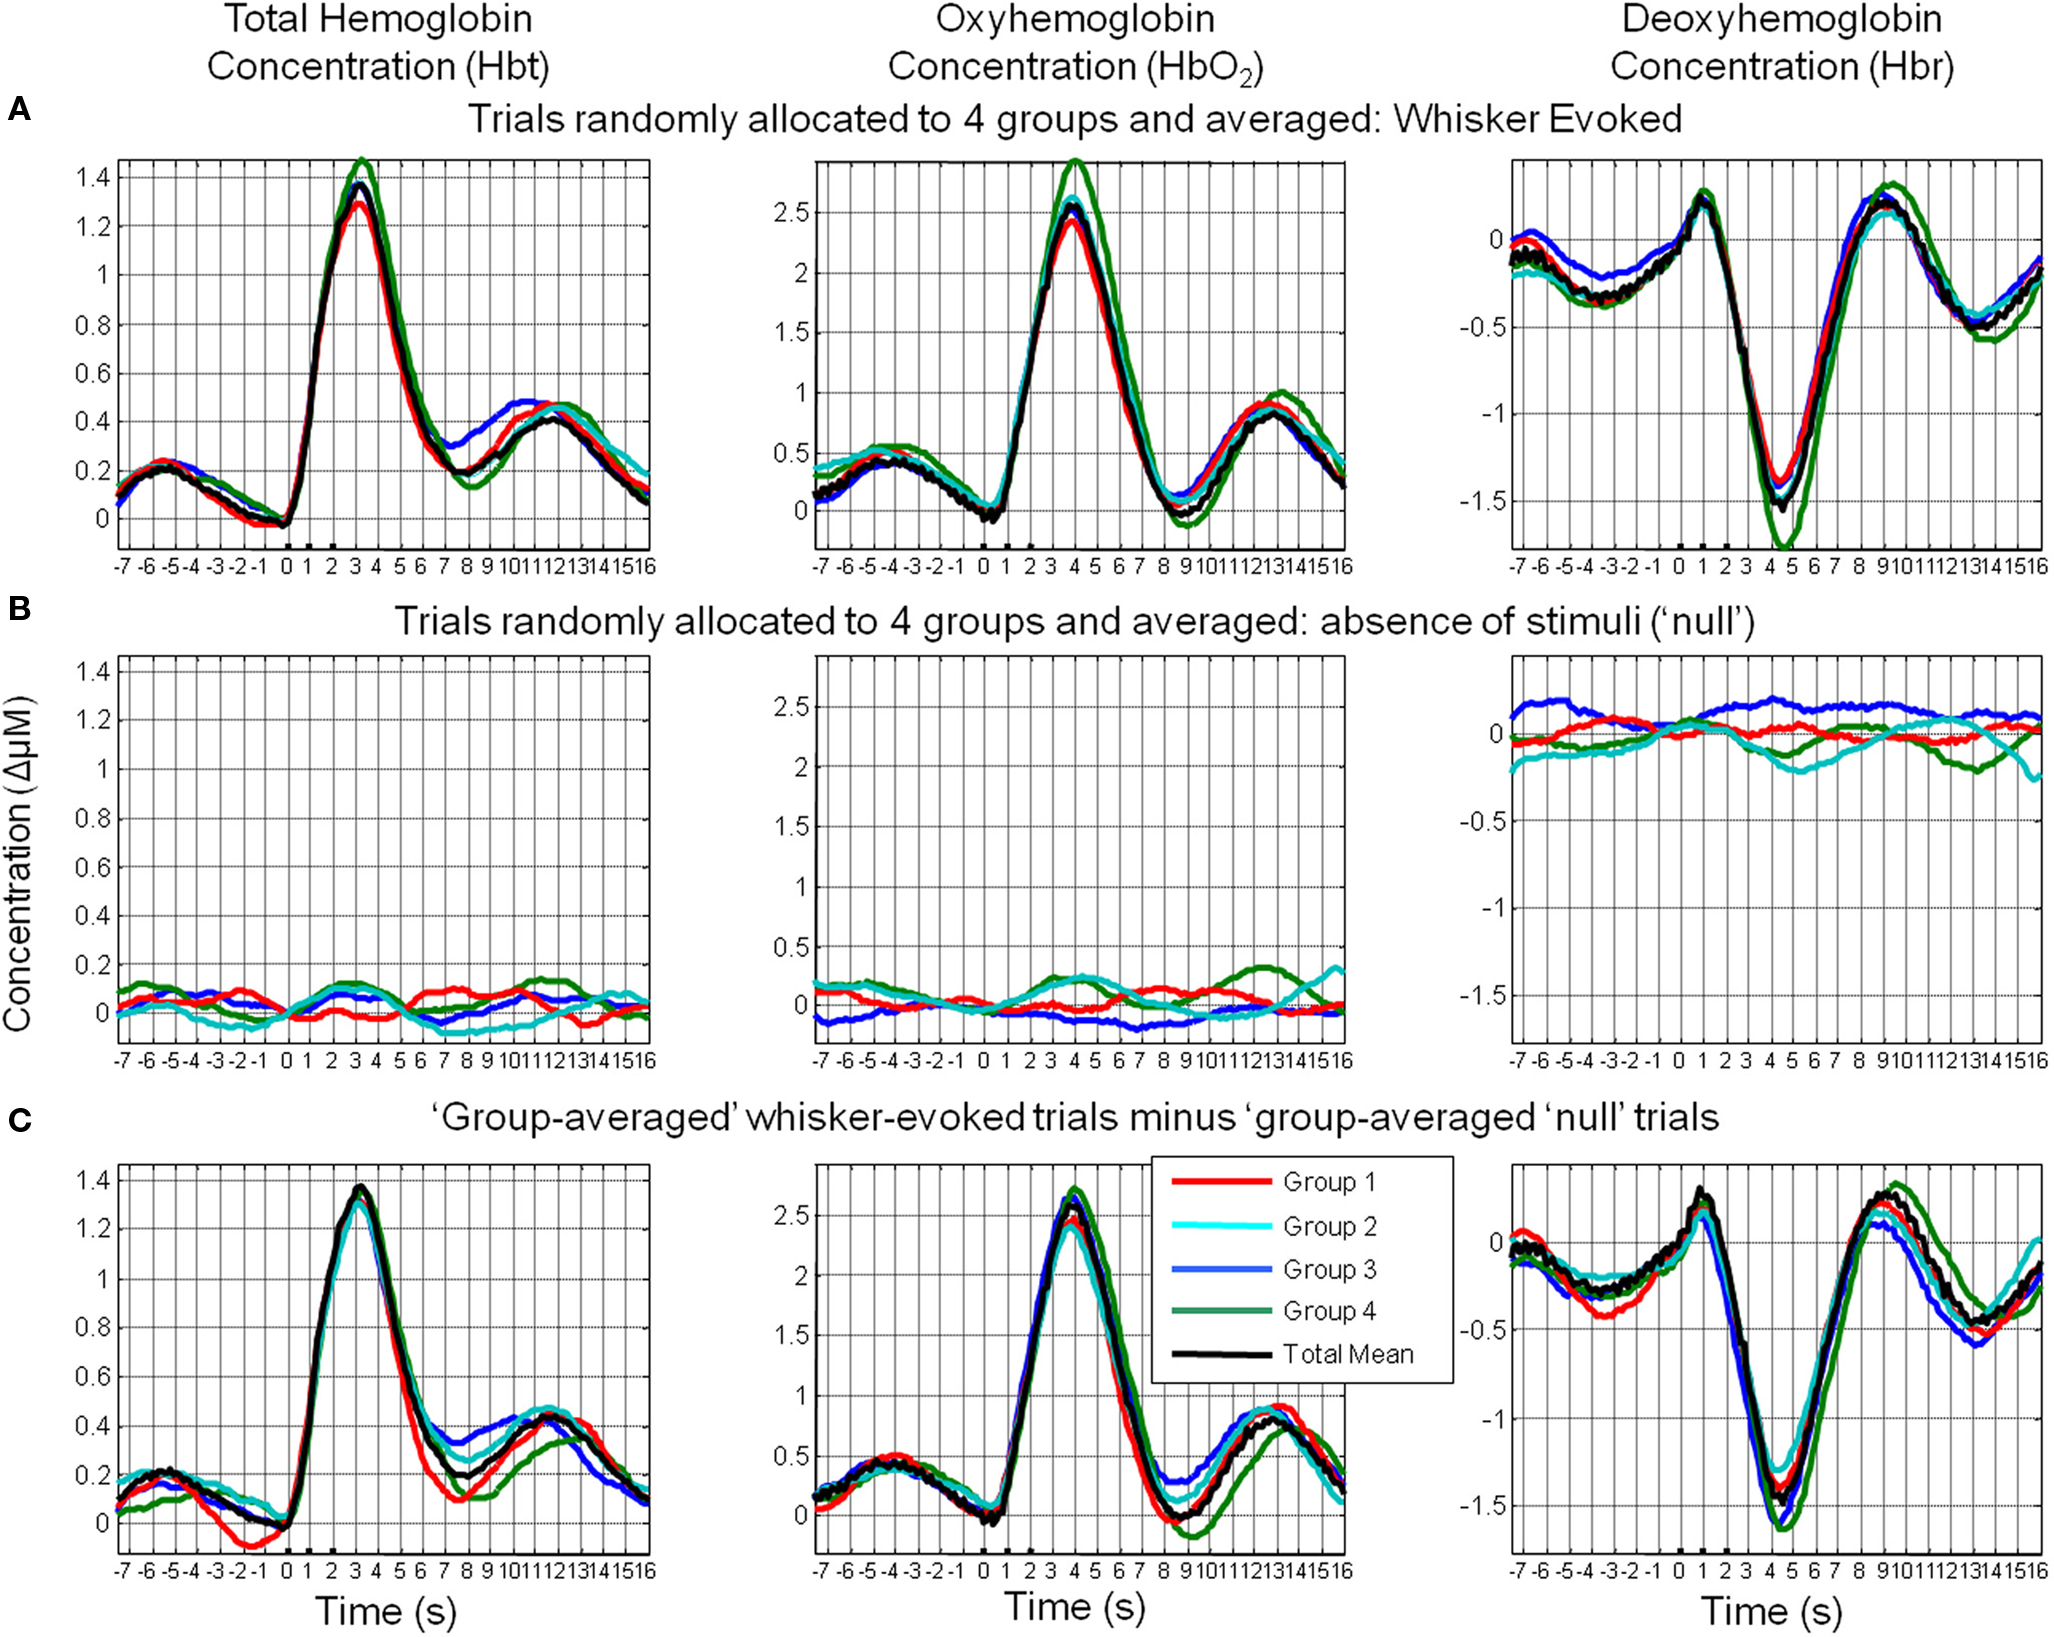
Figure 10. Random assignment of sensory-evoked and ongoing cortical total hemodynamics to four groups. (A) Hemodynamic responses to sensory stimuli were randomly assigned to one of four groups and averaged. (B) Hemodynamic trial data without presentation of sensory stimuli (“nulls”) were randomly assigned to one of four groups and averaged. (C) Subtraction of the group-averaged stimulus-evoked responses from their “group-averaged” null counterparts.
Discussion
The data and analyses presented here extend and confirm the finding of Fox et al. (2006b) by further demonstrating interaction between stimulus-evoked and ongoing cortical hemodynamics. The data and analyses presented here suggest that depending on the phase of ongoing cortical hemodynamic fluctuations at stimulus onset, stimulus-evoked hemodynamics display different magnitudes and temporal dynamics. To investigate the origin of the interaction between spontaneous and motor-evoked fMRI signals, Fox and colleagues utilized the coherent fluctuations from the contralateral motor cortex that was not activated by task demands (Fox et al., 2006b). Subtraction of these spontaneous fluctuations on a trial-to-trial basis removed a significant component of the variability of the stimulus-evoked responses (Fox et al., 2006b). As in the somatosensory system of the anesthetized rodent, sensory stimuli have been shown to elicit changes in metabolic and hemodynamic parameters in cortex both ipsilateral and contralateral to the sensory stimulus (Devor et al., 2008) adopting a similar approach to Fox and colleagues in this animal model would have resulted in the subtraction of sensory responses rather than just coherent spontaneous fluctuations. Thus rather than compare coherent fluctuations from contralateral barrel cortex during stimulus presentation, we collected data in the absence of stimuli from the same barrel cortex ROI selected for stimulus-evoked trials. The use of optical techniques also enabled measurement of the different aspects of the hemodynamic response that underlie the fMRI response. In addition, for each aspect of the hemodynamic response: HbO2, Hbr and Hbt, these “null” trials were also sorted on the basis of their phase at the time point corresponding to stimulus presentation in the stimulus-evoked trials. Phase averaged null trials were subtracted from their phase averaged counterparts and the similarity of the resultant time series strongly suggests a linear superposition of ongoing and evoked cortical hemodynamics.
Spontaneous fluctuations in hemodynamic based brain imaging signals have also become of interest to cognitive neuroscience as they display temporal coherence in functionally related neuroanatomical structures and as such, fMRI data collected in the absence of stimuli or tasks (often termed “resting state”) is now routinely used to assess functional connectivity (Biswal et al., 1995; Lowe et al., 1998; Hampson et al., 2002; Greicius et al., 2003; van de Ven et al., 2004; Fox et al., 2005, 2006a). However, the 0.1 Hz fluctuation investigated here typically forms the upper limit of the frequency spectrum of fluctuations used in such studies for connectivity analysis, as the data is pre-filtered below this frequency before subsequent correlation analyses are conducted. Vincent et al. (2007) inferred functional connectivity from spontaneous fMRI signals in both human subjects and non-human primates. They filtered their data into different frequency ranges depending on species, which may suggest that spontaneous fMRI fluctuations may have different predominant frequencies between species. However, Obrig et al. (2000) reviewed studies making transcranial Doppler sonography (Zhang et al., 1998a,b), near infrared spectroscopy (Elwell et al., 1996, 1999) and fMRI (Mitra et al., 1997) measures of spontaneous fluctuations in cerebral hemodynamics in humans and Laser Doppler flowmetry (Golanov and Reis, 1996) or optical (Mayhew et al., 1996) measures of cerebral hemodynamics in animals. They found that the majority of studies reported fluctuations at ~ 0.1 Hz regardless of species. Notwithstanding the variety of frequencies that may be present in cerebral hemodynamics, we chose to investigate the 0.1 Hz component due to its ubiquitous presence in previous research (Obrig et al., 2000). The question arises as to the origin of the fluctuations at the 0.1 Hz frequency. There is increasing evidence that spontaneous fluctuations in hemodynamic fMRI signals in general are related to spontaneous neural activity. Logothetis et al. (2001) was able to generate a BOLD fMRI impulse response function by deconvolving “spontaneous” fMRI data with simultaneous measures of LFP from primate. A correlation between spontaneous LFP, MUA, action potential rate and fMRI fluctuations at an appropriate temporal lag over large regions in the visual cortex was found in this animal model in a subsequent study (Shmuel and Leopold, 2008) when the anesthetized and paralyzed animals viewed either a gray image (seven animals) or were in complete darkness (two animals). However, the 0.1 Hz oscillation in particular, has also been hypothesized to be vaso- or myogenic in origin (Morita et al., 1995) due to similar 0.1 Hz oscillations in hemodynamics being found in peripheral tissues in addition to brain, such as the testes (Damber et al., 1983; Mayhew et al., 1998). However, a recent study making MRI measures of spontaneous BOLD fluctuations in rat found that connectivity maps could be created from both the more typically used slower frequency components and the 0.1 Hz oscillation (Majeed et al., 2009). This could suggest the 0.1 Hz is in some way related to spontaneous activity or functionally connected regions happened to have correlated vasogenic 0.1 Hz oscillations. Friston et al. (2000) convolved a hemodynamic impulse response function with simulated stochastic neural activity and found the resulting time series strongly resembled the characteristic 0.1 Hz spontaneous fluctuations recorded in optical studies (Mayhew et al., 1996; Spitzer et al., 2001) suggesting that the time course of 0.1 Hz hemodynamic fluctuations could be produced by spontaneous neural activity despite the fact that spontaneous neural activity may occur at a different temporal scale. Golanov et al. (1994) demonstrated temporal concordance of spontaneous EEG burst preceding CBF oscillations, some of which were in frequencies around the 0.1 Hz range. Future work using combined electrophysiology and optical measures of hemodynamics may provide further information whether the 0.1 Hz hemodynamics oscillations are related to spontaneous activity. Regardless of the origin of the 0.1 Hz component the present investigation demonstrates how it may contribute to the variability in stimulus-evoked responses. A finding which may prove to be useful in interpreting individual trials of hemodynamic based neuroimaging data.
Conclusion
The present investigation demonstrates that stimulus-evoked cortical hemodynamics may demonstrate inter-trial variability based on attributes of pre-stimulus ongoing fluctuations.
Conflict of Interest Statement
The authors declare that the research was conducted in the absence of any commercial or financial relationships that could be construed as a potential conflict of interest.
Acknowledgments
This work was supported by MRC New Investigator Award G0501127. The authors would like to thank Mr Michael Bruyns-Haylett for commenting on a draft of the manuscript and Professors John Mayhew and Peter Redgrave for their continued support. We would also like to thank Drs David Johnston, Ying Zheng, Ian Devonshire and Chris Martin for helpful comments. Particularly thanks to Dr Robert Haslinger (MGH) for advice on the use of the Hilbert transform and Dr Michael Fox for suggesting the comparison of “null” and stimulus-evoked trials. We also thank the technical staff of the Psychology Department: Marion Simkins, Natalie Walton and Malcom Benn.
References
Aguirre, G. K., Zarahn, E., and D’Esposito, M. (1998). The variability of human, BOLD hemodynamic responses. Neuroimage 8, 360–369.
Arieli, A., Sterkin, A., Grinvald, A., and Aertsen, A. (1996). Dynamics of ongoing activity: explanation of the large variability in evoked cortical responses. Science 273, 1868–1871.
Berwick, J., Johnston, D., Jones, M., Martindale, J., Martin, C., Kennerley, A. J., Redgrave, P., and Mayhew, J. E. (2008). Fine detail of neurovascular coupling revealed by spatiotemporal analysis of the hemodynamic response to single whisker stimulation in rat barrel cortex. J. Neurophysiol. 99, 787–798.
Berwick, J., Johnston, D., Jones, M., Martindale, J., Redgrave, P., McLoughlin, N., Schiessl, I., and Mayhew, J. E. (2005). Neurovascular coupling investigated with two-dimensional optical imaging spectroscopy in rat whisker barrel cortex. Eur. J. Neurosci. 22, 1655–1666.
Biswal, B., Yetkin, F. Z., Haughton, V. M., and Hyde, J. S. (1995). Functional connectivity in the motor cortex of resting human brain using echo-planar MRI. Magn. Reson. Med. 34, 537–541.
Cannestra, A. F., Pouratian, N., Shomer, M. H., and Toga, A. W. (1998). Refractory periods observed by intrinsic signal and fluorescent dye imaging. J. Neurophysiol. 80, 1522–1532.
Damber, J. E., Lindahl, O., Selstam, G., and Tenland, T. (1983). Rhythmical oscillations in rat testicular microcirculation as recorded by laser Doppler flowmetry. Acta Physiol. Scand. 118, 117–123.
Devor, A., Dunn, A. K., Andermann, M. L., Ulbert, I., Boas, D. A., and Dale, A. M. (2003). Coupling of total hemoglobin concentration, oxygenation, and neural activity in rat somatosensory cortex. Neuron 39, 353–359.
Devor, A., Hillman, E. M., Tian, P., Waeber, C., Teng, I. C., Ruvinskaya, L., Shalinsky, M. H., Zhu, H., Haslinger, R. H., Narayanan, S. N., Ulbert, I., Dunn, A. K., Lo, E. H., Rosen, B. R., Dale, A. M., Kleinfeld, D., and Boas, D. A. (2008). Stimulus-induced changes in blood flow and 2-deoxyglucose uptake dissociate in ipsilateral somatosensory cortex. J. Neurosci. 28, 14347–14357.
Elwell, C. E., Owen-Reece, H., Wyatt, J. S., Cope, M., Reynolds, E. O., and Delpy, D. T. (1996). Influence of respiration and changes in expiratory pressure on cerebral haemoglobin concentration measured by near infrared spectroscopy. J. Cereb. Blood Flow Metab. 16, 353–357.
Elwell, C. E., Springett, R., Hillman, E., and Delpy, D. T. (1999). Oscillations in cerebral haemodynamics. Implications for functional activation studies. Adv. Exp. Med. Biol. 471, 57–65.
Fox, M. D., Corbetta, M., Snyder, A. Z., Vincent, J. L., and Raichle, M. E. (2006a). Spontaneous neuronal activity distinguishes human dorsal and ventral attention systems. Proc. Natl. Acad. Sci. U.S.A. 103, 10046–10051.
Fox, M. D., Snyder, A. Z., Zacks, J. M., and Raichle, M. E. (2006b). Coherent spontaneous activity accounts for trial-to-trial variability in human evoked brain responses. Nat. Neurosci. 9, 23–25.
Fox, M. D., Snyder, A. Z., Vincent, J. L., Corbetta, M., Van Essen, D. C., and Raichle, M. E. (2005). The human brain is intrinsically organized into dynamic, anticorrelated functional networks. Proc. Natl. Acad. Sci. U.S.A. 102, 9673–9678.
Friston, K. J., Mechelli, A., Turner, R., and Price, C. J. (2000). Nonlinear responses in fMRI: the Balloon model, Volterra kernels, and other hemodynamics. Neuroimage 12, 466–477.
Golanov, E. V., and Reis, D. J. (1996). Cerebral cortical neurons with activity linked to central neurogenic spontaneous and evoked elevations in cerebral blood flow. Neurosci. Lett. 209, 101–104.
Golanov, E. V., Yamamoto, S., and Reis, D. J. (1994). Spontaneous waves of cerebral blood flow associated with a pattern of electrocortical activity. Am. J. Physiol. 266, R204–R214.
Greicius, M. D., Krasnow, B., Reiss, A. L., and Menon, V. (2003). Functional connectivity in the resting brain: a network analysis of the default mode hypothesis. Proc. Natl. Acad. Sci. U.S.A. 100, 253–258.
Hampson, M., Peterson, B. S., Skudlarski, P., Gatenby, J. C., and Gore, J. C. (2002). Detection of functional connectivity using temporal correlations in MR images. Hum. Brain Mapp. 15, 247–262.
Haslinger, R., Ulbert, I., Moore, C. I., Brown, E. N., and Devor, A. (2006). Analysis of LFP phase predicts sensory response of barrel cortex. J. Neurophysiol. 96, 1658–1663.
Jones, M., Berwick, J., Hewson-Stoate, N., Gias, C., and Mayhew, J. (2005). The effect of hypercapnia on the neural and hemodynamic responses to somatosensory stimulation. Neuroimage 27, 609–623.
Jones, M., Berwick, J., Johnston, D., and Mayhew, J. (2001). Concurrent optical imaging spectroscopy and laser-Doppler flowmetry: the relationship between blood flow, oxygenation, and volume in rodent barrel cortex. Neuroimage 13, 1002–1015.
Jones, M., Berwick, J., and Mayhew, J. (2002). Changes in blood flow, oxygenation, and volume following extended stimulation of rodent barrel cortex. Neuroimage 15, 474–487.
Jones, M., Devonshire, I. M., Berwick, J., Martin, C., Redgrave, P., and Mayhew, J. (2008). Altered neurovascular coupling during information-processing states. Eur. J. Neurosci. 27, 2758–2772.
Jones, M., Hewson-Stoate, N., Martindale, J., Redgrave, P., and Mayhew, J. (2004). Nonlinear coupling of neural activity and CBF in rodent barrel cortex. Neuroimage 22, 956–965.
Kennerley, A. J., Berwick, J., Martindale, J., Johnston, D., Papadakis, N., and Mayhew, J. E. (2005). Concurrent fMRI and optical measures for the investigation of the hemodynamic response function. Magn. Reson. Med. 54, 354–365.
Kwong, K. K., Belliveau, J. W., Chesler, D. A., Goldberg, I. E., Weisskoff, R. M., Poncelet, B. P., Kennedy, D. N., Hoppel, B. E., Cohen, M. S., Turner, R., Cheng, H-M., Brady, T. J., and Rosen, B. R. (1992). Dynamic magnetic resonance imaging of human brain activity during primary sensory stimulation. Proc. Natl. Acad. Sci. U.S.A. 89, 5675–5679.
Le Van Quyen, M., and Bragin, A. (2007). Analysis of dynamic brain oscillations: methodological advances. Trends Neurosci. 30, 365–373.
Le Van Quyen, M., Foucher, J., Lachaux, J., Rodriguez, E., Lutz, A., Martinerie, J., and Varela, F. J. (2001). Comparison of Hilbert transform and wavelet methods for the analysis of neuronal synchrony. J. Neurosci. Methods 111, 83–98.
Logothetis, N. K., Pauls, J., Augath, M., Trinath, T., and Oeltermann, A. (2001). Neurophysiological investigation of the basis of the fMRI signal. Nature 412, 150–157.
Lowe, M. J., Mock, B. J., and Sorenson, J. A. (1998). Functional connectivity in single and multislice echoplanar imaging using resting-state fluctuations. Neuroimage 7, 119–132.
Majeed, W., Magnuson, M., and Keilholz, S. D. (2009). Spatiotemporal dynamics of low frequency fluctuations in BOLD fMRI of the rat. J. Magn. Reson. Imaging 30, 384–393.
Malonek, D., Dirnagl, U., Lindauer, U., Yamada, K., Kanno, I., and Grinvald, A. (1997). Vascular imprints of neuronal activity: relationships between the dynamics of cortical blood flow, oxygenation, and volume changes following sensory stimulation. Proc. Natl. Acad. Sci. U.S.A. 94, 14826–14831.
Martindale, J., Mayhew, J., Berwick, J., Jones, M., Martin, C., Johnston, D., Redgrave, P., and Zheng, Y. (2003). The hemodynamic impulse response to a single neural event. J. Cereb. Blood Flow Metab. 23, 546–555.
Mayhew, J., Hu, D., Zheng, Y., Askew, S., Hou, Y., Berwick, J., Coffey, P. J., and Brown, N. (1998). An evaluation of linear model analysis techniques for processing images of microcirculation activity. Neuroimage 7, 49–71.
Mayhew, J., Johnston, D., Berwick, J., Jones, M., Coffey, P., and Zheng, Y. (2000). Spectroscopic analysis of neural activity in brain: increased oxygen consumption following activation of barrel cortex. Neuroimage 12, 664–675.
Mayhew, J., Zheng, Y., Hou, Y., Vuksanovic, B., Berwick, J., Askew, S., and Coffey, P. (1999). Spectroscopic analysis of changes in remitted illumination: the response to increased neural activity in brain. Neuroimage 10, 304–326.
Mayhew, J. E., Askew, S., Zheng, Y., Porrill, J., Westby, G. W., Redgrave, P., Rector, D. M., and Harper, R. M. (1996). Cerebral vasomotion: a 0.1-Hz oscillation in reflected light imaging of neural activity. Neuroimage 4, 183–193.
Mitra, P. P., Ogawa, S., Hu, X., and Ugurbil, K. (1997). The nature of spatiotemporal changes in cerebral hemodynamics as manifested in functional magnetic resonance imaging. Magn. Reson. Med. 37, 511–518.
Molgedey, L., and Schuster, H. G. (1994). Separation of a mixture of independent signals using time delayed correlations. Phys. Rev. Lett. 72, 3634–3637.
Morita, Y., Hardebo, J. E., and Bouskela, E. (1995). Influence of cerebrovascular sympathetic, parasympathetic, and sensory nerves on autoregulation and spontaneous vasomotion. Acta Physiol. Scand. 154, 121–130.
Obrig, H., Neufang, M., Wenzel, R., Kohl, M., Steinbrink, J., Einhaupl, K., and Villringer, A. (2000). Spontaneous low frequency oscillations of cerebral hemodynamics and metabolism in human adults. Neuroimage 12, 623–639.
Ogawa, S., Tank, D. W., Menon, R., Ellermann, J. M., Kim, S. G., Merkle, H., and Ugurbil, K. (1992). Intrinsic signal changes accompanying sensory stimulation: functional brain mapping with magnetic resonance imaging. Proc. Natl. Acad. Sci. U.S.A. 89, 5951–5955.
Pikovsky, A., Rosenblum, M., and Kurths, J. (2001). Synchronization - A Universal Concept in Nonlinear Sciences. Cambridge, UK: Cambridge.
Sauseng, P., Klimesch, W., Gruber, W. R., Hanslmayr, S., Freunberger, R., and Doppelmayr, M. (2007). Are event-related potential components generated by phase resetting of brain oscillations? A critical discussion. Neuroscience 146, 1435–1444.
Sheth, S., Nemoto, M., Guiou, M., Walker, M., Pouratian, N., and Toga, A. W. (2003). Evaluation of coupling between optical intrinsic signals and neuronal activity in rat somatosensory cortex. Neuroimage 19, 884–894.
Shmuel, A., and Leopold, D. A. (2008). Neuronal correlates of spontaneous fluctuations in fMRI signals in monkey visual cortex: Implications for functional connectivity at rest. Hum. Brain Mapp. 29, 751–761.
Spitzer, M. W., Calford, M. B., Clarey, J. C., Pettigrew, J. D., and Roe, A. W. (2001). Spontaneous and stimulus-evoked intrinsic optical signals in primary auditory cortex of the cat. J. Neurophysiol. 85, 1283–1298.
van de Ven, V. G., Formisano, E., Prvulovic, D., Roeder, C. H., and Linden, D. E. (2004). Functional connectivity as revealed by spatial independent component analysis of fMRI measurements during rest. Hum. Brain Mapp. 22, 165–178.
Vincent, J. L., Patel, G. H., Fox, M. D., Snyder, A. Z., Baker, J. T., Van Essen, D. C., Zempel, J. M., Snyder, L. H., Corbetta, M., and Raichle, M. E. (2007). Intrinsic functional architecture in the anaesthetized monkey brain. Nature 447, 83–86.
Zhang, R., Zuckerman, J. H., Giller, C. A., and Levine, B. D. (1998a). Transfer function analysis of dynamic cerebral autoregulation in humans. Am. J. Physiol. 274, H233–H241.
Zhang, R., Zuckerman, J. H., and Levine, B. D. (1998b). Deterioration of cerebral autoregulation during orthostatic stress: insights from the frequency domain. J. Appl. Physiol. 85, 1113–1122.
Keywords: optical-imaging, brain-imaging, barrel cortex, spontaneous fluctuations
Citation: Saka M, Berwick J and Jones M (2010) Linear superposition of sensory-evoked and ongoing cortical hemodynamics. Front. Neuroenerg. 2:23. doi: 10.3389/fnene.2010.00023
Received: 25 January 2010;
Paper pending published: 03 May 2010;
Accepted: 14 July 2010;
Published online: 27 August 2010
Edited by:
David Boas, Massachusetts General Hospital, USA; Massachusetts Institute of Technology, USA; Harvard Medical School, USAReviewed by:
Ivo Vanzetta, Institut de Neurosciences Cognitives de la Méditerranée, FranceAmir Shmuel, McGill University, Canada
Copyright: © 2010 Saka, Berwick and Jones. This is an open-access article subject to an exclusive license agreement between the authors and the Frontiers Research Foundation, which permits unrestricted use, distribution, and reproduction in any medium, provided the original authors and source are credited.
*Correspondence: Myles Jones, The Centre for Signal Processing in NeuroImaging and Systems Neuroscience, Department of Psychology, Western Bank, University of Sheffield, Sheffield, South Yorkshire S10 2TN, UK. e-mail: m.jones@sheffield.ac.uk