High resolution measurement of the glycolytic rate
- 1 Centro de Estudios Científicos, Valdivia, Chile
- 2 Centro de Ingeniería de la Innovación del CECS, Valdivia, Chile
- 3 Universidad Austral de Chile, Valdivia, Chile
- 4 Carnegie Institution of Science, Stanford, CA, USA
The glycolytic rate is sensitive to physiological activity, hormones, stress, aging, and malignant transformation. Standard techniques to measure the glycolytic rate are based on radioactive isotopes, are not able to resolve single cells and have poor temporal resolution, limitations that hamper the study of energy metabolism in the brain and other organs. A new method is described in this article, which makes use of a recently developed FRET glucose nanosensor to measure the rate of glycolysis in single cells with high temporal resolution. Used in cultured astrocytes, the method showed for the first time that glycolysis can be activated within seconds by a combination of glutamate and K+, supporting a role for astrocytes in neurometabolic and neurovascular coupling in the brain. It was also possible to make a direct comparison of metabolism in neurons and astrocytes lying in close proximity, paving the way to a high-resolution characterization of brain energy metabolism. Single-cell glycolytic rates were also measured in fibroblasts, adipocytes, myoblasts, and tumor cells, showing higher rates for undifferentiated cells and significant metabolic heterogeneity within cell types. This method should facilitate the investigation of tissue metabolism at the single-cell level and is readily adaptable for high-throughput analysis.
Introduction
The metabolic rate defines the speed at which the body burns fuel. Inside tissues, each cell is characterized by a specific metabolic rate, ranging from low for quiescent cells like fibroblasts to very high for active muscle cells and neurons. Mammalian cells can metabolize fatty acids, ketone bodies, and aminoacids, but for most cells the main fuel is glucose and a tight correlation is observed between metabolic rate and glycolytic rate. Brain tissue represents an extreme case, where glucose provides 95% of the total energy supply. The metabolic rate of an individual cell can vary through time: for instance, adipocytes increase their rate of glucose uptake by up to ten-fold in response to insulin, whereas neurons may raise their energy demand by larger factors in response to electrical stimulation. The metabolic rate is also affected by aging and disease. For example, cancer cells show higher metabolic rates than their normal counterparts, a phenomenon involved in tumor progression and instrumental for the purposes of diagnosis, staging and prognosis of this disease (Vander Heiden et al., 2009; Yeluri et al., 2009).
There are no available methods to measure the metabolic rate in single cells. Cell populations and tissues are usually studied by following the uptake of radioactive metabolites. In a typical in vitro experiment, a million cells in a culture dish are exposed for 20 min to radiolabeled deoxyglucose, which is phosphorylated in the cytosol by hexokinase, and the radioactivity trapped inside cells is assumed to be proportional to the glycolytic rate. For in vivo experiments, the tracer is given intravenously, and after a period of 20 or more minutes, radioactivity accumulated in the target tissue is detected by autoradiography or non-invasively by fluorodeoxyglucose (FDG)-PET scanning, techniques that have found wide application in functional mapping of the brain and for detection of tumors throughout the body. Useful as they are, deoxyglucose uptake, deoxyglucose autoradiography, and FDG-PET scanning have their limitations. Firstly, they use glucose analogs that are not handled by hexokinase in the same way as glucose, and that can be toxic, even at low doses (Kurtoglu et al., 2007). Secondly, the accumulation of glucose analogs is not just determined by metabolism but also depends on how efficiently they are imported and exported by glucose transporters. Thirdly, isotopic techniques offer low spatiotemporal resolution, which precludes resolving the contribution of individual cells or detecting rapid phenomena; and finally, they are relatively insensitive and require radioactive isotope manipulation, which makes them inadequate for the purposes of high-throughput analysis. An alternative, non-isotopic approach to the metabolic rate is the measurement of the rate of oxygen consumption, which thanks to recent technical developments is being done with improved temporal resolution but still requires cell populations (Gerencser et al., 2009).
Fluorescence allows estimation of metabolite concentration with high sensitivity and spatiotemporal resolution. In addition to NAD(P)H autofluorescence (Brennan et al., 2006; Shuttleworth, 2010), the increasing availability of genetically encoded fluorescent biosensors has made it possible to measure the free cytosolic concentration of several metabolites as well as their accumulation and elimination rates (Deuschle et al., 2005; Berg et al., 2009). Whereas metabolite concentrations are interesting per se, the presence of homeostatic mechanisms in living cells makes steady-state concentrations of little value for the purposes of flux prediction. In the present article, these issues have been solved by interrupting the steady-state, while measuring the concentration of glucose with a genetically encoded FRET nanosensor. Two complementary variants of the method are described that measure metabolic flux in several cell types with high sensitivity and temporal resolution.
Materials and Methods
Materials
Gramicidin, nigericin, standard chemicals and tissue culture reagents were from Sigma (St. Louis, MO, USA). Calcein AM was obtained from Molecular Probes (Eugene, OR, USA). Constructs coding for the sensors FLIPglu170n, FLIPglu600μΔ11, FLII12Pglu600μΔ6 have been described previously (Fehr et al., 2003; Deuschle et al., 2005; Takanaga et al., 2008). Plasmids are available through www.addgene.org. Adenoviral vectors Ad FLIPglu600μΔ11 and Ad FLII12Pglu600μΔ6 were custom made by Vector Biolabs.
Animals, Cell Culture, and Tissue Slices
Animals used were mixed F1 male mice (C57BL/6J × CBA/J), kept in an animal room under SPF conditions at a room temperature of 20 ± 2°C, in a 12/12 h light/dark cycle with free access to food and water. All experiments were approved by the Centro de Estudios Científicos Animal Care and Use Committee. Mixed cortical cultures of neuronal and glial cells were prepared from 1- to 3-day-old neonatal mice as described in (Loaiza et al., 2003), except that N1-N2/MEM was replaced by B27-supplemented Neurobasal medium (Gibco). In culture, astrocytes and neurons can be distinguished easily under phase contrast microscopy because astrocytes are large (>20 μm), poorly birefringent, do not have long prolongations and form a monolayer that lies flat against the substrate, whereas neurons are smaller, highly birefringent, show long prolongations and lie on top of the astrocytic monolayer. These morphological criteria have been validated in our laboratory with cell-specific antibodies (Loaiza et al., 2003). Cultures were maintained at 37°C in a humidified atmosphere of 5% CO2. At days 5–7, cultures in 35 mm dishes were transfected with 5 μg plasmid DNA using Lipofectamine 2000 (Gibco) or alternatively, exposed to 5 × 10⁶ PFU of adenoviral vector. Adenoviral vectors showed a very high selectivity for astrocytes over neurons, with a ratio >100. Cell lines were obtained from the American Tissue Culture Collection (ATCC). 3T3-L1 fibroblasts were maintained in Dulbecco’s Modified Eagle Medium (DMEM) supplemented with 10% fetal calf serum, 2.5 μg/ml amphotericin B and 100 U/ml penicillin/streptomycin and differentiated into adipocytes using 5 μg/ml insulin as described (Nie and Wong, 2008). C2C12 myoblasts and Hela cells were maintained in DMEM supplemented with 10% fetal bovine serum, 2.5 μg/ml amphotericin B and 100 U/ml penicillin/streptomycin. 3T3-L1 fibroblast and adipocytes growing in 10 cm dishes were electroporated with 15 μg plasmid DNA using the BioRad Gene Pulser XCell. HeLa cells in 35 mm dishes were transfected with 5 μg plasmid DNA using Lipofectamine 2000. Hippocampal slices (200 μm thick) were prepared with a Vibratome 1000 Plus (Warner Instruments) from 15 day-old mice according to standard procedures (Ridoux et al., 1995). Briefly, brains were immersed in ice-cold artificial cerebrospinal fluid of the following composition (in mM): 125 NaCl, 2.5 KCl, 1.25 NaH2PO4, 2.5 MgCl2, 0.5 CaCl2, 25 glucose, 26 NaHCO3, that had been previously bubbled with 5% CO2/95% O2 for 1 h to reach pH 7.4. Hippocampi were dissected from coronal slices and incubated for 1–2 h in cold dissection medium. Slices were then transferred to 35 mm Petri dishes and cultured at 37°C in a humidified atmosphere of 5% CO2 for 5–6 days in 50 % (MEM containing 6.5 g/l glucose, 23 mM HEPES, and 26 mM NaHCO3), 25% fetal bovine serum, 25% Hank’s solution containing 6.5 g/l glucose, 0.3% glutamine, 1 mM sodium pyruvate, non-essential amino acids, N2 supplement (Invitrogen), 100 U/ml penicillin and 100 μg/ml streptomycin. Slices were infected for 24 h with 50 × 106 PFU of adenoviral vectors at day 2 of culture. For immunohistochemistry, slices were fixed overnight in 4% paraformaldehyde in phosphate buffered saline (PBS). After extensive washing with PBS, slices were incubated overnight at 4°C with rabbit 1:500 anti-cow GFAP antisera (Dako). After further washing with PBS, the tissue was incubated overnight at 4°C with 1:500 Alexa Fluor 568 goat anti-rabbit IgG (Molecular Probes). Slices were mounted on DakoCytomation medium (Dako) and imaged with a Pascal 5 Zeisss confocal microscope at 488 excitation/505-550 emission (for YFP/Citrine) and 543 excitation/>580 nm emission (for Alexa Fluor 568).
Glucose and Volume Measurements
All experiments were carried out at room temperature (22–25oC), which allows easier control, particularly when switching between different perfusates. However, the methods are equally effective at other temperatures and glycolytic rates have been successfully measured at 37°C in our laboratory using a temperature-controlled microplate reader (data not shown). Cultured cells were imaged in HEPES-buffered saline containing (in mM): 136 NaCl, 3 KCl, 1.25 CaCl2, 1.25 MgSO4, 1–2 glucose, 2 sodium lactate, 10 HEPES, pH 7.4 or in 95% O2/5% CO2-gassed buffer of the following composition (in mM): 112 NaCl, 3 KCl, 1.25 CaCl2, 1.25 MgCl2, 1–2 glucose, 2 sodium lactate, 10 HEPES, 24 NaHCO3, pH 7.4. Brain slices were superfused with a 95% O2/5% CO2-gassed buffer containing (in mM): 126 NaCl, 3 KCl, 1.25 NaH2PO4, 1.25 CaCl2, 1.25 MgCl2, 2–3 glucose, 1 sodium lactate, 26 NaHCO3, pH 7.4. Lactate is an important fuel for brain cells and is likely to exert control of glycolysis in the brain and also in tumors. It was added at concentrations similar to those found in brain interstitium (Barros and Deitmer, 2010). When using higher K+ concentrations, NaCl was adjusted to maintain isotonicity. Cultures and slices were imaged with an Olympus IX70 inverted microscope equipped with a 40× oil-immersion objective, a Cairn monochromator with Optosplit (Faversham, UK), and a Hamamatsu Orca camera (Hamamatsu City, Japan) controlled by Kinetics software.
Most experiments were carried out with FLII12Pglu600μΔ6 and some were repeated with FLIPglu600μΔ11, giving similar results. FLII12Pglu600μΔ6 is a fusion protein comprising a FRET donor (CFP) and a FRET acceptor (Citrine) linked by a bacterial protein that upon binding glucose or galactose changes its conformation and the distance between the FRET pair, thus changing FRET efficiency (Fehr et al., 2003; Deuschle et al., 2005; Takanaga et al., 2008). FRET results are usually given as ratio between emission intensities of Citrine and CFP upon CFP excitation, but we chose not to use CFP emission because of its weak intensity due to the high FRET efficiency of this sensor. Instead, Citrine was excited directly at 512 nm, which provided a sugar-insensitive denominator for the FRET ratio. Thus, each experimental point involved a measurement of Citrine emission (520–550 nm) excited by FRET at 430 nm for 300–800 ms, followed immediately by a measurement of Citrine emission (520–550 nm) excited directly at 512 nm for 33–100 ms. Data were encoded in 14 bits and the camera was shown to behave linearly in the range of 200–10,000 gray units. Due to variations in sensor expression, exposure times were adjusted for each experiment so that in a typical ROI average intensity was between 1,000 and 4,000.
Another advantage of this modified protocol is that it does not require an image splitter, so that with the right filters it can be installed in a standard calcium imaging setup. The ratio between Citrine emission excited by FRET and excited directly was converted into glucose concentration by exposing pH-clamped cells to increasing glucose concentrations in the presence of the glycolytic blocker iodoacetic acid (500 μM). Cells were pH-clamped by permeabilizing the plasma membrane to protons using 100 μM nigericin and 10 μM gramicidin. With glycolysis blocked, extracellular and intracellular glucose equilibrate, allowing calibration of the ratio. For astrocytes, 3T3-L1 fibroblasts, C2C12 myoblasts and HeLa cells, KD values (mM) were 0.42, 0.30, 0.49, and 0.28, with respective ΔRmax values (%) of 27, 24, 25, and 27 (n = 3 or more experiments for each cell type with standard errors lower than 20% of the parameter value). For neurons and adipocytes, whose low glucose permeability made calibration impractical, we used the parameters obtained in astrocytes and fibroblasts, respectively. Relative cell volume was measured using a Pascal 5 Zeisss confocal microscope (optical section <2 μm; 488 nm excitation/505–550 nm emission) in cells ester-loaded with calcein at 0.5 μM for 30 min (Barros, 1999). Exposure to anisosmotic solutions showed that over 90% of the fluorescence was volume-sensitive.
Modeling Glucose Homeostasis
Glucose transport across the plasma membrane was simulated using the simple carrier model of GLUT1 as described in (Barros et al., 2007), with a carrier concentration of 0.2 μM. Hexokinase was simulated as a Michaelis–Menten process, with a Km of 50 μM and a Vmax of 5 μM/s. The system of differential equations was solved by numerical simulation using Berkeley Madonna. Transporter block by cytochalasin B considered the inhibitor to be interacting with the inward-facing conformation of the carrier with a KD of 1 μM (Carruthers, 1990).
Statistical Analysis
Regression analyses were carried out with the computer program SigmaPlot (Jandel). Data are presented as mean ± SEM throughout the paper. Differences in mean values of paired or unpaired samples were evaluated with the respective versions of the Student’s t-test. P values <0.05 were considered significant and are indicated with an asterisk.
Results
Theory
The concentration of glucose can be measured in single cells using FRET nanosensors (Fehr et al., 2003; Deuschle et al., 2005; Takanaga et al., 2008; Takanaga and Frommer, 2010). Accumulation and elimination rates can be determined by altering the supply of glucose in the medium. However, both accumulation and elimination rates are a factor of at least three flux components: uptake, phosphorylation by hexokinase and efflux. The intracellular concentration of glucose in the steady state is also determined by these three components but it does not inform on their relative weight (Figure 1A). For example, a low glucose concentration may be observed in cells that have few transporters or in cells with high glycolytic rates. In order to obtain an estimate of flux through hexokinase, i.e., the rate of glycolysis at its entry point, we devised two strategies that disrupt the steady-state. In the first variant, termed ETM (Equilibrium-Transport-Method), extracellular glucose levels are dropped in a single step to a concentration lower than intracellular glucose but different from 0. The numerical simulation in Figure 1B, predicts that such perturbation leads to a rapid decrease toward a new steady-state. Critically, there is an instant in the course of the relaxation when glucose concentrations inside and outside are identical. Because equilibrative transport mediated by GLUTs dominates glucose uptake into most mammalian cells, net flux through the transporter in the absence of a gradient is 0. Thus, with the contribution of transport eliminated, the rate at which glucose concentration falls at equilibrium will correspond to the rate of hexokinase. Given that the Km of the enzyme is 40–50 μM (Wilson, 2003), the rate measured at 300 μM will represent a close estimate of the Vmax. The second variant, termed ITM (Inhibition-Transport-Method) isolates the rate of metabolism by eliminating the contribution of transport by pharmacological block of the GLUT transporters. Figure 1C shows a model of how inhibition of transport causes a quasi-linear fall in intracellular glucose, a linearity that results from the high affinity of hexokinase for glucose, which remains nearly saturated as glucose falls from the millimolar range into the hundred micromolar range. Thus the rate of glucose decrease after blocking transport is also a good estimate of the Vmax of hexokinase.
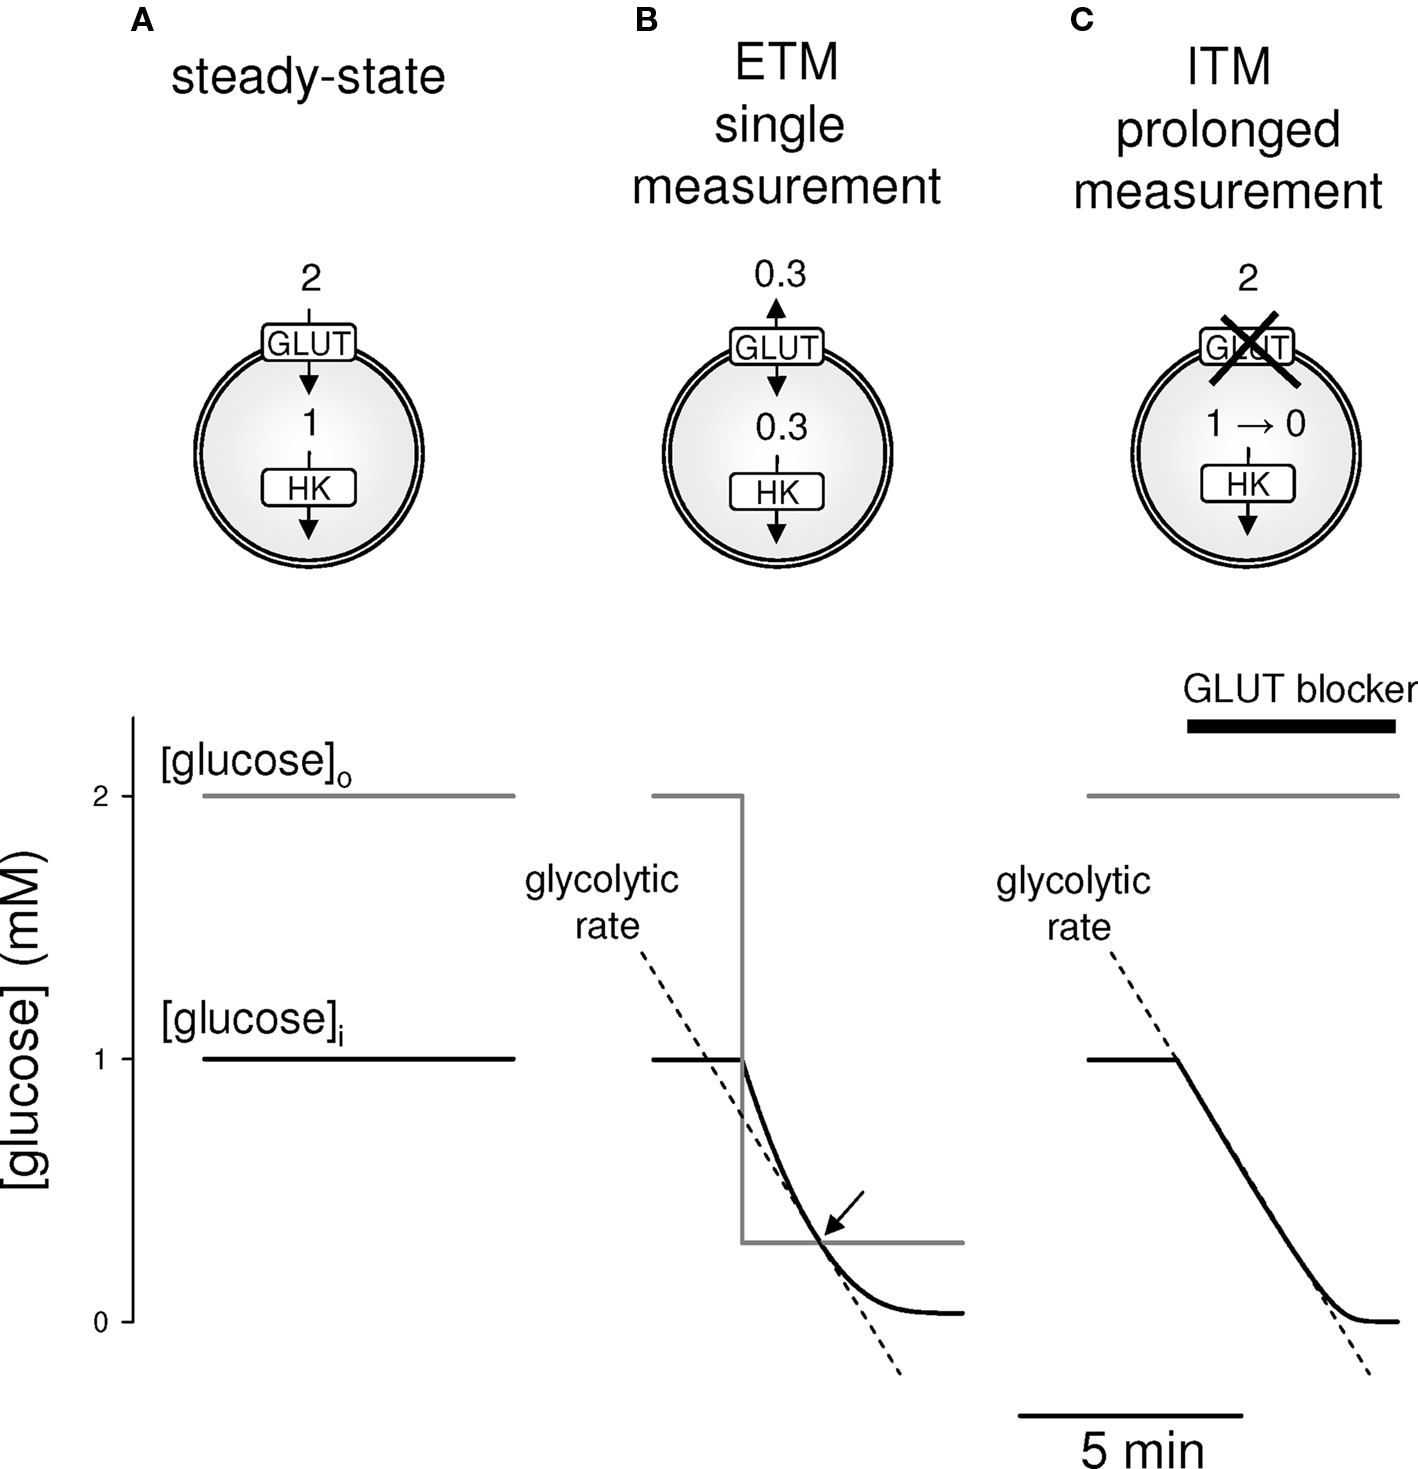
Figure 1. Two strategies to measure the rate of glycolysis. Glucose dynamics were modeled in cell endowed with the equilibrative glucose transporter GLUT1 and hexokinase (HK), using numerical simulation as described in Materials and Methods. (A). At 2 mM extracellular glucose, the intracellular concentration of glucose is kept constant at 1 mM by the dynamic balance between glucose influx and its intracellular phosphorylation by hexokinase. (B) For ETM, the steady-state is disrupted by a step decrease in extracellular glucose, in this case to 0.3 mM, which causes a slow decrease in intracellular glucose. When intracellular and extracellular glucose are equal (arrow), there is no net transfer of sugar across the plasma membrane, and therefore the rate of glucose decrease in that instant is identical to the rate of glycolysis, represented by the interrupted line. (C) For ITM, the steady-state is disrupted by blockage of the glucose transporter, leading to a progressive decline in intracellular glucose at the rate of glycolysis (interrupted line), providing an extended window of measurement.
Validation of the Methods
The theoretical predictions were first tested in cultured astrocytes, cells in which glucose uptake is mediated predominantly by GLUT1, a well-characterized member of the SLC2 family of facilitative hexose and polyol transporters (reviewed in Barros and Deitmer, 2010). Cytosolic glucose levels were measured in real-time with a genetically encoded FRET glucose nanosensor (Fehr et al., 2003; Deuschle et al., 2005; Takanaga et al., 2008). In the presence of 2 mM extracellular glucose, cultured astrocytes maintained a steady-state intracellular glucose concentration averaging 0.63 ± 0.30 mM (n = 100 cells in twenty two experiments). Intracellular glucose concentration varied greatly from cell to cell, ranging from 0.2 to 1.9 mM, meaning that in some cells flux is mostly controlled by transporters and in others by the glycolytic machinery. ETM was applied by lowering extracellular glucose to 0.3 mM, a change that under our superfusion conditions took less than 5 s. As predicted by the simulation in Figure 1B, a step reduction of extracellular glucose caused a progressive decline in cytosolic glucose concentration (Figures 2A,B). The rate of glycolysis was estimated by fitting a monoexponential function to the time-course of decay and computing the instantaneous slope at 0.3 mM (interrupted line in Figure 2B). The assay was repeated multiple times using the same cells. As illustrated in Figure 2C, the response was quantitatively reproducible, i.e., the rate was unaffected by previous treatment, suggesting that the assay itself does not perturb glycolysis, e.g., by altering expression or activity levels of participating proteins. This insensitivity of metabolism to a moderate decrease in intracellular glucose is consistent with constancy of metabolic flux while hexokinase remains saturated.
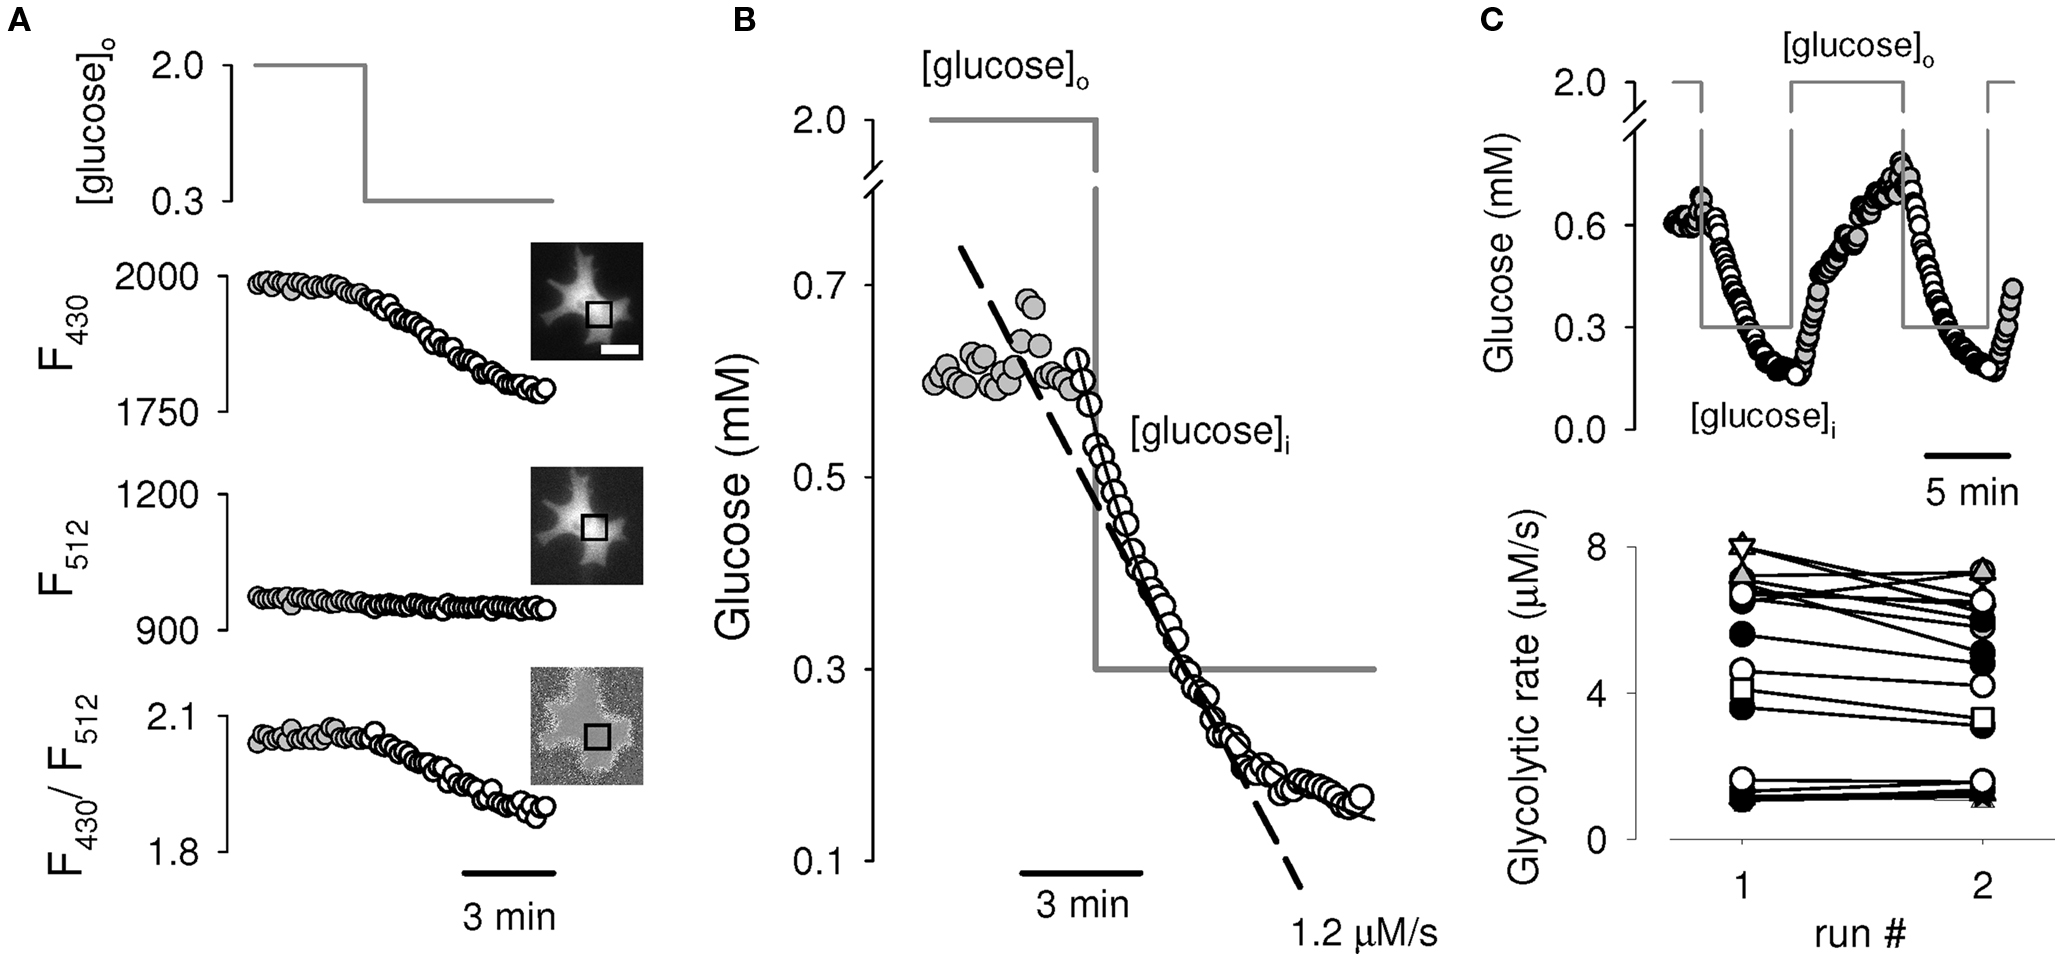
Figure 2. Experimental demonstration of ETM in astrocytes. (A) A single astrocyte expressing the FRET glucose nanosensor FLII12Pglu600μΔ6 was switched from 2 mM to 0.3 mM glucose. Data are background-corrected average fluorescence intensities in the specified region of interest (square) for Citrine emission as excited by FRET (430 nm; Top panel), as excited directly (512 nm; middle panel) and the ratio between both emissions (lower panel). Bar represents 20 μm. (B) Ratios from Figure 2A, were converted to intracellular glucose concentrations using the calibration parameters (Materials and Methods). A monoexponential function was fitted to the data during the decrease in glucose concentration (continuous line), yielding a glycolytic rate of 1.2 μM/s as computed from the slope at 0.3 mM glucose (interrupted line). (C) Reproducibility of the assay. The glycolytic rate was measured twice in the same cell (top trace). The bottom graph summarizes data from 20 cells in five independent experiments in which the protocol was applied twice. Each cell is represented by a different symbol.
The second approach, ITM, makes use of pharmacological inhibition of glucose transport. A widely used inhibitor of the glucose transporter is cytochalasin B, which blocks the major isoforms of most cell types, GLUT1, GLUT3, and GLUT4, with a Ki of about 1 μM or lower (Carruthers, 1990). As predicted, exposure of astrocytes to the inhibitor resulted in a linear decrease in the concentration of glucose in the cytosol (Figure 3A). When exposed continuously to cytochalasin B, cytosolic glucose reached levels indistinguishable from 0, demonstrating complete inhibition of transport. The average rate of glycolysis in cultured astrocytes was 2.0 ± 0.3 μM/s (n = 120 cells in thirty experiments) and showed high heterogeneity, even inside a microscopic field (data not shown). Several control experiments were designed to check the validity of ITM. In addition to inhibiting glucose transport, cytochalasin B affects the actin cytoskeleton, a potential source of interference that can be controlled for with cytochalasin D, a structural analog that specifically targets the cytoskeleton but not the glucose transporters (Carruthers, 1990). The experiment illustrated in Figure 3A (inset) supports the specificity of cytochalasin B by showing that cytochalasin D did not affect the concentration of glucose. Galactose, which is also a ligand for the nanosensors (Fehr et al., 2003), is not metabolized by brain cells (Barros et al., 2007), allowing precise control of its cytosolic concentration by extracellular manipulation. To control for a possible direct effect of cytochalasin B on the sensor, the inhibitor was applied to galactose-equilibrated cells expressing FLIPglu170n. This high-affinity version of the sensor is always saturated, thus providing a constant readout, whose change may be unambiguously ascribed to an artifact. However, as illustrated in Figure 3B, cytochalasin B did not change the ratio of FLIPglu170n emission intensity, showing that there is no direct effect of the inhibitor on the sensor. As with ETM, ITM was also reproducible, giving similar rates in multiple assays (Figure 3C). Phloretin, a structurally unrelated inhibitor of the glucose transporter, gave a glycolytic rate of 1.7 ± 0.3 μM/s that was not significantly different from the glycolytic rate obtained with cytochalasin B (1.8 ± 0.3 μM/s; n = 20 cells in three paired experiments). Figures 3D, E show that measurement of hexokinase flux using ITM presents the expected sensitivity to interruption of glycolysis with the GAPDH blocker iodoacetic acid (IAA) and to stimulation of glycolysis with the mitochondrial inhibitor rotenone. Finally, the methods were compared using the protocol illustrated in Figure 3F, and as expected, their outputs were well correlated.
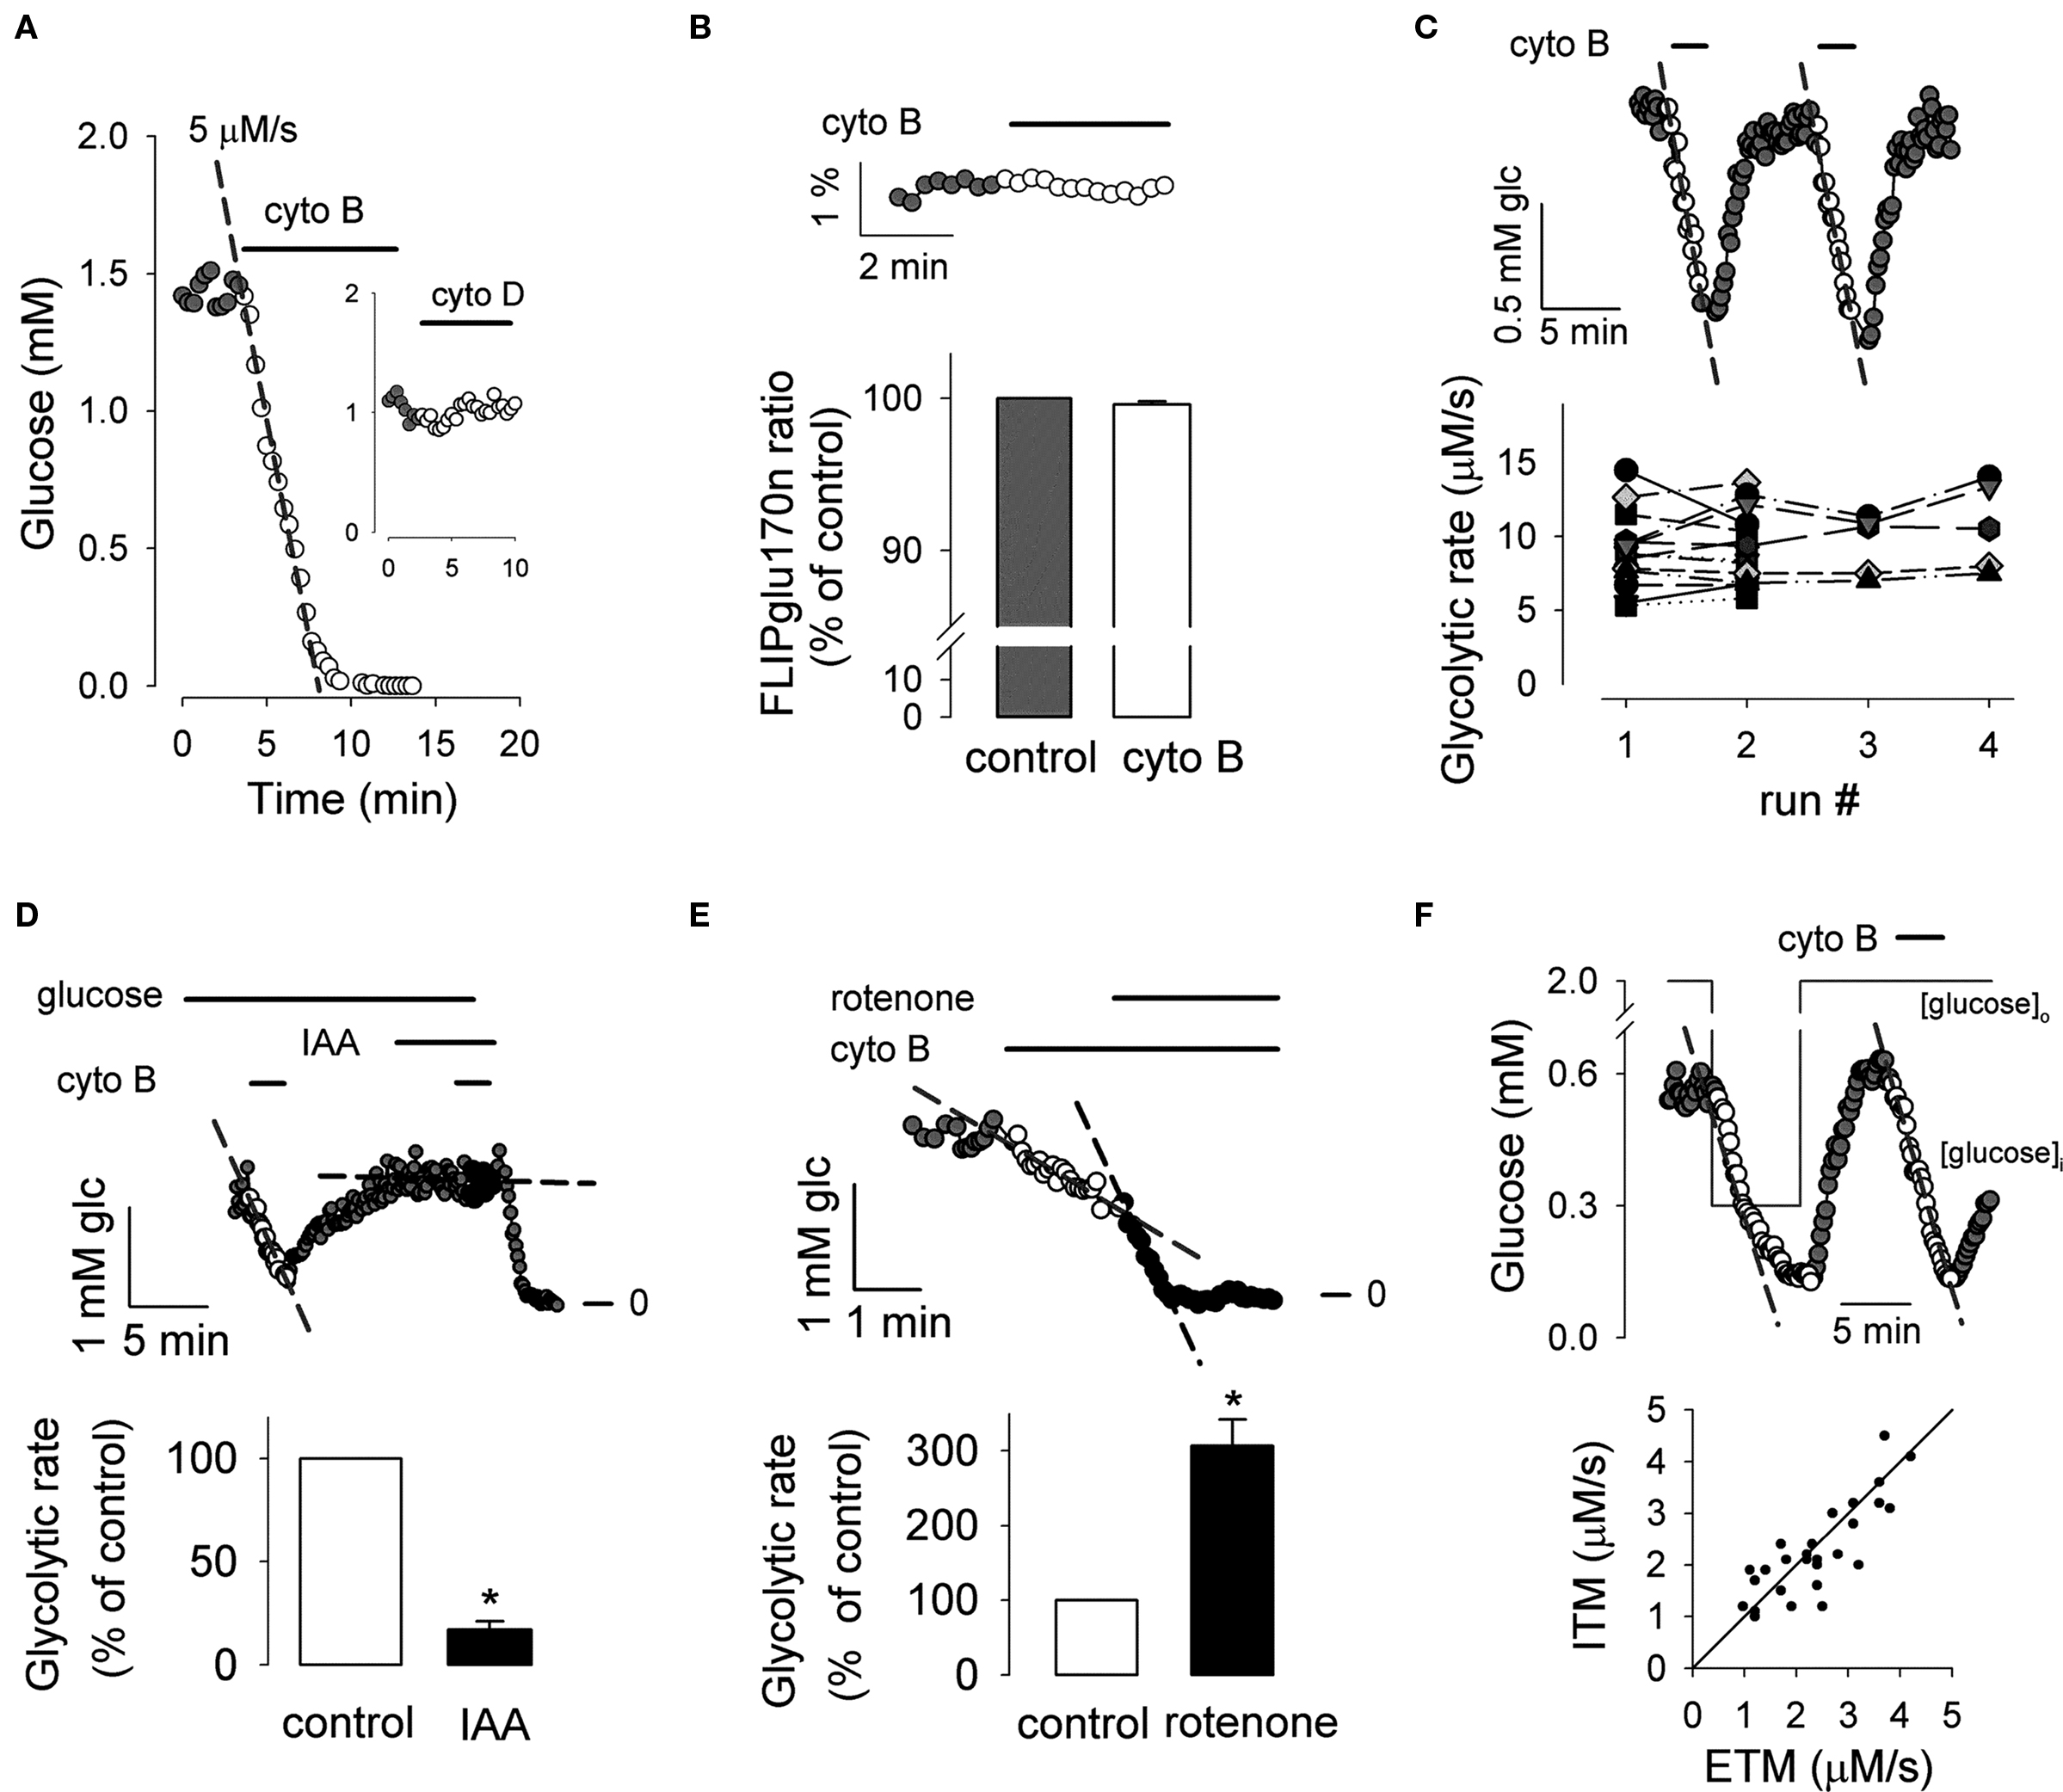
Figure 3. Experimental demonstration of ITM in astrocytes. (A) Exposure of a nanosensor-expressing astrocyte to 20 μM cytochalasin B resulted in a linear decrease in glucose concentration at a rate of 5 μM/s (interrupted line). The inset shows that the same concentration of cytochalasin D had no effect on glucose concentration. (B) Lack of effect of cytochalasin B on the ultra-high affinity form of the sensor (FLIPglu170n) saturated with 4 mM galactose (n = 8 cells in three experiments). (C) Reproducibility of the assay. The glycolytic rate was measured twice in the same cell (top trace). The graph summarizes sixteen independent experiments in which the protocol was applied two to four times in the same cell, giving similar rates. Each cell is represented by a different symbol. (D) Rates were measured before (white symbols) and during (black symbols) inhibition of glycolysis with 500 μM IAA (n = 15 cells in three experiments; *p < 0.05 with respect to control rate). (E) The inhibitor of oxidative phosphorylation rotenone (2 μM) was applied during glycolytic rate determination (n = 12 cells in three experiments; *p < 0.05 with respect to control rate). (F) Glycolytic rates were measured with ETM and ITM in succession as illustrated in the top panel. The bottom panel summarizes the data for 28 cells in seven experiments, with a solid line indicating equal rates for both methods.
Temporal Resolution: Acute Activation of Astrocytic Glycolysis by Neuronal Signals
Typical acquisition times in deoxyglucose uptake, deoxyglucose autoradiography and FDG-PET scanning are longer than 10 min, but the metabolic changes that characterize the brain tissue develop over seconds. For instance, neuronal activity is accompanied by sub-second shifts in mitochondrial redox potential (Brennan et al., 2006; Shuttleworth, 2010), followed within seconds by a rise in interstitial lactate (Hu and Wilson, 1997a), which is thought to play key roles in fast neurovascular and neurometabolic coupling (Pellerin et al., 2007; Gordon et al., 2008; Magistretti, 2009). The observation in cultured astrocytes that glutamate stimulates 2-deoxyglucose uptake and lactate release led to the hypothesis that neuronal activity is preferentially fueled by astrocytic lactate (Pellerin and Magistretti, 1994). However, given the limited resolution of available techniques to measure metabolic flux the identity of the cell type responsible for the lactate surge (i.e., neurons versus astrocytes) and the identity of the local signals that link electrical activity to metabolic activation remain controversial (Dienel and Cruz, 2004; Pellerin et al., 2007; Mangia et al., 2009; Barros and Deitmer, 2010). Taking advantage of ability of ITM to follow glycolytic activation in real-time, we explored the early effects of glutamate and K+, molecules that are released by excitatory neurons during neurotransmission. The data, summarized in Figure 4, show that these neuronal signals trigger a robust and rapid increase in the rate of glycolysis in astrocytes. Remarkably, the activation was stronger than the activation achieved by mitochondrial poisoning (compare with Figure 3E). A control experiment showed that the fast fall in glucose concentration observed in response to glutamate/K+ can not be explained by sugar dilution during cell swelling (Figure 5). In cultured astrocytes, a major fraction of the glucose that enters glycolysis leaves the cell as lactate (Barros and Deitmer, 2010). By showing for that astrocytic glycolysis can be activated by neuronal signals in the range of seconds, these results suggest that astrocytes contribute to the lactate surge observed during neuronal activation. Previous confocal microscopy measurements with fluorescent glucose analogs 2-NBDG and 6-NBDG have shown that exposure of cultured astrocytes to glutamate leads to a strong stimulation of the glucose transporter GLUT1 that also develops within seconds (Loaiza et al., 2003; Porras et al., 2008). In view of the present data, the stimulation of the GLUT1 may be seen as a mechanism that prevents astrocytic glucose shortage in times of high neuronal activity.
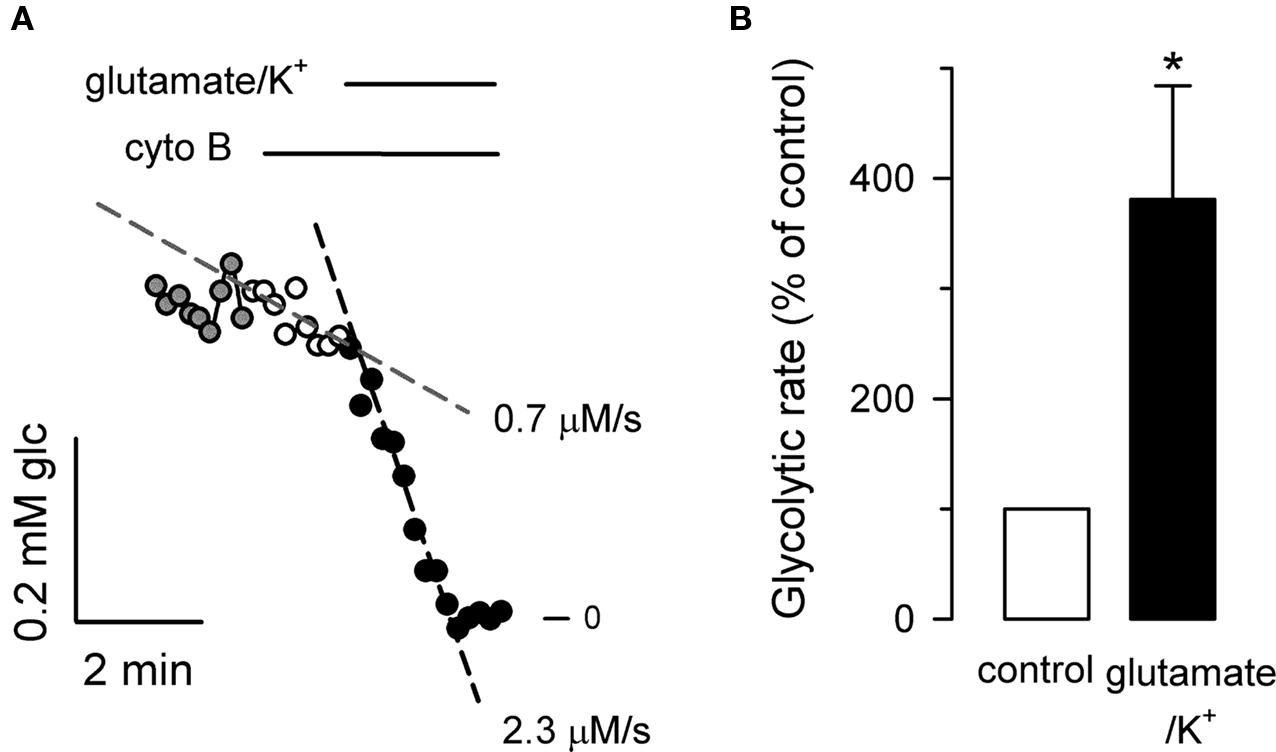
Figure 4. Temporal resolution: fast and strong activation of astrocytic glycolysis by neuronal signals. (A) Application of ITM to a single astrocyte (with 20 μM cytochalasin B) revealed a basal glycolytic rate of 0.7 μM/s (interrupted line over white symbols), which jumped to 2.3 μM/s after addition of 50 μM glutamate and 12 mM K+ (interrupted line over black symbols). (B) Summary of four similar experiments (n = 17 cells; *p < 0.05 with respect to control rate).
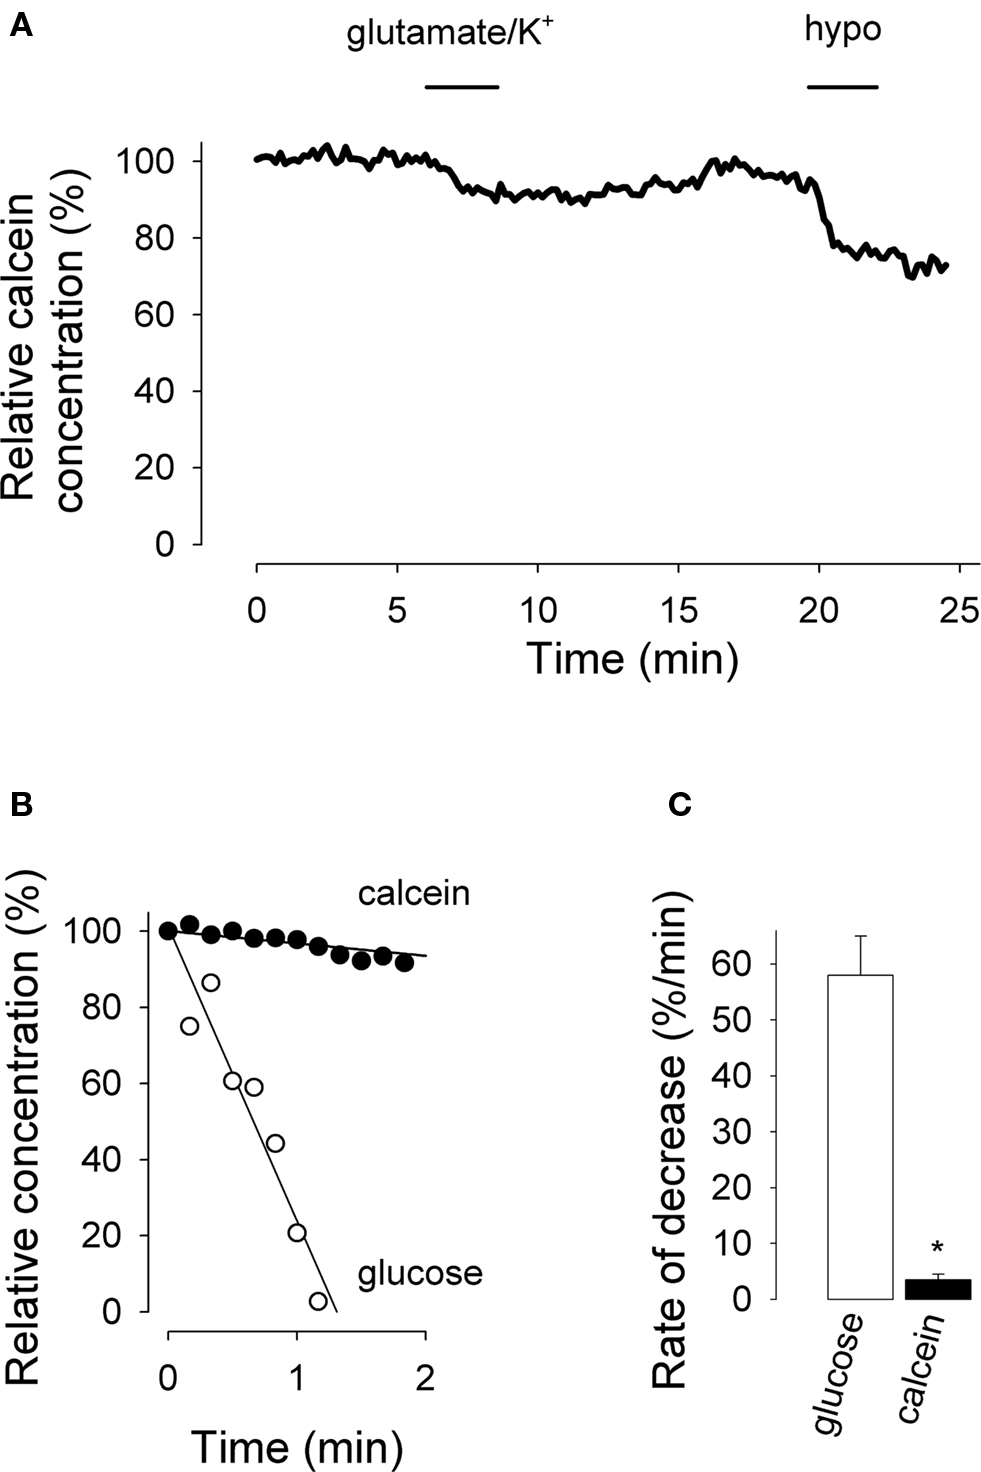
Figure 5. Effect of glutamate/K+ on astrocytic cell volume. (A) Fluorescence was measured in a calcein-loaded cell during addition of 50 μM glutamate/12 mM K+, followed by a solution in which NaCl had been reduced to make the solution 30% hypotonic (hypo). Relative calcein concentration was calculated from calcein fluorescence using the response to hypotonicity as a calibration factor. (B) The initial time course of the response to glutamate/K+ shown in A (calcein) is plotted together with an example of relative decrease in glucose concentration elicited by K+ (glucose, same data as shown in Figure 4A). (C) Initial rates of decrease are given for a series of experiments with glutamate/K+ for glucose (n = 25 cells in five experiments) and calcein (n = 20 cells in three experiments), *p < 0.05.
Spatial Resolution: Neurons Versus Astrocytes
Thanks to new imaging approaches based on fluorescent proteins and nanosensors, the structure and function of the brain tissue are being characterized in increasing detail (Livet et al., 2007; Dulla et al., 2008). However, the energy usage of the brain tissue has not been mapped with the same level of resolution. Each millimeter-sized voxel of an autoradiograph or PET scan, standard methods to measure metabolic rate, is populated by scores of different neuronal and glial types, and a specific rate of fuel consumption of individual cells is currently not accessible. Moreover, there is an open debate on whether glucose is preferentially metabolized by neurons or astrocytes (Dienel and Cruz, 2004; Bonvento et al., 2005; Nehlig and Coles, 2007; Pellerin et al., 2007; Barros and Deitmer, 2010). The experiments illustrated in Figures 6A, B show for the first time the simultaneous measurement of the glycolytic rate in a neuron and a neighboring astrocyte in vitro. We observed great variability of the basal metabolic rate in both cell types but on average the faster cell was the astrocye. Because rates are presumably affected by local factors, results in cultured cells do not predict the situation in the brain tissue, but given that the FRET nanosensor may be targeted to specific cell types in vivo by means of viral vectors or transgenesis, this kind of measurement may eventually be carried out in the brain tissue in vivo. As an initial step in that direction, the sensor was expressed in hippocampal slices using an adenoviral vector. Figure 6C shows colocalization between the sensor and the glial protein GFAP, consistent with the known preferential targeting of glial cells by adenoviruses. Similar to that observed in cultured cells, Figures 6D, E show that the glycolytic rate in astrocytes in slices was heterogeneous, with an average of 2.8 ± 0.4 μM/s (n = 68 cells in twenty five slices, ranging from 0.02 to 12 μM/s). Using this adenoviral vector in slices we did not observe any cells with obvious neuronal morphology.
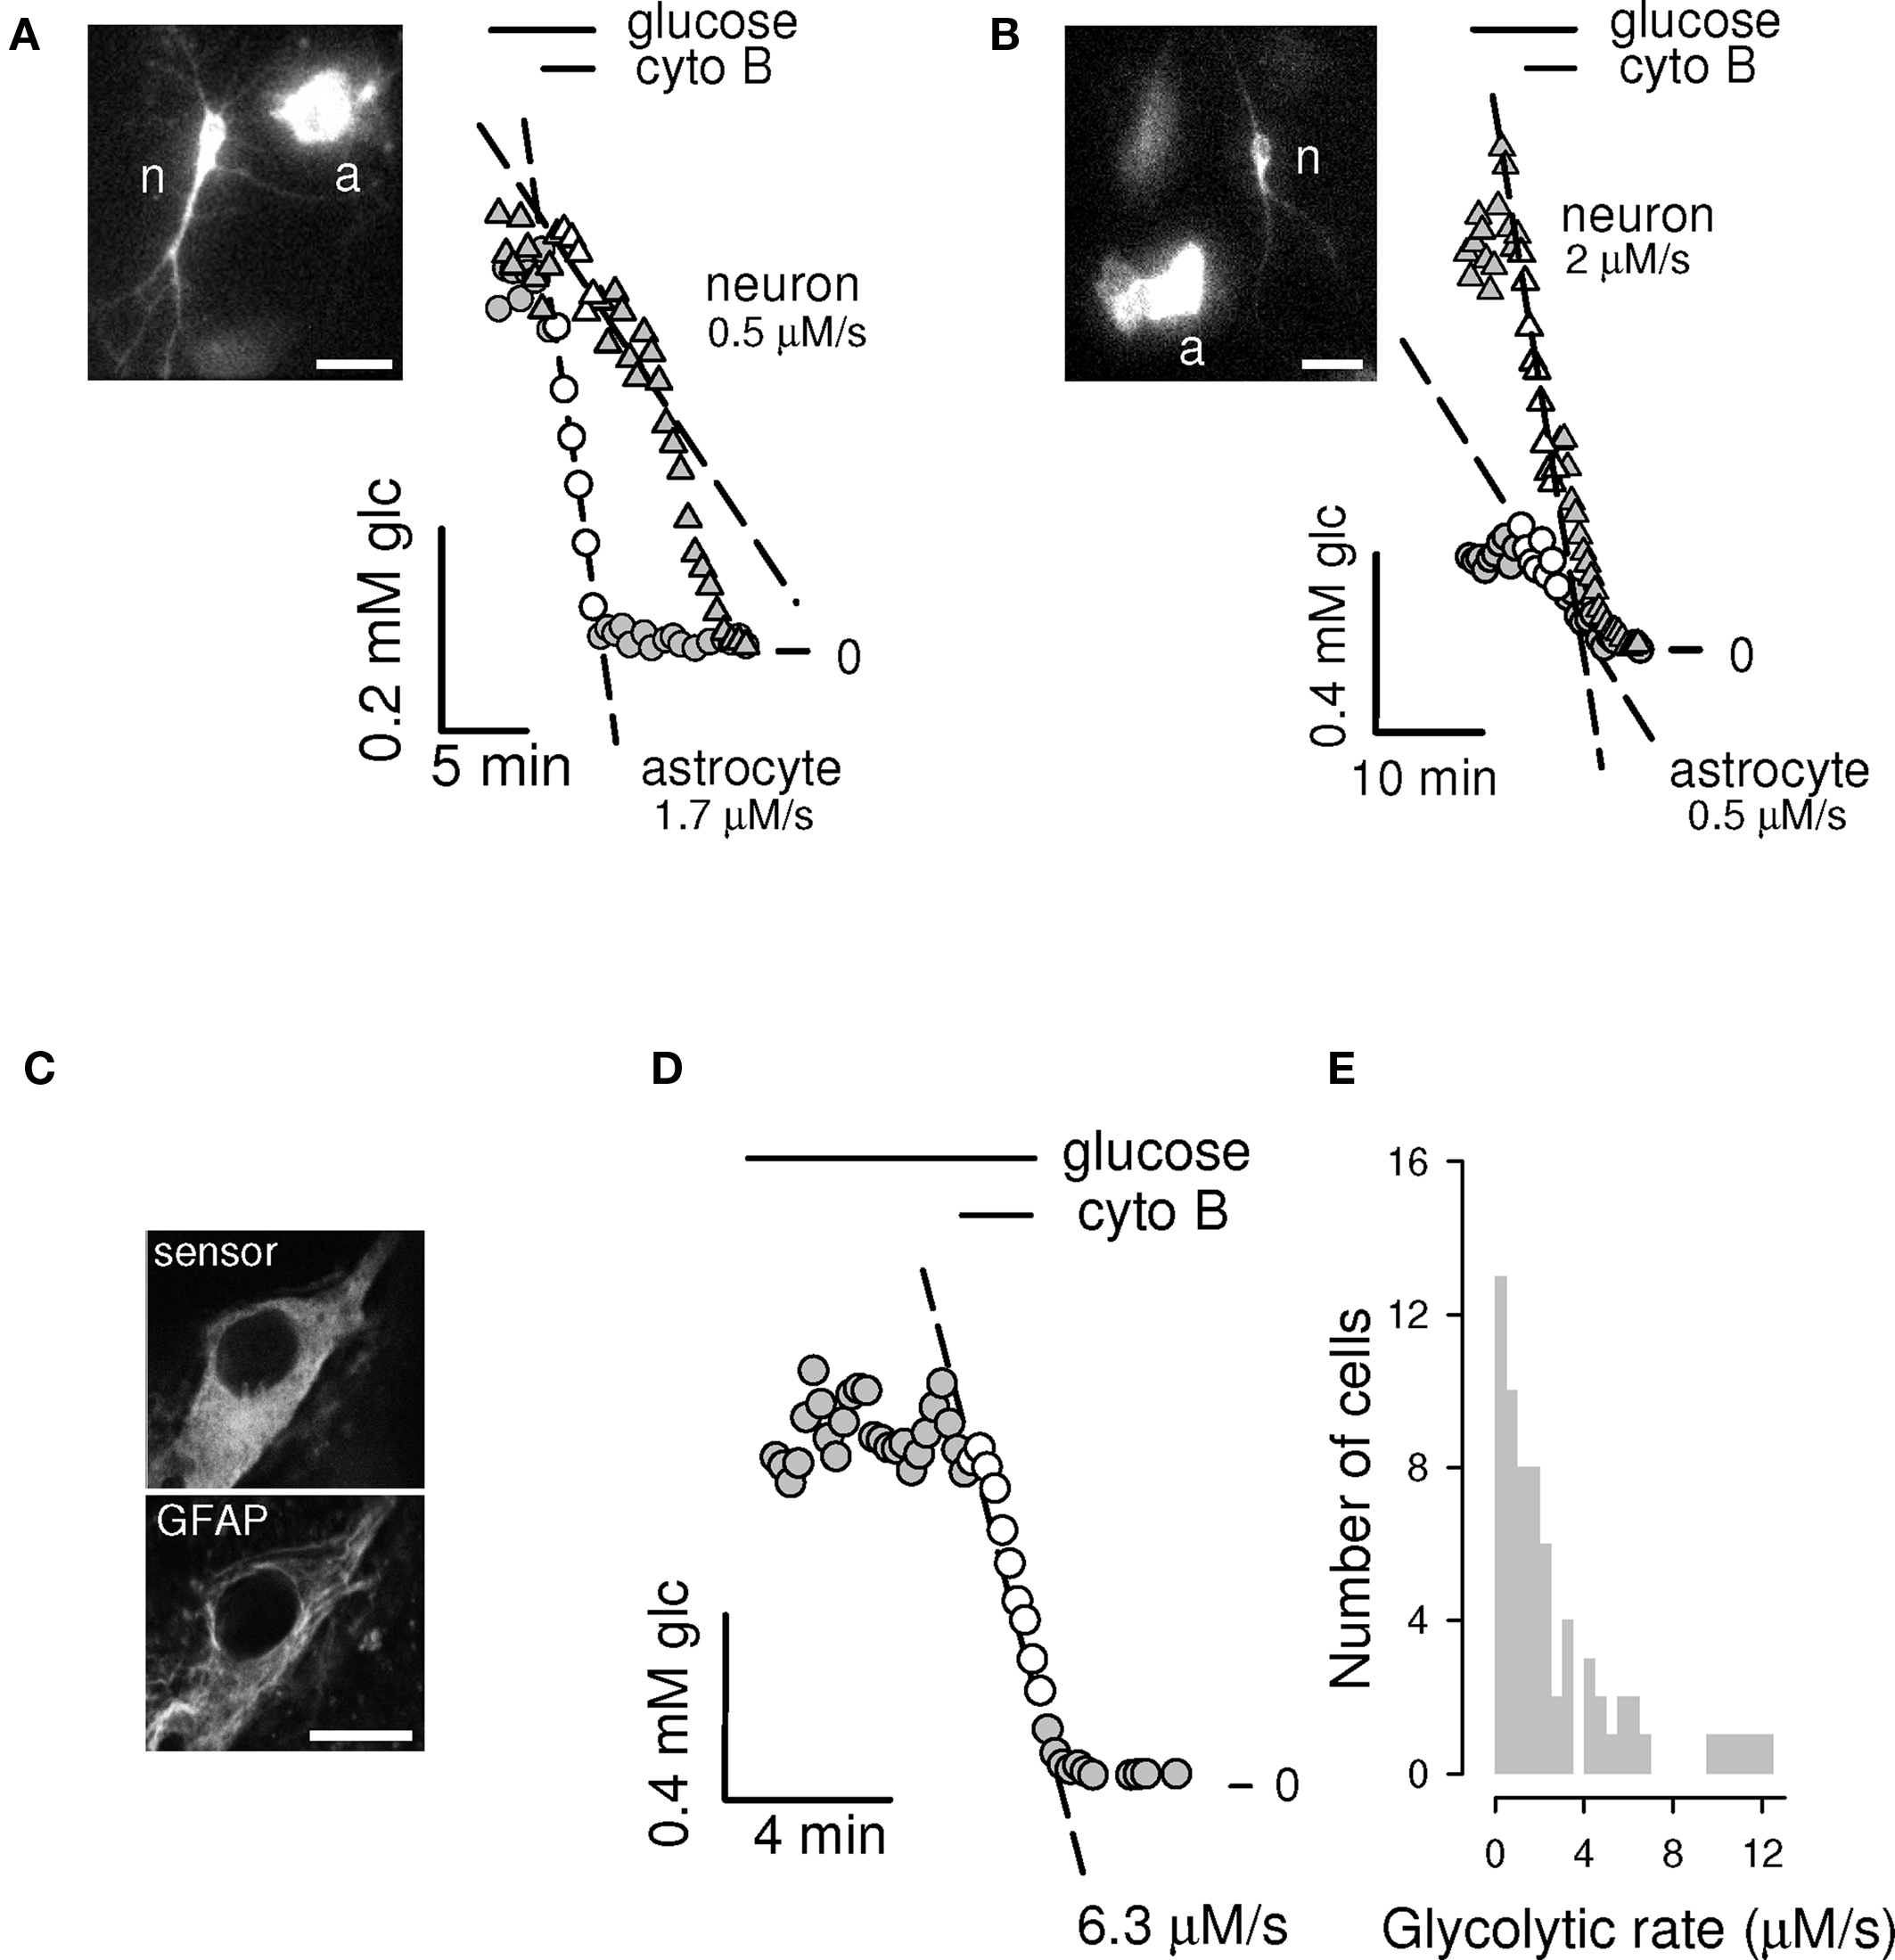
Figure 6. Spatial resolution: simultaneous measurement of glycolytic rate in neighboring astrocytes and neurons. Two examples of simultaneous measurement of glycolytic rate in a neuron (n) and an adjacent astrocyte (a) in a dispersed culture are shown. Whereas for example (A), the astrocyte is faster than the neuron, in (B) the opposite is true. The other astrocyte pictured in b also presented a low metabolic rate. Bars represent 25 μm. Image contrast was enhanced to make neuronal processes more visible. (C) Hippocampal slices were infected as described in Materials and Methods. Confocal images show colocalization of the glucose nanosensor (top) and the astrocytic marker GFAP (bottom). Bar represents 10 μm. (D) Slices were superfused with 2 mM glucose and ITM was applied, giving a rate of 6.3 μM/s. (E) Distribution histogram of the rates obtained for 68 cells in 25 slices.
Measurement of Metabolic Rate in Adipocytes, Muscle Cells, and Tumor Cells
The metabolic rate of adipocytes, muscle cells, and epithelial cells is a parameter of importance for the pathogenesis of diabetes mellitus and cancer. In order to test the applicability of ITM in these cell types, the FRET nanosensor was expressed in several cell lines using liposome transfection. The results included in Figure 7, show high metabolic rates in undifferentiated cells and tumor cells (3T3-L1 fibroblasts, C2C12 myoblasts, and HeLa cells), whereas differentiation of fibroblasts into adipocytes led to a marked decrease in their rate of metabolism. These results confirm previous data obtained with radioactive techniques but reliance of the present methods on fluorescence makes them more amenable for the purposes of high-throughput analysis using microtiter plates. An additional contribution of fluorescence-based methodologies is the observation that cultured cell lines are highly heterogeneous in terms of metabolic rate. We did not observe an obvious correlation between Citrine fluorescence intensity and glycolytic rate (Figure 8), indicating that the heterogeneity is not due to a possible effect of sensor expression.
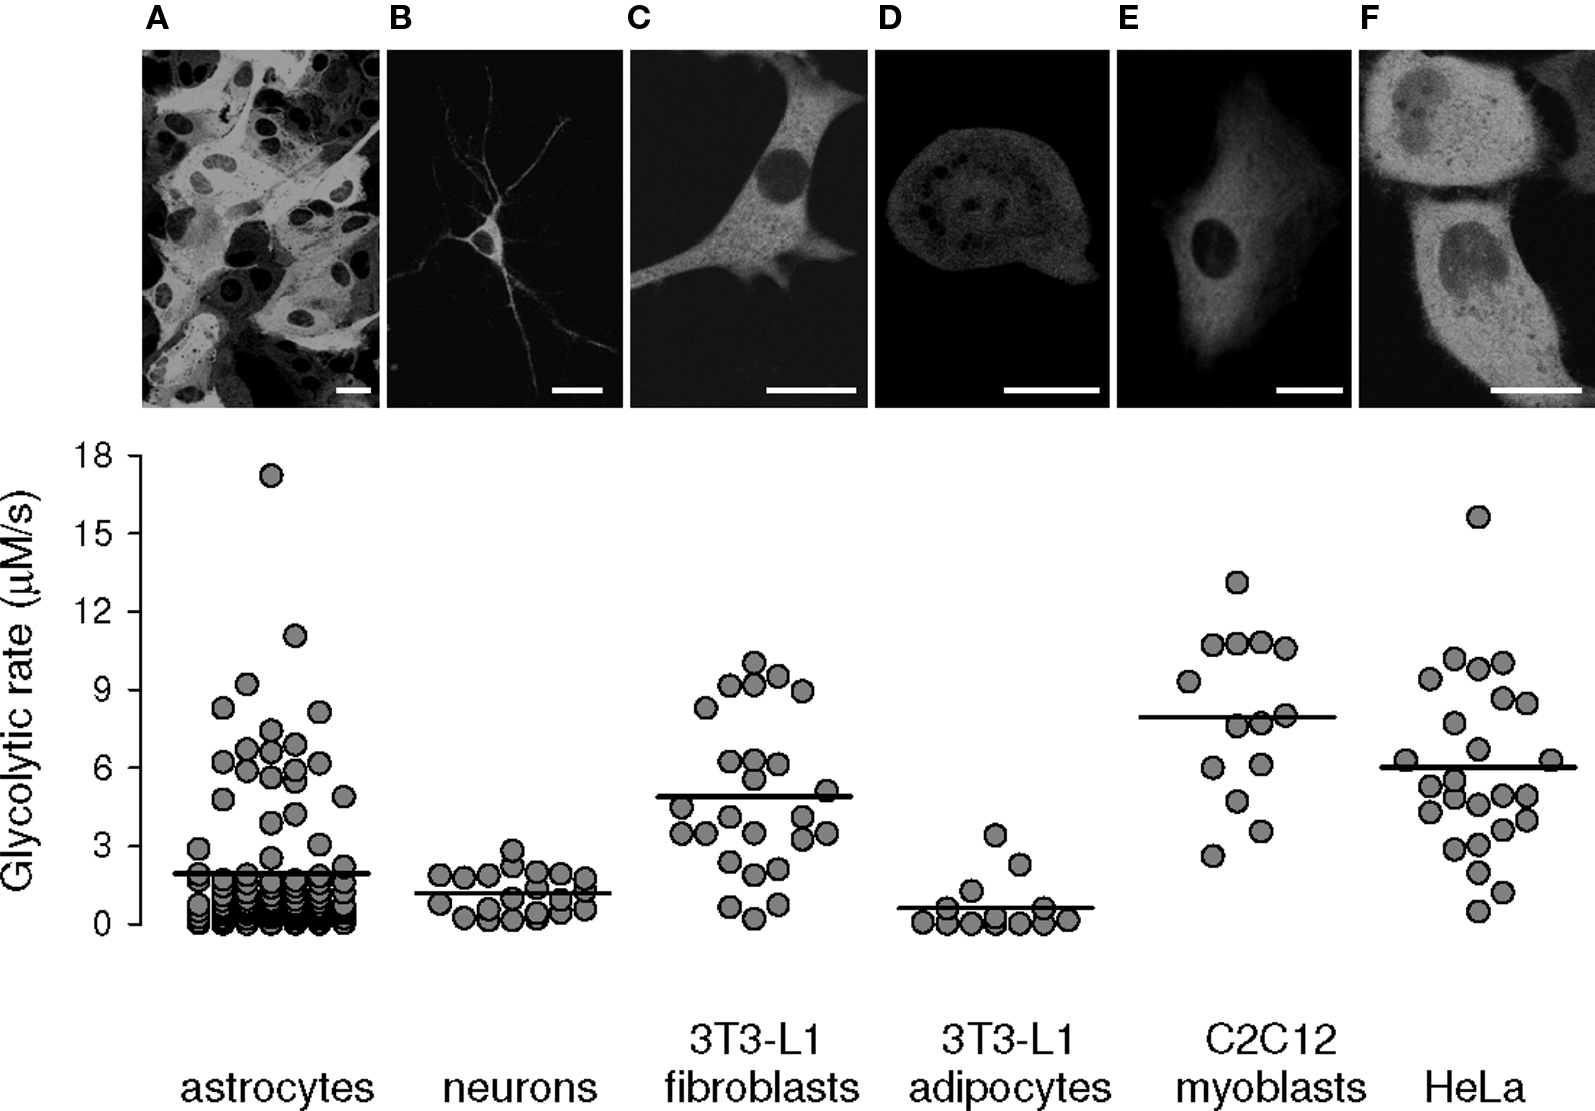
Figure 7. Heterogeneity of glycolytic rates in various cell types. Confocal imaging of the glucose sensor expressed in astrocytes (A), neurons (B), 3T3-L1 fibroblasts (C), 3T3-L1 adipocytes (D), C2C12 myoblasts (E), and HeLa cells (F), displaying its expected cytosolic distribution, with exclusion of nuclei and organelles. Graphs summarize glycolytic rates obtained with ITM, with averages represented by a horizontal line (n > 14 cells in at least four experiments in each cell type).
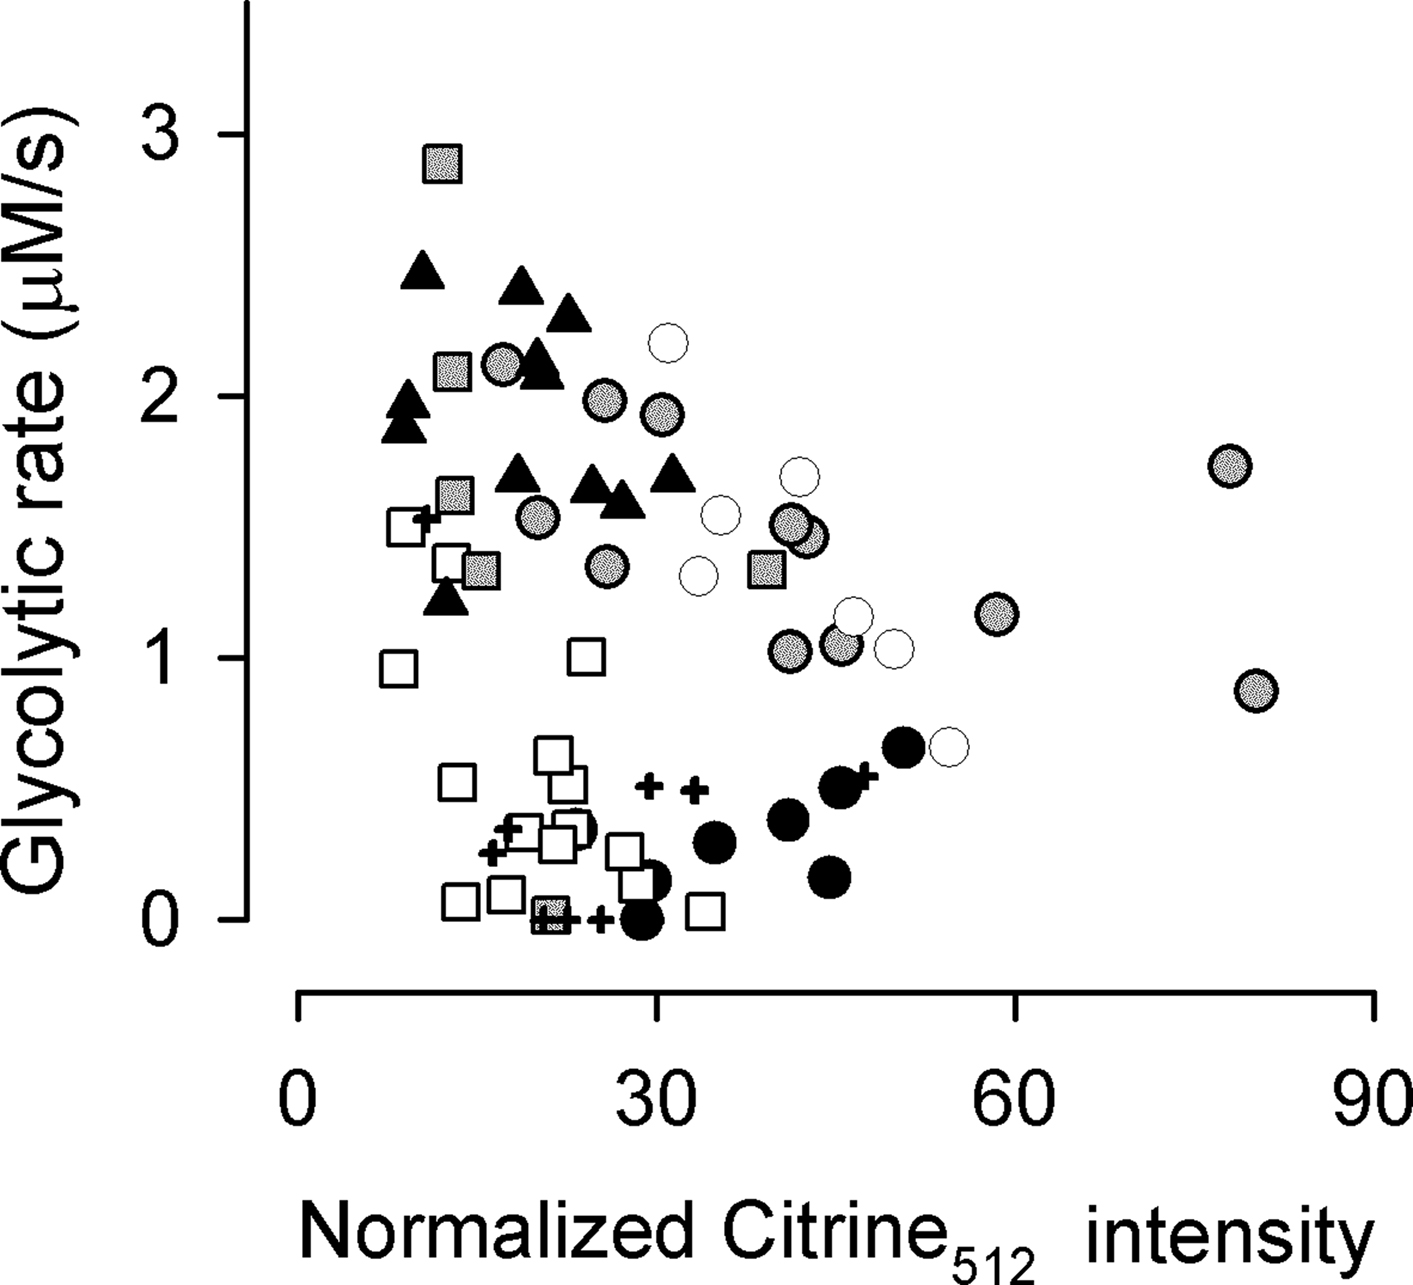
Figure 8. Lack of clear correlation between level of sensor expression and glycolytic rate. The glycolytic rate was measured in cultured astrocytes using ITM and the result is plotted against the fluorescence intensity of the sensor as excited at 512 nm, divided by camera exposure time in milliseconds. Excitation intensity and camera gain were identical in all experiments, so this normalized intensity serves as a parameter of sensor abundance. Each kind of symbol represents cells from a single experiment (n = 80 cells from seven experiments).
Discussion
Brain tissue is composed by many different cell types, each one characterized by unique energy requirements and most likely by a specific way to ensure proper energy delivery. However, most of this rich microscopic detail remains hidden because current techniques to measure metabolic flux have limited spatiotemporal resolution (Barros, 2010). The present article has introduced two new strategies for the measurement of the metabolic rate, whose common rationale is the isolation of glucose phosphorylation by eliminating the contribution of the glucose transporters. These methods offer a temporal resolution of seconds and a spatial resolution of micrometers, comparing favorably with standard methods based on 2-deoxyglucose, which offer a temporal resolution of minutes and a spatial resolution of millimeters. Some elegant variations of the 2-deoxyglucose method have achieved cellular resolution but for long term measurements (Vega et al., 2003; Nehlig et al., 2004; Nehlig and Coles, 2007). In addition to high resolution an important advantage of the present methods is the use of glucose itself, as opposed to glucose analogs, whose handling by hexokinase and posterior fates are often uncertain. One of these analogs, 2-NBDG, the fluorescent version of deoxyglucose, can be resolved at cell level, but its uptake is not directly informative about metabolic rate because, is three orders of magnitude slower than glucose uptake and sensitive to the properties of the glucose transporter (Loaiza et al., 2003; Yamada et al., 2007; Barros et al., 2009).
Both ETM and ITM offer cellular resolution and are reversible, presenting different strengths and weaknesses that make them complementary. ITM is more robust, requiring only a straightforward linear fit to the data, as opposed to ETM, which involves fitting an exponential equation and calculating an instantaneous slope, operations that demand high quality data. A second advantage of ITM over ETM is that the former can be applied regardless of how slow is the metabolic rate. For instance, a very slow rate of glycolysis may still be measured over 20 s but measuring a very slow rate with ETM will demand impractically long determinations, e.g., 20 min or more, and therefore be affected by focus drifts, temperature variation, cell movement, sample evaporation, etc. Thirdly, the temporal resolution of ITM is much better and only limited by the time required for data acquisition, usually less than 1 s, providing an extended window of measurement that can be used to explore acute modulation of metabolism in real time. The main advantage of ETM is that is less invasive as it does not require addition of a pharmacological inhibitor. Cytochalasin B affects the actin cytoskeleton and may interfere with glycolytic enzymes or with proteins modulating glycolysis in unanticipated ways. Although this was not found to be the case in astrocytes, control experiments with cytochalasin D (Figure 3) are advised when dealing with a new cell type. Also, as ETM does not require an inhibitor, it can be applied to hepatocytes and pancreatic beta-cells, which are rich in GLUT2 and therefore relatively insensitive to cytochalasin B and phloretin. An ideal version of ITM would use a yet-to-be-developed potent but reversible, specific and non-permeant inhibitor of GLUTs. ETM assumes that the transport of glucose across the membrane is equilibrative, which is known to be the case for most mammalian cell types, both normal and malignant, but not so for some epithelial cells in intestine and kidney, which express the Na+-coupled glucose transporter SGLT. In those cells ETM can not be used, but ITM may be still applicable with the addition of phloridzin or another SGLT blocker. In cells expressing glucose-6-phosphatase, which are capable of synthesizing glucose, both methods can be applied, but instead of giving the metabolic rate they will report the net difference between glucose usage and glucose production. In summary, we advise that new cell types or conditions should first be approached with both ITM and ETM. Estimation of similar rates with both methods will indicate that cytochalasin B does not affect glycolysis per se and along cytochalasin D control assays, will validate the more robust ITM in that particular system. Correct application of the methods requires either rapid delivery of the inhibitor or a step-like change in extracellular glucose concentration, which are easily attainable in monolayers of cultured cells and thin tissue slices. Cytochalasin B is highly hydrophobic and penetrates tissues quite rapidly but depending on the distances involved, its diffusion into thick tissues and intact organs in vivo may have to be corrected for. A similar caveat applies to ETM regarding quick control of extracellular glucose concentration. The glucose sensor is a protein and its expression demands energy and other cell resources that may in principle influence cell metabolism. Although finding a lack of correlation between sensor expression and glycolytic rate helps to discard expression level as a major confounding factor (e.g., Figure 8), expression should best be kept at the minimum compatible with the sensitivity of available recording devices. Another general concern when using molecular sensors is the possible effect of the sensor on the concentration of the molecule that is being measured, a factor that is critical for Ca2+ and pH measurements, in which sensor and analyte may be present at similar nanomolar concentrations and the sensor becomes a significant buffer. This is not the case for glucose, which is present at high micromolar levels or more and is not expected to be influenced by typical protein sensor concentrations.
Two original observations were made with the new methods demonstrating their improved temporal and spatial resolution. Firstly, it was possible for the first time to observe that astrocytic glycolysis can be activated within seconds by neuronal signals. Previous measurements of deoxyglucose uptake over 20 min had given conflicting results (Dienel and Cruz, 2004; Bonvento et al., 2005; Nehlig and Coles, 2007; Pellerin et al., 2007), but the present method, with its temporal resolution of seconds, was able to show that astrocytic glycolysis is highly sensitive to mediators that are released at the excitatory synapse. The strength and speed of the glycolytic activation observed provides a mechanistic explanation for the fall in glucose concentration and the surge in lactate concentration that can be detected in the brain tissue 5–20 s after the onset of neuronal activation (Silver and Erecinska, 1994; Hu and Wilson, 1997a,b; Mangia et al., 2003; Caesar et al., 2008), supporting a central role for astrocytes in metabolic coupling and blood flow regulation in the brain (Gordon et al., 2008; Magistretti, 2009). Cultured astrocytes are known to release abundant lactate under basal conditions so it seems likely that the stimulation of glycolysis by glutamate/K+ leads to augmented lactate release. However, it should be borne in mind that these were measurements with abundant oxygen and that an increase in glycolytic rate does not necessarily imply an increase in lactate production, for a fast stimulation in mitochondrial pyruvate oxidation is also a theoretical possibility. Future technical developments allowing high resolution lactate and/or O2 measurements may help to clarify the important issue of how much glucose goes to lactate and how much goes to CO2.
In addition, the improved spatial resolution of the methods allowed monitoring, for the first time, the glycolytic rate of a neuron lying on an astrocytic bed. Given the inherent limitations of isotopic measurements, previous work had measured these cells in isolation, but this is not ideal because both cell types require each other for proper differentiation and functional specialization. The present results in co-culture showed high cell-to-cell variability and on average astrocytes were found to metabolize glucose faster than neurons. Astrocytes could also be studied in brain slices, suggesting that in the near future it will be possible to compare the metabolic rates of both cells types in the tissue, in slices and in vivo. The cell-to-cell variability was not related to level of sensor expression, suggesting that it is a reflection of their biology and not due to stress resulting from protein overproduction. There are subtypes of astrocytes in the brain that can be distinguished electrophysiologically and by preferential expression of Na+-glutamate cotransporters or metabotropic glutamate receptors. Other sources of variation that are valid for astrocytes and also for the other cells types are cell cycle staging, degree of contact inhibition, and cell viability. All these possibilities are now open to further investigation.
In order to demonstrate the use of these methods in non-neural cell types, we chose fibroblasts, adipocytes, and myoblasts, cells that are widely used for basic research and drug-screening. The hypoglycemic effect of insulin is largely caused by an increase in the metabolic rate of adipocytes and muscle cells, a process that becomes defective in diabetes; we envisage that the current methods may be useful for basic and applied research related to this disease. High metabolic rates were observed in HeLa, a human epithelial cell line widely used in cancer research. The enhanced glycolytic rate observed in tumor cells, i.e., the Warburg effect, is exploited for the purposes of diagnosis and staging by means of FDG-PET scanning, and has recently been proposed to play a pathogenic role in cancer progression (Vander Heiden et al., 2009). Simultaneous respirometry and pH measurement with fluorescent sensors has been implemented successfully in multi-well format to assess metabolism in cell populations with resolution of minutes (Gerencser et al., 2009). The techniques to measure glycolytic rate that were described in this article are readily adaptable to multi-well format and may be used alongside respirometry for the purposes of high-throughput investigation of cellular metabolism in cancer and other diseases.
Conflict of Interest Statement
This work has been partly described in the International Patent Application PCT/US10/40643.
Acknowledgments
We thank Karen Everett for critical reading of the manuscript. This work was funded by Fondecyt grants 10070046 and 1100936. The Centro de Estudios Científicos (CECS) is funded by the Chilean Government through the Millennium Science Initiative and the Centers of Excellence Base Financing Program of CONICYT. CECS is also supported by a group of private companies which at present includes Antofagasta Minerals, Arauco, Empresas CMPC, Indura, Naviera Ultragas and Telefónica del Sur. CIN is funded by Conicyt and the Gobierno Regional de Los Ríos. Wolf B. Frommer is supported by a grant from NIH (NIDDK 1RO1DK079109-01).
References
Barros, L. F. (1999). Measurement of sugar transport in single living cells. Pflugers Arch. 437, 763–770.
Barros, L. F. (2010). Towards single-cell real-time imaging of energy metabolism in the brain. Front. Neuroenerg. 2:4. doi:10.3389/fnene.2010.00004. PMID: 20577639
Barros, L. F., Bittner, C. X., Loaiza, A., and Porras, O. H. (2007). A quantitative overview of glucose dynamics in the gliovascular unit. Glia 55, 1222–1237.
Barros, L. F., Courjaret, R., Jakoby, P., Loaiza, A., Lohr, C., and Deitmer, J. W. (2009). Preferential transport and metabolism of glucose in Bergmann glia over Purkinje cells: a multiphoton study of cerebellar slices. Glia 57, 962–970.
Barros, L. F., and Deitmer, J. W. (2010). Glucose and lactate supply to the synapse. Brain Res. Rev. 63, 149–159.
Berg, J., Hung, Y. P., and Yellen, G. (2009). A genetically encoded fluorescent reporter of ATP:ADP ratio. Nat. Methods 6, 161–166.
Bonvento, G., Herard, A. S., and Voutsinos-Porche, B. (2005). The astrocyte – neuron lactate shuttle: a debated but still valuable hypothesis for brain imaging. J. Cereb. Blood Flow Metab. 25, 1394–1399.
Brennan, A. M., Connor, J. A., and Shuttleworth, C. W. (2006). NAD(P)H fluorescence transients after synaptic activity in brain slices: predominant role of mitochondrial function. J. Cereb. Blood Flow Metab. 26, 1389–1406.
Caesar, K., Hashemi, P., Douhou, A., Bonvento, G., Boutelle, M. G., Walls, A. B., and Lauritzen, M. (2008). Glutamate receptor-dependent increments in lactate, glucose and oxygen metabolism evoked in rat cerebellum in vivo. J. Physiol. 586, 1337–1349.
Deuschle, K., Okumoto, S., Fehr, M., Looger, L. L., Kozhukh, L., and Frommer, W. B. (2005). Construction and optimization of a family of genetically encoded metabolite sensors by semirational protein engineering. Protein Sci. 14, 2304–2314.
Dienel, G. A., and Cruz, N. F. (2004). Nutrition during brain activation: does cell-to-cell lactate shuttling contribute significantly to sweet and sour food for thought? Neurochem. Int. 45, 321–351.
Dulla, C., Tani, H., Okumoto, S., Frommer, W. B., Reimer, R. J., and Huguenard, J. R. (2008). Imaging of glutamate in brain slices using FRET sensors. J. Neurosci. Methods 168, 306–319.
Fehr, M., Lalonde, S., Lager, I., Wolff, M. W., and Frommer, W. B. (2003). In vivo imaging of the dynamics of glucose uptake in the cytosol of COS-7 cells by fluorescent nanosensors. J. Biol. Chem. 278, 19127–19133.
Gerencser, A. A., Neilson, A., Choi, S. W., Edman, U., Yadava, N., Oh, R. J., Ferrick, D. A., Nicholls, D. G., and Brand, M. D. (2009). Quantitative microplate-based respirometry with correction for oxygen diffusion. Anal. Chem. 81, 6868–6878.
Gordon, G. R., Choi, H. B., Rungta, R. L., Ellis-Davies, G. C., and MacVicar, B. A. (2008). Brain metabolism dictates the polarity of astrocyte control over arterioles. Nature 456,745–749.
Hu, Y., and Wilson, G. S. (1997a). A temporary local energy pool coupled to neuronal activity: fluctuations of extracellular lactate levels in rat brain monitored with rapid-response enzyme-based sensor. J. Neurochem. 69, 1484–1490.
Hu, Y., and Wilson, G. S. (1997b). Rapid changes in local extracellular rat brain glucose observed with an in vivo glucose sensor. J. Neurochem. 68, 1745–1752.
Kurtoglu, M., Maher, J. C., and Lampidis, T. J. (2007). Differential toxic mechanisms of 2-deoxy-D-glucose versus 2-fluorodeoxy-D-glucose in hypoxic and normoxic tumor cells. Antioxid. Redox. Signal. 9, 1383–1390.
Livet, J., Weissman, T. A., Kang, H., Draft, R. W., Lu, J., Bennis, R. A., Sanes, J. R., and Lichtman, J. W. (2007). Transgenic strategies for combinatorial expression of fluorescent proteins in the nervous system. Nature 450, 56–62.
Loaiza, A., Porras, O. H., and Barros, L. F. (2003). Glutamate triggers rapid glucose transport stimulation in astrocytes as evidenced by real-time confocal microscopy. J. Neurosci. 23, 7337–7342.
Magistretti, P. J. (2009). Role of glutamate in neuron-glia metabolic coupling. Am. J. Clin. Nutr. 90, 875S–880S.
Mangia, S., Garreffa, G., Bianciardi, M., Giove, F., Di, S. F., and Maraviglia, B. (2003). The aerobic brain: lactate decrease at the onset of neural activity. Neuroscience 118, 7–10.
Mangia, S., Simpson, I. A., Vannucci, S. J., and Carruthers, A. (2009). The in vivo neuron-to-astrocyte lactate shuttle in human brain: evidence from modeling of measured lactate levels during visual stimulation. J. Neurochem. 109(Suppl. 1), 55–62.
Nehlig, A., and Coles, J. A. (2007). Cellular pathways of energy metabolism in the brain: is glucose used by neurons or astrocytes? Glia 55, 1238–1250.
Nehlig, A., Wittendorp-Rechenmann, E., and Lam, C. D. (2004). Selective uptake of [14C]2-deoxyglucose by neurons and astrocytes: high-resolution microautoradiographic imaging by cellular 14C-trajectography combined with immunohistochemistry. J. Cereb. Blood Flow Metab 24, 1004–1014.
Nie, Y., and Wong, C. (2008). Suppressing the activity of ERRalpha in 3T3-L1 adipocytes reduces mitochondrial biogenesis but enhances glycolysis and basal glucose uptake. J. Cell Mol. Med. 13, 3051–3060.
Pellerin, L., Bouzier-Sore, A. K., Aubert, A., Serres, S., Merle, M., Costalat, R., and Magistretti, P. J. (2007). Activity-dependent regulation of energy metabolism by astrocytes: an update. Glia 55, 1251–1262.
Pellerin, L., and Magistretti, P. J. (1994). Glutamate uptake into astrocytes stimulates aerobic glycolysis: a mechanism coupling neuronal activity to glucose utilization. Proc. Natl. Acad. Sci. U.S.A. 91, 10625–10629.
Porras, O. H., Ruminot, I., Loaiza, A., and Barros, L. F. (2008). Na(+)-Ca(2+) cosignaling in the stimulation of the glucose transporter GLUT1 in cultured astrocytes. Glia 56, 59–68.
Ridoux, V., Robert, J., Perricaudet, M., Mallet, J., and Le Gal La, S. G. (1995). Adenovirus mediated gene transfer in organotypic brain slices. Neurobiol. Dis. 2, 49–54.
Shuttleworth, C. W. (2010). Use of NAD(P)H and flavoprotein autofluorescence transients to probe neuron and astrocyte responses to synaptic activation. Neurochem. Int. 56, 379–386.
Silver, I. A., and Erecinska, M. (1994). Extracellular glucose concentration in mammalian brain: continuous monitoring of changes during increased neuronal activity and upon limitation in oxygen supply in normo-, hypo-, and hyperglycemic animals. J. Neurosci. 14, 5068–5076.
Takanaga, H., Chaudhuri, B., and Frommer, W. B. (2008). GLUT1 and GLUT9 as major contributors to glucose influx in HepG2 cells identified by a high sensitivity intramolecular FRET glucose sensor. Biochim. Biophys. Acta. 1778, 1091–1099.
Takanaga, H., and Frommer, W. B. (2010). Facilitative plasma membrane transporters function during ER transit. FASEB J. doi: 10.1096/fj.09-146472
Vander Heiden, M. G., Cantley, L. C., and Thompson, C. B. (2009). Understanding the Warburg effect: the metabolic requirements of cell proliferation. Science 324, 1029–1033.
Vega, C., Martiel, J. L., Drouhault, D., Burckhart, M. F., and Coles, J. A. (2003). Uptake of locally applied deoxyglucose, glucose and lactate by axons and Schwann cells of rat vagus nerve. J. Physiol. 546, 551–564.
Wilson, J. E. (2003). Isozymes of mammalian hexokinase: structure, subcellular localization and metabolic function. J. Exp. Biol. 206, 2049–2057.
Yamada, K., Saito, M., Matsuoka, H., and Inagaki, N. (2007). A real-time method of imaging glucose uptake in single, living mammalian cells. Nat. Protoc. 2, 753–762.
Keywords: glucose, glycolysis, FRET nanosensor, cytochalasin B
Citation: Bittner CX, Loaiza A, Ruminot I, Larenas V, Sotelo-Hitschfeld T, Gutiérrez R, Córdova A, Valdebenito R, Frommer WB and Barros LF (2010) High resolution measurement of the glycolytic rate. Front. Neuroenerg. 2:26. doi: 10.3389/fnene.2010.00026
Received: 25 May 2010;
Paper pending published: 07 June 2010;
Accepted: 20 July 2010;
Published online: 15 September 2010.
Edited by:
Gilles Bonvento, CEA, CNRS, FranceReviewed by:
Bill Shuttleworth, University of New Mexico, USALuc Pellerin, University of Lausanne, Switzerland
Copyright: © 2010 Bittner, Loaiza, Ruminot, Larenas, Sotelo-Hitschfeld, Gutiérrez, Córdova, Valdebenito, Frommer and Barros. This is an open-access article subject to an exclusive license agreement between the authors and the Frontiers Research Foundation, which permits unrestricted use, distribution, and reproduction in any medium, provided the original authors and source are credited.
*Correspondence: L. Felipe Barros, Centro de Estudios Científicos (CECS), Casilla 1469, Valdivia, Chile. e-mail: fbarros@cecs.cl