Microglia in close vicinity of glioma cells: correlation between phenotype and metabolic alterations
- RMSB Center, Centre National de la Recherche Scientifique/Université Victor Segalen Bordeaux 2, Bordeaux, France
Microglia are immune cells within the central nervous system. In brain-developing tumors, gliomas are able to silence the defense and immune functions of microglia, a phenomenon which strongly contributes to tumor progression and treatment resistance. Being activated and highly motile, microglia infiltrate tumors and secrete macrophagic chemoattractant factors. Thereafter, the tumor cells shut down their immune properties and stimulate the microglia to release tumor growth-promoting factors. The result of such modulation is that a kind of symbiosis occurs between microglia and tumor cells, in favor of tumor growth. However, little is known about microglial phenotype and metabolic modifications in a tumoral environment. Co-cultures were performed using CHME5 microglia cells grown on collagen beads or on coverslips and placed on monolayer of C6 cells, limiting cell/cell contacts. Phagocytic behavior and expression of macrophagic and cytoskeleton markers were monitored. Respiratory properties and energetic metabolism were also studied with regard to the activated phenotype of microglia. In co-cultures, transitory modifications of microglial morphology and metabolism were observed linked to a concomitant transitory increase of phagocytic properties. Therefore, after 1 h of co-culture, microglia were activated but when longer in contact with tumor cells, phagocytic properties appear silenced. Like the behavior of the phenotype, microglial respiration showed a transitory readjustment although the mitochondria maintained their perinuclear relocation. Nevertheless, the energetic metabolism of the microglia was altered, suggesting a new energetic steady state. The results clearly indicate that like the depressed immune properties, the macrophagic and metabolic status of the microglia is quickly driven by the glioma environment, despite short initial phagocytic activation. Such findings question the possible contribution of diffusible tumor factors to the microglial metabolism.
Introduction
Microglia are considered more and more to belong to the monocyte cell family (Streit, 2005). They display properties common to peripheral macrophages such as phagocytosis, antigen presentation and release of cytokines and cytotoxins (Flaris et al., 1993; Brockhaus et al., 1996; Beyer et al., 2000; Aloisi, 2001; Hanisch, 2002). Understanding the behavior of microglia inside tumors requires knowledge of the immunological properties of the monocytes/macrophages in a tumoral environment. The unexpected weakness of the microglial immune defense against glioma and increasing experimental evidence suggest that microglial behavior is controlled by tumoral cells. Consequently, microglia appear to support tumor growth and infiltration (Paulus et al., 1992; Fries et al., 1996; Asai et al., 1999; Badie et al., 2000; Graeber et al., 2002; Hussain and Heimberger, 2005). Indeed, microglia infiltrate tumors like the monocytes and the macrophages. The proportion and the status of the microglia inside tumors are dependent on tumor type and grade. Microglia and macrophages can represent from 8% to 78% of the tumor mass (Morantz et al., 1979) with the highest proportion found in proliferative and high-grade tumors.
The recruitment and the accumulation of microglia seem regulated by the release from the tumors of chemoattractant molecules like monocyte chemotactic protein-1 (Prat et al., 2000), growth factors like granulocyte macrophage colony-stimulating factor, granulocyte colony-stimulating factor (Shambaugh et al., 1977; Tweardy et al., 1990), and cytokines like interleukins (IL)-1 and-6 (Takiguchi et al., 1985; Van Meir et al., 1990). Furthermore, microglial defense functions are compromised by glioma by way of impaired surface expression of major histocompatibility complex class II antigens (Watters et al., 2005). In such a scenario, the cytokine transforming growth factor (TGF)-β, an immunosuppressor secreted by brain tumors, plays a role in limiting the antitumoral function of microglia (Wesolowska et al., 2008). It inhibits tumor necrosis factor (TNF) release and peroxide synthesis as well as the activation of killer cells (Platten et al., 2001). Moreover, IL-10 expression in the human glioma cell line is correlated with the proliferative and migratory capabilities of glioma (Wagner et al., 1998). The IL-10 released in glioma is of microglia/macrophage origin, displays immunosuppressive properties and promotes glioma growth (O’Keefe et al., 1999). Finally, Fas ligand expression is also highly involved in the immunitary escape of the glioma (Badie and Schartner, 2001). When FasL activity is inhibited in brain tumors, the tumor-infiltrating lymphocyte population increases to a level similar to that observed in subcutaneous tumors (Restifo, 2000; Badie and Schartner, 2001) where microglia are not present. In fact, gliomas capitalize in vivo on all these microglial immune deficiencies (Flugel et al., 1999; Schartner et al., 2005) and in a brain tumor environment, so microglia may be considered to behave in a two-faced manner.
While the mechanisms and factors responsible for the invasion-promoting activity of microglia in a tumoral environment have begun to be understood, little is known about the biochemical events, and particularly the metabolic modulations, that are associated with such a situation. Indeed, they are of major interest for understanding patho-physiological processes as well as evidencing the immuno-pharmacological modifications of these cells. Activated microglia appear to have at least two states either a pro-inflammatory phenotype (classical activation) or an anti-inflammatory and reparative phenotype (alternative activation) (Gordon, 2003; Lacy-Hulbert and Moore, 2006). Macrophages are known to adopt these phenotypes in response to T helper type-1 or 2 cell (Th-1 or Th-2) cytokines like interferon-gamma/TNF alpha and Vaso Intestinal Peptid/IL4/IL13, respectively (Chan et al., 2001; Gonzalez-Rey and Delgado, 2005). The classical activation phenotype includes production of nitric oxide (NO), TNF alpha and IL-1, 6 and 12. The alternative phenotype is characterized by the expression of dectin-1, the mannose receptor and secretion of IL10 and collagen. These phenotypes are directly linked to the metabolic state of the macrophages. Th-1 stimuli increase glycolytic metabolism, providing energy and increasing production of pro-inflammatory cytokines, reactive oxygen species and nitric oxide for the respiration burst, thereby supporting the classical activation of macrophages (Cramer et al., 2003). In contrast, in response to Th-2, the cytokine IL4, via signal transducer and activator of transcription 6 (STAT6) and peroxisome proliferator-activated receptor-γ coativator-1 (PGC-1), enhances mitochondrial oxidative metabolism and mitochondrial biogenesis with consequences for lipid metabolism including uptake and oxidation of fatty acids (Vats et al., 2006). These results underline the control of the activated status by the impact of the Th-1/Th-2 balance on the metabolism and demonstrate the involvement of the induction of the metabolic pathways on the regulation of the classical and alternative activation of macrophages. They raise the possibility that metabolic priming of macrophages in the least inflammatory state might be a principal mechanism that could be targeted by therapies able to trigger macrophage-mediated inflammation in glioma and thus contribute to eliminating the tumor immunitary escape status.
Nevertheless, compared with macrophages, physiological and metabolic investigations of microglia are relatively more recent, and were begun two decades ago by characterization of the ionic channel (Kettenmann et al., 1990) and by comparative nuclear magnetic resonance (NMR) metabolic studies with macrophages (Seguin and Le Pape, 1994). While the morphological and phenotypic changes of microglia in a tumoral environment now seem better understood, the consequences of microglia–tumor cell interactions at the metabolic level seem less clear. In this context, the present study sought to characterize the respiration and energetic metabolisms of microglial cells in a tumor environment (C6 glioma cells) and to correlate them with phenotypic changes. Alterations in C6 cell behavior were also investigated. The metabolic properties of microglia/C6 glioma cells were studied through co-cultures, with microglia on 3D collagen beads and C6 cells as monolayer. Macrophage markers were monitored to characterize microglial status. The respiratory properties were analyzed by oxigraphy, flow cytometry and immunocytochemistry (targeting a mitochondrial antigen). The energetic metabolism was studied by investigating glucose consumption, lactate production, ATP and other phosphorylated compound contents. These metabolites were quantified by using biochemical tests and 31P-NMR spectroscopy.
Materials and Methods
Cell Cultures
C6-glioma cells derived from N-nitrosomethylurea induced rat glioblastoma (purchased from the ATTC-LGC bank) were plated at a density of 2.5 × 10⁴ cells/cm2 in 10-cm diameter Petri dishes in DMEM (Gibco-BRL) and were supplemented with penicillin (100 U/ml), streptomycin (0.1 mg/ml), fungizone (0.5 mg/ml), sodium bicarbonate (2 mg/ml), and 5% fetal calf serum (FCS) (Gibco-BRL). Cultures were carried out during 5 DIV in a water-saturated incubator at 37°C with 5% CO2 in air. The cell medium was changed every 2 days. At the end of the 5 DIV of growth, the cells were confluent (5 × 10⁵ cells/cm2).
The human microglia cell line (CHME-5, given by Professor Tardieu, Kremlin Bicêtre, France) was plated at a density of 1.5 × 10⁴ cells/cm2 in 10-cm diameter Petri dishes with MEM (Gibco-BRL) supplemented with penicillin (100 μ/ml), streptomycin (0.1 mg/ml), sodium bicarbonate (2 g/l), glutamine (584 mg/ml), glucose (4 g/l), and FCS (10%). Cultures were performed in a water-saturated incubator at 37°C with 5% CO2 in air. Microglia reached confluence after 4 DIV.
The C6-microglia co-cultures were performed by adding microglia (80% of confluence), growing either on coverslips or on beads, to C6 monolayer cultures (in C6 cell medium). Forty-eight hours before the co-culture, the monolayer of microglia was dissociated and the cell suspension was plated either on 12-mm diameter coverslips (5–10 × 105 cells) or on collagen beads (3–5 × 10⁶ cells per ml of beads). The microglia medium was replaced by C6 cell medium. This change does not affect microglia growth and phenotype.
Immunohistochemistry
ED1
Microglia were fixed with paraformaldehyde 4% (PFA) for 20 min, washed and permeabilized with triton X-100 (0.1%) in phosphate buffer saline (PBS). Between each step, cells were rinsed twice with PBS. After a saturation step with FCS 10%, cells were incubated with the monoclonal antibodies ED1 (Serotec) (1/100) for 2 h at room temperature and then with biotinylated anti-mouse antibodies (Vector) (1/100) in similar conditions. The presence of the antibodies was detected either by the streptavidin–biotin peroxidase amplification process (Vectastain ABC Vector) or by incubation for 1 h with extravidinCy 3 (Sigma) (1/300).
Staining for F-actin (phalloidin)
Microglia were fixed with PFA 4% in PBS for 30 min. After saturation in PBS–BSA (10%)-horse serum (HS, 10%) for 45 min at room temperature, cells were permeabilized by incubation in PBS–Triton X-100 (0.1%) for 5 min. After a second saturation in PBS–BSA–HS (2 h) at 4°C, cells were permeabilized with Tween 20 (0.04%) for 5 min at room temperature and incubated with rhodamine-isothiocyanate (TRITC) conjugated phalloidin (1/100) (Sigma) for 2 h at 4°C.
Vimentin
Microglial were fixed with acetone (10 min, −20°C). Between each step, cells were saturated with FCS overnight at 4°C. The primary anti-vimentin monoclonal antibody (1/5) (Boehringer Mannheim) was applied during 6–8 h (4°C) and revealed by a secondary fluorescent anti-mouse antibody (1/100) (Vector) (6–8 h at 4°C).
Tubulin
The cells were fixed with PBS–PFA (4%)-Triton X-100 (0.1%) for 30 min. After 1 h-saturation in FCS, cells were permeabilized with Tween 20 (0.04%) for 5 min. The primary anti-tubulin monoclonal antibody (1/150) (Sigma) was applied at 37°C for 1 h, and characterized similarly to the anti-vimentin monoclonal antibody.
Hsp/Hsc
Cells were fixed for 1 h with PFA 4% and then treated with NH4+ (30 min) followed by incubation with Triton X-100 (0.3%) in PBS (30 min). Before applying primary antibodies and between each step, cells were washed and incubated overnight in PBS containing 20% horse serum at 4°C. Incubations with anti-Hsp 70 (1/200), anti-Hsc 70 (1/200), or anti-Hsp 60 (1/200) monoclonal antibodies (Vector) were performed for 6–8 h at 4°C. The presence of the antibodies was revealed using a biotinylated secondary anti-mouse antibody (Vector) and the amplification process of avidin–biotin peroxidase (Vestastain Kit, Vector) with an incubation of 6–8 h at 4°C. Peroxidase activity was visualized with diaminobenzidine (0.05%) and H2O2 (0.009%).
All the cells were grown on coverslips which were then mounted on slides with Mowiol.
Flow Cytometry Analysis
Flow cytometry analysis was performed with the fluorescent probes propidium iodide (PI), DIOC6, calcein-AM, Nonyl acridine orange (NAO), and cytodex fluorescent beads. All these products were from Molecular Probes. For all these experiments, microglia and C6 cells were cultured either in isolated conditions or in co-culture for 1, 3, 6, and 24 h. Microglia were cultured either on collagen beads or on coverslips, the C6 cells being cultured as monolayers on Petri dishes.
PI and DIOC6
For each time point, the co-cultured populations were separated and incubated with PI (3 μg/ml) or with DIOC6 (0.1 μM) for 10 min. After two rinses, cells were dissociated from their support by trypsinization and kept in suspension in 1 ml of RPMI (a phenol-redless medium, to avoid optical interference during fluorescence measurements) medium (5% FCS) (Gibco). Fluorescence was analyzed by flow cytometry (λex: 488 nm, λem: 590 nm).
NAO
Thirty minutes before the end of the different time points, cells in co-culture were incubated with the NAO probe (5 μM) at 37°C. Then, the cell populations were separated, rinsed with RPMI and dissociated from their support by trypsinization. After centrifugation, cell pellets were homogenized in 1 ml RPMI and analyzed (λex: 488 nm, λem: 540 nm).
Calcein-AM
At the end of each time point, the cell populations were separated and incubated with a solution of Calcein-AM (50 nM) for 15 min at 37°C. Then the solution was discarded. The cells were rinsed twice with RPMI (10% FCS) and dissociated from their support by trypsinization. After centrifugation, the cells were resuspended with RPMI (1 ml) and analyzed by flow cytometry (λex: 488 nm, λem: 590 nm).
Fluorescent cytodex bead uptake
The cytodex beads (0.6%) were added in the medium 1 h before the end of the co-culture. The cell populations were thereafter separated, rinsed with RPMI and dissociated by trypsinization. The cell pellets were then homogenized in RPMI (1 ml) and analyzed by flow cytometry (λex: 488 nm, λem: 590 nm).
DIO
The long-chain dialkylcarbocyanine (DIO) is generally used as a lipophilic tracer. Microglia grown either on coverslips or on beads were incubated with DIO (10 ng/ml) for 10 min. Then microglia supports were dropped on the C6 monolayer. The co-cultures were maintained for 3, 6, or 24 h. Thereafter the microglia supports were removed from the co-culture. The C6 monolayer was fixed with a solution of PBS–PFA (4%) and the migrating microglia on the C6 monolayer were observed by fluorescence microscopy (λex: 450 nm, λem: 520 nm) and quantified.
Measurement of Oxygen Consumption
C6 cells were grown as monolayer in Petri dishes and microglia on collagen beads. For co-culture, the cell populations on their respective supports were mixed and at the indicated times, the beads were discarded and the C6 were scraped off. Oxygen uptake analysis was performed polarographically with a Clark type electrode (final volume 1 ml) with either the microglia on beads or the C6 cells in suspension. Respiration rates were calculated with respect to calibration of the oxygen electrode using air-saturated medium containing 220 μM O2 at 37°C. The effects of the addition of oligomycin (1.25 μg/ml), CCCP (0.1 mM), and KCN (2 mM) (Sigma) were analyzed. After the respiration tests, the viability of the cells was assessed by their ability to exclude Trypan blue directly from the C6 cell suspension and from the microglial suspension after trypsin digestion of the collagen beads.
Citrate Synthase Assay
C6 cells were grown as monolayer in Petri dishes and microglia were grown either in isolated culture condition or in co-culture. Then cells were lysed with Tris–HCl (50 mM) Triton X-100 (0.3%) at pH 7.5. Citrate synthase activity was monitored spectrophotometrically at 412 nm by recording the kinetics of the oxidation of acetyl-coenzyme A with 5.5′-dithiobis-(2-nitro-benzoate) (DTNB, Sigma). Enzyme activity was calculated using the value 13600 M−1 cm−1 for the DTNB extinction coefficient at 412 nm. Results were expressed as nmol/106 cells/min.
MTT Formazan Assay
Simultaneously to oxygen uptake measurement, dehydrogenase activity was evaluated using the MTT Formazan (1-(4,5-dimethylthiazol-2-yl)-3,5-diphenylformazan) test (Sigma). Monolayer C6 cells or microglia grown on beads were incubated with MTT (0.5 mg/ml) at 37°C for 45 min. Then, cells were washed with PBS, spun down and the insoluble formazan salt accumulated inside the cells was solubilized with 1 ml of DMSO and quantified spectrophotometrically at 570 nm.
Glucose and Lactate Consumptions
Glucose and lactate concentrations were determined from the cell culture medium of both the C6 monolayer cultures and the microglia on beads in isolated culture condition or in co-culture.
At different times, aliquots of the medium (175 μl) were removed and immediately added to 25 μl of a solution containing 35% (V/V) perchloric acid (PCA). Then, a solution of 2 N KOH/0.3 M MOPS was added until pH 6.5–7 performed neutralization. Enzymatic assays including glucose oxidase and peroxidase for glucose and lactate dehydrogenase for lactate were performed according to the supplier’s recommendations (Sigma).
ATP Determination
C6 cells and microglia were grown as for glucose and lactate determinations. At different times, cells in monolayer or on beads were collected, rinsed and frozen in liquid nitrogen. Then, proteins were precipitated in 0.9 M HClO4 containing 50 mM EDTA and eliminated by centrifugation (9000 g, 4 min, 4°C). The supernatant was neutralized with 2 N KOH/0.3 M MOPS and the precipitate eliminated by centrifugation. ATP concentrations were determined with the luciferine–luciferase methods (Lemasters and Hackenbrock, 1979).
31P-NMR Spectroscopy
NMR measurements were carried out on a Bruker AM400 spectrometer operating at 9.4T with a 5-mm cell probe-head. 31P-NMR spectra were acquired at 162 MHz. Cell PCA extracts were prepared as described in Pianet et al. (1991). After removal of the culture medium, cells were rapidly rinsed twice with 0.9% NaCl and the dishes were put into liquid nitrogen. The cells were scraped off in ice-cold 0.9 M HClO4 and the resulting suspension was centrifuged. The supernatant was neutralized by addition of 9 M KOH. After centrifugation, the KClO4 precipitate was discarded and the extract filtered through a Chelex 100 column (H+ form). The pH of the solution was then adjusted to 7.4 with Tris-base before freeze-drying. The lyophilized powder was dissolved in 50 μl (100 mM) EDTA pH 7.4 and 500 μl D2O. Each PCA extract spectrum was acquired overnight.
The acquisition parameters were as follows: 12 μs pulse; 0.819 s acquisition time; 0.5 s relaxation delay. Spectra were acquired with proton decoupling. Chemical shifts were expressed as ppm relative to the resonance at 17.4 ppm of the methylene diphosphonic acid (MPDA, Sigma) at pH 7.4. To evaluate the phosphorylated metabolite contents of the cells from spectra acquired under conditions of partial saturation and proton decoupling, we determined a correction factor calculated from spectra of samples containing known amounts of standard of each metabolite and MPDA submitted to the same treatment as PCA extracts (Merle et al., 1992).
Statistical Analysis
Data are represented as the mean ± standard deviation, resulting of at least three independent experiments. Data were analyzed by Student’s t test or ANOVA. The level of significance was set at p < 0.05.
Results
Mobility and Viability of Microglia in a C6 Cell Vicinity
C6 cells/microglia co-culture were prepared by growing microglia on beads that were subsequently added on top of C6 cell monolayers. This allowed separating the C6 cells and microglia at the end of the experiment. First of all, the ability of microglia to leave their support was checked by using DIO labeling and flow cytometry. Results indicated that microglia were slightly mobile and could leave the beads after 3 h of co-cultures (data not shown). However, the population did not exceed 3% at this time. After 6 and 24 h of co-culture, the proportion of microglia on the C6 monolayer did not exceed 6%.
Cell membrane integrity and microglial viability were analyzed during the first 24 h of co-culture by flow cytometry (Figure 1). Calcein methyl ester was used to check membrane integrity. This non-fluorescent molecule is membrane-permeant. Once inside the cells, calcein-AM is hydrolyzed by endogenous esterase into the highly green fluorescent calcein, which is retained in the cytoplasm of living cells. Figure 1A shows fluorescence of microglia in isolated culture conditions and various co-culture times. Results indicate a slight but non-significant decrease from 3 to 24 h of co-culture. Moreover, Figure 1B shows that propidium iodide was not significantly taken up by the microglia either in isolated culture or in co-culture. Taken together, these results indicate that the proximity of the C6 glioma did not seem to affect the viability of the microglia. The same results were observed on C6 glioma cells in co-culture (data not shown).
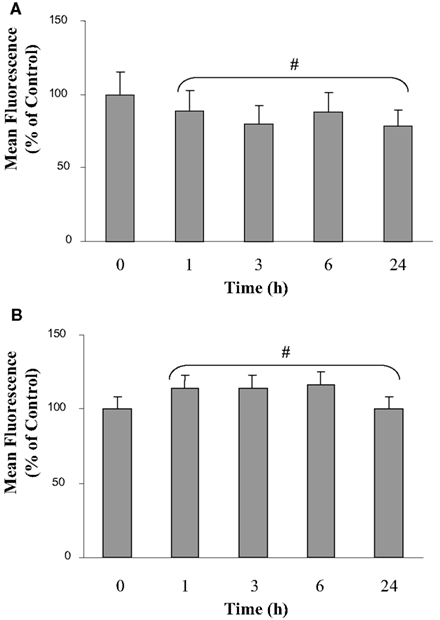
Figure 1. Calcein and propidium iodide fluorescence of microglia in co-culture. The calcein (A) and the propidium iodide (B) fluorescence were analyzed by flow cytometry. Results are expressed as percentage of the control mean values of fluorescence of 30,000 labeled microglial cells. The mean values of fluorescence represent 1800 and 12 arbitrary units for the calcein and the propidium iodide fluorescence in isolated microglia, respectively. Results were obtained from three independent experiments. #: No statistical difference between values at each time point and values at t = 0 h (p > 0.95).
Microglia Activation and Phagocytic Properties
Firstly, ED1 labeling shows that microglia in co-culture changed their morphology, being more retracted and ovoid. ED1 immunohistochemistry was performed to detect Cluster of Differentiation 68 (CD68). This protein is found on activated macrophages and its expression is correlated with phagocytic activity (Damoiseaux et al., 1994). Microglia expressed the ED1 antigen both in isolated (data not shown) and in co-culture (Figure 2) conditions. The ED1 labeling of microglia grown during 48 h and then shifted or not on Petri dishes without C6 cells gave at the t = 0 time point a similar labeling than that at t = 0 h when in co-culture. Labeling was located in the cytoplasm as well as in the processes. However, it appeared more intense in ovoid microglia in co-culture. This observation was mainly due to an increase in ED1 concentration, a consequence of the decrease in the cell volume in microglia. This ED1 labeling indicates that microglia were in an activated state with a potential phagocytic activity.
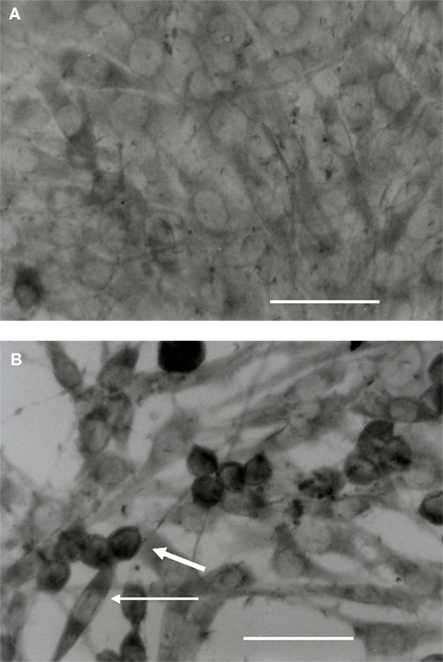
Figure 2. Microglia immuno-characterization of the ED1 antigen during co-culture. The microglia were grown on coverslips during 48 h and placed on Petri dishes with or without C6 cell monolayers. (A,B) are representative of the t = 0-h and t = 3-h time points, respectively. Cells were fixed and labeled with an ED1 antibody. Thick white arrow: ovoïd labeled cell; thin white arrow: elongated labeled cell. The scale is 50 μm (A,B).
This phagocytic activity was monitored using fluorescent carboxylate beads and flow cytometry. Results are presented in Figure 3 and show at least two major populations with different uptake capabilities in view of the heterogeneous population observed under microscopy (with regard to the cellular morphology, Figure 2). Microglia cultured in isolated condition, either on Petri dishes or on collagen beads, show similar pattern to that at t = 0 h. Both in isolated culture conditions and in co-culture at t = 0 (Figures 3A,D), 45% of the microglia appeared to be in a low phagocytic state (M1) and 55% of the cells had a high capacity for phagocytosis (M2) as shown by an average fluorescence 300 times higher than that found in the M1 population. During the first 3 h of co-culture, the low phagocytic population (M1) decreased whereas the highest one increased (M2) (Figures 3B,D). However, after 6 h of co-culture, this shift reversed, showing at 24 h a large increase in the M1 population and a drastic decrease in the M2 phagocytic one (Figures 3C,D). The uptake capacity of microglia can be evaluated by considering the relation “percentage of M2 cells” × “fluorescence average” (Figure 3E). The M2 population with the highest fluorescence increased by a factor 3 between 0 and 3 h. After 24 h, the microglia uptake capacities were poorly efficient due to the decrease in both the population concerned and the quantity of beads where uptake was detected. The contribution of the M1 population remained low and insignificant.
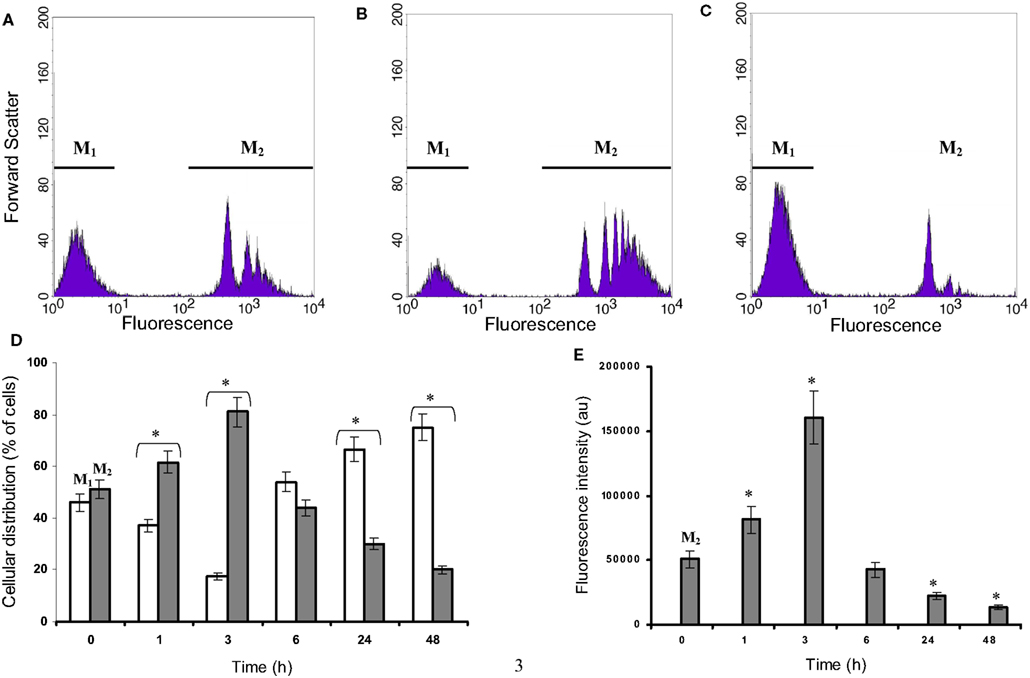
Figure 3. Microglial fluorescent bead uptake in a C6 cell environment. Microglia were co-cultured with C6 cells for different time points during 24 h and incubated with fluorescent beads of 1 μm diameter as described in experimental procedures. Thereafter, microglia were isolated and the fluorescence was analyzed by flow cytometry. (A–C) were obtained for microglia co-cultured at t = 0, 3 and 24 h, respectively. The gates M1 and M2 were chosen from the t = 0 h co-culture, where two populations with a low (M1) and a high (M2) level of fluorescence were observed. The percentages of the M1 (white) and M2 (gray) selected populations (three independent experiments) were calculated for the time points t = 1, 3, 24, and 48 h (D). Values in (E) were calculated from each gate and each time point as the product of the gated population percent multiplied by the corresponding mean fluorescence of this population (M1 values are very low). *: Values significantly different from its t = 0 h corresponding value (p < 0.01).
So, in the C6 cell vicinity, after a transitory phagocytic activated phenotype, microglia reversed to a non-phagocytic one, although the ED1 labeling and the morphological changes were maintained.
Cytoskeleton Modifications
In order to evaluate if changes in the cytoskeleton were involved in microglial activation, F-actin, tubulin and vimentin were stained by immunocytochemistry.
Microglia in isolated culture conditions were mostly flat cells. F-actin appeared around the stress fibers, the border of the cytoplasm membrane and the external membrane outgrowths (Figure 4A). During co-culture and particularly after 3 h, F-actin density increased, with labeling localized at the plasma membrane amassed in patches corresponding to the external outgrowths looking like kimono sleeves (Figure 4B). This F-actin distribution did not change between 3 and 24 h (data not shown).
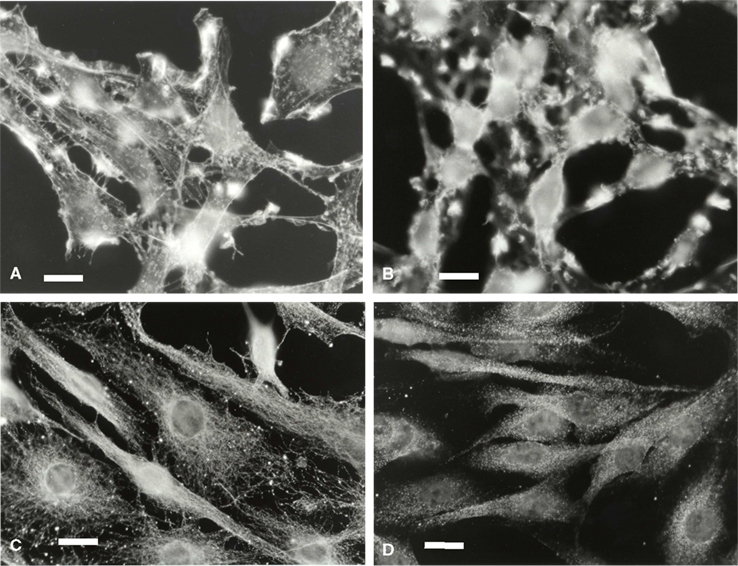
Figure 4. Microglial F-actin and tubulin characterization in a C6 cell environment. Microglia were labeled for F-actin at t = 0 h (A), and t = 3 h of co-culture (B) and for tubulin (C,D, 0 and 3 h of co-culture, respectively. The scale is 20 μm in (A,B) and 30 μm in (C,D).
Tubulin (Figures 4C,D) and vimentin (data not shown) in the microglia appeared as networks of continuous fibers spreading homogeneously throughout the cytoplasm. After 3 h of co-cultures, tubulin and vimentin labeling changed, the networks becoming unstructured and more diffuse. After 24 h of co-culture, the network recovered its fibrous perinuclear frame similar to that observed at t = 0 (data not shown).
Expression of Stress Proteins
Expression of Hsc70 and Hsp60 was assessed by immunocytochemistry. These two proteins are constitutively expressed by microglia at the cytoplasmic and mitochondrial levels, respectively. Hsp60 is present at the inner membrane level of mitochondria. The goal was to assess the possible induction of a cellular stress by C6 cells, indicated by observing a modification of their mitochondrial location.
Hsc70 and Hsp60 labeling of microglia grown in isolated culture conditions gave similar pattern to those shown in co-culture at time point 0 (Figures 5A,C, respectively).
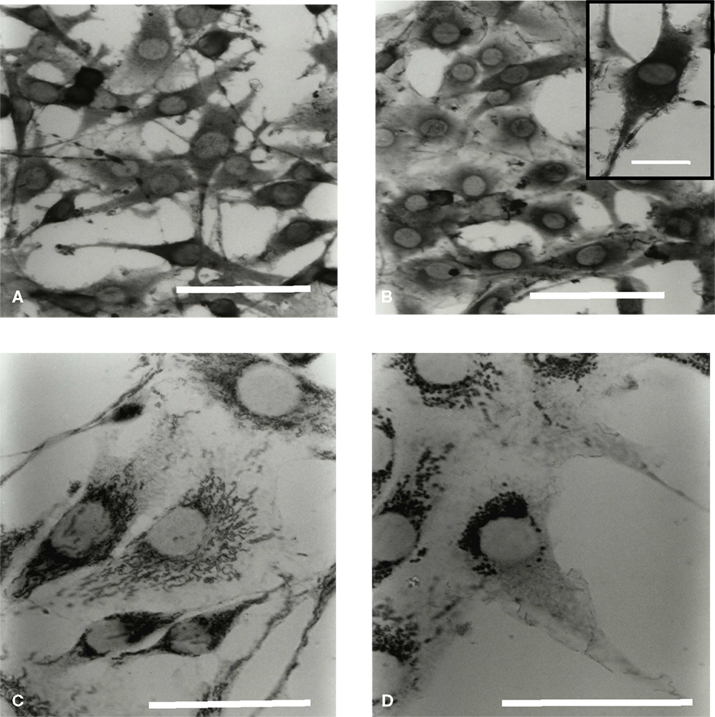
Figure 5. Microglial Hsc70 and Hsp60 immunolabeling in a C6 cell environment. Cells were processed for immuno labeling with antibodies specific for Hsc70 (A,B) and Hsp60 (C,D) proteins. (A,C) and (B,D) correspond to the time points 0 and 3 h of co-culture, respectively. The scale is 30 μm in (A,B) (insert: 10 μm), and 20 μm in (C,D).
In isolated culture conditions, microglia highly expressed the Hsc70 proteins in the cytoplasm (Figure 5A). External extensions resembling leaves and buds were also labeled. After 3 h (Figure 5B) and during 24 h of co-culture (longer times were also tested), neither the expression level of the Hsc70 protein nor its location were significantly modified. Moreover, the inducible Hsp70 proteins were undetectable (data not shown). Therefore, the transitory activation of the microglia in co-culture did not appear associated with a stress situation, as assessed by the expression of the Hsp70 protein family. Labeling of Hsp60 protein in isolated microglia showed a homogeneous distribution of the mitochondria both inside the cell body and throughout the processes with a typical dot line organization (data not shown). When microglia were cultured in the presence of C6 cells, the dot labeling of Hsp60 seemed clustered around the nucleus after 1 h. This phenomenon was greater after 3 h (Figure 5D) and still visible after 24 h of co-culture.
Comparing results obtained by immunocytochemistry on cytoskeleton modification and on Hsp60 location (a mitochondrial protein) we can conclude that the observed mitochondrial relocation does not reverse unlike the microtubule railways.
Respiratory Activity of Microglia and C6 Cells
Endogenous O2 consumption of the microglia in co-culture (Figure 6A) was monitored to investigate the potential involvement of mitochondria relocation on respiratory properties. This value strongly decreased after 3 h of co-culture to reach its lowest level (50% of the consumption measured at t = 0). Then it recovered to reach 65% of the basal level after 24 h of co-culture. The uncoupled maximal microglia respiration in the presence of CCCP was also affected. The ratio endo/CCCP, which is representative of the O2 consumption yield (Martin et al., 1998; de Gannes et al., 2000), decreased during the first 3 h of co-culture but represented 80% of the normal yield after 24 h of co-culture.
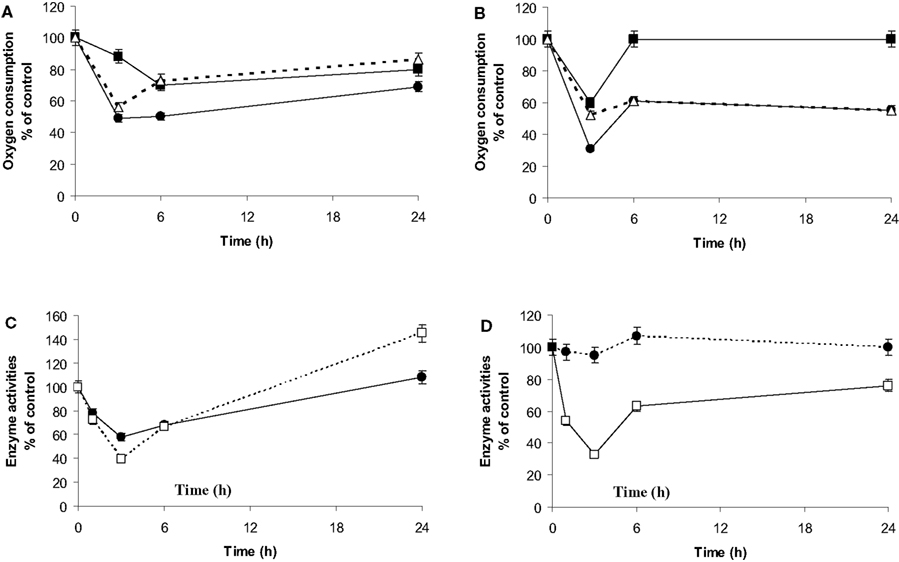
Figure 6. Respiratory properties, dehydrogenase and citrate synthase activities. (A,B): Oxygen consumption by microglia (A) or C6 cells (B) was measured by polarogaphy at different times of co-culture. For each time point, respiration is determined in the absence of any effectors (endogenous oxygen consumption: •, black dots) or after subsequent addition of the uncoupler (CCCP) during the oxygen consumption recording (■, black squares). Δ (white triangles) is representative of the oxygen consumption ratio between the endogenous and that in presence of CCCP. Results are expressed as percentage of the mean value point to the control cells (mean ± SD for three independent experiments) for each time point. Microglial control values are 4 nmol/min/106 cells and 9 nmol/min/106 cells for endogenous and uncoupled oxygen consumption, respectively. C6 cell control values are 3.4 nmol/min/106 cells and 6.4 nmol/min/106 cells for the endogenous and uncoupled oxygen consumption, respectively. (C,D): citrate synthase activity (□, white squares) and MTT oxidation rates (•, black dots) of microglia (C) and C6 cells (D) in co-culture. Activities were determined spectrophotometrically for the different periods of co-culture as described in experimental procedures. Results from three independent experiments (mean ± SD) are expressed as percentage of the control cell specific activity of the citrate synthase (33 nmol/min/106 cells and 12 nmol/min/106 cells for the microglia and the C6 cells, respectively) and for the formazan production as a percent of the optical density measured on isolated culture cells.
C6 respiration was also affected during the first 3 h (Figure 6B). However, the endogenous respiration remained at 50% of the normal level, while the CCCP O2 consumption had recovered at t = 6 h. Consequently, the endo/CCCP yield remained at 50% of the control capacity.
Mitochondrial Dehydrogenase and Citrate Synthase Assays
Changes in mitochondrial enzyme activities were assessed in order to monitor transient respiratory modifications. The transformation of the tetrazolium salt (MTT) in the purple insoluble formazan is partly due to mitochondrial dehydrogenase activities (Liu et al., 1997). MTT reduction and citrate synthase activity in the microglia showed a pattern similar to endogenous respiration (Figure 6C) although they were able to restore their activities at 24 h or even presented a higher activity at the end, which was not observed for the respiration. In C6 cell culture, MTT reduction was not affected by co-culture (Figure 6D). However, citrate synthase followed a similar pattern to that of endogenous respiration, reaching its lowest level after 3 h of co-culture (33% of the control value) with a slight recovery after 24 h of co-culture (60% of the control value).
Evolution of Mitochondrial Content and Potential
The fluorochrome NAO binds with a high affinity to the mitochondrial cardio-lipins (Ratinaud et al., 1988; Lizard et al., 1990). Consequently, the binding of NAO appears independent of respiratory status and reflects the mitochondrial mass (Maftah et al., 1989). Cell staining with NAO confirmed the perinuclear location of the microglial mitochondria in co-culture (data not shown). Furthermore, flow cytometry analysis of the co-cultured microglia showed a unique homogeneous population with a 2.5-fold fluorescence increase as soon as 1 h of co-culture. This high level of fluorescence was maintained during the 24 h-time course of the co-culture (Figure 7A).
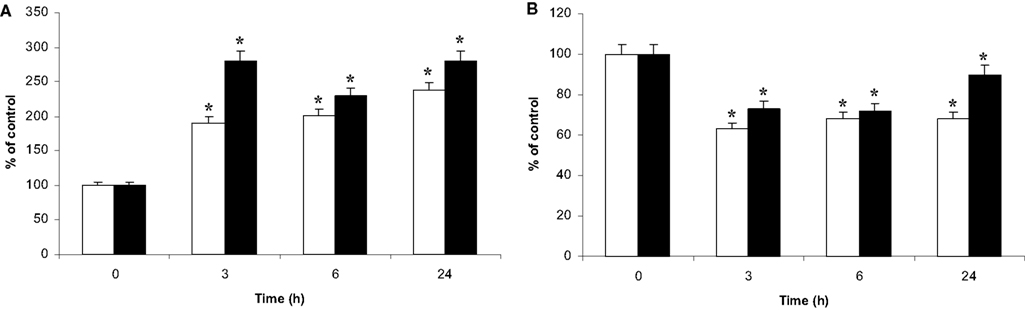
Figure 7. NAO binding and DIOC6 uptake by the microglia and the C6 cells in co-culture. Microglia on beads were co-cultured on C6 cell monolayers in Petri dishes for t = 0 to t = 24-h time points. Then, cell populations were separated, incubated either with NAO (A) or with the potential probe DIOC6 (B). Thereafter, fluorescence was analyzed by flow cytometry as described in experimental procedures. (A): NAO binding in C6 cells (white bars) and microglia (black bars), respectively. (B): DIOC6 accumulation in C6 cells (white bars) and microglia (black bars), respectively. All the results are from three independent experiments (mean ± SD) and are expressed as percentage of the mean fluorescence either of NAO or of DIOC6 uptake compared to the control values measured from isolated cultures. *: value significantly different from the t = 0 time point (p < 0.01).
The same experiment was conducted on C6 cells. NAO binding also showed a homogeneous population with a similar increase in fluorescence after 3 h of co-culture (Figure 7A).
Fluorochrome DIOC6 is a cationic probe whose intracellular accumulation is dependent on the potential gradient between the inner and outer cell compartments (Nicholls and Ward, 2000). Its accumulation does not appear to be specific to the mitochondrial compartment. However, at the used DIOC6 concentration, the fluorescence labeling of the cells demonstrated a major contribution of the mitochondria versus the reticulum, as described by Rottenburg and Wu (1998). After incubation of microglia with DIOC6, fluorescence microscopy revealed fluorescent dots inside the cells, similar to those observed after Hsp60 and NAO labeling (data not shown). When microglia were also analyzed by flow cytometry, the results showed a homogeneous fluorescent microglial population. The fluorescence level decreased as soon as 1 h of co-culture (data not shown), reaching 70% of the control level and evolving toward the control value after 24 h of co-culture (Figure 7B). The DIOC6 accumulation in the C6 cells did not change after 1 h of co-culture (data not shown) but decreased after 3 h of co-culture (60% of the control value) (Figure 7B). The fluorescence level did not change thereafter.
Energetic Metabolism
Unlike C6 cells, microglia recovered their mitochondrial respiratory properties. Therefore, the question rises if energetic metabolism of microglia and C6 cells was altered.
During the first 24 h of co-culture, the microglia and the C6 cell densities did not change significantly, being similar to the densities observed in isolated culture conditions. In addition, the proportions of cell populations were also unchanged: 73% of C6 cells and 27% of microglia.
In isolated culture conditions, the microglia and the C6 cells consumed glucose and released lactate (Figures 8A,B). Initial rates of glucose consumption were similar to those of lactate release for each cell type and under similar conditions (Table 1). C6 cells showed initial rates four times higher than those of the microglia, so glucose in the C6 medium was totally depleted after 24 h of culture. The glucose consumption and lactate release profiles in the co-cultures resembled those of the isolated C6 cultures. These results revealed the large metabolic contribution of the C6 cells (73%) and the fact that the proximity of the microglia had apparently no effect on the C6-cell glucose and lactate metabolisms. Moreover, the contribution of C6 cells to the metabolism of the microglia (27%) was not detectable.
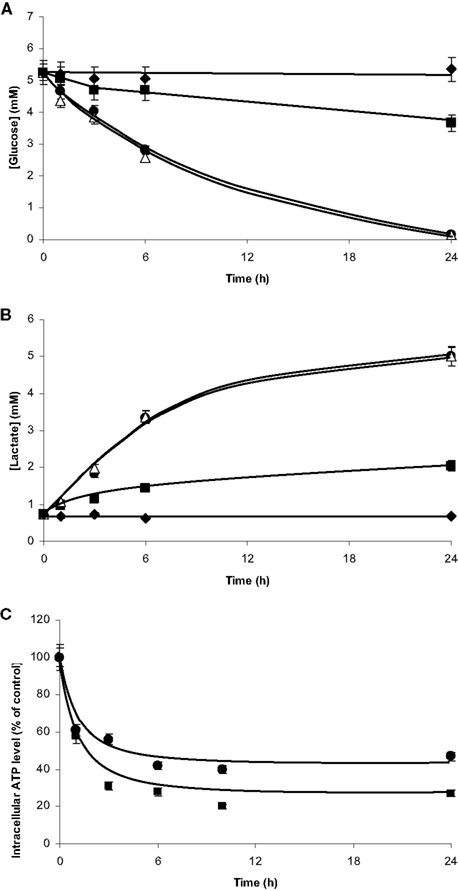
Figure 8. Glucose consumption, lactate production and ATP readjustments in co-culture. Microglia and C6 cells were cultured on beads and as monolayer on Petri dishes, respectively. Cultures were performed either in isolated culture conditions for each cell type or mixed in co-culture. Aliquots of the culture media were collected at different time points from t = 0 to t = 24 h for glucose (A) and lactate (B) quantifications. (A): Glucose concentrations in the medium from isolated microglia(■), isolated C6 cells (•), microglia/C6 cell co-culture (△), and Petri dishes without cell (♦). (B): Lactate concentrations in the medium from isolated microglia (■), isolated C6 cells (•), microglia/C6 cell co-culture (△), and Petri dishes without cell (♦). ATP quantification (C) was performed from perchloric cell extracts by the luciferin–luciferase method. (■) and (•): ATP contents in microglia and C6 cells, respectively, when in co-culture. Results, from three independent experiments (mean ± SD), are expressed as percentage of the ATP content for the time point compared to the control (3 nmol/106 cells and 1.3 nmol/106 cells for the microglia and the C6 cells, respectively).
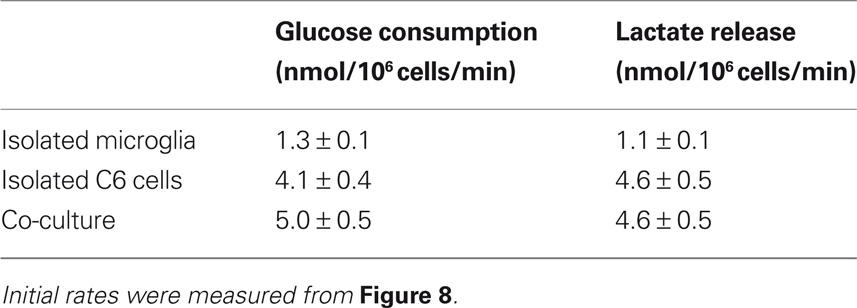
Table 1. Initial rates of glucose consumption and lactate release by microglia and C6 cells.
For both cell types, ATP contents decreased during the first hours of co-culture, reaching a plateau between 6 and 10 h (Figure 8C). Whether we quantified ATP by luminometry (Figure 8C) or by 31 P-NMR spectroscopy (Figure 9, Table 2), the microglial ATP levels appeared more affected than those of C6 cells. Indeed, after 24 h of co-culture, the microglial ATP level was only 30% of the control value, whereas the C6-cell ATP level was 45% of the control value. NMR spectroscopy analyses showed a 60% decrease in the ATP/ADP ratio after 3 h of co-culture, which possibly reflects a new steady state when both cells are cultured together.
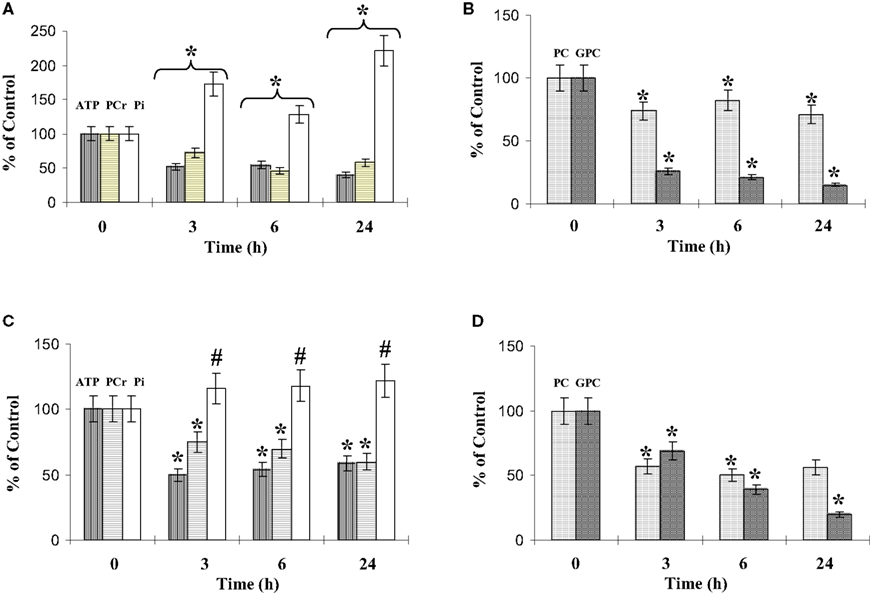
Figure 9. Phosphorylated metabolites in co-culture. The phosphorylated metabolite contents were quantified using 31P-NMR spectroscopy analysis of cell extracts performed at different time points of co-culture, as described in experimental procedures. ATP, PCr and Pi contents (A,C), and PC (phosporylcholine) and GPC (glycerophosporylcholine) contents (B,D), concern the microglia (A,B) and the C6 cells (C,D). Results, from three different experiments, are expressed as percentage of metabolite contents from cells grown in isolated conditions. *: significantly different from the control (p < 0.01); #: no statistical difference from value at t = 0. The mean values of the phosphorylated metabolites from the microglia and the C6 cells grown in isolated conditions are summarized Table 2.
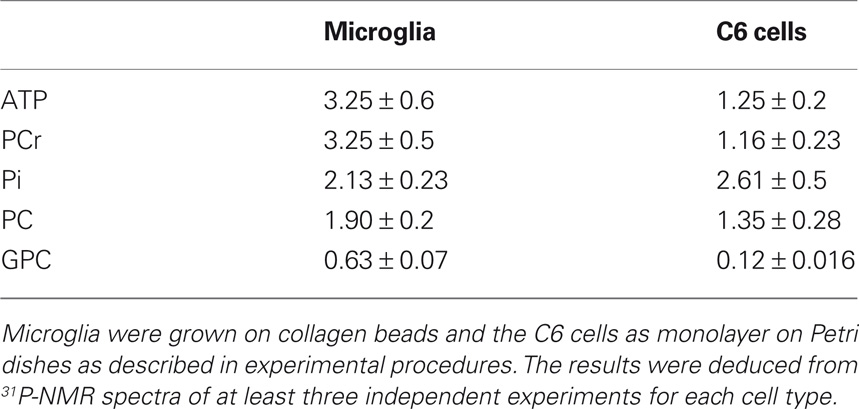
Table 2. Representative phosphorylated metabolite contents (nmol/106 cells) of microglia and of C6 cells in isolated culture conditions.
Analysis of the other resonances (Figure 9) clearly identified variations in phosphocreatine (PCr), inorganic phosphate (Pi), phosphorylcholine (PC), and glycerophosphorylcholine (GPC). The glycerophosphorylethanolamine (GPE) content was low in both cell types and the variations observed during the co-cultures were not significant (data not shown). The microglial and C6-cell PCr levels decreased in a similar proportion during the first 24 h of co-culture. In parallel, the Pi levels increased, with a higher increase for microglia in co-culture. Both PC and GPC levels decreased (Figures 9B,D). After 3 h and during the 24 h of co-culture, PC levels represented 75% and 50% of the control values for microglia and C6 cells, respectively. However, at 24 h, the ratio PC/GPC, which reflects membrane turnover, had increased (3.7 and 1.8 times for microglia and C6 cells, respectively).
Discussion
The aim of this work was to describe the phenotypic sensitivity and the metabolic behavior of microglia in the closed environment of C6 glioma cells and their potential correlation. These populations were investigated either in isolated culture conditions or in co-cultures. Cultures were performed with a human microglia cell line grown on 3D collagen beads (or on coverslips for the immunocytochemistry) laid on monolayer C6 cell cultures in Petri dishes. The behavior of the microglia in a co-culture context asks the question of the possible impact of both the species and the cellular specificities on the observed phenotypes. Keeping in mind the human and murine origins of microglia and the C6 cells lines used in this work, respectively, the macrophagic properties of the microglia could be expected to be exacerbated. Nevertheless, in experiments conducted in our team on murine macroglia cell line (BV2) the phenotype changes exhibited by BV2 cells when in the C6 cell vicinity were similar to those found with the human CHME5 cell line (unpublished data). However, the silenced long term macrophagic immune properties of the microglia in the C6 glioma environment could be the consequence of either the transformed character of this lineage or of normal cell–cell vicinity without any microglia–C6 glioma interaction specificity. The microglial properties of this human lineage have been previously demonstrated (Peudenier et al., 1991a,b) and the immortalized status does not represent a criteria to explain the transitory activation and then its silenced status. Moreover, the microglia in enriched astrocytic or neuronal primary cultures displayed a sustained macrophagic status of activated cells (Voisin et al., 1996).
So, the behavior of the human microglia in this model of glioma co-cultures does not appear driven by the specie differences and is different from microglia properties in the vicinity of nervous cells in vitro.
Microglial Phenotype in a Glioma Environment
In the C6 environment, the microglia changed their morphology. Their constant high ability to hydrolyze calcein-AM, to retain calcein and to present a low uptake of propidium iodide suggests that the viability of these two cell types was not affected. Microglia did not develop apoptotic processes, unlike the case when macrophages are overstimulated and involved in inflammatory reactions (Smith et al., 1998). Furthermore, the activated microglia did not induce the death of C6 cells. When co-cultures were kept for several days in vitro, the microglia colonized the C6 area without developing macrophagic behavior (data not shown).
This cellular co-existence raises the question whether short transient changes occur in the microglia phenotype when they grow in a tumoral environment and if correlations with energy metabolism can be made.
During co-culture, the cell numbers of each population did not change significantly. This lack of increase is in agreement with the average 35-h half-life of these cell types in isolated culture conditions (data not shown). Moreover, the protein content of both cell types was not modified.
During the short-term of co-cultures, an increasing part of the microglia population is connected to a positive ED1 labeling and a higher ability of phagocytosis. After 3 h of co-culture, cells appeared engaged in a macrophagic state. Nevertheless, this activated microglia state seems to be more subtle since the uptake properties were silenced after 24 h of co-culture even if the ED1 expression was still maintained. This suggests another activated state, intermediate, but not macrophagic. Microglia reached this state after 3 h of co-culture. In the same way, the location of F-actin at the level of the cytoplasmic membrane, as well as the external roughness resembling leaves and buds, reflected also an activated microglial status (Bauer et al., 1994; Damoiseaux et al., 1994; Taupenot et al., 1996). These changes in F-actin distribution are consistent with F-actin fragmentation in activated macrophages (Badaut et al., 2008). Such fragmentation was shown to alter phagosome movements toward the juxtanuclear region. However, it was not caused only by phagocytic uptake and/or the presence of phagosomes. Similarly, in the C6 cell vicinity, the microglia F-actin distribution that we observed did not seem clearly related to the properties of the phagocytes.
Microglia are also known to be sensitive to stress and to give a characteristic response by the over-expression of the constitutive Hsc70 proteins, and the induction of Hsp70 forms located first in the cytoplasm and then in the nucleus (Voisin et al., 1996; de Gannes et al., 2000).
During the 24 h of co-culture and for longer times, neither the expression level of the Hsc70 proteins nor their locations were significantly modified (Figure 5), indicating that the C6 cell environment did not seem to generate any microglial stress, as assessed by unchanged expression of hsp70 protein family. Indeed, the inducible Hsp70 proteins were undetectable. In neurological inflammatory settings, Hsp70 induction of monocytes/macrophages could be involved in the immune response to pathogens and contribute to the processing and presentation of antigens (DeNagel and Pierce, 1992; Bachelet et al., 1998). Moreover, monocytes/macrophages enhance their antioxidant defenses by generating Hsp70, which interferes with the release of cytochrome c from the mitochondria (Kagaya et al., 2006) and thereby prevents them from undergoing apoptosis subsequent to oxidative stress. In addition, the lack of C6-induced oxidative stress could be related to the relocation of F-actin, a process that could prevent the induction of iNO-synthase if linked to the fragmentation of the stress fibers (Fernandes et al., 1996; Higuchi et al., 1996). Consequently, the iNO-synthase activity could be inhibited in activated macrophages. Such a property helps to avoid the triggering of apoptosis. This situation can be linked to the high esterase activities and the lack of propidium iodide permeability that we observed, suggesting that the microglia did not enter the apoptotic pathway despite the ATP readjustment. On the other hand, Hsc70 accumulation in the external membrane excrescences suggests a contribution of the constitutive heat shock protein in the regulation of endocytosis, since Hsc70 is involved in the inhibition of the assembly of clathrin-coated vesicles (in both the clathrin-dependent and clathrin-independent endocytosis pathway) (Chappell et al., 1986). This external Hsc70 location appeared concomitantly to the loss of bead uptake and to the fragmentation of F-actin.
During the short-term co-cultures, the vimentin and tubulin networks were altered, although these changes were very transitory. In the microglia, the mitochondria were previously described as organites which co-localized with either vimentin or tubulin (de Gannes et al., 2000). In our study, simultaneously with the cytoskeleton readjustments, the mitochondria clustered in a perinuclear location. However, this situation remained even though the vimentin and tubulin networks recovered their normal immunological aspect.
These short-term modifications demonstrate the sensitivity of microglia to a foreign cell environment. However, the microglia remained activated but with silenced macrophage properties. In the C6 glioma environment, the bead uptake and the intermediate filament network alteration were quick and transitory. The lack of Hsp70 expression, the Hsc70 and the F-actin locations, like the absence of any change in the microglia viability, could be closely associated with the down-regulated immunophenotype environment generated by the glioma cells, suggesting a symbiosis between tumor cells and macrophages (Badie and Schartner, 2001). Since most of the microglia on collagen beads did not have any direct contact with the C6 monolayer during the co-culture time course, the observed phenotypic adaptation was probably more dependent on the release of diffusible molecules which could be cytokines or growth factors that are now well-known in immunosuppressive tumor biology (Giulian et al., 1994a,bHussain and Heimberger, 2005).
Nevertheless, the location of the mitochondria, which were still perinuclear after 24 h of co-culture, raises the question of a putative microglial metabolic readjustment in a foreign cellular environment.
Selective Microglial and C6 Cell Metabolism Readjustments
The microglial endogenous and uncoupled O2 consumptions between 1 and 3 h were affected. The ratio of these rates showed a decrease in the respiration yield associated with a decrease in dehydrogenase and citrate synthase activities. However, cell viability, as reflected by the esterase activity and the lack of PI permeability, was not affected. Since citrate synthase is often considered as an indicator of mitochondrial content (Walenta et al., 1989; Bredel-Geissler et al., 1992), the decrease in respiration could be due to a loss of mitochondrial content, although its expression and its activity are also subject to cell regulation (Martin et al., 1998). Nevertheless, experiments performed with NAO demonstrated the absence of mitochondrial loss. More surprising was the increase in NAO fluorescence after 3 h of co-culture. This anomaly was of too short a duration to suggest an increase in the mitochondrial population. The rise in the mean fluorescence level thus suggests the exposure of new cardio-lipin binding sites linked to an extension of the inner mitochondrial membrane surface or to the swelling of these organites. These changes in the mitochondrial aspects were concomitant with the clustering of these organites, which were visible after Hsp60 immunolabeling.
The decrease in mitochondrial potential through the alteration of the DIOC6 fluorescence could be due to the decrease in O2 consumption during the 1–3 h of co-culture. This observation shows the inability of the respiratory chain to maintain the proton gradient between the external and the internal faces of the inner membrane. This could be the consequence of the decrease in electron donors at the different entries of the respiratory chain, which could be due to the loss of dehydrogenase activities and/or the loss of membrane integrity leading to proton leakage. This latter possibility, which can be evidenced by the decrease in O2 consumption in the presence of the ATPsynthase inhibitor oligomycin, was not significant enough to validate this hypothesis (data not shown). However, through DIOC6 observations, the recovery of the membrane potential, like the citrate synthase and dehydrogenase activities, also appeared to prevent apoptosis despite ATP depletion (Richter et al., 1996). This is different from the apoptosis pathway which occurs after LPS induction of microglia in which NO-synthase is activated. The increase in NO generates membrane damages, a loss of glutathione and a decrease in the activity of the mitochondrial electron transport associated with a depletion of the cellular ATP content (Moss and Bates, 2001).
C6 cells are known to have high metabolic plasticity. Their oxidative phosphorylation capacities are dependent on their age. During the growth phase, C6 respiration decreases and its metabolism evolves toward a glycolytic status (Martin et al., 1998). To minimize the contribution of the glioma cell growth state, experiments were always conducted with C6 cells at three days in vitro. At this stage, the endogenous and the uncoupled O2 consumption represented 30% and 90%, respectively, of the maximal corresponding O2 consumption observed when C6 cells were in the lag phase (15 natom/min/106 cells) (Pasdois et al., 2003). Moreover, all the results during the 24 h of co-culture were compared with isolated C6 cultures of the same age in vitro.
C6 respiration was also affected during the first co-culture step, although the mitochondrial content was not affected. Nevertheless, contrary to what was observed with microglia, the specific activities of the dehydrogenases were not modified. Moreover, the mitochondrial potential did not recover after the first 24 h of co-culture like the endogenous respiration, suggesting a defect in supplying reduced substrates at the points of entry to the electron transport chain, a phenomenon possibly due to the loss of citrate synthase activity.
The C6 cells used up glucose from the medium during the first 24 h of isolated culture, as described by other authors (Passonneau et al., 1978; Pianet et al., 1991; Bouzier et al., 1998a,b). Astrocytes in vitro were shown to take up glucose from the medium at a similar rate, converting it mainly into lactate (Pellerin and Magistretti, 1994). Microglia also consumed glucose but the rate was four times lower. In isolated C6 and microglia cultures, as in co-culture, the lactate release rates appeared similar to the glucose disappearance rates. However, we should keep in mind that one molecule of glucose gives rise to two molecules of lactate. Therefore, these results suggest that, whatever the culture type, microglia and C6 cells metabolize glucose not only through glycolysis pathway but also through other pathways needed for their energetic requirements. Previous studies (Bouzier et al., 1998a,b) demonstrated that lactate consumption is also performed by these cells after conversion into pyruvate, which is located at an important metabolic node. Indeed, C6 cells without glucose are able to maintain their energetic status by using pyruvate and glutamine as carbon donor (Pianet et al., 1991; Portais et al., 1996).
In co-cultures, glucose utilization and lactate release rates were not significantly different from those of the C6 cells in isolated culture conditions. Since 76% of the cells in co-culture were C6 cells, we cannot rule out a possible alteration of microglial metabolism, a phenomenon which could be hidden by the high C6 cell metabolism. Nevertheless, the microglial environment did not induce any significant readjustments of the C6 cell glycolytic pathway.
Regarding ATP measurements, results obtained with the luciferase method were consistent with 31P-NMR evaluation of phosphorylated metabolites. The ATP content of the C6 cells and microglia did not change significantly during the 24 h of isolated cultures. The evolution of ATP in the C6 cells is in agreement with the results of Pianet et al. (1991) despite the glucose depletion in the medium. In co-culture, the two cell types showed large ATP and ATP/ADP decreases that were still present after 24 h, suggesting an energetic readjustment to a lower ATP steady state. The changes in this metabolite content can be associated with the changes in respiratory properties, which drastically decreased during the first hours of co-culture in both cell types, and their stagnancy in the C6 cells. However, the maintenance of a decreased ATP level in the microglia did not appear to be dependent only on the endogenous and uncoupled respiration since they recovered. The possible energetic needs of the phagocytic processes remains an open question, since after 24 h of co-culture the different profiles of the fluorescent bead uptake were lower than the control culture ones. Furthermore, for both cell types, the PCr content decreased and the inorganic phosphate content increased during the first 24 h. These observations strongly suggest the establishment of a new metabolic steady state of these cells when in close vicinity with each other. In the case of the microglia, this metabolic behavior was not related to a stress situation. Indeed, in isolated conditions, microglia display a high PCr content compared to monocytes (de Gannes et al., 1998) in which the ATP and the PCr contents, like the respiratory properties, decrease after heat stress but recover after 24 h to a normal energetic status.
Like PC and phosphatidylethanolamine, phosphomonoesters (PME) are substrates of the first steps of phospholipid synthesis, which, with cholesterol, contribute to membrane synthesis. Phosphodiesters (PDE) like GPC and GPE are catabolic products of phospholipids. Increases in PME and in the PME/PDE ratio are indicators of a change in phospholipid turnover, the anabolism being faster than the catabolism. In numerous brain tumors, the PME and the PDE contents change depending on the tumoral type and grade (Heindel et al., 1988; Rutter et al., 1995; Lehnhardt et al., 2001; Tugnoli et al., 2001; Maintz et al., 2002). In meningiomas and glioblastomas, elevated PME and reduced PDE contents are also observed. This increase in the PME/PDE ratio has already been described in dividing cells in the neonatal brain (Younkin et al., 1984) and in the neoblastoma cell line (Pettegrew et al., 1987). Moreover, the PC increase seems linked to the early response of tumor cells to growth factors (Ruiz-Cabello and Cohen, 1992). Furthermore, the phospholipid and cholesterol metabolisms appear important since they contribute to resistance to necrosis (Bacurau et al., 1999).
In co-culture, both cell types decreased their PC and GPC contents and showed adaptive behavior at the level of the cellular membranes after 3 h of culture. This is reminiscent of the modification of NAO binding at the level of mitochondrial membranes. However, the GPC content decreased more than the PC one in both cell types and the resulting PC/GPC strongly increased, suggesting that the phospholipid anabolism status was maintained. This phenomenon seemed more pronounced in the microglia than in the C6 cells. These phospholipid changes reveal another form of metabolic adaptation which cannot be assimilated to a stress situation in which PC and GPC are known to increase (de Gannes et al., 1998).
In summary, this work provides new evidence that tumor cells exert a control on the microglial environment and induce metabolic consequences. The parameters monitored describe an original state of the microglia sharing some of the common features of activated macrophages, whereas other properties such as phagocytosis are silenced. Moreover, simultaneously metabolic and respiratory changes are observed displaying an incomplete recovery of the respiration and a potential new energetic steady state.
The relations between these transitory properties of phagocytosis, the phenotypic, and metabolic alterations that occur in parallel need to be better understood and correlated to the release of diffusible molecules like cytokines and growth factors. This would throw fresh light on the inflammatory status of microglial cells when in the vicinity of tumoral cells. The induction and control of this status could help to limit the immunity escape generated by tumor cells and could restore microglial properties to generate a pro-inflammatory environment in glioma. It could also be interesting to modify microglia metabolic steady state by drugs to see potential links and changes in immune properties.
Conflict of Interest Statement
The authors declare that the research was conducted in the absence of any commercial or financial relationships that could be construed as a potential conflict of interest.
Acknowledgments
The authors wish to thank the Association de Recherche contre le Cancer (ARC, grant n°5590) and La Ligue contre le cancer (Ligue, grant 2008) for their financial supports.
References
Asai, J., Suzuki, R., Fujimoto, T., Suzuki, T., Nakagawa, N., Nagashima, G., Miyo, T., Hokaku, H., and Takei, A. (1999). Fluorescence automatic cell sorter and immunohistochemical investigation of CD68-positive cells in meningioma. Clin. Neurol. Neurosurg. 101, 229–234.
Bachelet, M., Adrie, C., and Polla, B. S. (1998). Macrophages and heat shock proteins. Res. Immunol. 149, 727–732.
Bacurau, R. F., Homem De Bittencourt, P. I. Jr., Newsholme, P., and Costa Rosa, L. F. (1999). Metabolic response of macrophages to injury promoted by the activated complement system. Cell Biochem. Funct. 17, 175–182.
Badaut, J., Brunet, J. F., Petit, J. M., Guerin, C. F., Magistretti, P. J., and Regli, L. (2008). Induction of brain aquaporin 9 (AQP9) in catecholaminergic neurons in diabetic rats. Brain Res. 1188, 17–24.
Badie, B., and Schartner, J. (2001). Role of microglia in glioma biology. Microsc. Res. Tech. 54, 106–113.
Badie, B., Schartner, J. M., Paul, J., Bartley, B. A., Vorpahl, J., and Preston, J. K. (2000). Dexamethasone-induced abolition of the inflammatory response in an experimental glioma model: a flow cytometry study. J. Neurosurg. 93, 634–639.
Bauer, J., Sminia, T., Wouterlood, F. G., and Dijkstra, C. D. (1994). Phagocytic activity of macrophages and microglial cells during the course of acute and chronic relapsing experimental autoimmune encephalomyelitis. J. Neurosci. Res. 38, 365–375.
Beyer, M., Gimsa, U., Eyupoglu, I. Y., Hailer, N. P., and Nitsch, R. (2000). Phagocytosis of neuronal or glial debris by microglial cells: upregulation of MHC class II expression and multinuclear giant cell formation in vitro. Glia 31, 262–266.
Bouzier, A. K., Goodwin, R., de Gannes, F. M., Valeins, H., Voisin, P., Canioni, P., and Merle, M. (1998a). Compartmentation of lactate and glucose metabolism in C6 glioma cells. A 13c and 1H NMR study. J. Biol. Chem. 273, 27162–27169.
Bouzier, A. K., Voisin, P., Goodwin, R., Canioni, P., and Merle, M. (1998b). Glucose and lactate metabolism in C6 glioma cells: evidence for the preferential utilization of lactate for cell oxidative metabolism. Dev. Neurosci. 20, 331–338.
Bredel-Geissler, A., Karbach, U., Walenta, S., Vollrath, L., and Mueller-Klieser, W. (1992). Proliferation-associated oxygen consumption and morphology of tumor cells in monolayer and spheroid culture. J. Cell. Physiol. 153, 44–52.
Brockhaus, J., Moller, T., and Kettenmann, H. (1996). Phagocytozing ameboid microglial cells studied in a mouse corpus callosum slice preparation. Glia 16, 81–90.
Chan, A., Magnus, T., and Gold, R. (2001). Phagocytosis of apoptotic inflammatory cells by microglia and modulation by different cytokines: mechanism for removal of apoptotic cells in the inflamed nervous system. Glia 33, 87–95.
Chappell, T. G., Welch, W. J., Schlossman, D. M., Palter, K. B., Schlesinger, M. J., and Rothman, J. E. (1986). Uncoating ATPase is a member of the 70 kilodalton family of stress proteins. Cell 45, 3–13.
Cramer, T., Yamanishi, Y., Clausen, B. E., Forster, I., Pawlinski, R., Mackman, N., Haase, V. H., Jaenisch, R., Corr, M., Nizet, V., Firestein, G. S., Gerber, H. P., Ferrara, N., and Johnson, R. S. (2003). HIF-1alpha is essential for myeloid cell-mediated inflammation. Cell 112, 645–657.
Damoiseaux, J. G., Dopp, E. A., Calame, W., Chao, D., MacPherson, G. G., and Dijkstra, C. D. (1994). Rat macrophage lysosomal membrane antigen recognized by monoclonal antibody ED1. Immunology 83, 140–147.
de Gannes, F. M., Leducq, N., Diolez, P., Belloc, F., Merle, M., Canioni, P., and Voisin, P. J. (2000). Mitochondrial impairment and recovery after heat shock treatment in a human microglial cell line. Neurochem. Int. 36, 233–241.
de Gannes, F. M., Merle, M., Canioni, P., and Voisin, P. J. (1998). Metabolic and cellular characterization of immortalized human microglial cells under heat stress. Neurochem. Int. 33, 61–73.
DeNagel, D. C., and Pierce, S. K. (1992). A case for chaperones in antigen processing. Immunol. Today 13, 86–89.
Fernandes, P. D., Araujo, H. M., Riveros-Moreno, V., and Assreuy, J. (1996). Depolymerization of macrophage microfilaments prevents induction and inhibits activity of nitric oxide synthase. Eur. J. Cell Biol. 71, 356–362.
Flaris, N. A., Densmore, T. L., Molleston, M. C., and Hickey, W. F. (1993). Characterization of microglia and macrophages in the central nervous system of rats: definition of the differential expression of molecules using standard and novel monoclonal antibodies in normal CNS and in four models of parenchymal reaction. Glia 7, 34–40.
Flugel, A., Labeur, M. S., Grasbon-Frodl, E. M., Kreutzberg, G. W., and Graeber, M. B. (1999). Microglia only weakly present glioma antigen to cytotoxic T cells. Int. J. Dev. Neurosci. 17, 547–556.
Fries, G., Perneczky, A., and Kempski, O. (1996). Glioblastoma-associated circulating monocytes and the release of epidermal growth factor. J. Neurosurg. 85, 642–647.
Giulian, D., Li, J., Leara, B., and Keenen, C. (1994a). Phagocytic microglia release cytokines and cytotoxins that regulate the survival of astrocytes and neurons in culture. Neurochem. Int. 25, 227–233.
Giulian, D., Li, J., Li, X., George, J., and Rutecki, P. A. (1994b). The impact of microglia-derived cytokines upon gliosis in the CNS. Dev. Neurosci. 16, 128–136.
Gonzalez-Rey, E., and Delgado, M. (2005). Role of vasoactive intestinal peptide in inflammation and autoimmunity. Curr. Opin. Investig. Drugs 6, 1116–1123.
Graeber, M. B., Scheithaver, B. W., and Kreutzberg, G. W. (2002). Microglia in brain tumors. Glia 40, 252–259.
Heindel, W., Bunke, J., Glathe, S., Steinbrich, W., and Mollevanger, L. (1988). Combined 1H-MR imaging and localized 31P-spectroscopy of intracranial tumors in 43 patients. J. Comput. Assist. Tomogr. 12, 907–916.
Higuchi, Y., Hattori, H., Hattori, R., and Furusho, K. (1996). Increased neurons containing neuronal nitric oxide synthase in the brain of a hypoxic-ischemic neonatal rat model. Brain Dev. 18, 369–375.
Hussain, S. F., and Heimberger, A. B. (2005). Immunotherapy for human glioma: innovative approaches and recent results. Expert Rev. Anticancer Ther. 5, 777–790.
Kagaya, T., Nakamoto, Y., Sakai, Y., Tsuchiyama, T., Yagita, H., Mukaida, N., and Kaneko, S. (2006). Monocyte chemoattractant protein-1 gene delivery enhances antitumor effects of herpes simplex virus thymidine kinase/ganciclovir system in a model of colon cancer. Cancer Gene Ther. 13, 357–366.
Kettenmann, H., Hoppe, D., Gottmann, K., Banati, R., and Kreutzberg, G. (1990). Cultured microglial cells have a distinct pattern of membrane channels different from peritoneal macrophages. J. Neurosci. Res. 26, 278–287.
Lacy-Hulbert, A., and Moore, K. J. (2006). Designer macrophages: oxidative metabolism fuels inflammation repair. Cell Metab. 4, 7–8.
Lehnhardt, F. G., Rohn, G., Ernestus, R. I., Grune, M., and Hoehn, M. (2001). 1H- and (31)P-MR spectroscopy of primary and recurrent human brain tumors in vitro: malignancy-characteristic profiles of water soluble and lipophilic spectral components. NMR Biomed. 14, 307–317.
Lemasters, J. J., and Hackenbrock, C. R. (1979). Continuous measurement of adenosine triphosphate with firefly luciferase luminescence. Methods Enzymol. 56, 530–544.
Liu, Y., Peterson, D. A., Kimura, H., and Schubert, D. (1997). Mechanism of cellular 3-(4,5-dimethylthiazol-2-yl)-2,5-diphenyltetrazolium bromide (MTT) reduction. J. Neurochem. 69, 581–593.
Lizard, G., Chardonnet, Y., Chignol, M. C., and Thivolet, J. (1990). Evaluation of mitochondrial content and activity with nonyl-acridine orange and rhodamine 123: flow cytometric analysis and comparison with quantitative morphometry. Comparative analysis by flow cytometry and quantitative morphometry of mitochondrial content and activity. Cytotechnology 3, 179–188.
Maftah, A., Petit, J. M., Ratinaud, M. H., and Julien, R. (1989). 10-N nonyl-acridine orange: a fluorescent probe which stains mitochondria independently of their energetic state. Biochem. Biophys. Res. Commun. 164, 185–190.
Maintz, D., Heindel, W., Kugel, H., Jaeger, R., and Lackner, K. J. (2002). Phosphorus-31 MR spectroscopy of normal adult human brain and brain tumours. NMR Biomed. 15, 18–27.
Martin, M., Beauvoit, B., Voisin, P. J., Canioni, P., Guerin, B., and Rigoulet, M. (1998). Energetic and morphological plasticity of C6 glioma cells grown on 3-D support; effect of transient glutamine deprivation. J. Bioenerg. Biomembr. 30, 565–578.
Merle, M., Pianet, I., Canioni, P., and Labouesse, J. (1992). Comparative 31P and 1H NMR studies on rat astrocytes and C6 glioma cells in culture. Biochimie 74, 919–930.
Morantz, R. A., Wood, G. W., Foster, M., Clark, M., and Gollahon, K. (1979). Macrophages in experimental and human brain tumors. Part 2: studies of the macrophage content of human brain tumors. J. Neurosurg. 50, 305–311.
Moss, D. W., and Bates, T. E. (2001). Activation of murine microglial cell lines by lipopolysaccharide and interferon-gamma causes NO-mediated decreases in mitochondrial and cellular function. Eur. J. Neurosci. 13, 529–538.
Nicholls, D. G., and Ward, M. W. (2000). Mitochondrial membrane potential and neuronal glutamate excitotoxicity: mortality and millivolts. Trends Neurosci. 23, 166–174.
O’Keefe, G. M., Nguyen, V. T., and Benveniste, E. N. (1999). Class II transactivator and class II MHC gene expression in microglia: modulation by the cytokines TGF-beta, IL-4, IL-13 and IL-10. Eur. J. Immunol. 29, 1275–1285.
Pasdois, P., Deveaud, C., Voisin, P., Bouchaud, V., Rigoulet, M., and Beauvoit, B. (2003). Contribution of the phosphorylable complex I in the growth phase-dependent respiration of C6 glioma cells in vitro. J. Bioenerg. Biomembr. 35, 439–450.
Passonneau, J. V., Schwartz, J. P., and Lust, W. D. (1978). “Some aspects of intermediary metabolism in glioma cells in culture,” in Dynamic Properties of Glia Cells, eds E. Schoffeniels, G. Franck, L. Hertz and D.B. Tower (Oxford: Pergamon Press), 133–142.
Paulus, W., Roggendorf, W., and Kirchner, T. (1992). Ki-M1P as a marker for microglia and brain macrophages in routinely processed human tissues. Acta Neuropathol. (Berl.) 84, 538–544.
Pellerin, L., and Magistretti, P. J. (1994). Glutamate uptake into astrocytes stimulates aerobic glycolysis: a mechanism coupling neuronal activity to glucose utilization. Proc. Natl. Acad. Sci. U.S.A. 91, 10625–10629.
Pettegrew, J. W., Kopp, S. J., Minshew, N. J., Glonek, T., Feliksik, J. M., Tow, J. P., and Cohen, M. M. (1987). 31P nuclear magnetic resonance studies of phosphoglyceride metabolism in developing and degenerating brain: preliminary observations. J. Neuropathol. Exp. Neurol. 46, 419–430.
Peudenier, S., Hery, C., Montagnier, L., and Tardieu, M. (1991a). Human microglial cells: characterization in cerebral tissue and in primary culture, and study of their susceptibility to HIV-1 infection. Ann. Neurol. 29, 152–161.
Peudenier, S., Hery, C., Ng, K. H., and Tardieu, M. (1991b). HIV receptors within the brain: a study of CD4 and MHC-II on human neurons, astrocytes and microglial cells. Res. Virol. 142, 145–149.
Pianet, I., Merle, M., Labouesse, J., and Canioni, P. (1991). Phosphorus-31 nuclear magnetic resonance of C6 glioma cells and rat astrocytes. Evidence for a modification of the longitudinal relaxation time of ATP and Pi during glucose starvation. Eur. J. Biochem. 195, 87–95.
Platten, M., Wick, W., and Weller, M. (2001). Malignant glioma biology: role for TGF-beta in growth, motility, angiogenesis, and immune escape. Microsc. Res. Tech. 52, 401–410.
Portais, J. C., Voisin, P., Merle, M., and Canioni, P. (1996). Glucose and glutamine metabolism in C6 glioma cells studied by carbon 13 NMR. Biochimie 78, 155–164.
Prat, E., Baron, P., Meda, L., Scarpini, E., Galimberti, D., Ardolino, G., Catania, A., and Scarlato, G. (2000). The human astrocytoma cell line U373MG produces monocyte chemotactic protein (MCP)-1 upon stimulation with beta-amyloid protein. Neurosci. Lett. 283, 177–180.
Ratinaud, M. H., Leprat, P., and Julien, R. (1988). In situ flow cytometric analysis of nonyl acridine orange-stained mitochondria from splenocytes. Cytometry 9, 206–212.
Restifo, N. P. (2000). Not so Fas: re-evaluating the mechanisms of immune privilege and tumor escape. Nat. Med. 6, 493–495.
Richter, C., Schweizer, M., Cossarizza, A., and Franceschi, C. (1996). Control of apoptosis by the cellular ATP level. FEBS Lett. 378, 107–110.
Rottenberg, H., and Wu, S. (1998). Quantitative assay by flow cytometry of the mitochondrial membrane potential in intact cells. Biochim. Biophys. Acta 1404, 393–404.
Ruiz-Cabello, J., and Cohen, J. S. (1992). Phospholipid metabolites as indicators of cancer cell function. NMR Biomed. 5, 226–233.
Rutter, A., Hugenholtz, H., Saunders, J. K., and Smith, I. C. (1995). One-dimensional phosphorus-31 chemical shift imaging of human brain tumors. Invest. Radiol. 30, 359–366.
Schartner, J. M., Hagar, A. R., Van Handel, M., Zhang, L., Nadkarni, N., and Badie, B. (2005). Impaired capacity for upregulation of MHC class II in tumor-associated microglia. Glia 51, 279–285.
Seguin, F., and Le Pape, A. (1994). 31P and 13C nuclear magnetic resonance studies of macrophages. Immunomethods 4, 179–187.
Shambaugh, G. E. III, Koehler, R. A., and Freinkel, N. (1977). Fetal fuels II: contributions of selected carbon fuels to oxidative metabolism in rat conceptus. Am. J. Physiol. 233, E457–E461.
Smith, M. E., van der Maesen, K., Somera, F. P., and Sobel, R. A. (1998). Effects of phorbol myristate acetate (PMA) on functions of macrophages and microglia in vitro. Neurochem. Res. 23, 427–434.
Streit, W. J. (2005). “Microglia cells,” in Neuroglia, 2nd Edn, eds H. Kettenmann, and B. Ransom (New York: Oxford University), 60–71.
Takiguchi, M., Ting, J. P., Buessow, S. C., Boyer, C., Gillespie, Y., and Frelinger, J. A. (1985). Response of glioma cells to interferon-gamma: increase in class II RNA, protein and mixed lymphocyte reaction-stimulating ability. Eur. J. Immunol. 15, 809–814.
Taupenot, L., Ciesielski-Treska, J., Ulrich, G., Chasserot-Golaz, S., Aunis, D., and Bader, M. F. (1996). Chromogranin A triggers a phenotypic transformation and the generation of nitric oxide in brain microglial cells. Neuroscience 72, 377–389.
Tugnoli, V., Tosi, M. R., Tinti, A., Trinchero, A., Bottura, G., and Fini, G. (2001). Characterization of lipids from human brain tissues by multinuclear magnetic resonance spectroscopy. Biopolymers 62, 297–306.
Tweardy, D. J., Mott, P. L., and Glazer, E. W. (1990). Monokine modulation of human astroglial cell production of granulocyte colony-stimulating factor and granulocyte-macrophage colony-stimulating factor. I. Effects of IL-1 alpha and IL-beta. J. Immunol. 144, 2233–2241.
Van Meir, E., Sawamura, Y., Diserens, A. C., Hamou, M. F., and de Tribolet, N. (1990). Human glioblastoma cells release interleukin 6 in vivo and in vitro. Cancer Res. 50, 6683–6688.
Vats, D., Mukundan, L., Odegaard, J. I., Zhang, L., Smith, K. L., Morel, C. R., Wagner, R. A., Greaves, D. R., Murray, P. J., and Chawla, A. (2006). Oxidative metabolism and PGC-1beta attenuate macrophage-mediated inflammation. Cell Metab. 4, 13–24.
Voisin, P. J., Pardue, S., Macouillard, F., Yehia, G., Labouesse, J., and Morrison-Bogorad, M. (1996). Differential expression of heat shock 70 proteins in primary cultures from rat cerebellum. Brain Res. 739, 215–234.
Wagner, K. R., Xi, G., Hua, Y., Kleinholz, M., de Courten-Myers, G. M., and Myers, R. E. (1998). Early metabolic alterations in edematous perihematomal brain regions following experimental intracerebral hemorrhage. J. Neurosurg. 88, 1058–1065.
Walenta, S., Bredel, A., Karbach, U., Kunz, L., Vollrath, L., and Mueller-Klieser, W. (1989). Interrelationship among morphology, metabolism, and proliferation of tumor cells in monolayer and spheroid culture. Adv. Exp. Med. Biol. 248, 847–853.
Watters, J. J., Schartner, J. M., and Badie, B. (2005). Microglia function in brain tumors. J. Neurosci. Res. 81, 447–455.
Wesolowska, A., Kwiatkowska, A., Slomnicki, L., Dembinski, M., Master, A., Sliwa, M., Franciszkiewicz, K., Chouaib, S., and Kaminska, B. (2008). Microglia-derived TGF-beta as an important regulator of glioblastoma invasion – an inhibition of TGF-beta-dependent effects by shRNA against human TGF-beta type II receptor. Oncogene 27, 918–930.
Keywords: microglia, glioma, C6 cells, NMR spectroscopy, metabolism, phenotype
Citation: Voisin P, Bouchaud V, Merle M, Diolez P, Duffy L, Flint K, Franconi J-M and Bouzier-Sore AK (2010) Microglia in close vicinity of glioma cells: correlation between phenotype and metabolic alterations. Front. Neuroenerg. 2:131. doi: 10.3389/fnene.2010.00131
Received: 29 April 2010;
Paper pending published: 29 May 10;
Accepted: 14 September 2010;
Published online: 12 October 2010
Edited by:
Luc Pellerin, University of Lausanne, SwitzerlandReviewed by:
Florianne Tschudi-Monnet, Université de Lausanne, SwitzerlandPaula Alves, Universidade Nova de Lisboa, Portugal
Copyright: © 2010 Voisin, Bouchaud, Merle, Diolez, Duffy, Flint, Franconi and Bouzier-Sore. This is an open-access article subject to an exclusive license agreement between the authors and the Frontiers Research Foundation, which permits unrestricted use, distribution, and reproduction in any medium, provided the original authors and source are credited.
*Correspondence: Pierre Voisin, RMSB Center, UMR 5536, Centre National de la Recherche Scientifique/Université V. Segalen Bordeaux 2, 146 rue Léo Saignat, 33076 Bordeaux Cedex, France. e-mail: pierre.voisin@rmsb.u-bordeaux2.fr