A comprehensive metabolic profile of cultured astrocytes using isotopic transient metabolic flux analysis and 13C-labeled glucose
- 1 Instituto de Tecnologia Química e Biológica – Universidade Nova de Lisboa, Oeiras, Portugal
- 2 Instituto de Biologia Experimental e Tecnológica, Oeiras, Portugal
- 3 Department of Neuroscience, Faculty of Medicine, Norwegian University of Science and Technology, Trondheim, Norway
Metabolic models have been used to elucidate important aspects of brain metabolism in recent years. This work applies for the first time the concept of isotopic transient 13C metabolic flux analysis (MFA) to estimate intracellular fluxes in primary cultures of astrocytes. This methodology comprehensively explores the information provided by 13C labeling time-courses of intracellular metabolites after administration of a 13C-labeled substrate. Cells were incubated with medium containing [1-13C]glucose for 24 h and samples of cell supernatant and extracts collected at different time points were then analyzed by mass spectrometry and/or high performance liquid chromatography. Metabolic fluxes were estimated by fitting a carbon labeling network model to isotopomer profiles experimentally determined. Both the fast isotopic equilibrium of glycolytic metabolite pools and the slow labeling dynamics of TCA cycle intermediates are described well by the model. The large pools of glutamate and aspartate which are linked to the TCA cycle via reversible aminotransferase reactions are likely to be responsible for the observed delay in equilibration of TCA cycle intermediates. Furthermore, it was estimated that 11% of the glucose taken up by astrocytes was diverted to the pentose phosphate pathway. In addition, considerable fluxes through pyruvate carboxylase [PC; PC/pyruvate dehydrogenase (PDH) ratio = 0.5], malic enzyme (5% of the total pyruvate production), and catabolism of branched-chained amino acids (contributing with ∼40% to total acetyl-CoA produced) confirmed the significance of these pathways to astrocytic metabolism. Consistent with the need of maintaining cytosolic redox potential, the fluxes through the malate–aspartate shuttle and the PDH pathway were comparable. Finally, the estimated glutamate/α-ketoglutarate exchange rate (∼0.7 μmol mg prot−1 h−1) was similar to the TCA cycle flux. In conclusion, this work demonstrates the potential of isotopic transient MFA for a comprehensive analysis of energy metabolism.
Introduction
Isotopic labeling experiments and 13C nuclear magnetic resonance (NMR) spectroscopy have been extensively applied to investigate particular aspects of cerebral metabolism both in cell cultures (Merle et al., 1996a; Waagepetersen et al., 2003; Sonnewald et al., 2004) and in vivo (Gruetter et al., 2001; Garcia-Espinosa et al., 2004; Hyder et al., 2006) due to the highly specific metabolic information generated. The metabolism of a 13C-labeled substrate through different pathways originates distinct labeling patterns and 13C time-courses. These data can then be translated into quantitative metabolic fluxes using mathematical models. In fact, metabolic modeling was crucial to show the existence of metabolic compartmentation (Gruetter et al., 2001) and to determine the contributions from astrocytes (Lebon et al., 2002) and neurons (Hyder et al., 2006) to the overall oxidative metabolism of glucose in the brain.
Simple mathematical models have been used to estimate the pyruvate dehydrogenase (PDH) and pyruvate carboxylase (PC) fluxes based on steady-state 13C fractional enrichment of glutamate or glutamine (Malloy et al., 1988; Martin et al., 1993; Merle et al., 1996a). On the other hand, more sophisticated models consisting of mass and isotope balances have been used to fit glutamine and glutamate 13C time-courses from in vivo NMR experiments and estimate fluxes in relatively simple networks (Henry et al., 2006). These modeling studies have allowed estimating the main metabolic fluxes in the rodent or human brain: neuronal and glial tricarboxylic acid (TCA) cycle, glial anaplerotic PC flux (VPC), glutamate–glutamine cycle flux (VNT), and glutamate/α-ketoglutarate exchange rate (Vx; Henry et al., 2006 and references therein). In addition, Patel et al. (2005) have developed a three compartment model (astrocytes, glutamatergic and GABAergic neurons) to estimate the contribution of GABAergic activity to cerebral energetics. More recently, Jolivet et al. (2009) reported a novel approach based on estimations of state-dependent brain energy budget for neurons and astrocytes using data sets of cerebral glucose and oxygen utilization during different brain activation states.
However, most current models do not consider flux routes that can contribute substantially to the observed isotopic labeling patterns. For instance, label dilution in glutamine and glutamate, usually attributed to metabolite exchange between brain and blood, could actually derive from the pentose phosphate pathway (PPP) or oxidation of fatty acids or of poorly labeled amino acids that might result from proteolysis (Dienel and Cruz, 2009; Shen et al., 2009). These are usually not considered to avoid an increase in the complexity of the metabolic network. Consequently, a larger amount of data would be required to reliably identify all unknown fluxes, which is difficult when working in vivo. Therefore, many assumptions are generally used to determine metabolic fluxes in vivo. However, this issue has raised concern about the reliability of estimated fluxes based on isotopomers derived from 13C glucose metabolism (Shestov et al., 2007).
In contrast to the metabolic modeling tools referred above, a more comprehensive metabolic picture can be provided by metabolic flux analysis (MFA), one of the first tools targeting systems level analysis of intracellular fluxes in microbial and animal cell cultures (Varma and Palsson, 1994; Lee et al., 1999; Quek et al., 2010). This methodology requires the definition of material-balance equations for all metabolites included in the network. Then, by measuring a sufficient number of metabolite consumption/production rates in cell culture supernatants, intracellular fluxes can be estimated based on the network’s stoichiometry and assuming intracellular steady-state (Lee et al., 1999). This implies that the sum of the fluxes leading to the synthesis and consumption of each metabolite is equal to zero and, consequently, intracellular metabolite pools will be constant. Using a simple network, we have recently characterized the effects of hypoglycemia on metabolic fluxes of cultured cerebellar neurons using MFA (Amaral et al., 2011).
Still, MFA based on metabolite balancing alone does not allow well-resolved flux distributions, as the fluxes through parallel pathways or reversible reactions cannot be distinguished. To improve flux resolution, classical MFA has been complemented with 13C labeling data collected at isotopic steady-state. This has been applied by our group to characterize the metabolism of astrocytic cultures under normal conditions and after an ischemic episode (Teixeira et al., 2008; Amaral et al., 2010). In these studies, the steady-state label distribution in certain metabolites in the culture medium was analyzed and this information used to elucidate flux ratios in parallel routes that contribute differently to label distribution, such as the flux ratio of PC to PDH or the flux ratio of glycolysis to PPP.
Recently, Wiechert and Noh (2005) introduced the concept of non-stationary 13C MFA. In this methodology the metabolic steady-state is also assumed but the isotopic transient state (i.e., the time period during which the 13C label is being distributed by the different metabolite isotopomers until isotopic steady-state is reached) in intracellular metabolites is taken into consideration. In this case, mass isotopomers are analyzed at different time points, normally using sensitive mass spectrometry (MS) techniques, to follow the label incorporation immediately after incubating cells with a labeled substrate (Hofmann et al., 2008). Current developments in MS enable a precise assessment of 13C labeling in several metabolites of the main pathways of carbon metabolism in a relatively small sample volume (Noh et al., 2007). Subsequently, to translate the time-series labeling data into metabolic fluxes, such mathematical models combine balances of the total metabolite pools and of individual isotopomers, containing full information about the transition of the labeled carbons within metabolites (Wiechert and Noh, 2005; Noh et al., 2007). Model inputs are isotopomer 13C time-courses and some metabolite pools determined experimentally, in addition to the consumption or production rates of metabolites measured in cell supernatants. Isotopic transient MFA has been successfully applied to estimate fluxes in prokaryotic and mammalian cell systems (Schaub et al., 2008; Metallo et al., 2009). When comparing to the classical MFA, it has as main advantages not relying on uncertain cofactor balances and allowing the estimation of fluxes through both parallel and cyclic pathways as well as through bidirectional reactions (Wiechert and Noh, 2005). It is, however, experimentally and computationally more demanding, requiring the solution of a large number of differential equations (Noh and Wiechert, 2006; Noh et al., 2006).
Hence, the main aim of this study was to apply for the first time the isotopic transient 13C MFA methodology to the study of astrocytic metabolism in order to obtain an integrated picture of their metabolic fluxes. This was achieved by fully exploring the isotopic transient information collected after [1-13C]glucose administration to primary cultures of astrocytes. Quantification of the labeling time-courses was accomplished by gas chromatography–MS (GC–MS) and metabolites pool sizes were measured by high performance-liquid chromatography (HPLC). A comprehensive metabolic network including glycolysis, PPP, TCA cycle, and amino acids metabolism was considered to fit metabolite 13C time-courses and estimate metabolic fluxes. This approach allowed estimating important metabolic fluxes of astrocytes with high statistical quality and provided valuable information on the contribution of other sources than glucose to the main pathways of astrocytic energy metabolism. Thus, it represents a powerful and new tool to investigate still unclear aspects of brain metabolism or metabolic responses of cultured cells to pathological conditions, which can be further explored in vivo.
Materials and Methods
Materials
Plastic tissue culture dishes were purchased from Nunc (Roskilde, Denmark); fetal bovine serum (FBS), penicillin–streptomycin (Pen-Strep) solution, and Dulbecco’s modified Eagle’s Medium (DMEM) were purchased from GIBCO, Invitrogen (Paisley, UK); 13C-labeled glucose was purchased from Cambridge Isotope Laboratories (Andover, MA, USA); N-Methyl-N-(t-Butyldimethylsilyl)trifluoroacetamide (MTBSTFA) + 1% t-butyldimethylchlorosilane (t-BDMS-Cl) was purchased from Regis Technologies (Morton Grove, IL, USA); toluene and acetonitrile were purchased from LabScan (Gliwice, Poland); all other chemicals were purchased from Sigma-Aldrich (Munich, Germany). Animals were purchased from Instituto de Higiene e Medicina Tropical (Lisbon, Portugal).
Cell Culture and Metabolite Extraction
Primary cultures of cortical astrocytes were obtained from 1- to 2-day-old rats and prepared as described previously (Richter-Landsberg and Besser, 1994). Cells were cultured in DMEM containing 5 mM glucose and supplemented with Pen-Strep (100 U/mL) and 20% (v/v) FBS, gradually reducing its concentration to 10%. Cultures were kept in a humidified atmosphere with 7% CO2 in air and 37°C. After 3 weeks in culture, cells were trypsinized and seeded into six-well plates at a cell density of 5 × 10⁴ cells/cm2. Experiments were performed when cells reached confluence: the culture medium was removed, cells were washed with phosphate-buffered saline (PBS) and subsequently incubated with DMEM with 1% FBS containing 4 mM [1-13C]glucose (2 ml of culture medium per well). The transient period of label incorporation into intracellular metabolites was followed during 24 h, using a shorter sampling time in the beginning. Samples of medium and cell content were collected at 0, 6, 12, 30 min, 1, 2, 4, 7, 10, 16, and 24 h after labeled glucose administration. Experiments were run in triplicate. The cell supernatant was collected, centrifuged at 200 × g for 10 min and stored at −20°C until further analysis. Cell monolayers were washed with cold PBS to eliminate tracer amounts of extracellular metabolites, frozen in liquid nitrogen to rapidly stop metabolism and extracted with 70% (v/v) ethanol, followed by centrifugation at 20,000 × g for 15 min. The resulting supernatants (cell extracts) were stored at −80°C until GC–MS or HPLC analysis. The pellets were stored at −20°C and were later used either for protein analysis.
Quantification of Extra- and Intracellular Metabolite Concentrations
Glucose and lactate concentrations in samples of cell supernatants were determined using an automated YSI 7100 Multiparameter Bioanalytical System (Dayton, OH, USA). Intra- and extracellular concentrations of amino acids were quantified by HPLC using a pre-column derivatization method based on the Waters AccQ.Tag Amino Acid Analysis method as described elsewhere (Amaral et al., 2010).
Protein Quantification
The total cellular protein content was determined by dissolving the cell pellets in 0.1 M NaOH followed by incubation overnight at 37°C, to ensure complete protein extraction. The bicinchoninic acid protein assay from Pierce (Rockford, IL, USA) was used to determine total protein amounts using bovine serum albumin as standard.
Quantification of Mass Isotopomers by GC–MS
For analysis of lactate, amino acids (alanine, aspartate, glutamate, and glutamine), and TCA cycle intermediates (α-ketoglutarate, fumarate, and malate), samples of cell extracts and cell supernatants were lyophilized and dissolved in 0.01 M HCl followed by pH adjustment to pH < 2 with 6 M HCl. The samples were then dried under atmospheric air (50°C). The metabolites were extracted into an organic phase of ethanol and benzene and dried again under atmospheric air (50°C). N,N-Dimethylformamide (DMF) was added before derivatization with MTBSTFA in the presence of 1% t-BDMS-Cl (Mawhinney et al., 1986). It was not possible to obtain consistent values for the enrichment of intracellular lactate.
The protocol used for analysis of the glycolytic intermediates phosphoenolpyruvate (PEP) and 3-phosphoglycerate (3PG), was based on that described in (Hofmann et al., 2008). Samples of cell extracts were lyophilized, dissolved in methanol, and dried under atmospheric air (50°C). The metabolites were then extracted with toluene and dried again under atmospheric air (50°C). Derivatization was performed using a mixture of N-Methyl-N-(trimethylsilyl)trifluoroacetamide (MSTFA) + 1% trimethylchlorosilane and acetonitrile.
All samples were analyzed on an Agilent 6890 gas chromatograph with a capillary column (WCOT fused silica 25 mm × 0.25 mm ID, 0.25 μm film thickness, VF-1ms, Varian), connected to an Agilent 5975B mass spectrometer with electron impact ionization. Atom percent excess (13C) in the different metabolites was determined after calibration using unlabeled standard solutions (Biemann, 1962). Mass isotopomers differ by the number of labeled carbons; m represents the fraction of unlabeled compound in the total compound pool, m + 1 the fraction of compound labeled in one carbon and so on. All fractions of a metabolite sum up to 100%.
Isotopic Transient 13C Metabolic Flux Analysis
Metabolic network and metabolite balancing
According to the main changes observed intracellularly and in the culture supernatant, a metabolic network was established to represent the metabolism of astrocytes (Figure 1). The network comprises the following metabolic pathways: glycolysis, PPP, TCA cycle, malate–aspartate shuttle (MAS), catabolism of some amino acids, and synthesis of glutathione, glutamine, alanine, and taurine/hypotaurine. It contains 32 balanced intracellular metabolites and a total of 47 fluxes, from which three were considered reversible.
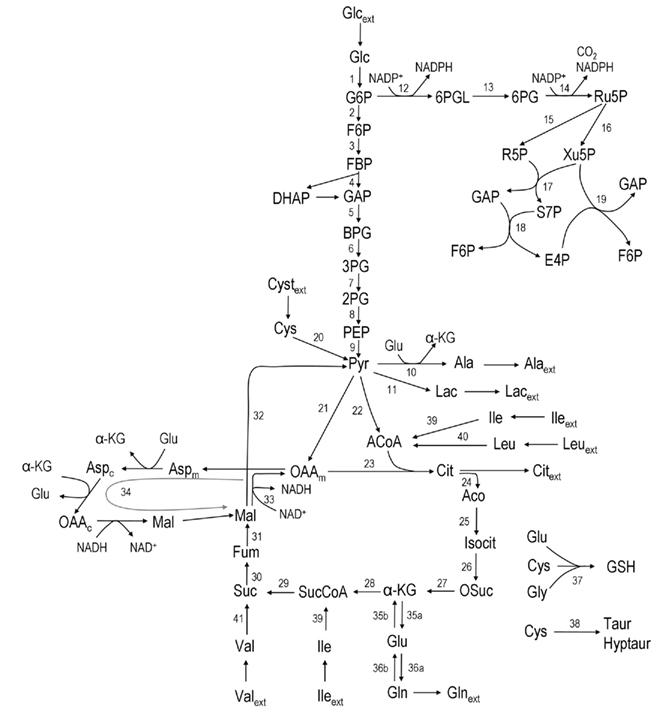
Figure 1. Network representing astrocytic metabolism (the stoichiometry of the reactions can be found in Appendix). Abbreviations: Glc, glucose; G6P, glucose-6-phosphate; F6P, fructose-6-phosphate; DHAP, Dihydroxy-acetone phosphate; GAP, glyceraldehyde-3-phosphate; BPG, 1:3-bis-phosphoglycerate; 3PG, 3-phosphoglycerate, 2PG, 2-phosphoglycerate; PEP, phosphoenolpyruvate; PYR, pyruvate; 6PGL, 6-phospho-gluconolactone; 6PG, 6-phosphogluconate; Ru5P, ribulose-5-phosphate; R5P, ribose-5-phosphate; Xu5P, xylulose-5-phosphate; S7P, sedoheptulose-7-phosphate; E4P, erythrose-4-phosphate; Lac, lactate; Glu, glutamate; ACoA, Acetyl-Coenzyme A; Cyst, cystine; Cys, cysteine; Gly, glycine; GSH, glutathione; Ala, alanine; α-KG, α-ketoglutarate; OAA, oxaloacetate; Cit, Citrate; Aco, cis-aconitate; Isocit, isocitrate; OSuc, oxalosuccinate; SucCoA, succinyl-coenzyme A; Succ, succinate; Fum, fumarate; Mal, malate; Aspm, aspartate – mitochondrial pool; Aspc, aspartate – cytosolic pool; Gln, glutamine; Leu, leucine; Ile, isoleucine; Val, valine; Lys, lysine; ext refers to metabolites taken up from/released to the medium.
Isotopic transient MFA relies in both metabolite and mass isotopomers balancing. If the metabolic network has m metabolites and q reactions, the following steady-state material balances can be formulated (Eq. 1):

with N being a m × q stoichiometric matrix, and r the vector of q metabolic rates.
Modeling of isotopomer 13C time-courses
After administration of the labeled substrate, the mass isotopomer distribution of each metabolite changes over time depending on the flux distribution. To represent mathematically the system and estimate the unknown fluxes, a set of differential equations needs to be established for each isotopomer, fulfilling the stoichiometric constraints of the metabolic network. Carbon transitions occurring in biochemical reactions are well established for the majority of metabolic pathways and documented in biochemistry textbooks. Eqs 2 and 3 represent the balances for the two mass isotopomers of glucose, when [1-13C]glucose is the labeled substrate:


where Glcm is the fraction of unlabeled glucose, Glcm + 1 is the fraction of glucose labeled in one carbon, Glcpool is the intracellular glucose pool, rGlc is the uptake rate of glucose, and r1 is the flux through reaction 1. The equations for the remaining intracellular metabolites are listed in Appendix.
[1-13C]glucose is taken up by astrocytes and subsequently metabolized either via PPP, where the labeled carbon is lost as CO2, or via glycolysis, labeling 3PG, PEP, and pyruvate in carbon number 3. [3-13C]pyruvate can be converted to [3-13C]lactate or [3-13C]alanine, be transported into mitochondria to enter the TCA cycle as [2-13C]acetyl-CoA via pyruvate dehydrogenase or as [3-13C]oxaloacetate by anaplerosis through the pyruvate carboxylation pathway (Shank et al., 1985). Condensation of [2-13C]acetyl-CoA with unlabeled oxaloacetate will, after several steps, lead to the formation of [4-13C]glutamate and to either [2-13C]- or [3-13C]aspartate after the symmetrical succinate step. These compounds have one 13C atom and are thus detected as m + 1 isotopomers in GC–MS. If labeled oxaloacetate condenses with labeled acetyl-CoA, double labeled metabolites are formed and they will be detected as m + 2 in GC–MS. Eventual cycling of the labeled compounds in the TCA cycle may lead to the synthesis of triple labeled metabolites (m + 3) after condensation of double labeled oxaloacetate with [2-13C]acetyl-CoA. From the 13C-labeling time-courses experimentally observed by GC–MS analysis, we have considered two isotopomers for glycolysis and PPP intermediates (m and m + 1), three isotopomers for pyruvate, lactate, alanine, and acetyl-CoA (m, m + 1, and m + 2), and four isotopomers (m, m + 1, m + 2, and m + 3) for the TCA cycle intermediates and remaining amino acids. In total, the system is represented by 96 differential equations.
Labeling time-courses are influenced by the pool sizes of the metabolites. If these pools are not measured then they must be considered as unknown parameters in the model. On the other hand, lumping reactions in linear pathways cannot be done if the involved metabolites have different pool sizes. As they take different times to reach isotopic steady-state, lumping such reactions can perturb the fitting to the experimental data and falsify flux estimations. It should be mentioned that no intracellular compartments were distinguished as it is still unfeasible to quantify separately metabolite concentrations in different compartments. Therefore, only one single pool was considered for each intracellular metabolite.
Parameter estimation
For parameter identification, an optimization routine iteratively minimizes the function (F) represented in Eq. 4, until an acceptable small value is achieved. F is a variance-weighted difference between mass isotopomer measurements (Im) and model predictions (Ip). Mass isotopomer data, Im, from the different metabolites collected at the time points indicated above (0, 6, 12, 30 min, 1, 2, 4, 7, 10, 16, and 24 h) were used for model fittings. As the various isotopomer profiles are measured with different accuracies, the errors must be weighted by the corresponding SDs:
where p is the vector of parameters, T is the number of measured time points, n is the number of mass isotopomers and  the variances of the mass isotopomer measurements. The set of fluxes and unmeasured pools corresponding to the minimum value of Eq. 4 is the solution for the flux calculation problem. To solve this optimization problem a quasi-Newton optimizer was employed (fmincon function from MATLAB™). As gradient algorithms are prone to converge to local optima, the optimization was repeated systematically with different parameter starting values in order to increase the probability of reaching the global optimum. The initial parameter set was selected to be consistent with available primary literature on astrocytic metabolism. We then screened each initial parameter guess within a biologically relevant range, and chose the optimum parameter minimizing Eq. 4.
Computationally, it is more efficient to work with a set of independent fluxes, also called free fluxes, rather than with all metabolic fluxes (Wiechert and de Graaf, 1997). From the 47 fluxes composing the metabolic network, 10 were experimentally measured (glucose, lactate, alanine, glutamine, leucine, isoleucine, valine, cystine production, or consumption rates) or taken from literature (citrate and glutathione release rates; see below – Tables 1 and 4). Since the rank of the stoichiometric matrix is 31, there are six free fluxes (37–31) that need to be estimated; the remaining fluxes are subsequently calculated through linear combinations of these independent fluxes. Several pool sizes could not be experimentally measured and it is not possible to estimate those for which experimental 13C time-courses are also not available. Since published data on absolute pool concentrations is still limited, the pools of acetyl-CoA and all glycolytic and PPP intermediates were considered equivalent and the average pool size (Glycolysis/PPP pool) was included in the group of parameters to be estimated. Regarding the TCA cycle intermediates for which mass isotopomer data was not available, an average pool size was tuned by trial-and-error and set equal to 0.03 μmol mg−1 protein. In total, 11 parameters (six free fluxes and five pool sizes) were estimated by fitting the model to the experimentally observed labeling dynamics.
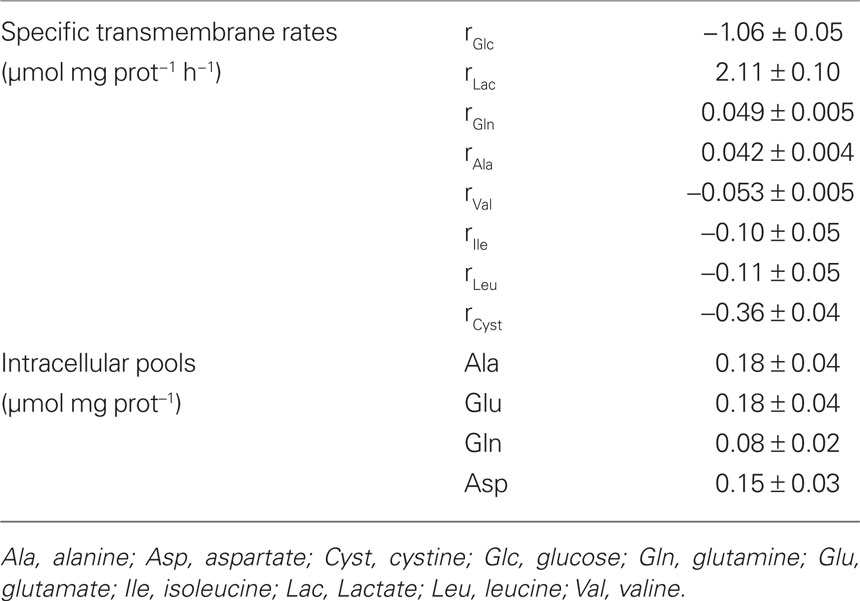
Table 1. Experimentally measured values for intracellular pools of some amino acids and transmembrane rates of glucose, lactate, and amino acids whose concentration changed significantly during incubation time (negative values refer to consumption rates).
Parameter confidence limits
Since parameter estimation involves a variety of possible errors, including measurements, modeling, and numerical errors, uncertainty analysis of the optimized parameters constitutes an important part of this estimation. Parameter uncertainty is assessed by its covariance. Assuming that the solution converges to a global minimum, the Hessian matrix H can be approximated from the Jacobian matrix J as follows:

The Jacobian matrix includes the partial derivatives of the model output with respect to the model parameters evaluated at each data point. The covariance matrix (cov) can then be estimated as

with RMSE being the root mean squared error.
The confidence interval for each parameter pi is obtained from the estimate of the SD  as follows:

with t0.975,T−p being the t-student’s distribution for T−p (the number of measured data points minus the number of parameters) degrees of freedom and probability 0.975.
Sensitivity analysis
To investigate the possibility of accurately identifying each model parameter on the basis of the available experimental data, a sensitivity analysis must be performed. The sensitivity coefficient, Sensi, reveals how the objective function F (Eq. 4) will be influenced by a differential change in the parameter pi.
The goal is to determine how “sensitive” the mathematical model is to changes in the value of its parameters. Small sensitivities, i.e., large changes in the parameter value resulting in small changes in the minimized sum of squared residuals, indicate that the parameter cannot be estimated accurately. Large sensitivities, on the other hand, indicate that the parameter can be estimated with high confidence.
Results
Primary cultures of astrocytes were incubated with [1-13C]glucose and, during 24 h, samples of culture supernatant and cell content were collected at different time points, in order to estimate astrocytic metabolic fluxes and characterize metabolite labeling dynamics. This time window was enough to ensure isotopic steady-state in almost all intracellular metabolites analyzed by GC–MS.
Specific Rates of Consumption/Production of Glucose, Lactate, and Amino Acids
Consumption or secretion rates of relevant compounds were determined based on the changes of their concentrations in the culture medium (Table 1). It is generally accepted that glucose is the main energy substrate for the brain and also for astrocytes under physiological conditions (Zwingmann and Leibfritz, 2003). In agreement with previous studies, glucose was consumed at a constant rate of 1.06 ± 0.05 μmol mg prot−1 h−1, representing about 70% of the total carbon taken up by astrocytes. Amino acid analysis showed a decrease in the extracellular levels of the three branched chain amino acids (BCAA) isoleucine, leucine, and, to a lesser extent, valine. Consumption of these amino acids by astrocytes under physiological conditions has also been reported by other authors (Yudkoff et al., 1996; Johansen et al., 2007; Murin et al., 2009). Furthermore, cystine levels decreased in the supernatant, with an uptake rate larger than that of BCAA. Cystine is the precursor for cysteine, and both amino acids can be used for the biosynthesis of glutathione, taurine, and hypotaurine in astrocytes (Brand et al., 1998; Kranich et al., 1998). Lactate, alanine, and glutamine were steadily released by astrocytes during incubation. GC–MS analysis of the supernatant at the end of the experiment confirmed the release of these compounds, providing the fractional enrichment of each isotopomer (Table 2; see next sub-section). Citrate secretion was also evident from the GC data. However, its release rate could not determined because the GC–MS method used in this work only provides the relative abundance of isotopomers, not the total concentrations. Consequently, the release rate of 0.025 μmol mg prot−1 h−1, reported by (Westergaard et al., 1994) was used for modeling purposes. Intracellular amino acid pools were measured by HPLC and are listed in Table 1. Cellular growth was negligible during the time frame considered as indicated by the amount of protein measured in different cell samples (0.126 ± 0.009 mg protein/well).
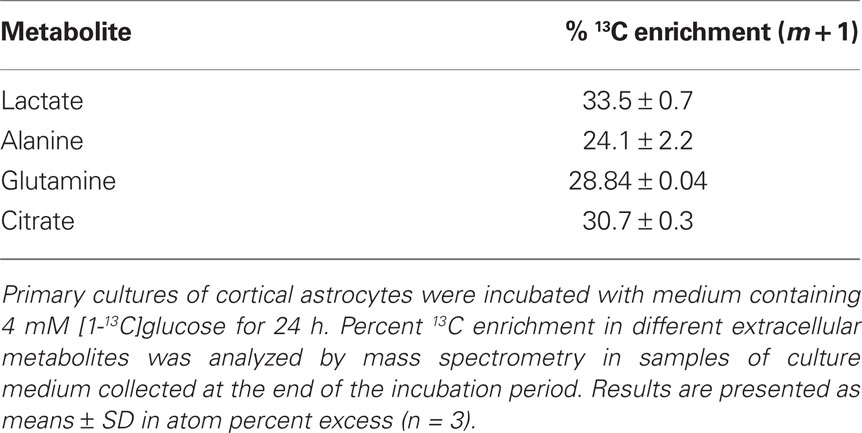
Table 2. Percent 13C enrichment in extracellular metabolites.
Experimental 13C Labeling Time-Courses
Samples of cell extracts were collected during the isotopic transient period in order to characterize labeling dynamics of intracellular metabolites of astrocytes using GC–MS. The metabolites analyzed include the glycolytic intermediates PEP and 3PG, the TCA cycle intermediates citrate, α-ketoglutarate, fumarate, and malate, and the amino acids alanine, glutamine, glutamate, and aspartate. Glycolytic intermediates reached isotopic steady-state much faster than TCA cycle intermediates (Figure 2). After addition of labeled glucose, the fraction of the unlabeled pools of PEP and 3PG decreased very fast, reaching isotopic steady-state within less than 30 min with an enrichment of 45% in m + 1. Regarding alanine, it seems that isotopic steady-state was not reached within the 24 h of incubation. At this time, 31% of the pool was labeled in one carbon. Citrate, the first TCA cycle intermediate after acetyl-CoA condenses with oxaloacetate, reached 45% of isotopic enrichment (m + 1 and m + 2) whereas the enrichment in fumarate was about 15% less (Figure 2). In addition, the labeled pools of malate and aspartate were very similar and slightly more enriched than that of fumarate. Furthermore, labeling time-courses of α-ketoglutarate, glutamate and glutamine were comparable but slower than that of citrate. It is noteworthy that synthesis of m + 2 and m + 3 mass isotopomers was observed for most of the TCA cycle intermediates analyzed, representing up to 8% of the total pools, for citrate and glutamate. This suggests that some mass isotopomers are formed after condensation of 13C-labeled acetyl-CoA with 13C-labeled oxaloacetate.
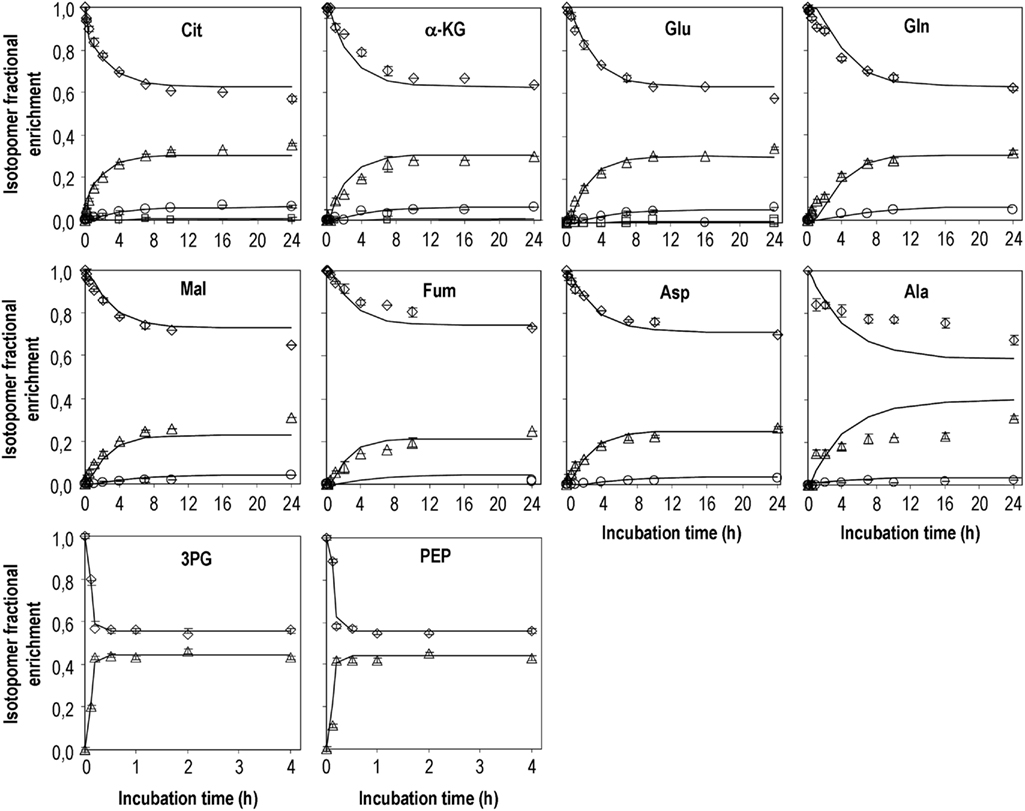
Figure 2. Mass isotopomers distribution after incubation of primary cultures of astrocytes with DMEM containing [1-13C]glucose. Diamonds – m; triangles – m + 1; circles – m + 2; squares m + 3. Experimental data obtained for m + 3 isotopomers of glutamine, fumarate, malate, and aspartate were below 0.5% 13C enrichment and therefore are not presented. Symbols are average values of GC–MS analysis of cell extracts from three parallel cultures of astrocytes; error bars correspond to SDs; lines are model predictions.
13C enrichment of extracellular metabolites was also analyzed at the end of the incubation time (Table 2). The difference between % 13C enrichment in lactate and alanine (34 vs. 24% m + 1, respectively) can be surprising given their common origin – pyruvate, suggesting metabolic compartmentation (see Discussion). Moreover, alanine enrichment in the culture medium differed significantly from its intracellular enrichment. Extracellular citrate was ∼30% enriched in m + 1, which is similar to the data obtained for its intracellular pool, the same being observed for glutamine.
Flux Estimations by Isotopic Transient 13C MFA
Intracellular flux estimations were obtained by minimizing the difference between model simulations and experimentally observed isotopomer profiles. The optimal fittings to the 13C labeling time-courses of the 10 metabolites experimentally analyzed are shown in Figure 2. For some metabolites, the enrichment in heavy mass isotopomer fractions (m + 2 and m + 3) was detectable but with very low values (<1% above natural abundance) and with large associated SDs. Therefore, they were not considered in model fitting. Estimated parameters together with their 95% confidence intervals are presented on Table 3. The remaining intracellular fluxes were calculated from the estimated free fluxes and are shown in Table 4. Both the fast labeling dynamics of PEP and 3PG and the slow dynamics of TCA cycle-related metabolites were well described by the model (Figure 2). However, the predicted labeling time-courses of alanine differed from experimental data to some extent. Different model structures were attempted to improve fittings for alanine; for instance, reaction r10 was turned reversible, but a null flux was identified for inverse reaction. These results suggest that labeling of the alanine pool is more complex than that described by our model and is probably related to the existence of different pyruvate pools (discussed below). The average error between measured and predicted mass isotopomer profiles of the remaining metabolites was below 3%. The reason for the small deviations between α-ketoglutarate time-courses and model predictions might be worth to investigate further. According to the metabolic network adopted, α-ketoglutarate and glutamate are constantly being inter-converted, implying that the different isotopomers of both metabolites reach the same steady-state values. However, the unlabelled pool of α-ketoglutarate seems to be systematically ∼4% higher than that of glutamate, also at isotopic steady-state. This is probably due to cellular compartmentalization not taken into account by the metabolic network adopted.
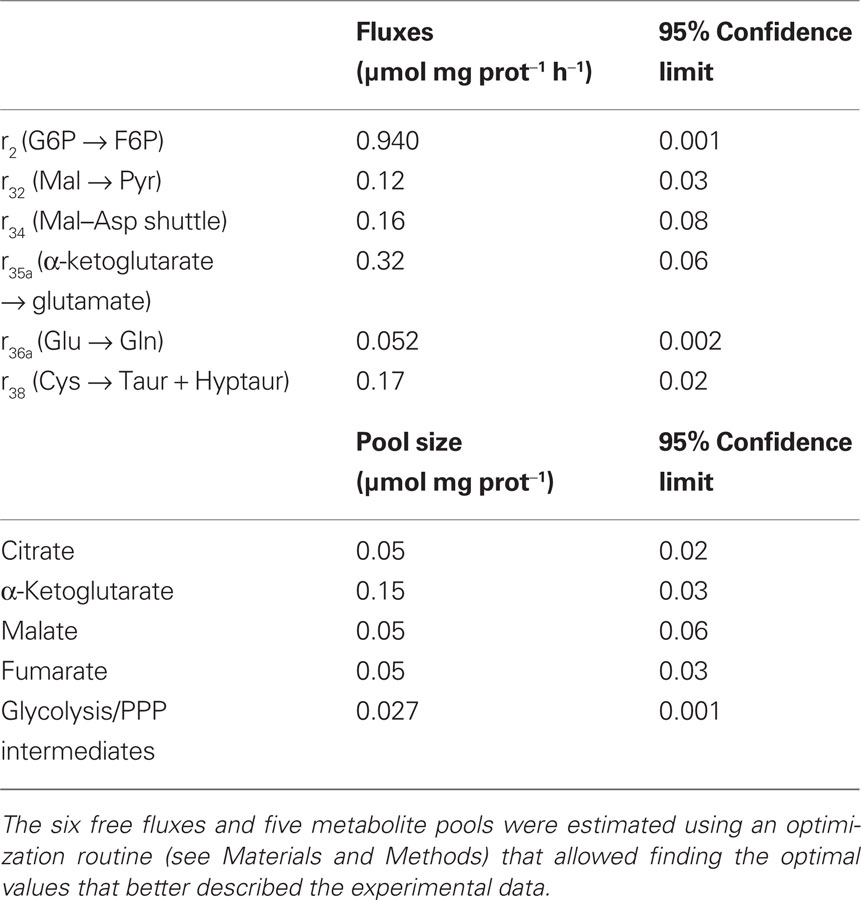
Table 3. Parameter values (fluxes and metabolite pools) which allowed the best fit to the mass isotopomer data.
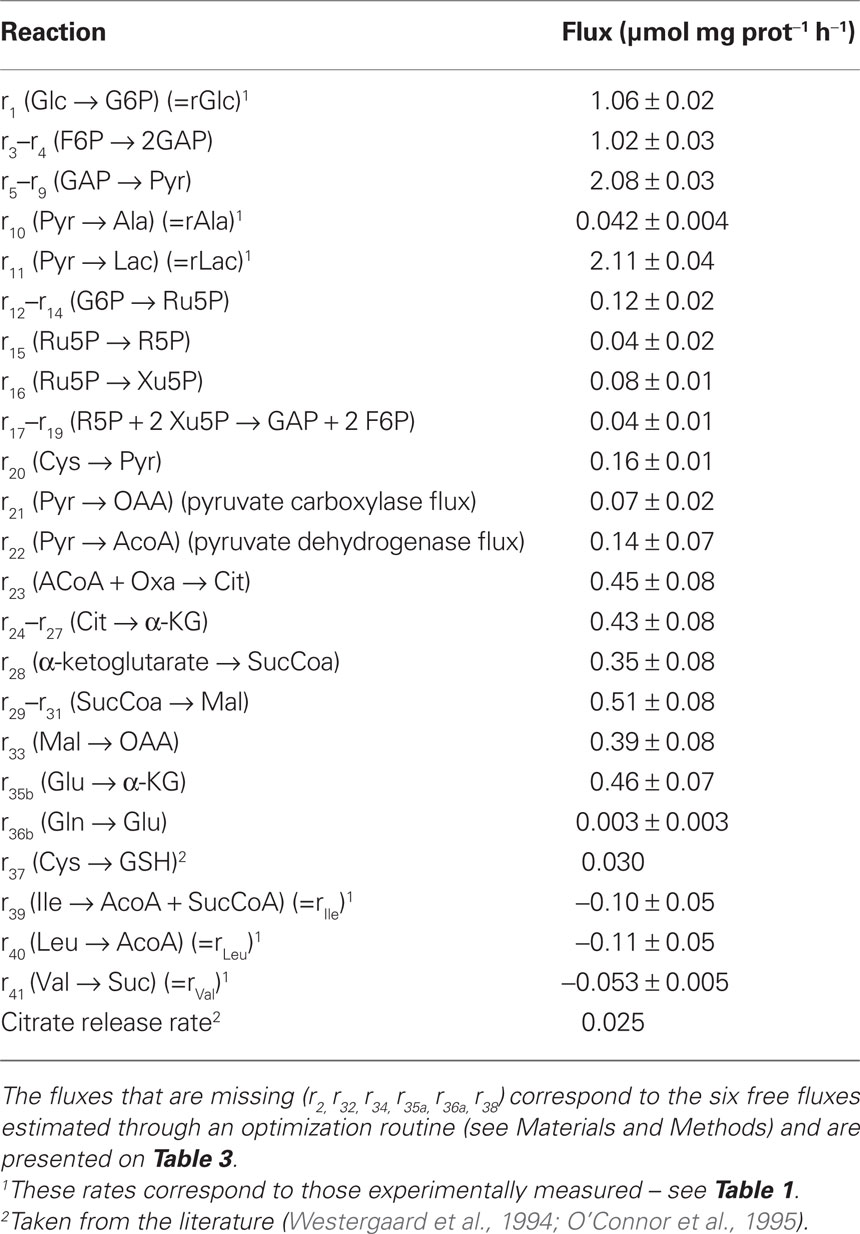
Table 4. Astrocytic metabolic fluxes estimated using the isotopic transient MFA methodology.
Concerning the estimated fluxes, astrocytes showed a high glycolytic flux, converting most of the glucose to lactate. In addition, the model estimated that 11% of the glucose flux was diverted to the PPP (r12). Some activity through the PPP could be anticipated based on the 45% enrichment in m + 1 of PEP and 3PG at isotopic steady-state, as further sources of label dilution in upper glycolytic metabolites (like glycogen degradation) were not considered in the model. In fact, [1-13C]glucose metabolism through the PPP leads to the loss of 13C as CO2 (r14). Subsequently formed metabolites might re-enter glycolysis at the 3-phosphate-glyceraldehyde node, consequently diluting the enrichment of downstream metabolites.
Furthermore, 14% 13C enrichment for acetyl-CoA was predicted at isotopic steady-state (data not shown). Even though pyruvate was estimated to be 41% enriched, the synthesis of acetyl-CoA as a consequence of the metabolism of leucine and isoleucine (from incubation medium) dilutes the enrichment in this pool. Moreover, the model estimated the anaplerotic flux through PC as being 0.07 ± 0.02 μmol mg prot−1 h−1 (Table 4) and the flux through PDH as being 0.14 ± 0.07 μmol mg prot−1 h−1 (Table 4), which gives a PC/PDH ratio of 0.5. The model also estimated the flux through the MAS (0.16 μmol mg prot−1 h−1). Regarding the flux for the conversion of malate into pyruvate (r32 – malic enzyme), it was estimated as being 0.12 ± 0.03 μmol mg prot−1 h−1 (Table 3). Furthermore, the experimentally measured uptake rate of cystine would significantly dilute the labeling dynamics of pyruvate and subsequently formed metabolites, if that would be its only metabolic fate. However, it is known that the major metabolic products of cystine/cysteine in astrocytes are taurine and hypotaurine (Brand et al., 1998), in addition to being a rate-limiting substrate in the biosynthesis of glutathione (Dringen and Hirrlinger, 2003). Thus, these different fates of cysteine were included in the model (reactions 37 and 38). Glutathione synthesis was set to 0.030 μmol mg prot−1 h−1, as reported in the literature for physiological conditions (O’Connor et al., 1995), and the model estimated a net rate of taurine and hypotaurine synthesis (r38 – 0.17 ± 0.02 μmol mg prot−1 h−1 – Table 3) as well as the fraction which is converted into pyruvate (r20 – 0.16 ± 0.01 μmol mg prot−1 h−1 – Table 4) in order to have a cysteine to pyruvate rate that would fit better with the observed labeling dynamics.
This approach additionally enabled to estimate the fluxes of exchange between α-ketoglutarate and glutamate (Tables 2 and 3; Figure 3), which were similar to the TCA fluxes. Interestingly, a net flux favoring glutamate release from the TCA cycle was estimated. Regarding glutamine, the predicted isotopomer dynamics was a little slower than that experimentally observed. This might indicate a glutamine pool smaller than the measured value. The estimated flux through the reaction catalyzed by glutamine synthetase (r36a; Table 3) was slightly higher than the observed glutamine secretion rate, resulting in some flux through the inverse reaction (r36b; Table 4).
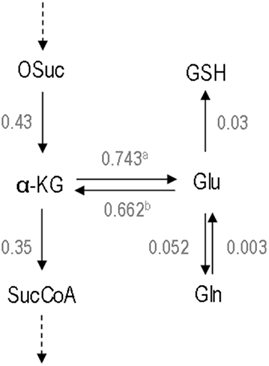
Figure 3. Total metabolic fluxes at the glutamate/α-ketoglutarate node. The forward and reverse fluxes of α-ketoglutarate/glutamate exchange were calculated by summing up all fluxes of the reactions in which they are included. Values are μmol mg prot–1 h−1. a – The total flux α-ketoglutarate → glutamate is the sum of the fluxes r34, r35a, r39, r40, and r41. b – The total flux glutamate → α-ketoglutarate is the sum of the fluxes r35b, r34, and r10. Abbreviations: α-KG, α-ketoglutarate; Gln, glutamine; Glu, glutamate; GSH, glutathione; OSuc, oxalosuccinate; SucCoA, succinyl-Coenzyme A.
Statistical Significance of Estimated Fluxes and Pool Sizes
After estimation of the free fluxes, their statistical validity must be evaluated. Besides the confidence limits (Table 3), also the sensitivity coefficients were derived for each parameter. All free fluxes presented small confidence intervals showing low uncertainty. Moreover, sensitivity coefficients higher than 1 were obtained for all fluxes and pool sizes (data not shown). A sensitivity coefficient equal to 1 means that a variation of 10% in the corresponding parameter affects the function F (Eq. 4) in 10%. Thus, sensitivity coefficients higher than 1 mean that the model is sensitive to the parameter value, and indicate that the free fluxes were identified with good precision. Together with intracellular fluxes, intracellular pool sizes determine the isotopomer profiles of the various metabolites during incubation time; thus, the pool sizes which were not experimentally determined had to be estimated by model fitting to the experimental data (Table 3). The average pool for glycolytic and PPP intermediates was estimated as 0.027 ± 0.001 μmol mg prot−1. The small confidence interval for this pool shows its statistical validity. The citrate and α-ketoglutarate pools could also be estimated with reasonable statistical confidence. The same is not true for fumarate and malate pools, presenting wide confidence intervals.
The fitting performance (defined by the objective function) is rather sensitive to the optimized parameters. Inversely, the proposed parameter set is quite robust to variations in the fitting performance, revealing that even if reaching only a sub-optimal solution within the biologically relevant parameter space, the optimal parameter set would be relatively closer to the sub-optimal one. This means that the deviations between model and experimental measurements have a small impact on flux estimations.
Discussion
13C Isotopic Transient MFA vs. Other Modeling Methodologies
In this work, a state-of-the-art metabolic modeling tool, isotopic transient 13C MFA (Wiechert and Noh, 2005), was applied for the first time to estimate intracellular fluxes of brain cells. This methodology uses all the information contained in the isotopic transient data and, thus, the quality of flux estimations is strongly improved when compared to the classical MFA. The latter provides only the net fluxes (not the separate fluxes) through parallel metabolic pathways and reversible reactions. Isotopic transient 13C MFA allows the resolution of important branches of the metabolic network. This is the case for the fluxes of parallel pathways (glycolysis vs. PPP and PC vs. PDH), bidirectional reactions (the reversible exchange between α-ketoglutarate and glutamate and between glutamate and glutamine – see Figure 3), and cyclic pathways (MAS).
Isotopic transient MFA constitutes an improved, although more complex, alternative to the model pioneered by Malloy, which was initially developed to investigate heart metabolism (Malloy et al., 1988) and later adapted to estimate fluxes based on isotopomer composition of glutamate in neurons or glutamine in astrocytes (Martin et al., 1993; Merle et al., 1996b). Nevertheless, both MFA/13C MFA and the Malloy model have only been applied to estimate fluxes in a single cellular compartment. A network describing metabolic interactions between astrocytes and neurons would include a much larger number of reactions and, consequently, of unknown fluxes. This would require a larger set of experimental data and, in particular, the separate measurement of specific metabolic rates and pools for astrocytes and neurons, in order for the system to be determined. Still, this could be performed in a co-culture system, in which neurons and astrocytes could be physically separated (for example, using cell culture inserts).
The present methodology thus requires the use of sensitive techniques, such as MS, and considerable experimental work. 13C-NMR spectroscopy can also be used, particularly when the labeled substrates yield more complex labeling patterns. However, its low sensitivity compared to MS becomes a disadvantage when the goal is to have labeling time-courses for as many metabolites as possible. In the present study, mass isotopomer data and metabolite pools were still limited to a relatively small number. Actually, quantification of metabolite pools has been one of the major drawbacks of isotopic transient MFA. GC–MS provided only the relative isotopic enrichment of intracellular pools. To have absolute pool concentrations, difficult-to-obtain labeled standards would be required. Nevertheless, the number of quantifiable mass isotopomers and absolute pool concentrations is expected to increase as MS techniques continue to improve. In addition, the high specificity of 1H NMR spectroscopy widely used in the metabolomics field (Weljie et al., 2006) could also be a good tool to quantify metabolite pools.
To investigate brain metabolism in the scope of larger (underdetermined) networks, another metabolite balancing approach called flux balance analysis (FBA) has been applied (Cakir et al., 2007; Lewis et al., 2010). FBA relies on linear programming to obtain a solution for the intracellular fluxes in underdetermined systems (Kauffman et al., 2003). However, it requires the definition of a metabolic objective which is maximized or minimized during flux calculations (Kauffman et al., 2003). This metabolic objective might be hard to define, particularly concerning the complex interactions between brain cells. Cakir et al. (2007) reported recently the application of FBA to investigate the metabolic interactions between neurons and astrocytes using diverse metabolic objective functions. Comparing to literature findings the best flux prediction was achieved when the maximization of the glutamate–glutamine-GABA cycle flux was the objective function (Cakir et al., 2007). Also based on linear programming, Lewis et al. (2010) have recently reported a large-scale in silico model, including genomic and proteomic data, to recapitulate metabolic interactions between astrocytes and different types of neurons. This model correlates flux changes with altered expression or activity of particular enzymes (Lewis et al., 2010), representing a major breakthrough in this field, although it goes much beyond the scope of isotopic transient MFA.
Estimation of Fluxes in Parallel Pathways: PPP/Glycolysis and PC/PDH Branch Points
The PPP plays a key role in the maintenance of the cellular redox balance by ensuring the recycling of the reducing cofactor NADPH, necessary for the regeneration of glutathione, the major antioxidant molecule in brain cells (Dringen, 2000). In fact, the model takes some synthesis of glutathione from cysteine into account. Also based on the 45% enrichment in PEP and 3PG at isotopic steady-state, the model estimated an 89:11% flux ratio between glycolysis and the PPP. Most of the available estimations of the PPP flux were carried out using data from in vitro studies. Fitting with the present results, using the classical MFA combined with 13C labeling data collected at isotopic steady-state, we have recently estimated that ∼10% of the total glucose consumed was metabolized through the PPP in astrocytes cultured in stirred bioreactors (Amaral et al., 2010). Previously, Ben-Yoseph et al. (1996) had reported a basal astrocytic PPP flux of ∼7% of the total lactate produced from glucose in cultured astrocytes, determined by a GC–MS method based on the differential labeling of released lactate following metabolism of [1,6-C2,6,6-2H2]glucose. This value increased to 67% during exposure to oxidative stress (Ben-Yoseph et al., 1996). A PPP flux of 7% has also been reported in healthy human subjects using [1,2-13C]glucose and 13C-NMR spectroscopy (Dusick et al., 2007). The importance of considering the PPP in modeling studies and of providing better tools to estimate its flux is justified by its significant influence on estimations of the glutamate–glutamine cycle in vivo (Shen et al., 2009). In addition, experimental data obtained in the context of brain activation studies in rats provided further evidence that the PPP might contribute more than previously estimated to the “glutamine dilution” phenomenon (Cruz et al., 2007; Dienel and Cruz, 2009).
Still, we cannot exclude that minor glycogen degradation could also have influenced the observed enrichment in glycolytic intermediates. In fact, lactate released by astrocytes was shown to partially result from glycogen breakdown, even in the presence of glucose (Sickmann et al., 2005). Nevertheless, the role of glycogen as energy fuel appears to be more significant in the context of brain activation (Dienel et al., 2007). Glycogenolysis was not included in the model due to the lack of experimental data enabling us to distinguish between the contribution from the glycogen shunt and the PPP to PEP and 3PG 13C time-courses. More isotopomer time-courses would be required, for example, those from glucose or glucose-6-phosphate and intermediates of the PPP. It was decided to include the PPP instead of the glycogen shunt since it is more likely that this pathway accounts for the label dilution observed in glycolysis. The PPP is required for maintaining the basal cellular redox balance (Dringen, 2000), even when significant oxidative stress is not present.
Pyruvate carboxylation is an important anaplerotic reaction in the brain and is thought to occur predominantly in astrocytes due to the specific glial localization of the PC enzyme (Shank et al., 1985). The PC/PDH ratio is usually estimated based on the different metabolite isotopomers, such as glutamate or glutamine, originating from [13C]glucose metabolism through each of these pathways. In this work, the PC/PDH ratio (0.5) was calculated directly from the estimated PC and PDH fluxes, based on total carbon fluxes and not only on the 13C fluxes coming from glucose. This PC/PDH ratio fits well with those determined in vitro (Hassel et al., 1995; Waagepetersen et al., 2001) and also in vivo (Gruetter et al., 2001; Merle et al., 2002; Oz et al., 2004) for the glial compartment. Interestingly, Merle et al. (1996b) estimated a PC/PDH ratio of 0.54 in cultured cerebellar astrocytes and a similar value was obtained by us (Teixeira et al., 2008) in cultured cortical astrocytes. Taking into account the measured rates of release of different metabolites, the present results confirm that PC significantly contributes to the release of citrate and glutamine from astrocytes (Waagepetersen et al., 2001). Moreover, the PC flux is known to be implicated in glutamine synthesis also in the resting human brain (Gruetter et al., 1998) and its contribution was estimated to be 35% by metabolic modeling (Gruetter et al., 2001). Also, Duarte et al. (2011) very recently estimated a 25% contribution of PC to the glial TCA cycle rate in the rat brain and a PC/PDH ratio of 30% for the glial compartment. Even though the absence of neurons might reduce the need of glutamine synthesis by a monotypic culture of astrocytes, our results suggest that PC also significantly contributes to glutamine synthesis in this context.
TCA Cycle Fluxes and Bcaas Catabolism
The TCA cycle fluxes estimated in this work are in the range of values previously estimated by us using the classic MFA methodology (Teixeira et al., 2008; Amaral et al., 2010). The estimated reduction in 13C enrichment from 41% in pyruvate to 14% in acetyl-CoA corroborates a study by Merle et al. (1996b) in cerebellar astrocytes. These authors justified the label dilution of acetyl-CoA with the consumption of extracellular amino acids and fatty acid degradation (Merle et al., 1996b). Our model considers also the metabolism of BCAA as an additional source of acetyl-CoA and elevated uptake rates (when comparing to the flux obtained for PDH) were measured for these amino acids. Actually, 14% enrichment in glutamate isotopomers produced after one turn of the TCA cycle was observed after incubation of astrocytes with [U-13C]isoleucine (56% enriched in the medium; Johansen et al., 2007) confirming that BCAAs are oxidized to a large extent.
The role of BCAAs as energy fuels is also relevant in vivo. It has been shown that these substrates are oxidized by astrocytes in the rat brain to a significant extent (Dienel and Cruz, 2009). Additional findings indicate that BCAAs also contribute to the “glutamine dilution” phenomenon observed in 13C isotopomer studies (Cruz et al., 2007; Dienel and Cruz, 2009). However, BCAAs taken up by astrocytes can also be metabolized into ketone bodies, which are subsequently released and can eventually be taken up by neurons (Bixel and Hamprecht, 1995). Thus, we cannot exclude a slightly overestimation of the TCA cycle fluxes as well as the fluxes through the reactions bridging glycolysis and TCA cycle. Experimental labeling time-courses of intracellular lactate and/or pyruvate (which were not possible to obtain in the present study) would enable more accurate estimations at this metabolic node.
Glycolytic metabolites reached isotopic steady-state much faster than TCA cycle-related metabolites, which can be due to the large pools of glutamate and aspartate (Table 1). These are linked to the TCA cycle through reversible aminotransferase reactions, delaying the labeling time-courses of TCA cycle metabolites. This is clearly observed in the labeling time-course of the citrate pool, which is faster during the first 30 min of incubation. Then, it becomes slower as it is more dependent on the labeling dynamics of the downstream metabolites and subsequent turns of the TCA cycle. The model could describe this phenomenon quite well. The lower enrichment observed for fumarate, when compared to citrate, can be explained by the funneling of BCAAs from the incubation medium into the TCA cycle at the succinyl-CoA node, which dilutes the labeled fraction of the downstream compounds. On the other hand, the higher enrichment in aspartate and malate compared to that of fumarate is explained by the flux through PC. PC converts pyruvate into oxaloacetate that, subsequently, might exchange 13C label with malate to a significant extent through “back-cycling” in the TCA cycle (Sonnewald et al., 1993; Merle et al., 1996b). Actually, we have evidence that extensive malate to fumarate back-flux occurs in cultured astrocytes (unpublished data). In addition, the MAS activity further explains the isotopomer distribution similarity between malate and aspartate pools.
Malate–Aspartate Shuttle and Glutamate/α-Ketoglutarate Exchange
The link between oxidative glucose metabolism and glutamate labeling is established by an active exchange rate between α-ketoglutarate and glutamate pools (a flux normally represented by Vx), which is, together with the oxaloacetate/aspartate exchange, mediated by the MAS (Gruetter et al., 2003). NADH is produced in glycolysis at the same rate of pyruvate synthesis. In order to maintain the cytosolic redox balance required for the continuous operation of glycolysis it needs to be recycled back to NAD+ (McKenna et al., 2006). Thus, reducing equivalents from NADH are transported into the mitochondrion by the MAS and are oxidized at the same rate that pyruvate enters the TCA cycle (Gruetter et al., 2003). This justifies the role of the MAS in mediating the exchange of label across the mitochondrial membrane (Gruetter et al., 2003). In fact, our results agree with this direct relationship between the pyruvate oxidation rate, i.e., the rate of pyruvate entry in the TCA cycle – PDH + PC (0.21 ± 0.08 μmol mg prot−1 h−1) and the MAS (0.16 ± 0.08 μmol mg prot−1 h−1) flux.
Still, a large debate exists concerning the relative magnitude of the Vx and PDH fluxes in the brain. Whereas some authors provided evidence that Vx and PDH fluxes are in the same range (Gruetter et al., 2001; Choi et al., 2002; Henry et al., 2002), others have proposed that Vx rate should be much higher than PDH (Mason et al., 1992, 1995). A scheme describing all reactions linked to glutamate and α-ketoglutarate pools and their corresponding estimated fluxes can be seen in Figure 3. Our approach allowed distinguishing between these reversible fluxes, taking into account all carbon sources involved in α-ketoglutarate and glutamate metabolism. The present work importantly provides new evidence that Vx is in the range of the TCA cycle fluxes and not several fold higher. It should be highlighted that most of the cited investigations refer to whole brain fluxes whereas this study is focused only on astrocytic metabolic fluxes, although obtained from primary cultures. Nevertheless, Duarte et al. (2011) have recently reported new supporting evidence for this concept, using an improved model allowing to estimate Vx in both the neuronal and glial compartment in the rat brain in vivo. Taken together, these findings support the importance of the present results as reflecting what could be happening in the astrocytic compartment in vivo.
Pyruvate Compartmentation and Malic Enzyme
Different labeling time-courses between extracellular lactate and alanine can be interpreted based on the existence of distinct astrocytic pyruvate pools. Labeling of alanine from glucose was previously observed to be lower than that of lactate in astrocyte cultures (Brand et al., 1992, 1993), which corroborates our results. These observations can additionally explain the poor fitting of the model to alanine experimental 13C time-courses, since the model does not take into account distinct metabolite pools.
The decarboxylation reaction by malic enzyme was also included in the model and its flux represented about 5% of the fluxes leading to pyruvate synthesis. Pyruvate formed via malic enzyme must re-enter the TCA cycle to be completely oxidized. This pathway is called pyruvate recycling and has been described both in vitro (Sonnewald et al., 1996; Bakken et al., 1997; Waagepetersen et al., 2002) and in vivo (Cerdan et al., 1990; Haberg et al., 1998). As discussed by Waagepetersen et al. (2002), this pathway is likely to be more active when cells need to dispose of glutamate and glutamine by oxidative degradation. The preferential release α-ketoglutarate via glutamate from the TCA cycle and subsequent production of glutamine observed in this work thus explains the low contribution of this flux to the total pyruvate production.
Also related to pyruvate synthesis is the degradation of cysteine. There are not many published values for these rates. Beetsch and Olson (1998) reported a rate of [35S]taurine synthesis from [35S]cysteine in cultured rat astrocytes of 1.27 nmol mg prot−1 h−1, which is much lower than that estimated in this work (0.17 μmol mg prot−1 h−1). However, in the same study, the measured activity of the rate-limiting enzyme involved in cysteine degradation into taurine, cysteine dioxygenase, was 144 nmol mg prot−1 h−1, which fits well with the taurine/hypotaurine synthesis rate estimated by our model. These results are also supported by findings from Brand et al. (1998) showing that cultured astrocytes mainly use cysteine for the synthesis of taurine and hypotaurine as observed by 13C-NMR spectroscopy after incubation with [3-13C]cysteine (Brand et al., 1998). Still, Beetsch and Olson (1998) observed that taurine synthesis from extracellular cysteine is also supported by a robust rate of cysteine accumulation, and thus we cannot exclude that this factor might have contributed to the overestimation of the rate, as some of the cysteine taken up could have been accumulated to later yield taurine/hypotaurine. Nevertheless, this would not have an impact on the remaining estimated fluxes.
Final Remarks
This work clearly shows the potential of 13C isotopic transient MFA to provide a reliable metabolic profile of cultured astrocytes in a variety of conditions. Important metabolic fluxes of astrocytes normally not easily accessible were estimated, namely the PPP, PC, PDH, TCA cycle, MAS, and also the α-ketoglutarate/glutamate exchange fluxes. In addition to corroborating in vivo and in vitro findings reported in the literature, this work also sheds new light on the important contribution of non-glucose carbon sources to the global carbon fluxes of astrocytic energy metabolism, even under resting conditions. In summary, 13C isotopic transient MFA allows for the integration of the high amount of metabolomics data being generated and for an increased resolution of estimated fluxes. Due to its flexibility, the structure of the model is easy to adapt to a neuronal metabolic network or even to a co-culture system in which the different cellular compartments can be separated. Depending on the choice of the 13C-labeled substrate(s), this tool will allow the in vitro investigation of relevant aspects of cerebral bioenergetics, including specific metabolic disease hallmarks, which can provide important clues to help understanding in vivo data.
Conflict of Interest Statement
The authors declare that the research was conducted in the absence of any commercial or financial relationships that could be construed as a potential conflict of interest.
Acknowledgments
This work was supported by the Fundação para a Ciência e Tecnologia (FCT), Portugal (project ref. PTDC/BIO/69407/2006). Ana Amaral acknowledges the FCT PhD grant (ref SFRH/BD/29666/2006) and Ana Teixeira acknowledges the MIT Portugal Program. Prof. Rui Oliveira (FCT-UNL, Portugal) is acknowledged for fruitful discussions regarding metabolic modeling issues and the critical reading of the manuscript. The technical assistance by Lars Evje (NTNU, Norway) on GC–MS analyses is gratefully acknowledged.
Footnote
- ^Only carbon stoichiometry is considered since 13C isotopic transient MFA does not require balancing of cofactors or ATP to estimate metabolic fluxes. Abbreviations: Glc, glucose; G6P, glucose-6-phosphate; F6P, fructose-6-phosphate; DHAP, Dihydroxy-acetone phosphate; GAP, glyceraldehyde-3-phosphate; BPG, 1:3-bis-phosphoglycerate; 3PG, 3-phosphoglycerate, 2PG, 2-phosphoglycerate; PEP, phosphoenolpyruvate; PYR, pyruvate; 6PGL, 6-phospho-gluconolactone; 6PG, 6-phosphogluconate; Ru5P, ribulose-5-phosphate; R5P, ribose-5-phosphate; Xu5P, xylulose-5-phosphate; S7P, sedoheptulose-7-phosphate; E4P, erythrose-4-phosphate; Lac, lactate; Glu, glutamate; ACoA, Acetyl-Coenzyme A; Cyst, cystine; Cys, cysteine; Gly, glycine; GSH, glutathione; Ala, alanine; α-KG, α-ketoglutarate; OAAm, oxaloacetate – mitochondrial pool; OAAc, oxaloacetate – cytosolic pool; Cit, Citrate; Aco, cis-aconitate; Isocit, isocitrate; OSuc, oxalosuccinate; SucCoA, succinyl-coenzyme A; Succ, succinate; Fum, fumarate; Mal, malate; Aspm, aspartate – mitochondrial pool; Aspc, aspartate – cytosolic pool; Gln, glutamine; Leu, leucine; Ile, isoleucine; Val, valine; Lys, lysine; ext refers to metabolites taken up from/released to the culture supernatant.
References
Amaral, A. I., Teixeira, A. P., Martens, S., Bernal, V., Sousa, M. F., and Alves, P. M. (2010). Metabolic alterations induced by ischemia in primary cultures of astrocytes: merging (13)C NMR spectroscopy and metabolic flux analysis. J. Neurochem. 113, 735–748.
Amaral, A. I., Teixeira, A. P., Sonnewald, U., and Alves, P. M. (2011). Estimation of intracellular fluxes in cerebellar neurons after hypoglycemia: importance of the pyruvate recycling pathway and glutamine oxidation. J. Neurosci. Res. 89, 700–710.
Bakken, I. J., White, L. R., Aasly, J., Unsgard, G., and Sonnewald, U. (1997). Lactate formation from [U-13C]aspartate in cultured astrocytes: compartmentation of pyruvate metabolism. Neurosci. Lett. 237, 117–120.
Beetsch, J. W., and Olson, J. E. (1998). Taurine synthesis and cysteine metabolism in cultured rat astrocytes: effects of hyperosmotic exposure. Am. J. Physiol. 274, C866–C874.
Ben-Yoseph, O., Boxer, P. A., and Ross, B. D. (1996). Assessment of the role of the glutathione and pentose phosphate pathways in the protection of primary cerebrocortical cultures from oxidative stress. J. Neurochem. 66, 2329–2337.
Biemann, K. (1962). Mass spectrometry. Organic Chemistry Applications, New York, NY: McGraw-Hill Book Co. 223–227.
Bixel, M. G., and Hamprecht, B. (1995). Generation of ketone bodies from leucine by cultured astroglial cells. J. Neurochem. 65, 2450–2461.
Brand, A., Engelmann, J., and Leibfritz, D. (1992). A 13C NMR study on fluxes into the TCA cycle of neuronal and glial tumor cell lines and primary cells. Biochimie 74, 941–948.
Brand, A., Leibfritz, D., Hamprecht, B., and Dringen, R. (1998). Metabolism of cysteine in astroglial cells: synthesis of hypotaurine and taurine. J. Neurochem. 71, 827–832.
Brand, A., Richter-Landsberg, C., and Leibfritz, D. (1993). Multinuclear NMR studies on the energy metabolism of glial and neuronal cells. Dev. Neurosci. 15, 289–298.
Cakir, T., Alsan, S., Saybasili, H., Akin, A., and Ulgen, K. O. (2007). Reconstruction and flux analysis of coupling between metabolic pathways of astrocytes and neurons: application to cerebral hypoxia. Theor. Biol. Med. Model. 4, 48.
Cerdan, S., Kunnecke, B., and Seelig, J. (1990). Cerebral metabolism of [1,2-13C2]acetate as detected by in vivo and in vitro 13C NMR. J. Biol. Chem. 265, 12916–12926.
Choi, I. Y., Lei, H., and Gruetter, R. (2002). Effect of deep pentobarbital anesthesia on neurotransmitter metabolism in vivo: on the correlation of total glucose consumption with glutamatergic action. J. Cereb. Blood Flow Metab. 22, 1343–1351.
Cruz, N. F., Ball, K. K., and Dienel, G. A. (2007). Functional imaging of focal brain activation in conscious rats: impact of [(14)C]glucose metabolite spreading and release. J. Neurosci. Res. 85, 3254–3266.
Dienel, G. A., Ball, K. K., and Cruz, N. F. (2007). A glycogen phosphorylase inhibitor selectively enhances local rates of glucose utilization in brain during sensory stimulation of conscious rats: implications for glycogen turnover. J. Neurochem. 102, 466–478.
Dienel, G. A., and Cruz, N. F. (2009). Exchange-mediated dilution of brain lactate specific activity: implications for the origin of glutamate dilution and the contributions of glutamine dilution and other pathways. J. Neurochem. 109(Suppl. 1), 30–37.
Dringen, R., and Hirrlinger, J. (2003). Glutathione pathways in the brain. Biol. Chem. 384, 505–516.
Duarte, J. M. N., Lanz, B., and Gruetter, R. (2011). Compartmentalized cerebral metabolism of [1,6-13C]glucose determined by in vivo 13C NMR spectroscopy at 14.1 T. Front. Neuroenergetics 3:3. doi: 10.3389/fnene.2011.00003
Dusick, J. R., Glenn, T. C., Lee, W. N., Vespa, P. M., Kelly, D. F., Lee, S. M., Hovda, D. A., and Martin, N. A. (2007). Increased pentose phosphate pathway flux after clinical traumatic brain injury: a [1,2-13C2]glucose labeling study in humans. J. Cereb. Blood Flow Metab. 27, 1593–1602.
Garcia-Espinosa, M. A., Rodrigues, T. B., Sierra, A., Benito, M., Fonseca, C., Gray, H. L., Bartnik, B. L., Garcia-Martin, M. L., Ballesteros, P., and Cerdan, S. (2004). Cerebral glucose metabolism and the glutamine cycle as detected by in vivo and in vitro 13C NMR spectroscopy. Neurochem. Int. 45, 297–303.
Gruetter, R., Adriany, G., Choi, I. Y., Henry, P. G., Lei, H., and Oz, G. (2003). Localized in vivo 13C NMR spectroscopy of the brain. NMR. Biomed. 16, 313–338.
Gruetter, R., Seaquist, E. R., Kim, S., and Ugurbil, K. (1998). Localized in vivo 13C-NMR of glutamate metabolism in the human brain: initial results at 4 tesla. Dev. Neurosci. 20, 380–388.
Gruetter, R., Seaquist, E. R., and Ugurbil, K. (2001). A mathematical model of compartmentalized neurotransmitter metabolism in the human brain. Am. J. Physiol. Endocrinol. Metab. 281, E100–E112.
Haberg, A., Qu, H., Bakken, I. J., Sande, L. M., White, L. R., Haraldseth, O., Unsgard, G., Aasly, J., and Sonnewald, U. (1998). In vitro and ex vivo 13C-NMR spectroscopy studies of pyruvate recycling in brain. Dev. Neurosci. 20, 389–398.
Hassel, B., Sonnewald, U., and Fonnum, F. (1995). Glial-neuronal interactions as studied by cerebral metabolism of [2-13C]acetate and [1-13C]glucose: an ex vivo 13C NMR spectroscopic study. J. Neurochem. 64, 2773–2782.
Henry, P. G., Adriany, G., Deelchand, D., Gruetter, R., Marjanska, M., Oz, G., Seaquist, E. R., Shestov, A., and Ugurbil, K. (2006). In vivo 13C NMR spectroscopy and metabolic modeling in the brain: a practical perspective. Magn. Reson. Imaging 24, 527–539.
Henry, P. G., Lebon, V., Vaufrey, F., Brouillet, E., Hantraye, P., and Bloch, G. (2002). Decreased TCA cycle rate in the rat brain after acute 3-NP treatment measured by in vivo 1H-[13C] NMR spectroscopy. J. Neurochem. 82, 857–866.
Hofmann, U., Maier, K., Niebel, A., Vacun, G., Reuss, M., and Mauch, K. (2008). Identification of metabolic fluxes in hepatic cells from transient 13C-labeling experiments: part I. Experimental observations. Biotechnol. Bioeng. 100, 344–354.
Hyder, F., Patel, A. B., Gjedde, A., Rothman, D. L., Behar, K. L., and Shulman, R. G. (2006). Neuronal-glial glucose oxidation and glutamatergic-GABAergic function. J. Cereb. Blood Flow Metab. 26, 865–877.
Johansen, M. L., Bak, L. K., Schousboe, A., Iversen, P., Sorensen, M., Keiding, S., Vilstrup, H., Gjedde, A., Ott, P., and Waagepetersen, H. S. (2007). The metabolic role of isoleucine in detoxification of ammonia in cultured mouse neurons and astrocytes. Neurochem. Int. 50, 1042–1051.
Jolivet, R., Magistretti, P. J., and Weber, B. (2009). Deciphering neuron-glia compartmentalization in cortical energy metabolism. Front. Neuroenergetics 1:4. doi: 10.3389/neuro.14.004.2009
Kauffman, K. J., Prakash, P., and Edwards, J. S. (2003). Advances in flux balance analysis. Curr. Opin. Biotechnol. 14, 491–496.
Kranich, O., Dringen, R., Sandberg, M., and Hamprecht, B. (1998). Utilization of cysteine and cysteine precursors for the synthesis of glutathione in astroglial cultures: preference for cystine. Glia 22, 11–18.
Lebon, V., Petersen, K. F., Cline, G. W., Shen, J., Mason, G. F., Dufour, S., Behar, K. L., Shulman, G. I., and Rothman, D. L. (2002). Astroglial contribution to brain energy metabolism in humans revealed by 13C nuclear magnetic resonance spectroscopy: elucidation of the dominant pathway for neurotransmitter glutamate repletion and measurement of astrocytic oxidative metabolism. J. Neurosci. 22, 1523–1531.
Lee, K., Berthiaume, F., Stephanopoulos, G. N., and Yarmush, M. L. (1999). Metabolic flux analysis: a powerful tool for monitoring tissue function. Tissue Eng. 5, 347–368.
Lewis, N. E., Schramm, G., Bordbar, A., Schellenberger, J., Andersen, M. P., Cheng, J. K., Patel, N., Yee, A., Lewis, R. A., Eils, R., Konig, R., and Palsson, B. O. (2010). Large-scale in silico modeling of metabolic interactions between cell types in the human brain. Nat. Biotechnol. 28, 1279–1285.
Malloy, C. R., Sherry, A. D., and Jeffrey, F. M. (1988). Evaluation of carbon flux and substrate selection through alternate pathways involving the citric acid cycle of the heart by 13C NMR spectroscopy. J. Biol. Chem. 263, 6964–6971.
Martin, M., Portais, J. C., Labouesse, J., Canioni, P., and Merle, M. (1993). [1-13C]glucose metabolism in rat cerebellar granule cells and astrocytes in primary culture. Evaluation of flux parameters by 13C- and 1H-NMR spectroscopy. Eur. J. Biochem. 217, 617–625.
Mason, G. F., Gruetter, R., Rothman, D. L., Behar, K. L., Shulman, R. G., and Novotny, E. J. (1995). Simultaneous determination of the rates of the TCA cycle, glucose utilization, alpha-ketoglutarate/glutamate exchange, and glutamine synthesis in human brain by NMR. J. Cereb. Blood Flow Metab. 15, 12–25.
Mason, G. F., Rothman, D. L., Behar, K. L., and Shulman, R. G. (1992). NMR determination of the TCA cycle rate and alpha-ketoglutarate/glutamate exchange rate in rat brain. J. Cereb. Blood Flow Metab. 12, 434–447.
Mawhinney, T., Robinett, R., Atalay, A., and Madson, M. (1986). Analysis of amino acids as their tert-butyldimethylsilyl derivatives by gas-liquid chromatography and mass spectrometry. J. Chromatogr. 358, 231–242.
McKenna, M. C., Waagepetersen, H. S., Schousboe, A., and Sonnewald, U. (2006). Neuronal and astrocytic shuttle mechanisms for cytosolic-mitochondrial transfer of reducing equivalents: current evidence and pharmacological tools. Biochem. Pharmacol. 71, 399–407.
Merle, M., Bouzier-Sore, A. K., and Canioni, P. (2002). Time-dependence of the contribution of pyruvate carboxylase versus pyruvate dehydrogenase to rat brain glutamine labelling from [1-(13) C]glucose metabolism. J. Neurochem. 82, 47–57.
Merle, M., Martin, M., Villegier, A., and Canioni, P. (1996a). [1-13C]glucose metabolism in brain cells: isotopomer analysis of glutamine from cerebellar astrocytes and glutamate from granule cells. Dev. Neurosci. 18, 460–468.
Merle, M., Martin, M., Villegier, A., and Canioni, P. (1996b). Mathematical modelling of the citric acid cycle for the analysis of glutamine isotopomers from cerebellar astrocytes incubated with [1(-13)C]glucose. Eur. J. Biochem. 239, 742–751.
Metallo, C. M., Walther, J. L., and Stephanopoulos, G. (2009). Evaluation of 13C isotopic tracers for metabolic flux analysis in mammalian cells. J. Biotechnol. 144, 167–174.
Murin, R., Mohammadi, G., Leibfritz, D., and Hamprecht, B. (2009). Glial metabolism of valine. Neurochem. Res. 34, 1195–1203.
Noh, K., Gronke, K., Luo, B., Takors, R., Oldiges, M., and Wiechert, W. (2007). Metabolic flux analysis at ultra short time scale: isotopically non-stationary 13C labeling experiments. J. Biotechnol. 129, 249–267.
Noh, K., Wahl, A., and Wiechert, W. (2006). Computational tools for isotopically instationary 13C labeling experiments under metabolic steady state conditions. Metab. Eng. 8, 554–577.
Noh, K., and Wiechert, W. (2006). Experimental design principles for isotopically instationary 13C labeling experiments. Biotechnol. Bioeng. 94, 234–251.
O’Connor, E., Devesa, A., Garcia, C., Puertes, I. R., Pellin, A., and Vina, J. R. (1995). Biosynthesis and maintenance of GSH in primary astrocyte cultures: role of L-cystine and ascorbate. Brain Res. 680, 157–163.
Oz, G., Berkich, D. A., Henry, P. G., Xu, Y., LaNoue, K., Hutson, S. M., and Gruetter, R. (2004). Neuroglial metabolism in the awake rat brain: CO2 fixation increases with brain activity. J. Neurosci. 24, 11273–11279.
Patel, A. B., de Graaf, R. A., Mason, G. F., Rothman, D. L., Shulman, R. G., and Behar, K. L. (2005). The contribution of GABA to glutamate/glutamine cycling and energy metabolism in the rat cortex in vivo. Proc. Natl. Acad. Sci. U.S.A. 102, 5588–5593.
Quek, L. E., Dietmair, S., Kromer, J. O., and Nielsen, L. K. (2010). Metabolic flux analysis in mammalian cell culture. Metab. Eng. 12, 161–171.
Richter-Landsberg, C., and Besser, A. (1994). Effects of organotins on rat brain astrocytes in culture. J. Neurochem. 63, 2202–2209.
Schaub, J., Mauch, K., and Reuss, M. (2008). Metabolic flux analysis in Escherichia coli by integrating isotopic dynamic and isotopic stationary 13C labeling data. Biotechnol. Bioeng. 99, 1170–1185.
Shank, R. P., Bennett, G. S., Freytag, S. O., and Campbell, G. L. (1985). Pyruvate carboxylase: an astrocyte-specific enzyme implicated in the replenishment of amino acid neurotransmitter pools. Brain Res. 329, 364–367.
Shen, J., Rothman, D. L., Behar, K. L., and Xu, S. (2009). Determination of the glutamate-glutamine cycling flux using two-compartment dynamic metabolic modeling is sensitive to astroglial dilution. J. Cereb. Blood Flow Metab. 29, 108–118.
Shestov, A. A., Valette, J., Ugurbil, K., and Henry, P. G. (2007). On the reliability of (13)C metabolic modeling with two-compartment neuronal-glial models. J. Neurosci. Res. 85, 3294–3303.
Sickmann, H. M., Schousboe, A., Fosgerau, K., and Waagepetersen, H. S. (2005). Compartmentation of lactate originating from glycogen and glucose in cultured astrocytes. Neurochem. Res. 30, 1295–1304.
Sonnewald, U., Schousboe, A., Qu, H., and Waagepetersen, H. S. (2004). Intracellular metabolic compartmentation assessed by 13C magnetic resonance spectroscopy. Neurochem. Int. 45, 305–310.
Sonnewald, U., Westergaard, N., Hassel, B., Muller, T. B., Unsgard, G., Fonnum, F., Hertz, L., Schousboe, A., and Petersen, S. B. (1993). NMR spectroscopic studies of 13C acetate and 13C glucose metabolism in neocortical astrocytes: evidence for mitochondrial heterogeneity. Dev. Neurosci. 15, 351–358.
Sonnewald, U., Westergaard, N., Jones, P., Taylor, A., Bachelard, H. S., and Schousboe, A. (1996). Metabolism of [U-13C5] glutamine in cultured astrocytes studied by NMR spectroscopy: first evidence of astrocytic pyruvate recycling. J. Neurochem. 67, 2566–2572.
Teixeira, A. P., Santos, S. S., Carinhas, N., Oliveira, R., and Alves, P. M. (2008). Combining metabolic flux analysis tools and (13)C NMR to estimate intracellular fluxes of cultured astrocytes. Neurochem. Int. 52, 478–486.
Varma, A., and Palsson, B. O. (1994). Stoichiometric flux balance models quantitatively predict growth and metabolic by-product secretion in wild-type Escherichia coli W3110. Appl. Environ. Microbiol. 60, 3724–3731.
Waagepetersen, H. S., Qu, H., Hertz, L., Sonnewald, U., and Schousboe, A. (2002). Demonstration of pyruvate recycling in primary cultures of neocortical astrocytes but not in neurons. Neurochem. Res. 27, 1431–1437.
Waagepetersen, H. S., Sonnewald, U., Larsson, O. M., and Schousboe, A. (2001). Multiple compartments with different metabolic characteristics are involved in biosynthesis of intracellular and released glutamine and citrate in astrocytes. Glia 35, 246–252.
Waagepetersen, H. S., Sonnewald, U., and Schousboe, A. (2003). Compartmentation of glutamine, glutamate, and GABA metabolism in neurons and astrocytes: functional implications. Neuroscientist 9, 398–403.
Weljie, A. M., Newton, J., Mercier, P., Carlson, E., and Slupsky, C. M. (2006). Targeted profiling: quantitative analysis of 1H NMR metabolomics data. Anal. Chem. 78, 4430–4442.
Westergaard, N., Sonnewald, U., Unsgard, G., Peng, L., Hertz, L., and Schousboe, A. (1994). Uptake, release, and metabolism of citrate in neurons and astrocytes in primary cultures. J. Neurochem. 62, 1727–1733.
Wiechert, W., and de Graaf, A. A. (1997). Bidirectional reaction steps in metabolic networks: I. Modeling and simulation of carbon isotope labeling experiments. Biotechnol. Bioeng. 55, 101–117.
Wiechert, W., and Noh, K. (2005). From stationary to instationary metabolic flux analysis. Adv. Biochem. Eng. Biotechnol. 92, 145–172.
Yudkoff, M., Daikhin, Y., Grunstein, L., Nissim, I., Stern, J., and Pleasure, D. (1996). Astrocyte leucine metabolism: significance of branched-chain amino acid transamination. J. Neurochem. 66, 378–385.
Zwingmann, C., and Leibfritz, D. (2003). Regulation of glial metabolism studied by 13C-NMR. NMR Biomed. 16, 370–399.
Appendix
Stoichiometric matrix (metabolic reactions) of the model describing astrocytic metabolism1
Glycolysis
1. Glc → G6P
2. G6P → F6P
3. F6P → FBP
4. F6P → 2 GAP
5. GAP → BPG
6. BPG → 3PG
7. 3PG → 2PG
8. 2PG → PEP
9. PEP → Pyr
10. Pyr + Glu → Ala + α-KG
11. Pyr → Lac
Pentose phosphate pathway
12. G6P → 6PGL
13. 6PGL → 6PG
14. 6PG → Ru5P + CO2
15. Ru5P → R5P
16. Ru5P → Xu5P
17. R5P + Xu5P → GAP + S7P
18. GAP + S7P → F6P + E4P
19. Xu5P + E4P → GAP + F6P
TCA cycle and related reactions
21. Pyr + CO2 → OAAm
22. Pyr + CoA → ACoA + CO2
23. OAAm + ACoA → Cit + CoA
24. Cit → Aco
25. Aco → Isocit
26. Isocit → OSuc
27. OSuc → α-KG + CO2
28. α-KG + CoA → SuCoA + CO2
29. SuCoA → Succ + CoA
30. Succ → Fum
31. Fum → Mal
32. Mal → Pyr + CO2
33. Mal → OAAm
34a. OAAm → Aspm
34b. Aspm + Glu → Aspc + α-KG
34c. ASpc + α-KG → OAAc + Glu
34d. OAAc → Mal
35a. α-KG → Glu
35b. Glu → α-KG
Amino acids metabolism
36a. Glu → Gln
36b. Gln → Glu
37. Glu + Cys + Gly → GSH
38. Cys → Taur + Hyptaur
39. Ile + α-KG + 2 CoA → SuCoA + ACoA + Glu
40. Leu + α-KG + 2 CoA → 2 ACoA + Glu + CO2
41. Val + α-KG + CoA → SuCoA + Glu + CO2
20. Cys → Pyr
Transport reactions from cell supernatant
Glcext → Glc
Ala → Alaext
Lac → Lacext
Cit → Citext
Cystext → 2 Cys
Gln → Glnext
Ileext → Ile
Leuext → Leu
Valext → Val
Mass isotopomer balances of metabolites represented in the metabolic network (figure 1)
Keywords: metabolic fluxes, intracellular pools, 13C-labeling time-courses, [1-13C]glucose, mass spectrometry
Citation: Amaral AI, Teixeira AP, Håkonsen BI, Sonnewald U and Alves PM (2011) A comprehensive metabolic profile of cultured astrocytes using isotopic transient metabolic flux analysis and 13C-labeled glucose. Front. Neuroenerg. 3:5. doi: 10.3389/fnene.2011.00005
Received: 04 November 2010; Accepted: 04 August 2011;
Published online: 07 September 2011.
Edited by:
Albert Gjedde, Arhus University Hospital, DenmarkReviewed by:
Renaud Jolivet, University College London, UKBjørn Quistorff, University of Copenhagen, Denmark
Copyright: © 2011 Amaral, Teixeira, Håkonsen, Sonnewald and Alves. This is an open-access article subject to a non-exclusive license between the authors and Frontiers Media SA, which permits use, distribution and reproduction in other forums, provided the original authors and source are credited and other Frontiers conditions are complied with.
*Correspondence: Paula Marques Alves, Instituto de Biologia Experimental e Tecnológica, Apartado 12, 2781-901 Oeiras, Portugal. e-mail: marques@itqb.unl.pt