Long-term asynchronous decoding of arm motion using electrocorticographic signals in monkeys
- Laboratory for Adaptive Intelligence, RIKEN Brain Science Institute, Saitama, Japan
Brain–machine interfaces (BMIs) employ the electrical activity generated by cortical neurons directly for controlling external devices and have been conceived as a means for restoring human cognitive or sensory-motor functions. The dominant approach in BMI research has been to decode motor variables based on single-unit activity (SUA). Unfortunately, this approach suffers from poor long-term stability and daily recalibration is normally required to maintain reliable performance. A possible alternative is BMIs based on electrocorticograms (ECoGs), which measure population activity and may provide more durable and stable recording. However, the level of long-term stability that ECoG-based decoding can offer remains unclear. Here we propose a novel ECoG-based decoding paradigm and show that we have successfully decoded hand positions and arm joint angles during an asynchronous food-reaching task in monkeys when explicit cues prompting the onset of movement were not required. Performance using our ECoG-based decoder was comparable to existing SUA-based systems while evincing far superior stability and durability. In addition, the same decoder could be used for months without any drift in accuracy or recalibration. These results were achieved by incorporating the spatio-spectro-temporal integration of activity across multiple cortical areas to compensate for the lower fidelity of ECoG signals. These results show the feasibility of high-performance, chronic and versatile ECoG-based neuroprosthetic devices for real-life applications. This new method provides a stable platform for investigating cortical correlates for understanding motor control, sensory perception, and high-level cognitive processes.
Introduction
Recent scientific and technological advances have accelerated the development of brain–machine interfaces (BMIs), particularly as a means for assisting or repairing human cognitive or sensory-motor functions (Donoghue, 2002 ; Mussa-Ivaldi and Miller, 2003 ; Nicolelis, 2003 ; Lebedev and Nicolelis, 2006 ; Patil and Turner, 2008 ). However, there are still many serious concerns about the stability, durability, and maintenance that significantly diminish their real-life applicability (Kipke et al., 2008 ; Hatsopoulos and Donoghue, 2009 ; Stieglitz et al., 2009 ). Noninvasive BMIs mainly exploit electroencephalograms (EEGs) to control computer cursors or other simple devices, but such systems may ultimately be limited in their capabilities and also usually require extensive training. Invasive BMIs, which use primarily single-unit activity (SUA) and local field potentials (LFPs), can acquire the highest brain signal fidelity for fine-grained control. However, this method suffers from poor long-term stability, where daily recalibration is normally required to maintain reliable performance because of deterioration in signal quality or variability in recorded neuronal ensembles (Chestek et al., 2007 ). One possible alternative that could reduce these concerns is semi-invasive BMIs based on electrocorticograms (ECoGs) using subdural electrodes. Compared with the EEG, the ECoG has higher spatial resolution, broader bandwidth, higher amplitude, and less sensitivity to artifacts such as electromyographic (EMG) signals (Freeman et al., 2003 ; Schwartz et al., 2006 ). In contrast to SUA, ECoG measures population activity, which might offer a better prospect for long-term recording stability. Furthermore, since ECoG recording does not penetrate the cortex, signal-prohibitive encapsulation, an obstacle in chronic SUA recording, is less likely to occur during long-term implantation (Szarowski et al., 2003 ; Vetter et al., 2004 ; Bjornsson et al., 2006 ).
ECoG signals have been used to decode a limited set of discrete hand movements (Levine et al., 2000 ; Leuthardt et al., 2004 ; Mehring et al., 2004 ; Ball et al., 2009 ) and continuous movements, such as hand-controlled cursor movements for periodic circular motion (Schalk et al., 2007 ) and target reaching (Pistohl et al., 2008 ; Sanchez et al., 2008 ), flexion of fingers (Kubánek et al., 2009 ), and upper limb movements (Chin et al., 2007 ). The applicability of online ECoG-based BMIs has also been demonstrated (Leuthardt et al., 2004 ; Leuthardt et al., 2006 ; Schalk et al., 2008 ). However, little is known about the level of long-term stability that ECoG-based decoding can offer, even though chronic implantation of ECoG electrodes has been conducted previously in animals and humans (Loeb et al., 1977 ; Bullara et al., 1979 ; Yuen et al., 1987 ; Pilcher and Rusyniak, 1993 ; Margalit et al., 2003 ). Moreover, only few ECoG studies attempted decoding intended motion during asynchronous tasks (Schalk et al., 2007 ; Pistohl et al., 2008 ), where no explicit cues were provided to initiate movement, which could enable more naturalistic control in BMI applications. Here, we simultaneously recorded multiple motor parameters for high degree-of-freedom (DOF) arm motion and ECoG signals from multiple cortical areas during an asynchronous food-reaching task in monkeys, and we demonstrated successfully that ECoG carried sufficient information for predicting continuous high-DOF arm motion with performance similar to that of SUA-based decoding systems (Wessberg et al., 2000 ; Carmena et al., 2003 ; Lebedev et al., 2008 ). We also compared decoding performance over months and showed that a single decoding model could be used for months without recalibrating or sacrificing predictive accuracy. The observed high accuracy and long-term stability show the advantages of ECoG-based decoding in implementing chronic neuroprosthetic devices for real-life applications.
Materials and Methods
Subjects and Materials
Customized multichannel ECoG electrode arrays (Unique Medical, Japan) containing 2.1 mm diameter platinum electrodes (1 mm diameter exposed from a silicone sheet) with an inter-electrode distances of 3.5 mm were chronically implanted in the subdural space in two Japanese macaques (monkeys A and K) (Figure 1 A). Thirty-two electrodes were implanted in the right hemisphere, covering from the prefrontal cortex (PFC) to the primary somatosensory cortex in monkey A, and 64 electrodes were implanted in the left hemisphere, covering from the PFC to the parietal cortex in monkey K. The reference electrode was also placed in the subdural space, and the ground electrode was placed in the epidural space. Electrical cables leading from the ECoG electrodes were connected to Omnetics connectors affixed to the skull with an adaptor and titanium screws. Monkey A had two implants that covered almost the same cortical area during the study. The initial implant had been working well, but the monkey damaged the connectors a few weeks after the first implantation, and we implanted the ECoG array again. Monkey A’s data in this study were collected from the second implant (see details in Supplementary Methods in Supplementary Material).
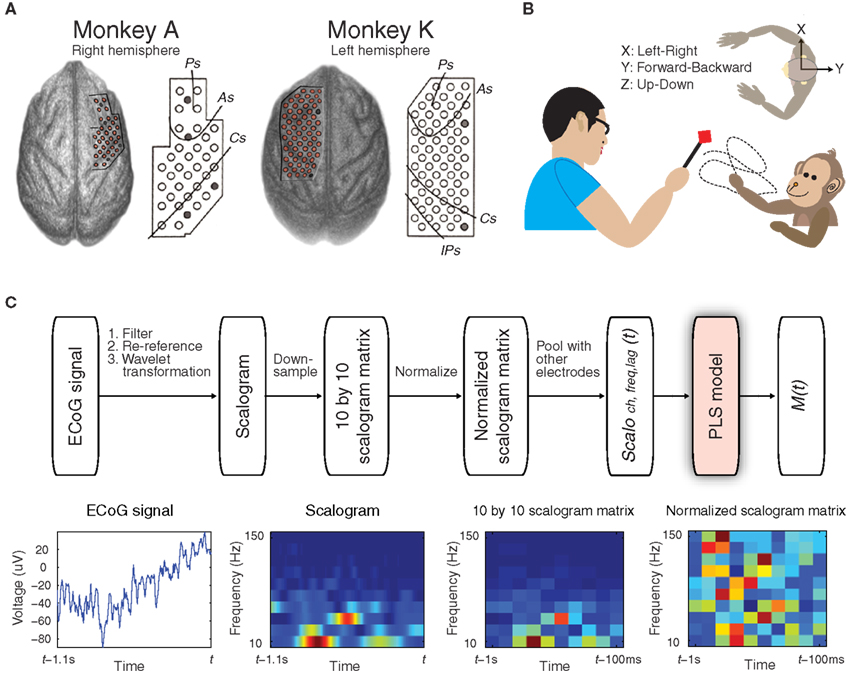
Figure 1. Experimental design and decoding performance to detect 3D hand positions. (A) Locations of the 32 electrodes in monkey A and the 64 electrodes in monkey K, which were identified by computed tomography (CT) and magnetic resonance imaging (MRI). Reference electrodes are shown as gray circles. (B) In the asynchronous food-reaching task, each monkey was trained to reach for food offered by the experimenter in 3D space without explicit cues. The body-centered coordinates for measuring 3D hand positions from the top-down viewpoint are shown. (C) Schematic diagram depicting the prediction of a motor parameter M(t) from simultaneously recorded ECoG signals. Examples of 1.1 s of raw ECoG signal from one electrode, the corresponding scalogram, down-sampled scalogram matrix, and normalized scalogram matrix are shown (bottom row).
Electrophysiological and Behavioral Recordings
For monkey A, 13 experiments were performed with a Neuralynx Digital Lynx data acquisition system (Neuralynx, USA) during the initial 3-month period (corresponding data are denoted as A-DL), followed by 10 experiments with a Neuralynx Digital Falcon telemetry data acquisition system during the following 5-month period (A-DF). For monkey K, 12 experiments were performed with a Cyberkinetics data acquisition system (Cyberkinetics Neurotechnology Systems, USA) for 2 months (K-C). ECoG signals were recorded at a sampling rate of 1 kHz per channel. The monkeys’ movements were captured at a sampling rate of 120 Hz by an optical motion capture system (Vicon Motion Systems, USA). For all experiments (n = 23 for monkey A and n = 12 for monkey K), each monkey wore a custom-made jacket with reflective markers for motion capture affixed to the left and right shoulders, elbows, and wrists. Each monkey’s head was restrained by a custom-made helmet that fit perfectly and held the head in place. For some experiments (n = 5 for A-DF and n = 4 for K-C), five additional markers were placed on the reaching hand to determine the arm joint angles (see below). All experimental and surgical procedures were performed in accordance with protocols approved by the RIKEN ethics committee.
Experimental Procedure
In each experiment, the monkey was seated in a primate chair facing the experimenter with head movement restricted. Each monkey was trained to retrieve food (reaching duration ranged from 0.83 to 8.57 s in all experiments) fed by the experimenter 4.6 ± 1.5 times/min (mean ± SD, n = 35 experiments, two monkeys) in 3D space using the hand contralateral to the implanted hemisphere while the monkey’s movement was captured by an optical motion capture system (Figure 1 B, also see Movie S1 in Supplementary Material). The length of each experiment was 15 min: the first 10 min of data were used for training the decoding model (training data) and the last 5 min of data were used for validation (validation data).
Decoding Paradigm and Data Analysis
Signal Preprocessing
ECoG signals of 1 kHz were band-pass filtered from 0.1 to 600 Hz, and re-referenced using a common average reference (CAR) montage (see Figure 1 C). Motion marker locations were down-sampled to 20 Hz because the position data, which contained the characteristics of the reaching motion, showed only negligible variance in the spectra above 15 Hz. Body-centered 3D hand trajectories (X: left–right, Y: forward–backward, Z: up–down) were calculated by referencing the wrist position of the reaching hand with the sagittal plane (Soechting and Flanders, 1992 ) (Figure 1 B). Arm motion was determined by transforming the eight markers into 7-DOF joint angles (shoulder adduction, shoulder internal rotation, shoulder flexion, elbow flexion, pronation, wrist flexion, and wrist abduction) based on a 3D-7DOF computational model for primates (Chan and Moran, 2006 ). The time course of each motor parameter was then normalized, to produce a standard z-score by subtracting its mean and then dividing by its standard deviation.
Wavelet transformation
Time–frequency representation, or the scalogram, of the ECoG signals for each electrode was generated by Morlet wavelet transformation at 10 different center frequencies (10–150 Hz, arranged in a logarithmic scale) with the half-length of the Morlet analyzing wavelet set at the coarsest scale of seven samples (see schematics of decoding paradigm in Figure 1 C). The scalogram of time t was calculated from the ECoG signals from t − 1.1 s to t. The scalogram was then resampled at 10 time lags (t − 100 ms, t − 200 ms,…,and t − 1 s) to form a 10 × 10 scalogram matrix of time t. Considering edge effects in the scalogram calculation, ECoG signals from 100 ms before t − 1 s to 100 ms after t − 100 ms were used to avoid distorted data at time lags t − 1 s and t − 100 ms. The 10 × 10 scalogram matrix of time t was then normalized by calculating the standard z-score at each frequency bin; thus, the same scale was shared across different frequency bins.
Partial least squares regression
To predict a normalized motor parameter at time t, M(t), the normalized scalogram matrices from all electrodes, were pooled to form a high-dimensional predictor vector, Scaloch,freq,lag(t), which described the spatio-spectro-temporal information of the signals during the previous 1 s at each electrode ch, frequency bin freq, and time lag lag. The number of variables in the predictor vector for monkey A was 3200 (32 electrodes, 10 frequency bins, and 10 time lags), and for monkey K was 6400. The goal of decoding was to estimate a set of weights {a0, ach,freq,lag} so M(t) could be modeled as their linear combination with Scaloch,freq,lag(t):

where a0 is the intercept, ach,freq,lag is the weight for the scalogram component at electrode ch, frequency freq, and time lag lag, and ε(t) is the residual error. Because of the high dimensionality of Scaloch,freq,lag(t) and the high correlations between scalogram components, multivariate partial least squares (PLS) regression was used to estimate the lower dimensional latent structures to avoid over-fitting (Wold et al., 1984 ). The PLS decoding model was calculated from the training data, where 10-fold cross validation was performed and the optimal number of PLS components was determined by the minimal predictive error sum of squares (PRESS): the sum of the squared differences between predicted and observed values (Allen, 1974 ; Geladi and Kowalski, 1986 ). R2 values (explained variance), the ratio of variances of predicted and observed values, were also calculated for comparison.
Spatial and temporal shuffling
To ensure that the decoding performance was achieved by utilizing unique spatio-temporal structures in the brain signals, instead of any systematic bias, a shuffling analysis was performed after each decoding model was acquired. For each experiment, 20 surrogate validation data sets were generated (10 with spatial shuffling and 10 with temporal shuffling), and the decoding model obtained previously from the training data was used to make prediction on these surrogate validation data. In spatial shuffling, the electrode order of validation data was randomly shuffled, while the sample order remained unchanged. In temporal shuffling, the sample order of validation data was randomly shuffled, while the electrode order remained unchanged.
Spatio-spectro-temporal contributions
To quantify the spatio-spectro-temporal contributions of brain activity for predicting each motor parameter, three different quantities were calculated from the weights {ach,freq,lag} of each decoding model:
where |·| represents the absolute value, Ws(ch) quantifies the percentage spatial contribution of each recording electrode ch for predicting across all frequency bins and time lags, Wf(freq) quantifies the percentage spectral contribution of each frequency bin freq across all recording electrodes and time lags, and Wt(lag) quantifies the percentage temporal contribution of each time lag lag across all electrodes and frequency bins.
Results
Asynchronous Decoding of 3D Hand Positions with Accuracy Similar to that of Existing Decoders
We successfully decoded 3D hand trajectories, where the correlation coefficients (r) between observed and predicted trajectories were 0.71 ± 0.11, 0.71 ± 0.13, and 0.75 ± 0.08 (mean ± SD, 5-min validation data, n = 35 experiments, two monkeys) for X-, Y-, and Z-positions, respectively (Figure 2 A). This accuracy is similar to that produced by predicting 3D hand trajectories using SUA in primates (Wessberg et al., 2000 ; Carmena et al., 2003 ; Lebedev et al., 2008 ). One representative example of 5 min of prediction of 3D hand positions is shown in Figure 2 A, where still positions, movement onsets, and different reaching trajectories were predicted (also see Movie S1 in Supplementary Material). After spatial shuffling, the correlation coefficients between observed and predicted trajectories decreased to 0.08 ± 0.11, 0.06 ± 0.12, and 0.11 ± 0.10 (n = 350 spatially- shuffled data, two monkeys) for X-, Y-, and Z-positions, respectively. After temporal shuffling, the correlation coefficients decreased to −0.01 ± 0.09, −0.02 ± 0.10, and 0.03 ± 0.10 (n = 350 temporally- shuffled data) for X-, Y-, and Z-positions, respectively. The predictive accuracies from the surrogate validation data were significantly lower than those from the original validation data (p < 1e − 6, for both spatially- and temporally-shuffled data in all X-, Y-, and Z-positions, Wilcoxon rank-sum test), which indicates that spatio-temporal structures in the brain signals played an essential role in our decoding.
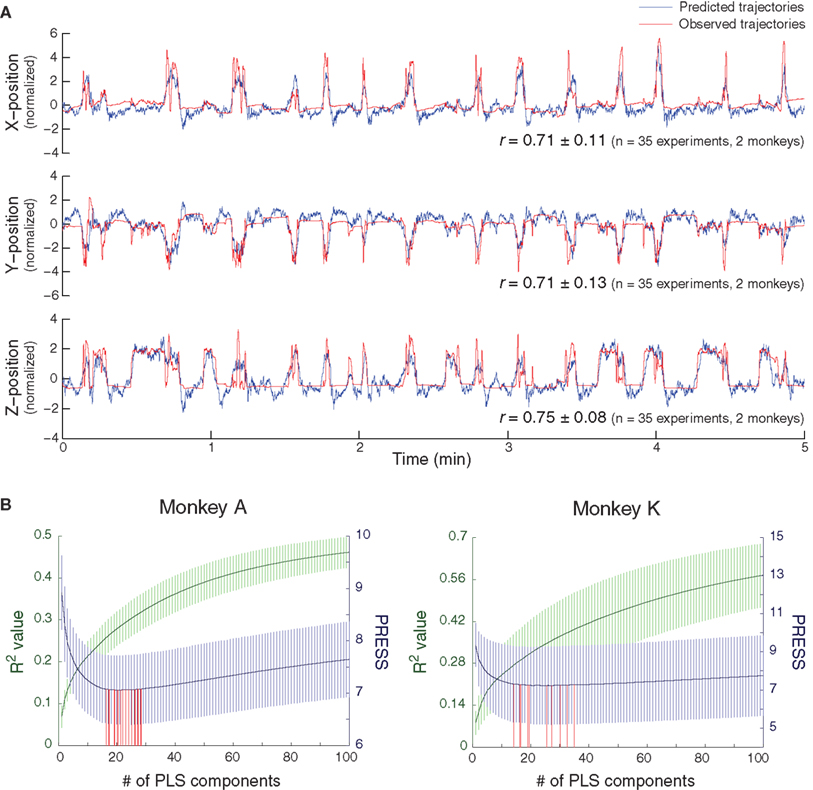
Figure 2. Asynchronous decoding of 3D hand position by PLS regression. (A) Representative example of prediction of X-, Y-, and Z-positions of hand movements during a 5-min validation session. The average correlation coefficients (r) between the predicted (blue) and observed (red) trajectories for all positions are shown. (B) Determination of the optimal numbers of PLS components for the decoding models. R2 values (green, mean ± SD) and PRESS (blue) for the decoding models with different numbers of PLS components in two monkeys. For each experiment, the number of PLS components for the optimal decoding model was determined as that with the minimal PRESS (red).
The optimal numbers of PLS components, or latent factors, for decoding the models were 21.6 ± 4.0 (R2 = 0.29 ± 0.04, 10-fold cross validation) and 22.7 ± 7.3 (R2 = 0.32 ± 0.11) for monkeys A (n = 23 experiments) and K (n = 12 experiments), respectively (Figure 2 B). These numbers were significantly lower than the total number of variables included (3200 for monkey A and 6400 for monkey K). In addition, even though the total number of variables included for monkey K was double that for monkey A, the optimal numbers of PLS components used did not differ significantly between monkeys (p = 0.15, Wilcoxon rank-sum test). This indicates that a small portion of the information carried in ECoG signals, representing the latent structure independent of the original data’s dimensionality, was sufficient for obtaining an accurate prediction. Examples of the unique structures of these latent factors are shown in Figure S1 in Supplementary Material.
Durable and Stable Decoder Usable for Months Without any Drift in Accuracy or Recalibration
Using the decoding model constructed just before the validation data (same-day prediction), we acquired high predictive accuracies that showed no significant decrease over months (about 2 months for A-DL, 5 months for A-DF, and 2 months for K-C) (Figure 3 A). Fitting the correlation coefficients versus recording days with 1-degree polynomials (slopes ranged between −0.08 and 0.02/month) revealed no significant monotonic decrease in predictive accuracy (p > 0.25, |ρ| < 0.36, Spearman rank correlation test). This demonstrated the long-term stability of the signal quality and the durability of the recording system.
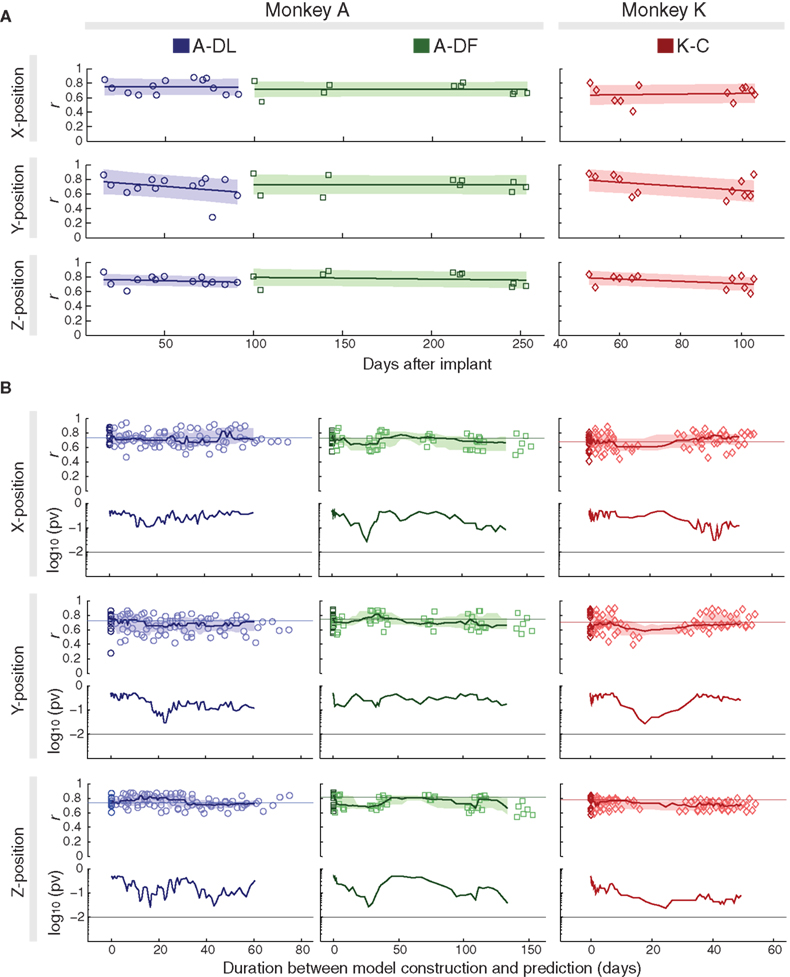
Figure 3. Long-term stability of decoding performance for same-day and cross-day predictions. (A) Correlation coefficients (r) of same-day prediction after implantation, shown with fitted 1-degree polynomials (lines) and error bounds that contain at least 50% of the predictions (shaded). (B) Upper panels: correlation coefficients of cross-day prediction with duration between the model construction and prediction (light-color symbols), shown with medians of N consecutive data points (N = 13, 10, and 12 for A-DL, A-DF, and K-C, respectively, see text) (lines) and lower/upper quartiles (shaded) versus medians of corresponding durations. Results of same-day predictions are also shown at duration = 0 days (dark-color symbols), with their medians shown as horizontal lines. Lower panels: p-values (pv) for comparisons of every N consecutive cross-day data points with N same-day predictions. The threshold of 0.01 is shown as a horizontal line.
Next, we asked if the decoding model would produce similar predictive accuracy with the data recorded days later (cross-day prediction). The decoding model constructed from training data of each experiment was used to predict all validation data in subsequent experiments, and the predictive accuracies were evaluated as a function of duration between the model construction and prediction (upper panels for each position in Figure 3 B). For each block of data collection with N experiments (N = 13, 10, and 12 for A-DL, A-DF, and K-C, respectively), the accuracies of every N cross-day prediction with closest durations (which could be different models predicting the same validation data or the same model predicting different validation data) were compared with the accuracies of the N same-day predictions (shown as darker symbols at the duration of zero days), and the significance of their sharing the same median was evaluated (lower panels for each position in Figure 3 B). The accuracies from any N cross-day predictions and the corresponding N same-day predictions did not differ significantly (p > 0.01, Wilcoxon rank-sum test). This indicates that the decoding model could be used to predict hand position from the data collected months later without compromising the accuracy.
The long-term stability of the predictive accuracy suggests constancy in decoding models, which was supported by the high correlations found between the weights of the decoding models constructed from different days. For A-DL, the correlation coefficients between the weights from all pairs of decoding models were 0.52 ± 0.12, 0.50 ± 0.11, and 0.52 ± 0.11 (n = 78 pairs from 13 experiments) for X-, Y-, Z-positions, respectively. Those for A-DF were 0.52 ± 0.19, 0.57 ± 0.19, and 0.60 ± 0.16 (n = 45 pairs from 10 experiments), and for K-C were 0.43 ± 0.11, 0.47 ± 0.13, and 0.65 ± 0.11 (n = 66 pairs from 12 experiments).
Spatio-Spectro-Temporal Integration of Activity Across Multiple Cortical Areas
We hypothesized that high predictive accuracy of the data acquired from ECoG, even without signal resolution of single units, could be produced by incorporating additional information that is usually lacking in SUA-based decoding: the spatio-temporal integration of activity not only at few local cortical regions, but across multiple regions with more continuous coverage over a wide area. We investigated further how our decoding models used the spatial, spectral, and temporal contents of the ECoG data. For monkey A, spatial contributions, Ws(ch), were significantly greater than their median (p < 0.01, Wilcoxon signed-rank test, thick circles in Figure 4 A) in the dorsal premotor cortex (PMd) for the X- and Y-positions and in the ventral premotor cortex (PMv) for the Z-positions. For monkey K, significant spatial contributions were found in the PMd for the X- and Y-positions and in the primary motor cortex for the Z-positions (Figure 4 A). Spectral contributions, Wf(freq), significantly greater than their median (p < 0.01, Wilcoxon signed-rank test, asterisks in Figure 4 B) were between 40 and 90 Hz (high-γ band) for all positions. Temporal contributions, Wt(lag), significantly greater than their median (p < 0.01, Wilcoxon signed-rank test, asterisks in Figure 4 C) were found within 500 ms before the predicted instant.
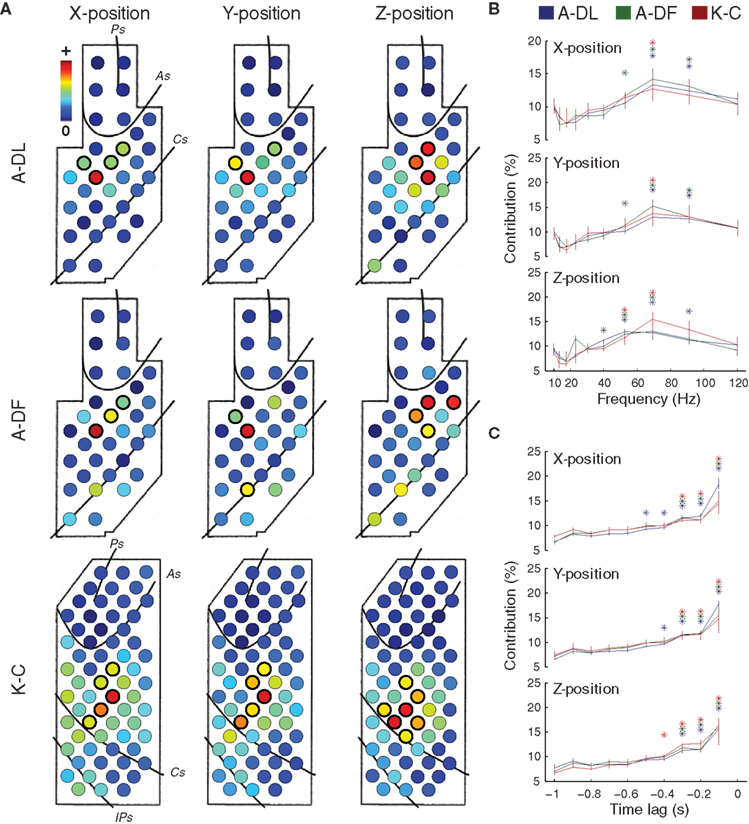
Figure 4. Characteristics of the decoding models for 3D hand positions. (A) Spatial contributions of different electrodes, Ws(ch), for 3D hand positions. Median Ws(ch) across decoding models obtained from different experiments are shown (n = 13, 10, and 12 for A-DL, A-DF, and K-C, respectively). For each position, the electrodes with contributions significantly greater than their median (p < 0.01) are circled by thicker lines. (B) Spectral contributions of different frequency bins, Wf(freq), for 3D hand positions. For each position, the frequency bins with contributions significantly greater than their median (p < 0.01) are marked with asterisks. (C) Temporal contributions of different time lags, Wt(lag), for 3D hand positions. For each position, the time lags with contributions significantly greater than their median (p < 0.01) are marked with asterisks.
To examine the differences between decoding models for X-, Y-, and Z-positions, the correlations between the weights of the decoding models for different positions were evaluated (see the weights of decoding models in Figure S2 in Supplementary Material). Significant correlations were found between the decoding models for X- and Y-positions in A-DL (p < 0.01, n = 169 model pairs from 13 experiments, Pearson’s linear correlation), A-DF (p < 0.01, n = 100 model pairs from 10 experiments), and K-C (p < 0.05, n = 144 model pairs from 12 experiments). However, no significant correlations were found between X- and Z-positions (p = 0.19 for A-DL, 0.22 for A-DF, and 0.51 for K-C) and between Y- and Z-positions (p = 0.17 for A-DL, 0.35 for A-DF, and 0.38 for K-C). This indicates that the different spatio-temporal integrations of cortical activity were engaged in controlling hand trajectory in the Z-direction (vertical) and in the X–Y plane (horizontal).
Decoding of Joint Angles for High-DOF Arm Motion
To demonstrate that ECoG signals carry rich information about multidimensional motor control, we investigated whether we could decode arm orientations, calculated by a computational model that transformed the motion-capture markers’ positions into 7-DOF joint angles (Chan and Moran, 2006 ). High predictive accuracies were obtained (average r for each joint angle ranged from 0.62 to 0.78 for two monkeys, Figure 5 A). The optimal numbers of PLS components for the decoding model were 49.2 ± 8.0 (R2 = 0.68 ± 0.03, 10-fold cross-validation) for A-DF (n = 5 experiments) and 49.8 ± 9.3 (R2 = 0.69 ± 0.03) for K-C (n = 4 experiments) (Figure 5 B). The optimal numbers of PLS components used did not differ significantly (p = 0.94, Wilcoxon rank-sum test). Different cortical areas contributed to different joint movements (Figure 5 C).
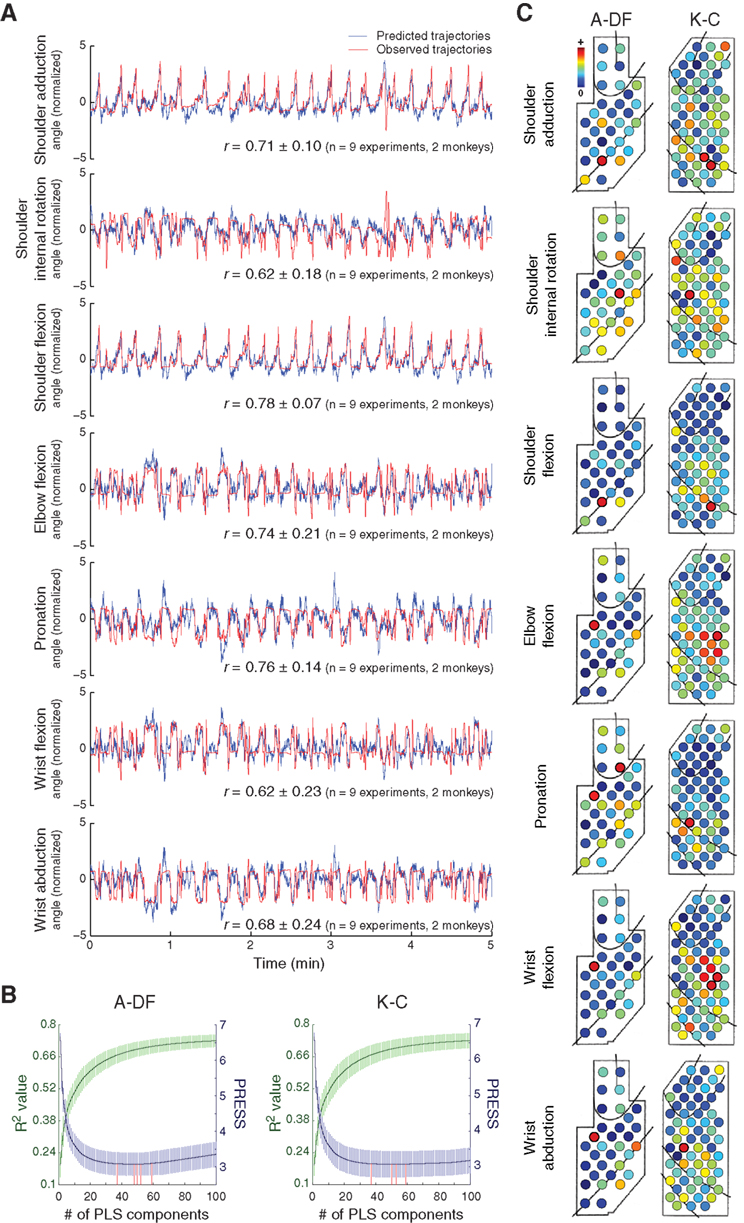
Figure 5. Decoding of 7-DOF arm motion. (A) One representative example of prediction of 7-DOF joint angles of arm orientations during a 5-min validation session are shown with the average correlation coefficients (r) between predicted (blue) and observed (red) trajectories. (B) Determination of the optimal numbers of PLS components for the decoding models (representation as in Figure 2 B). (C) Spatial contributions of different electrodes for 7-DOF joint angles (representation as in Figure 4 A).
To examine the differences between decoding models for 7-DOF joint angles and the decoding models for 3D hand positions, the correlations between the weights of the decoding models for each joint angle and each hand position were evaluated. For K-C, none of the 21 pairs (seven joint angles, three hand positions) correlated significantly (p > 0.21, n = 48 model pairs, 12 models for each hand position and 4 models for each joint angle, Pearson’s linear correlation). For A-DF, only the correlations between elbow flexion and the Y-position and between wrist flexion and the Y-position were significant (p < 0.01, n = 50 model pairs, 10 models for each hand position and 5 models for each joint angle), and none of the other 19 pairs correlated significantly (p > 0.13). This indicates that the different spatio-temporal integrations of cortical activity were engaged in controlling different motor parameters and suggests further that there is an advantage in exploiting the larger scale spatio-temporal integration of different neuronal ensembles to enhance decoding performance.
Discussion
We successfully demonstrated the long-term asynchronous decoding of high-DOF arm kinematics in monkeys using ECoG signals. Without explicit cues for instructing the subjects to start or stop their actions, we successfully predicted 3D hand trajectories and 7-DOF arm joint angles with accuracy similar to that of existing SUA-based decoders (Wessberg et al., 2000 ; Carmena et al., 2003 ; Lebedev et al., 2008 ). Our ECoG-based decoder incorporated spatio-spectro-temporal integrations of activity across multiple cortical areas and could be used for several months without any drift in accuracy or recalibration.
Integration of Activity Across Multiple Cortical Areas
For decoding, each motor parameter at each point in time was modeled as a linear combination of spatio-spectro-temporal components of the ECoG signals during the previous 1 s. The decoding model was estimated by multivariate PLS regression, where the lower dimensional latent factors, each representing an axis in the predictor variable space, were first identified. About 20 and 50 latent factors were obtained for optimal decoding of 3D hand positions (Figure 2 B) and 7-DOF joint angles (Figure 5 B), respectively, and these were independent of the subject and the original data’s dimensionality. This suggests that these latent factors characterize the possible dynamic bases for the control of arm motion (Figure S1 in Supplementary Material). However, further analyses of latent factors across different experiments and different subjects are required for clarification.
In the final decoding model, the significant contributions from neurons in the premotor and motor cortices for decoding hand movement were consistent with previous findings (Wessberg et al., 2000 ; Carmena et al., 2003 ; Lebedev et al., 2008 ). Figure 4 further demonstrated that different spatio-spectro-temporal contributions were employed in decoding models for predicting hand movement in the Z-direction (vertical) and in the X–Y plane (horizontal). This is consistent with studies of the kinematics and dynamics for human arm motion that reported distinct controls for vertical and horizontal arm movements (Soechting and Flanders, 1992 ; Soechting et al., 1995 ). The differences in spatial contributions between monkeys A and K might have resulted from their different training levels or previous motor experience (Mitz et al., 1991 ; Laubach et al., 2000 ). For spectral contributions (Figure 4 B), high-γ band activity in the motor cortex has been found to associate with different components of movement (preparation, initiation, and maintenance) (Farmer, 1998 ), and has been reported widely in ECoG/LFP/EEG/MEG studies of the directional and muscular control of hand movement (Leuthardt et al., 2004 ; Rickert et al., 2005 ; Ball et al., 2008 ; Waldert et al., 2008 ).
Functional Motor Mapping of Arm Motion
Cortical functional maps of arm motion have been investigated widely in lesion and electrical microstimulation studies in monkeys (Graziano et al., 2002a ). However, these maps describe only whether certain cortical circuits are involved in certain movement controls, and evidence of how these cortical areas encode movements is lacking. By contrast, the decoding of reaching, which illustrates how the brain controls hand movement dynamically, has been studied in many cortical areas (Kalaska et al., 1997 ; Schall and Thompson, 1999 ; Graziano et al., 2002b ). However, most of these studies focused only on specific cortical areas, whereas the interplay between different areas remains unclear. In addition, activity in a cortical area does not statically control motor parameters. For example, activity in the motor cortex during reaching is different for different initial arm orientations (Scott and Kalaska, 1995 ). Therefore, how different the activity of cortical areas are integrated to control a single motor parameter is unknown, and how a single cortical area can be flexible in responding to different parameters needs further investigation. Using ECoG, we successfully decoded neural correlates of various motor parameters arising from multiple cortical areas and their spatial and temporal integration for intended arm movements. We expect that our present results, and the results of the studies that will follow, will elucidate the many-to-many dynamic mappings between different cortical areas and different motor parameters, and the cortical mechanisms underlying the motor control of arm motion.
Applications in BMIs
To be useful in real life, BMI systems need to give users a decent level of accuracy and control, but also need to be easy to use, install, service, and adjust, and they must be safe, stable, and dependable over the long term. Current BMI systems do not yet satisfy most of these demands. Even though we have not applied our decoding paradigm to real-time BMI systems, our results encourage the development of ECoG-based full-featured BMIs. Our system can predict intended motion as accurately as other existing methods and with long-term stability. Our system’s ability to decode high-DOF continuous movements – an accomplishment that goes beyond the classification of discrete tasks or states – could enable more naturalistic control. Moreover, our system avoids penetration of the brain entirely and is surgically replaceable if repair or upgrade is needed. The ease with which ECoG can cover multiple cortical regions might also allow one to locate relevant cortical areas for specific motor control, to enhance performance by exploiting their integration, and to control a variety of motor parameters by utilizing signals from different cortical areas. In other words, it may lead to neuroprosthetic devices that require less invasive surgery to install and do not require frequent recalibration. These advantages are essential for implementing chronic neuroprosthetic devices for real-life applications.
Conflict of Interest Statement
The authors declare that the research was conducted in the absence of any commercial or financial relationships that could be construed as a potential conflict of interest.
Acknowledgments
This work was supported by the Strategic Research Program for Brain Sciences by Ministry of Education, Culture, Sports, Science and Technology (MEXT) Japan. We thank Naomi Hasegawa and Tomonori Notoya for their outstanding technical assistance.
Supplementary Material
The Supplementary Material for this article can be found online at http://www.frontiersin.org/neuroengineering/paper/10.3389/fneng.2010.00003/
References
Allen, D. M. (1974). The relationship between variable selection and data augmentation and a method of prediction. Technometrics 16, 125–127.
Ball, T., Demandt, E., Mutschler, I., Neitzel, E., Mehring, C., Vogt, K., Aertsen, A., Schulze-Bonhage, A. (2008). Movement related activity in the high gamma range of the human EEG. Neuroimage 41, 302–310.
Ball, T., Schulze-Bonhage, A., Aertsen, A., and Mehring, C. (2009). Differential representation of arm movement direction in relation to cortical anatomy and function. J. Neural Eng. 6, 016006.
Bjornsson, C., Oh, S., Al-Kofahi, Y., Lim, Y., Smith, K., Turner, J., De, S., Roysam, B., Shain, W., and Kim, S. (2006). Effects of insertion conditions on tissue strain and vascular damage. J. Neural Eng. 3, 196–207.
Bullara, L. A., Agnew, W. F., Yuen, T. G., Jacques, S., and Pudenz, R. H. (1979). Evaluation of electrode array material for neural prostheses. Neurosurgery 5, 681–686.
Carmena, J. M., Lebedev, M. A., Crist, R. E., O’Doherty, J. E., Santucci, D. M., Dimitrov, D. F., Patil, P. G., Henriquez, C. S., and Nicolelis, M. A. L. (2003). Learning to control a brain–machine interface for reaching and grasping by primates. PLoS Biol. 1, e42. doi:10.1371/journal.pbio.0000042.
Chan, S. S., and Moran, D. W. (2006). Computational model of a primate arm: from hand position to joint angles, joint torques and muscle forces. J. Neural Eng. 3, 327–337.
Chestek, C. A., Batista, A. P., Santhanam, G., Yu, B. M., Afshar, A., Cunningham, J. P., Gilja, V., Ryu, S. I., Churchland, M. M., and Shenoy, K. V. (2007). Single-neuron stability during repeated reaching in macaque premotor cortex. J. Neurosci. 27, 10742–10750.
Chin, C. M., Popovic, M. R., Thrasher, A., Cameron, T., Lozano, A., and Chen, R. (2007). Identification of arm movements using correlation of electrocorticographic spectral components and kinematic recordings. J. Neural Eng. 4, 146–158.
Donoghue, J. P. (2002). Connecting cortex to machines: recent advances in brain interfaces. Nat. Neurosci. 5(Suppl.), 1085–1088.
Farmer, S. F. (1998). Rhythmicity, synchronization and binding in human and primate motor systems. J. Physiol. 509(Pt. 1), 3–14.
Freeman, W. J., Holmes, M. D., Burke, B. C., and Vanhatalo, S. (2003). Spatial spectra of scalp EEG and EMG from awake humans. Clin. Neurophysiol. 114, 1053–1068.
Geladi, P., and Kowalski, B. (1986). Partial least-squares regression: a tutorial. Anal. Chim. Acta 185, 1–17.
Graziano, M., Taylor, C., and Moore, T. (2002a). Complex movements evoked by microstimulation of precentral cortex. Neuron 34, 841–851.
Graziano, M., Taylor, C., Moore, T., and Cooke, D. (2002b). The cortical control of movement revisited. Neuron 36, 349–362.
Hatsopoulos, N., and Donoghue, J. (2009). The science of neural interface systems. Annu. Rev. Neurosci. 32, 249–266.
Kalaska, J., Scott, S., Cisek, P., and Sergio, L. (1997). Cortical control of reaching movements. Curr. Opin. Neurobiol. 7, 849–859.
Kipke, D., Shain, W., Buzsaki, G., Fetz, E., Henderson, J., Hetke, J., and Schalk, G. (2008). Advanced neurotechnologies for chronic neural interfaces: new horizons and clinical opportunities. J. Neurosci. 28, 11830–11838.
Kubánek, J., Miller, K., Ojemann, J., Wolpaw, J., and Schalk, G. (2009). Decoding flexion of individual fingers using electrocorticographic signals in humans. J. Neural Eng. 6, 066001.
Laubach, M., Wessberg, J., and Nicolelis, M. A. (2000). Cortical ensemble activity increasingly predicts behaviour outcomes during learning of a motor task. Nature 405, 567–571.
Lebedev, M. A., and Nicolelis, M. A. L. (2006). Brain–machine interfaces: past, present and future. Trends Neurosci. 29, 536–546.
Lebedev, M. A., O’Doherty, J. E., and Nicolelis, M. A. L. (2008). Decoding of temporal intervals from cortical ensemble activity. J. Neurophysiol. 99, 166–186.
Leuthardt, E. C., Miller, K. J., Schalk, G., Rao, R. P. N., and Ojemann, J. G. (2006). Electrocorticography-based brain computer Interface – the seattle experience. IEEE Trans. Neural Syst. Rehabil. Eng. 14, 194–198.
Leuthardt, E. C., Schalk, G., Wolpaw, J. R., Ojemann, J. G., and Moran, D. W. (2004). A brain–computer interface using electrocorticographic signals in humans. J. Neural Eng. 1, 63–71.
Levine, S. P., Huggins, J. E., BeMent, S. L., Kushwaha, R. K., Schuh, L. A., Rohde, M. M., Passaro, E. A., Ross, D. A., Elisevich, K. V., and Smith, B. J. (2000). A direct brain interface based on event-related potentials. IEEE Trans. Rehabil. Eng. 8, 180–185.
Loeb, G., Walker, A., Uematsu, S., and Konigsmark, B. (1977). Histological reaction to various conductive and dielectric films chronically implanted in the subdural space. J. Biomed. Mater. Res. 11, 195–210.
Margalit, E., Weiland, J., Clatterbuck, R., Fujii, G., Maia, M., Tameesh, M., Torres, G., D’Anna, S., Desai, S., and Piyathaisere, D. (2003). Visual and electrical evoked response recorded from subdural electrodes implanted above the visual cortex in normal dogs under two methods of anesthesia. J. Neurosci. Methods 123, 129–137.
Mehring, C., Nawrot, M., de Oliveira, S., Vaadia, E., Schulze-Bonhage, A., Aertsen, A., and Ball, T. (2004). Comparing information about arm movement direction in single channels of local and epicortical field potentials from monkey and human motor cortex. J. Physiol. (Paris) 98, 498–506.
Mitz, A. R., Godschalk, M., and Wise, S. P. (1991). Learning-dependent neuronal activity in the premotor cortex: activity during the acquisition of conditional motor associations. J. Neurosci. 11, 1855–1872.
Mussa-Ivaldi, F. A., and Miller, L. E. (2003). Brain–machine interfaces: computational demands and clinical needs meet basic neuroscience. Trends Neurosci. 26, 329–334.
Nicolelis, M. A. L. (2003). Brain–machine interfaces to restore motor function and probe neural circuits. Nat. Rev. Neurosci. 4, 417–422.
Patil, P. G., and Turner, D. A. (2008). The development of brain–machine interface neuroprosthetic devices. Neurotherapeutics 5, 137–146.
Pilcher, W., and Rusyniak, W. (1993). Complications of epilepsy surgery. Neurosurg. Clin. N. Am. 4, 311.
Pistohl, T., Ball, T., Schulze-Bonhage, A., Aertsen, A., and Mehring, C. (2008). Prediction of arm movement trajectories from ECoG-recordings in humans. J. Neurosci. Methods 167, 105–114.
Rickert, J., de Oliveira, S. C., Vaadia, E., Aertsen, A., Rotter, S., and Mehring, C. (2005). Encoding of movement direction in different frequency ranges of motor cortical local field potentials. J. Neurosci. 25, 8815–8824.
Sanchez, J. C., Gunduz, A., Carney, P. R., and Principe, J. C. (2008). Extraction and localization of mesoscopic motor control signals for human ECoG neuroprosthetics. J. Neurosci. Methods 167, 63–81.
Schalk, G., Kubanek, J., Miller, K. J., Anderson, N. R., Leuthardt, E. C., Ojemann, J. G., Limbrick, D., Moran, D., Gerhardt, L. A., and Wolpaw, J. R. (2007). Decoding two-dimensional movement trajectories using electrocorticographic signals in humans. J. Neural Eng. 4, 264–275.
Schalk, G., Miller, K. J., Anderson, N. R., Wilson, J. A., Smyth, M. D., Ojemann, J. G., Moran, D. W., Wolpaw, J. R., and Leuthardt, E. C. (2008). Two-dimensional movement control using electrocorticographic signals in humans. J. Neural Eng. 5, 75–84.
Schall, J., and Thompson, K. (1999). Neural selection and control of visually guided eye movements. Annu. Rev. Neurosci. 22, 241–259.
Schwartz, A. B., Cui, X. T., Weber, D. J., and Moran, D. W. (2006). Brain-controlled interfaces: movement restoration with neural prosthetics. Neuron 52, 205–220.
Scott, S., and Kalaska, J. (1995). Changes in motor cortex activity during reaching movements with similar hand paths but different arm postures. J. Neurophysiol. 73, 2563.
Soechting, J. F., Buneo, C. A., Herrmann, U., and Flanders, M. (1995). Moving effortlessly in three dimensions: does Donders’ law apply to arm movement? J. Neurosci. 15, 6271–6280.
Soechting, J. F., and Flanders, M. (1992). Moving in three-dimensional space: frames of reference, vectors, and coordinate systems. Annu. Rev. Neurosci. 15, 167–191.
Stieglitz, T., Rubehn, B., Henle, C., Kisban, S., Herwik, S., Ruther, P., and Schuettler, M. (2009). Brain–computer interfaces: an overview of the hardware to record neural signals from the cortex. Prog. Brain Res. 175, 297–315.
Szarowski, D., Andersen, M., Retterer, S., Spence, A., Isaacson, M., Craighead, H., Turner, J., and Shain, W. (2003). Brain responses to micro-machined silicon devices. Brain Res. 983, 23–35.
Vetter, R., Williams, J., Hetke, J., Nunamaker, E., and Kipke, D. (2004). Chronic neural recording using silicon-substrate microelectrode arrays implanted in cerebral cortex. IEEE Trans. Biomed. Eng. 51, 896–904.
Waldert, S., Preissl, H., Demandt, E., Braun, C., Birbaumer, N., Aertsen, A., and Mehring, C. (2008). Hand movement direction decoded from MEG and EEG. J. Neurosci. 28, 1000–1008.
Wessberg, J., Stambaugh, C. R., Kralik, J. D., Beck, P. D., Laubach, M., Chapin, J. K., Kim, J., Biggs, S. J., Srinivasan, M. A., and Nicolelis, M. A. (2000). Real-time prediction of hand trajectory by ensembles of cortical neurons in primates. Nature 408, 361–365.
Wold, S., Ruhe, A., Wold, H., and Dunn, W. J. III. (1984). The collinearity problem in linear regression. The partial least squares (PLS) approach to generalized inverses. SIAM J. Sci. Stat. Comput. 5, 735–743.
Keywords: decoding, electrocorticography, ECoG, arm, asynchronous, long-term, brain-machine interface, BMI
Citation: Chao ZC, Nagasaka Y and Fujii N (2010) Long-term asynchronous decoding of arm motion using electrocorticographic signals in monkeys. Front. Neuroeng. 3:3. doi: 10.3389/fneng.2010.00003
Received: 20 November 2009;
Paper pending published: 16 December 2009;
Accepted: 11 March 2010;
Published online: 30 March 2010
Edited by:
Martin Stelzle, University of Tübingen, GermanyReviewed by:
Niels Birbaumer, Istituto di Ricovero e Cura a Carattere Scientifico Ospedale San Camillo, Italy; Universität Tübingen, GermanyCarsten Mehring, Albert Ludwigs University, Germany
Gerwin Schalk, Wadsworth Center, USA
Copyright: © 2010 Chao, Nagasaka and Fujii. This is an open-access article subject to an exclusive license agreement between the authors and the Frontiers Research Foundation, which permits unrestricted use, distribution, and reproduction in any medium, provided the original authors and source are credited.
*Correspondence: Naotaka Fujii, Laboratory for Adaptive Intelligence, RIKEN Brain Science Institute, 2-1 Hirosawa, Wako-shi, Saitama 351-0198, Japan. e-mail: na@brain.riken.jp