Neuronal response clamp
- 1 Network Biology Research Laboratories, Lorry Lokey Interdisciplinary Center for Life Sciences and Engineering, Technion, Haifa, Israel
- 2 Faculty of Electrical Engineering, Technion, Haifa, Israel
- 3 Department of Pediatrics, Rambam Medical Center, Haifa, Israel
- 4 The Interdisciplinary Center for Neural Computation, The Hebrew University, Jerusalem, Israel
Responses of individual neurons to ongoing input are highly variable, reflecting complex threshold dynamics. Experimental access to this threshold dynamics is required in order to fully characterize neuronal input–output relationships. The challenge is practically intractable using present day experimental paradigms due to the cumulative, non-linear interactions involved. Here we introduce the Neuronal Response Clamp, a closed-loop technique enabling control over the instantaneous response probability of the neuron. The potential of the technique is demonstrated by showing direct access to threshold dynamics of cortical neuron in vitro using extracellular recording and stimulation, over timescales ranging from seconds to many hours. Moreover, the method allowed us to expose the sensitivity of threshold dynamics to spontaneous input from the network in which the neuron is embedded. The Response-Clamp technique follows the rationale of the voltage-clamp and dynamic-clamp approaches, extending it to the neuron’s spiking behavior. The general framework offered here is applicable in the study of other neural systems, beyond the single neuron level.
Introduction
Temporally extended measurements of time and rate of spiking activity reveal complex dynamics, reflecting dependence of the threshold on the history of activity (Elul and Adey, 1966; Heck et al., 1993; Golomb et al., 2006; Badel et al., 2008; Kobayashi et al., 2009). This dependence is manifested in broad distributions and temporal correlations of spiking activity at practically every observable scale (see Gal et al., 2010 and references therein). To understand these dynamics, more than statistical descriptions of responses is required. One would like to come up with a measure of the neuronal input–output relationship at the macroscopic level; this, however, is practically impossible unless history-dependency is under the control of the experimenter. Here, we propose to use a closed-loop approach to achieve this control. While closed-loop stimulation protocols have been in use for several decades both in vivo and in vitro (e.g., Fetz, 1969; Wagenaar et al., 2005, see also Arsiero et al., 2007 and reference therein), they were generally applied in order to condition spatio-temporal features of stimulation on activity patterns, rather than as a tool for uncovering input–output relationships in macroscopic systems.
The challenge here resembles the one that Hodgkin et al. (1952) confronted in their analyses of membrane excitability; there, mapping between current (the “input”) and voltage (the “output”) is non-linear and time varying due to voltage-dependent conductances. Hodgkin et al. (1952) broke the entailed circularity by clamping the voltage (“output”) using a feedback control. Similarly, in the present context, the mapping between stimulus features (the “input”) and spiking activity (the “output”) is non-linear and time varying due to spiking history dependent processes. Therefore, a method for controlling neuronal spiking activity is sought.
In this study we present the concept of Neuronal Response Clamp and demonstrate its applicability in direct measurement of threshold dynamics. A specific feature of the neuronal spiking response, the spike probability, is clamped by implementing a control circuit that estimates the instantaneous value of this feature, compares it to a desired value, and corrects errors by changing the intensity of an extracellular electrical stimulation pulse. This is achieved using a closed-loop real-time system that implements a proportional-integral-derivative (PID) controller (Levine, 1996). We show that the Response-Clamp method enables full control over neuronal spiking probability both in synaptically isolated neurons and within active networks.
The potential of the Response Clamp in revealing the dynamics of neuronal input–output relationships is demonstrated by showing direct access to threshold dynamics over timescales ranging from seconds to many hours. Moreover, the method allowed us to expose the sensitivity of threshold dynamics to spontaneous input from the network in which the neuron is embedded. Such long term, continuous measurements of neuronal input–output dynamics, practically inaccessible using standard “open-loop” approaches, are available for rigorous study using the Response-Clamp method.
Materials and Methods
Cell Preparation
Cortical neurons were obtained from newborn rats (Sprague-Dawley) within 24 h after birth using mechanical and enzymatic procedures described in earlier studies (Marom and Shahaf, 2002). Rats were killed by CO2 inhalation according to protocols approved by the National Institutes of Health. The neurons were plated directly onto substrate-integrated multi-electrode arrays and allowed to develop functionally and structurally mature networks over a time period of 2–3 weeks. The number of neurons in a typical network is of the order of 300,000, covering an area of about 20 mm2. The preparations were bathed in MEM supplemented with heat-inactivated horse serum (5%), glutamine (0.5 mM), glucose (20 mM), and gentamicin (10 g/ml), and maintained in an atmosphere of 37°C, 5% CO2, and 95% air in an incubator as well as during the recording phases. An array of 60 Ti/Au/TiN extracellular electrodes, 30 μm in diameter, and spaced either 500 or 200 μm from each other (MultiChannelSystems, Reutlingen, Germany) were used. The insulation layer (silicon nitride) was pre-treated with polyethyleneimine (Sigma, 0.01% in 0.1 M Borate buffer solution). To completely block synaptic transmission in the network, 20 μM APV (amino-5-phosphonovaleric acid), 10 μM CNQX (6-cyano-7-nitroquinoxaline-2,3-dione), and 5 μM Bicuculline were added to the bathing solution. The experiments shown in Figures 1, 3, 4, 5C, and 8 were performed while blocking synaptic transmission, whereas the ones portrayed in Figures 5A,B, 6, and 7 were conducted in an active network, without block.
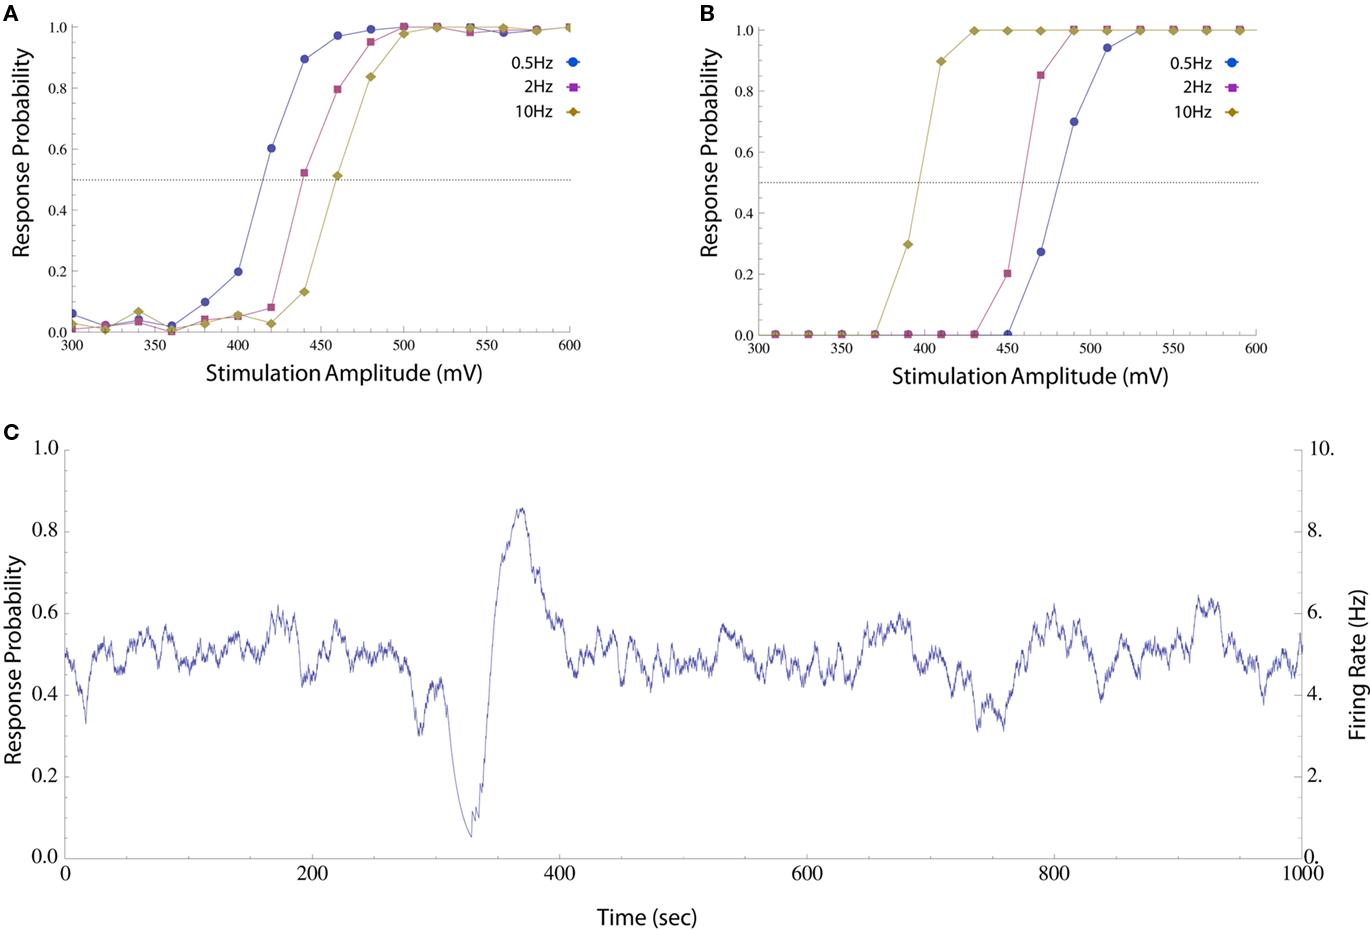
Figure 1. Impacts of stimulation pulse amplitude and rate on response probability. (A) Neuron was stimulated periodically with different pulse amplitudes and the response probability was calculated by sorting the results and computing a histogram (20 mV bins, about 100 responses in each bin). The different amplitudes were shuffled in order to compensate for potential systematic drifts in experimental conditions and the first 300 responses were discarded to avoid initial transients. This was performed at 0.5, 2, and 10 Hz (circles, squares, and diamonds respectively). The response probability increases monotonically with stimulation amplitude at all the rates, but the stimulation threshold (i.e., the amplitude at which a spike is generated with 50% reliability, marked with a dotted line) is higher when stimulation rate is high. (B) The same procedure was performed on a different neuron, whose threshold decreases as stimulation rate is increased. The different behaviors may arise from the particular composition of the cells’ spike generating mechanisms, e.g., the distribution of different species of ion channels etc. (C) When a neuron is stimulated periodically (10 Hz) using a constant, near threshold amplitude (600 mV), the interplay between threshold and activity results in significant fluctuations in response probability (estimated as described in Materials and Methods) and firing rate (the product of response probability and stimulation rate).
Measurements and Stimulation
A commercial amplifier (MEA-1060-inv-BC, MCS, Reutlingen, Germany) with frequency limits of 150–3,000 Hz and a gain of ×1,024 was used. Monophasic square pulse 200 ms 100–900 mV voltage stimulation through extracellular electrodes was performed (Wagenaar et al., 2004) using a dedicated stimulus generator (MCS, Reutlingen, Germany). Data was digitized using data acquisition board (PD2-MF-64-3M/12H, UEI, Walpole, MA, USA). Each channel was sampled at a frequency of 16 K sample/s. Action potentials were detected on-line by threshold crossing. All spike times and shapes, as well as 15 ms voltage traces from all electrodes after each stimulus, were recorded for analyses. Data processing and closed-loop stimulation was performed using a Simulink (The Mathworks, Natick, MA, USA) based xPC target application (see Zrenner et al., 2010 for details). In closed-loop experiments, only recording electrodes in which direct responses of a single neuron within the first 15 ms after stimulation are detected, were chosen.
Estimating Spike Probability On-Line
Let us assume that at each given moment, the neuron responds to stimulation with some probability P(t) which may be time or history dependent in some unknown fashion. At every given moment, we would like to estimate this probability statistically using only past responses. Our main assumption is that P(t) changes slowly, so that it can be taken to be constant within a small enough time window. Note that we do not require any specific model of the dynamics of P(t).
Let si be an indicator function, so that si = 1 if the neuron generated a spike within a short (15 ms) interval after the ith stimulus and si = 0 otherwise. We denote  the estimation calculated at time t > tn, based on the set of responses {s1,s2,…,sn} to stimuli given at times {t1,t2,…,tn}. A straightforward method of estimation would be to divide the number of spikes by the number of stimuli in a small time window [tn − T,tn]. This method, however, has the disadvantage of giving equal weights to recent and distant responses. Instead, a weighted average was realized by convolving with an exponential kernel,

where  is the estimation of response probability at the beginning of the experiment t0 (set to 0.5 in all experiments), and τ is the kernel’s time constant (τ = 10 s in the experiments presented). The choice of an exponential window, rather than any other causal (one-sided) window, stems from the possibility to realize the computation recursively:

Hence the weight of each response in the estimation decays exponentially with time. With stimulation rate of 10 Hz and τ = 10 s, equation (2) gives 1% weight to the last response and 99% to the previous estimation. Note that the sum of weights in equation (1) converges to unity for large n and therefore, assuming P(t) is constant the estimator is asymptotically unbiased:

where E[x] denotes the expected value of x. For a time-varying probability (i.e., when the above mentioned assumption of slowly changing response probability does not hold), the expected estimation is a weighted average (i.e., a low-pass filtered version) of P(t). Thus, slower kernels yield smoother estimations while being less sensitive to abrupt changes in responsiveness. Our choice of probability estimation is by no means unique; other recursive estimation algorithms, such as the Kalman filter, may also be imagined. Such algorithms, however, often require explicit modeling of the process being estimated.
And, finally, the instantaneous firing rate of the neuron – where required – was estimated by multiplying the estimated response probability with the stimulation rate.
PID Controller
A PID controller was realized on the xPC target system (Levine, 1996). The input to the controller is the error signal,

where  and
and  are the desired and estimated response probabilities at the nth stimulus, respectively. The output of the controller is generally composed of four components,

where gP, gI, and gD are the proportional, integral, and derivative gain parameters, respectively (in the experiments presented in this report gP was 400 mV, gI was 160 mV, and gD was 0.) and Abaseline is the baseline amplitude bias (set to 300–500 mV). Note that the precise value chosen for of this bias has no impact on clamp quality since it is corrected on-line by the integral component of the PID controller. In our system maximal stimulation amplitude was 900 mV. Stimulation rate was chosen to be 10 Hz.
For the response latency clamp presented in Figure 8, the output of the controller was the instantaneous stimulation rate fn, i.e., the reciprocal of the inter-stimulus interval (gP was 50 Hz; gI was 2 Hz; gD was 0; and fbaseline was 2 Hz). To improve latency measurement the sampling rate was increased to 96 K samples/s.
Results
The experiments described in this work were conducted in networks of rat cortical neurons, plated in vitro on a substrate that caters to extracellular recording and stimulation of electrical activity, at the single cell level. Evoked spiking activity of a given individual neuron in such a network, reflects both the direct effect of external stimulation, as well as the effects of synaptic activations by other neurons (reviewed in Marom and Shahaf, 2002). This experimental setup allows recordings of spontaneous and evoked neuronal activity non-invasively and therefore for extremely long epochs. We first examine the capacity of the Neuronal Response-Clamp technique to control neuronal responses and follow threshold dynamics in neurons that are isolated from the network; this is done by pharmacologically blocking all major types of synaptic inputs (see Materials and Methods, and Gal et al., 2010). Under complete blockade of synaptic transmission, all spontaneous activity dies out and the network becomes quiescent (Wagenaar et al., 2004; Bonifazi et al., 2005). In this state, applying a single, short (sub-millisecond) pulse between two electrodes, generates a single action potential in a subset of neurons. The dynamics of the single neuron response may thus be interrogated using a long sequence of stimuli (Gal et al., 2010). We refer to this stimulation scenario as an open-loop protocol, since the (predefined) stimulation sequence is not affected by the evoked neuronal responses.
The impacts of stimulation frequency and pulse amplitude on the spike threshold of an isolated neuron, as reflected in the probability that such a spike is generated, are demonstrated in Figure 1. Although the response probability increases with stimulation amplitude at any given instance, the precise relationship is dynamic. Let us define the stimulation threshold as the amplitude required to generate a spike with 50% probability (marked with dotted lines in Figures 1A,B). This threshold may depend on the history of activity and/or stimulation rate; e.g., stimulation rate may elevate the threshold (as in Figure 1A) or decrease it (as in Figure 1B). Moreover, this threshold may fluctuate independently of spiking activity. When long stimulation sequences are used (Figure 1C), the interplay between spiking history and stimulation threshold results in a seemingly erratic behavior of the response probability and firing rate (estimated on-line, see Materials and Methods).
The response probability possesses a useful quality, from the point of view of control; as mentioned above, it exhibits a simple, monotonic relationship with the instantaneous stimulation amplitude (see Figures 1A,B). Therefore, negative feedback may be used in order to produce a desired response, either constant or time varying. This is achieved in the following manner (Figure 2): First, continuous on-line estimation of the response probability is computed by convolving the spiking history with an exponential kernel, implying that recent responses are given a greater weight (explained in Materials and Methods). Following each stimulus, a clamp error is computed by comparing the estimated probability with its desired value. This error signal is then fed into a PID controller which accordingly alters stimulation amplitude in order to decrease the error toward zero. The PID controller consists of three components: the proportional component (P) supplies the necessary negative feedback; the integrated component (I) counteracts slow changes in the system’s responsiveness; and the derivative component (D) contributes dissipation needed to damp oscillations. For details on controller construction and implementation see Section “Materials and Methods.”
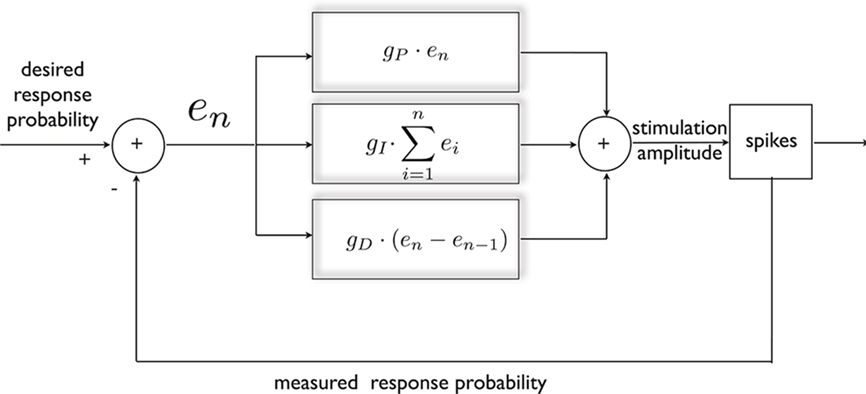
Figure 2. General scheme of a PID controller, designed for clamping neuronal response probability. The error signal is calculated and subjected to three different transformations that additively dictate the nature of stimulation needed for clamping the response. This standard control algorithm was implemented within a Simulink environment.
We first compared the neuronal response in open-loop, where stimulation amplitude is kept constant, to the neuronal response under closed-loop conditions, where stimulation amplitude is dynamically adjusted by the controller. In contrast to the open-loop response, the clamped response quickly converges to the desired value (Figures 3A,B); the clamp may be maintained for up to several hours (see below). Thus, the Response-Clamp restrains the considerable fluctuations of the spike response probability. The Response-Clamp technique is extremely reliable: Figure 3C summarizes the results of 80 experimental blocks, showing that the standard deviation in response probability is markedly decreased under closed-loop, compared to open-loop stimulation regimes.
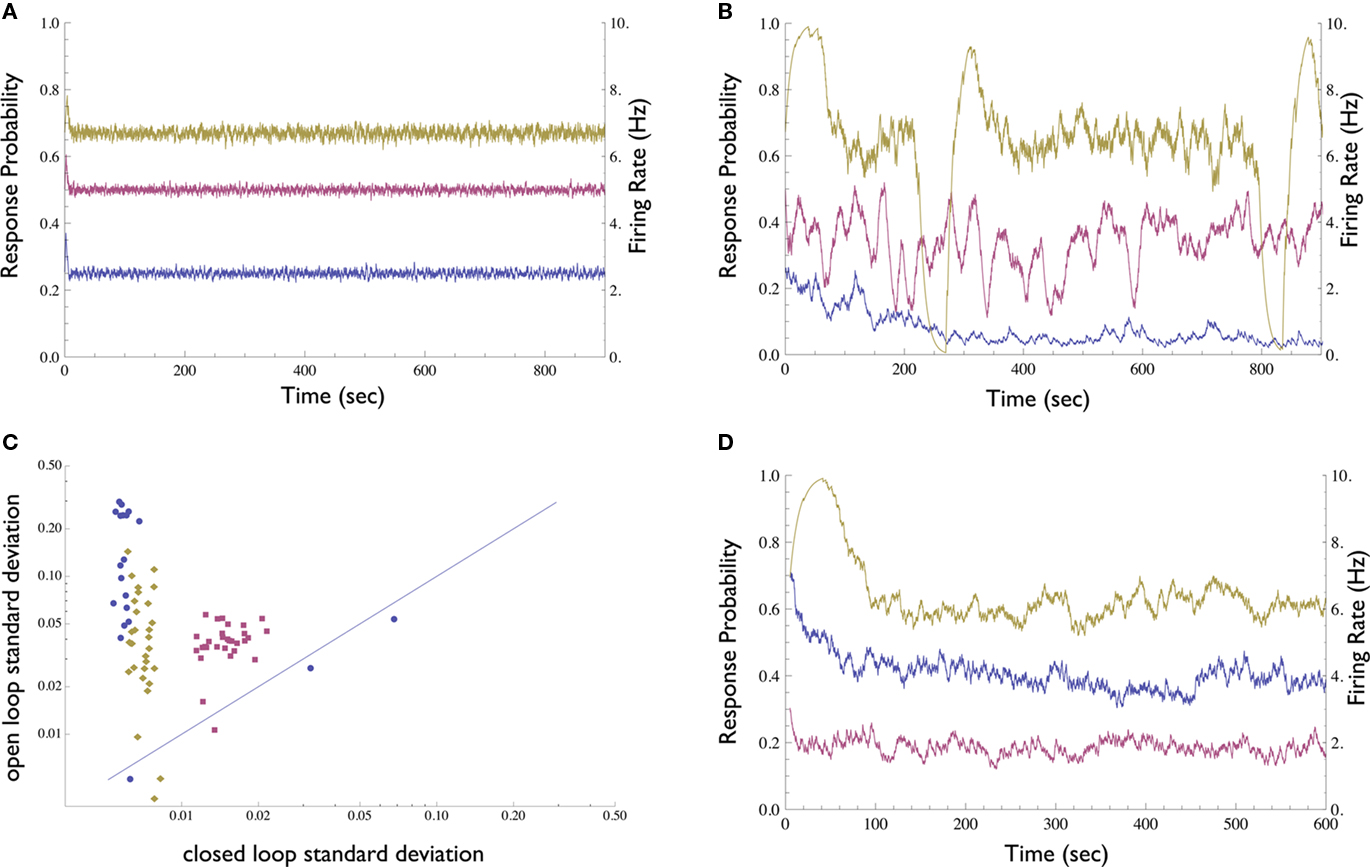
Figure 3. Demonstration of the Neuronal Response Probability Clamp. (A) Response probability and firing rate of a neuron clamped to three different values for 15 min each using the Response-Clamp technique. Note the stability of the clamped response. Firing rate was computed by multiplying response probability by stimulation rate (10 Hz). (B) The same neuron, stimulated in open-loop using the average stimulation amplitude produced by the controller during the clamp. The response develops marked fluctuations. (C) Neuronal response probability was clamped to different values ranging from 0.1 to 0.9, for 5 min each. The response’s standard deviation in the last 4 min of each epoch is compared with that of the same neuron, when the mean amplitude used during the clamp period is re-applied in open-loop [see the examples in (A,B)]. Data from 80 such experimental sessions conducted on 3 different neurons (each in a different culture, depicted by different symbol and color) are presented in log–log scale. Almost all the data points are above the diagonal, signifying the stability of the clamped response in comparison to the unclamped response. (D) An attempt to clamp to 0.5 response probability, without the integrator component of the controller, i.e., with only proportional negative feedback. One neuron was clamped for 10 min with Abaseline = 300, 500, and 900 mV (purple, blue, and yellow, respectively). The response is less stable than with the PI controller, yet more stable compared to the open-loop condition. The value of stabilized response markedly depends on the controller parameters and exhibits slow drifts.
The robustness of the Response-Clamp technique is reflected in the fact that no fine-tuning of the PID gain parameters was required in order to achieve a successful clamp. The derivative component was found to be unnecessary in this system and was omitted (i.e., a PI controller was used instead of a PID. We include the complete PID form for purposes of generality). Use of the derivative component might be imperative in cases where oscillatory behavior of the system is more pronounced. The integral component, however, is essential. This component accumulates the error and so “resets” the controller to the correct point of operation. In Figure 3D a neuron was clamped with only proportional negative feedback, using three different values of Abaseline (baseline amplitude bias, see Materials and Methods). The negative feedback produces a response which is more stable than in open-loop yet less stable than when the integral component is present. Moreover, the neuron stabilizes at an arbitrary response probability which is highly sensitive to the choice of parameters and to the current value of the neuron’s stimulation threshold.
Two important remarks should be made on the response probability clamp. First, if the stimulation rate is maintained constant during this clamp, stabilization of the response probability also entails stabilization of the firing rate of the isolated neuron; e.g., if the neuron’s response probability is clamped to 50% and the stimulation rate is 10 Hz then the neuron will fire at a constant 5 Hz, with extremely low jitter. This, in itself, may have important practical applications. Second, under the above mentioned conditions, the controller’s output (the computed stimulation pulse amplitude) is a direct measure of the instantaneous stimulation threshold of that given neuron (as defined above). Hence, the dynamics of the pulse amplitude generated by the controller is, in fact, the dynamics of the neuronal threshold. One must note that this measured threshold may theoretically be affected by uncontrolled experimental variables (e.g., the impedance of the electrodes and surrounding media). This concern, however, was specifically addressed in Gal et al. (2010), where several control experiments demonstrated that the experimental conditions in our setup are stable.
We were interested in determining whether the specific pattern of stimulation (evoked by the controller) is sufficient, in and by itself, to clamp the response. In other words, what if one stimulates a neuron using an open-loop protocol by playing-back a stimulation pattern that was produced by the controller under Response-Clamp conditions in that same neuron? Would such a replayed open-loop procedure result in stable response probability? If this were the case, one could argue that the Response-Clamp controller “identified” a stimulation pattern that ensures stable output; moreover, it would have signified that the neuron is deterministic and insensitive to initial conditions. This, however, is not the case. Although the “replayed” input sequence in the open-loop protocol was identical to the one used by the controller in the clamped conditions, stability quickly deteriorated, and the response probability diverged from the desired value (Figure 4). Thus, feedback is essential in order to achieve response stabilization: the exact temporal pattern of the stimulation series does not, in and by itself, cause stable neuronal response; rather, the instantaneous state of the neuron must be continuously monitored and taken into account while computing the control signal. Note the duration of the experiment presented in Figure 4, extending over 3 h.
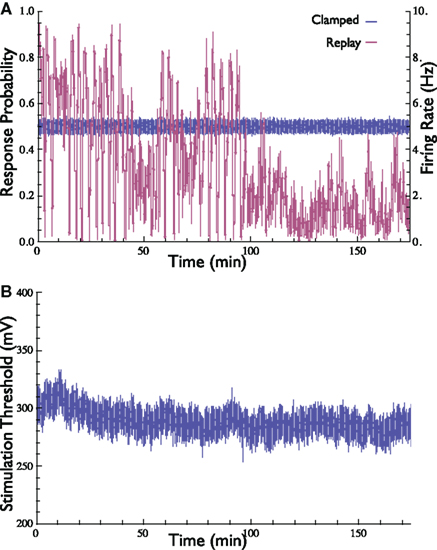
Figure 4. Demonstration of the importance of feedback in the stabilization of neuronal response probability and rate. (A) Response probability and firing rate at two stimulation scenarios are depicted. First, the neuron’s response probability was clamped to 50% for 3 h (blue). Then, the stimulation pattern generated by the controller [i.e., the stimulation threshold, depicted in (B)] was replayed in open-loop (purple). Stability of both response probability and response rate is obtained only in the presence of feedback.
The Response Clamp may be applied to several neurons simultaneously using our experimental setup. This is achieved by selecting a set of stimulation electrodes, each evoking a response in a different recording electrode. Each stimulation source is used in a different phase of the 10-Hz cycle, and so the recording channels may be monitored to guarantee that no cross-influence is present. Figure 5A depicts the response probability of three clamped neurons in the same network. The stimulation thresholds of these three neurons (i.e., the outputs of the three controllers used to clamp them) are presented in Figure 5B.
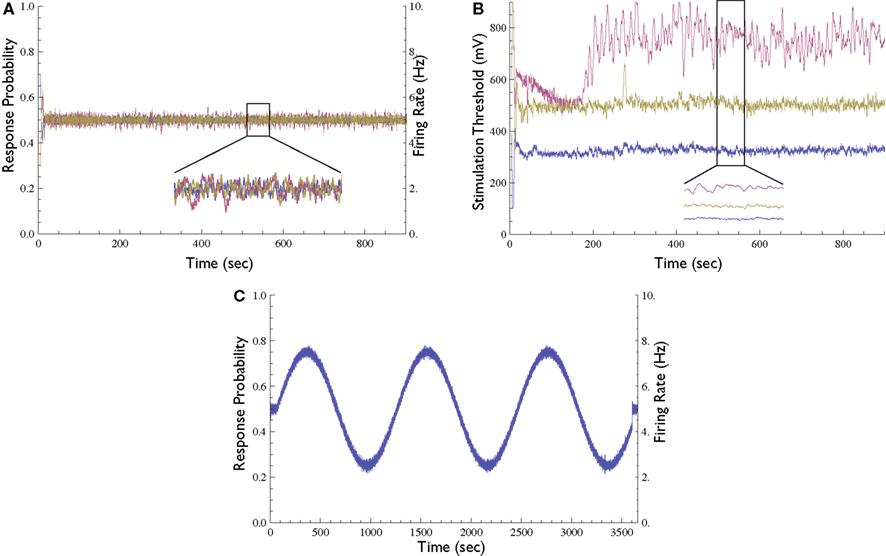
Figure 5. Extensions to the Response-Clamp method. (A) Response probability of three different neurons clamped simultaneously using three different stimulation sources and controllers (inset depicts a blow-up of 1 min); all three traces are practically identical and clamped at 0.5 response probability. (B) The measured stimulation thresholds of the three neurons shown in (A) [inset depicts a blow-up of the same minute as in (A)]. (C) Demonstration of time-varying Response Clamp. A neuron was controlled to follow a sine-wave response probability pattern (20 min period, range between 0.25 and 0.75).
In all the above mentioned experiments the response was clamped to a constant value. However, the neuronal response can also be clamped to a desired time-varying pattern. To demonstrate this capacity, we performed an experiment where the response probability is controlled to follow a sine-wave pattern (Figure 5C). We observed that in the time-varying clamp, the rate at which the desired response may be changed is limited by the range of the controller’s output and by the time constant of the kernel used to estimate the response probability; as long as the computed output that the controller is required to produce is inside the allowed range, the stimulation loop is effective.
The Response Clamp was so far demonstrated on neurons that are pharmacologically isolated from the network input. It is not at all obvious that the ability of the Response Clamp to control neuronal response is conserved once ongoing input from the network is allowed. We thus repeated the experiments described above without blocking synaptic transmission, i.e., when the neuron is embedded in an active network. We found that the Response-Clamp technique was equally effective under these conditions (Figure 6), suggesting the possibility of using the technique in order to study the impacts of ongoing network activity on single neuron threshold dynamics. In what follows, we demonstrate this capacity.
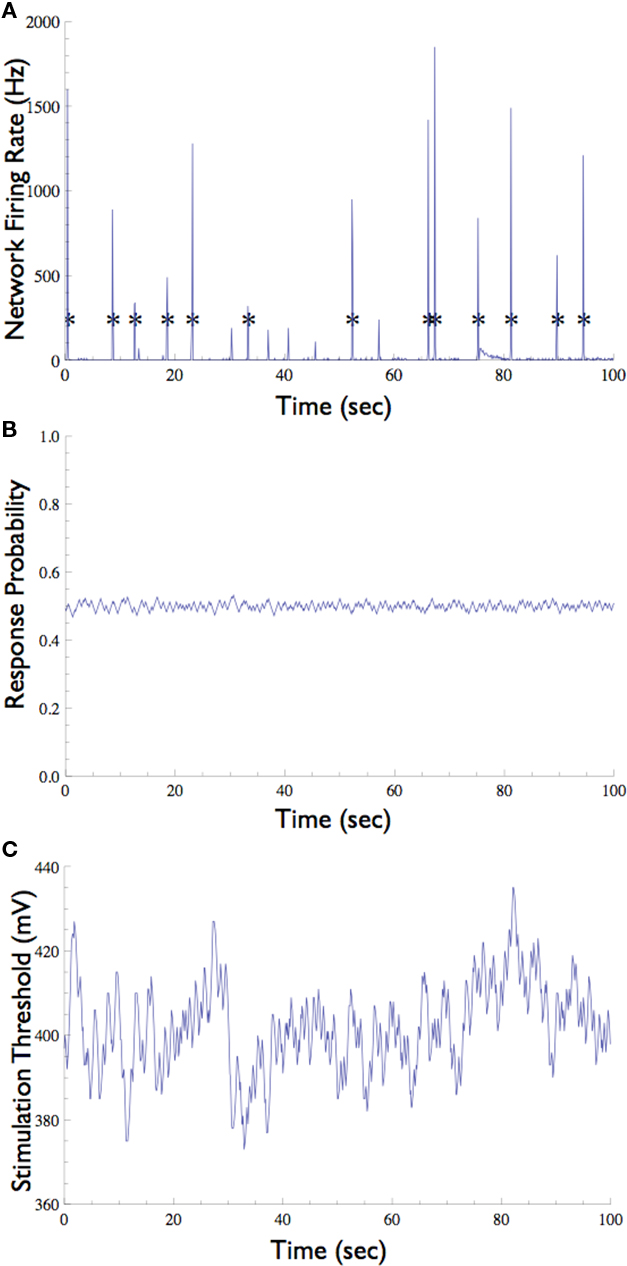
Figure 6. Neuronal Response Clamp of a selected neuron in the presence of background synaptic input. (A) In the absence of synaptic blockers, the network emits short episodes of synchronous activity called “Network Spike” (marked with asterisks), which is detected by the multi-electrode array. (B) A neuron which participates in these network spikes (i.e., that is driven by synaptic inputs) was clamped to 50% response probability. Note that the network spikes do not interrupt the clamp. (C) The stimulation threshold measured using the Response-Clamp technique during this experiment.
The network preparation used here tends to show brief (ca. 100 ms) episodes of synchronous activity that occur once every several seconds, known as network spikes (Figure 6A, also see Beggs and Plenz, 2003; Eytan and Marom, 2006). Nearly every recorded neuron participates in each such network spike, increasing its firing rate during the synchronous event due to a barrage of synaptic inputs (Jimbo et al., 2000; Marom and Shahaf, 2002). What is the effect of the synchronized activity during the network spike on the threshold of a given neuron? We note that standard open-loop experiments do not supply the means to monitor this threshold, regardless of the measurement technique used (e.g., intracellular, imaging, etc.). The Response-Clamp technique allows such monitoring as shown below.
The response probability of one neuron that consistently participates in the network spikes, was clamped to 50% responsiveness to a 10-Hz stimulation. In order to monitor threshold dynamics around network spikes, changes in the output of the controller (i.e., stimulation amplitude) in a time window around all network spikes were averaged (12,356 network spikes over 20 h of clamp). This triggered average corresponds to changes in neuronal stimulation threshold at various time points relative to the network spike onset. Figure 7 shows that during the network spike, the threshold sharply decreases, i.e., the neuron becomes more sensitive to stimulation (depicted). This can be attributed to the contribution of synaptic inputs in exciting the neuron and facilitating spike initiation. After the network spike, the threshold increases above baseline, signifying that the neuron becomes desensitized or depressed, i.e., the neuron becomes less sensitive to stimulation. This desensitization relaxes slowly (ca. 5 s) until the threshold returns to baseline. Figure 7 demonstrates that the Response-Clamp technique may be used to measure such complex processes non-invasively and for extremely long periods of time.
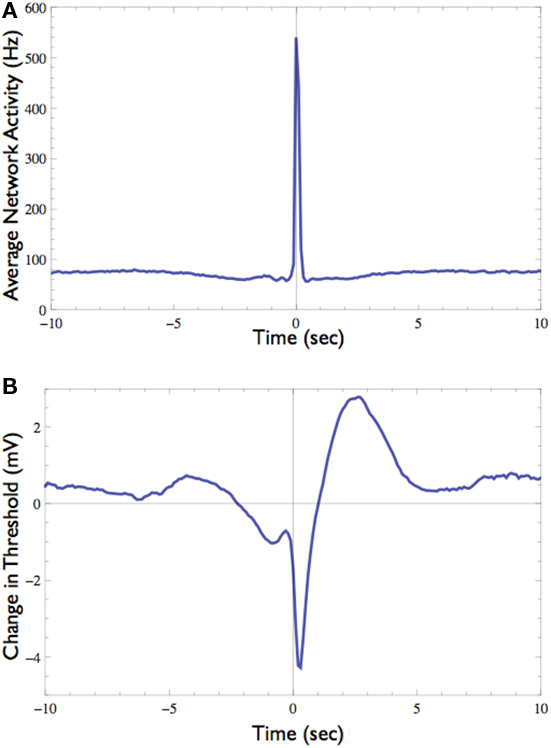
Figure 7. Effect of the network spike on neuronal stimulation threshold. (A) Average network activity from 10 s before to 10 s after the onset of network spikes (total of 12,356 networks spikes recorded during 20 h). (B) The average change in stimulation threshold during these network spikes, relative to the threshold level 5 s before network spike onset. During the network spike and shortly afterward the threshold decreases, indicating that the neuron becomes excited and thus responds more easily. After the network spike subsides the threshold rises above its baseline level, indicating that the neuron is “desensitized,” probably due to activity dependent inactivation processes. Note the long (ca. 5 s) process of relaxation.
Finally, other response features may also be clamped. When supra-threshold, low rate stimuli are delivered, response probability is practically one. However, changes in the neuron’s excitability are reflected in the response latency, i.e., the time delay between the stimulation onset and the detected spike. This measure shows a monotonic relationship with the stimulation rate (see Gal et al., 2010, Figure 4). Thus, the response clamp may easily be used to control the latency and thus to study the dynamics of neuronal excitability (see Figure 8). In this application of the Response Clamp, the output of the controller is no longer a measurement of the stimulation threshold. However, under these conditions the inter-stimulus interval is precisely the time it takes the latency to recover from the generation of a single action potential. Thus, the output of the controller in response latency clamp is a measure of latency dynamics. Latency may also be clamped to a time-varying pattern, as seen in Figure 8C. Note, however, the two limitations of such a procedure: First, the clamp is lost once the rate of change in desired latency is greater than the relaxation rate of the neuron (marked with black arrow). Second, clamp is also lost if the desired latency exceeds the possible latency range of the neuron, where the response becomes unreliable (marked with green arrowheads).
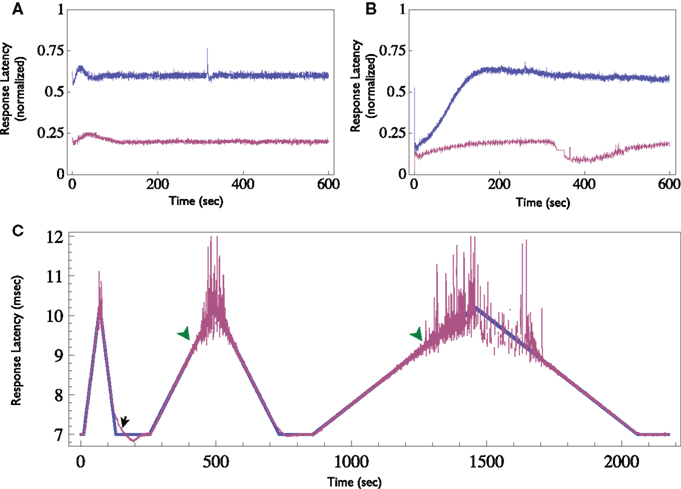
Figure 8. Demonstration of the Neuronal Response Latency Clamp. (A) Response latency of a neuron was clamped to two different levels for 10 min each using the Response-Clamp technique. Latency is normalized so that the baseline level (i.e., the latency at an extremely low stimulation rate, in the example presented here it is 6 ms) is 0 and maximal latency detected (10 ms in this example) is set to 1. Note the stability of the clamped response. (B) The same neuron, stimulated in open-loop using the average stimulation rate produced by the controller during the clamp. Note the slow trends in latency under open-loop conditions. (C) Demonstration of time-varying Response Clamp. Response latency was clamped, while the desired value (depicted blue) was gradually increased and decreased alternatingly at different rates. Note that if the rate of change exceeds the relaxation rate of the latency, the clamp is lost (black arrow). Moreover, at extremely high latency values the behavior becomes irregular and the clamp is effectively lost (green arrowheads).
Discussion
In this study we show that evoked neuronal spiking patterns may be controlled using a simple feedback system. The Response-Clamp design was applied to control the probability of evoked spikes. Control of this response variable was shown to be applicable both when the target neuron is synaptically isolated from the rest of the network, and on the background of ongoing synaptic input. We further demonstrated the applicability of the technique to measure the impacts of network ongoing activity on the threshold of a single neuron, non-invasively, and for extremely long periods of time.
The Response-Clamp technique offers the potential of facilitating full characterization of the input–output relationships of the neuron. This challenge is practically intractable in open-loop due to the non-linearity of the system and the cumulative effect of underlying processes spanning a wide range of timescales. By manipulating well-defined features of the neuronal responsiveness, one may hope to control state-dependent dynamics, thus enabling the identification of the role of such processes in the overall behavior of the system.
Historically, the concept of feedback control proved effective in the analyses of excitability. It was first introduced in the voltage-clamp methodology (Hodgkin et al., 1952), where the subject of analysis is the controller’s output (the injected current) as a means to expose the dynamics of a hidden internal variable (mainly, voltage-dependent conductance). This approach was further advanced in the study of stochastic dynamics of single channels using the patch-clamp technique (Neher et al., 1978). Later, the dynamic-clamp experimental design was developed to artificially introduce different kinds of membrane conductances to the cell under study (Sharp et al., 1993). In the dynamic-clamp configuration, however, the subject of analysis is largely the membrane potential, as a means to expose the impacts of specific conductance components on the voltage dynamics; the output of the controller in the dynamic-clamp method is usually not the subject of analysis. In the response-clamp method presented here, the subject of analysis is the controller’s output (stimulation features) as a means to expose the dynamics of a hidden internal variable – for instance, the neuronal threshold. Thus, the response-clamp method is closer in spirit to the voltage-clamp rationale. Having said that, one should bear in mind that in the original voltage-clamp studies of action potential generation the variable under control (namely, membrane potential) determines the reaction rates of all the relevant processes, so that the closed-loop behavior becomes linear and time invariant. In contrast, in the dynamic-clamp method only a few components of the system are being controlled, with the hope of illuminating the role of these components in the overall behavior. Thus, in this context the method suggested here resembles the dynamic-clamp in the sense that only the processes that depend on the activity of the system are being clamped. Whichever way one chooses to look at the differences between voltage-clamp, dynamic-clamp, and response-clamp, the latter seems a natural step up the ladder of organizational levels, enabling control of neuronal response patterns at the macroscopic level, without monitoring underlying microscopic variables.
While the strength of the Response-Clamp method is its ability to expose the dynamics of a high level, functionally relevant variable (threshold), the method is insensitive to the actual underlying mechanism. In principle, any process affecting spike generation machinery might be reflected in the dynamics of the threshold revealed by the method. Having said that, it is reasonable to assume that the dynamics is mainly affected by availability of voltage-dependent conductances. In the case of the response latency clamp shown in Figure 8, relation to sodium channel inactivation is a compelling possibility.
A technical difficulty in the design of the Response Clamp must be noted. Unlike the membrane potential which may be monitored continuously, the neuron must be externally perturbed in order to estimate its state (i.e., responsiveness to stimulation). Therefore, the controller is always “one step behind” the system being controlled. Since these perturbations themselves affect the neuron’s responsiveness, a classic “observer effect” arises. This problem becomes more pronounced in the case of neural response probability, where the state is estimated using past spiking history. Future improvements of the state estimation process might incorporate compensation for the effects of external stimulation.
And finally, the Response Clamp described here may serve as a general framework for closed-loop study of input–output relations in neural systems; it could be implemented in any such system, be it in vitro or in vivo. Indeed, regardless of the neural system at hand, as long as a predictable reaction of the system to changes in stimulation parameters may be defined, Response Clamp is, in principle, applicable as a tool in both generating precise, repeatable activity patterns, and in monitoring the dynamics of hidden, internal variables. This may lead to new observations beyond the single neuron level, all the way up to monitoring and intervention in large-scale sensory-motor loops in health and disease.
Conflict of Interest Statement
The authors declare that the research was conducted in the absence of any commercial or financial relationships that could be construed as a potential conflict of interest.
Acknowledgments
The authors thank Erez Braun, Naama Brenner, Danni Dagan, Steve Goldstein, Ron Meir, Nahum Shimkin, Effraim Wallach, and Noam Ziv for their useful comments and suggestions. The research leading to these results has received funding from the European Union’s – Seventh Framework Programme FP7/2007-2013 under grant agreement # 269459 and was also supported by a grant of the Ministry of Science and Technology of the State of Israel and MATERA grant agreement # 3-7878.
References
Arsiero, M., Lüscher, H., and Giugliano, M. (2007). Real-time closed-loop electrophysiology: towards new frontiers in in vitro investigations in the neurosciences. Arch. Ital. Biol. 145, 193.
Badel, L., Lefort, S., Brette, R., Petersen, C., Gerstner, W., and Richardson, M. (2008). Dynamic IV curves are reliable predictors of naturalistic pyramidal-neuron voltage traces. J. Neurophysiol. 99, 656.
Beggs, J., and Plenz, D. (2003). Neuronal avalanches in neocortical circuits. J. Neurosci. 23, 11167.
Bonifazi, P., Ruaro, M., and Torre, V. (2005). Statistical properties of information processing in neuronal networks. Eur. J. Neurosci. 22, 2953–2964.
Elul, R., and Adey, W. (1966). Instability of firing threshold and “remote” activation in cortical neurones. Nature 212, 1424–1425.
Eytan, D., and Marom, S. (2006). Dynamics and effective topology underlying synchronization in networks of cortical neurons. J. Neurosci. 26, 8465.
Gal, A., Eytan, D., Wallach, A., Sandler, M., Schiller, J., and Marom, S. (2010). Dynamics of excitability over extended timescales in cultured cortical neurons. J. Neurosci. 30, 16332–16342.
Golomb, D., Yue, C., and Yaari, Y. (2006). Contribution of persistent Na+ current and M-type K+ current to somatic bursting in CA1 pyramidal cells: combined experimental and modeling study. J. Neurophysiol. 96, 1912.
Heck, D., Rotter, S., and Aertsen, A. (1993). “Spike generation in cortical neurons: probabilistic threshold function shows intrinsic long-lasting dynamics,” in Brain Theory: Spatio-Temporal Aspects of Brain Function, ed. A. E. Aertsen (Amsterdam: Elsevier Science Ltd), 241–249.
Hodgkin, A., Huxley, A., and Katz, B. (1952). Measurement of current-voltage relations in the membrane of the giant axon of Loligo. J. Physiol. 116, 424.
Jimbo, Y., Kawana, A., Parodi, P., and Torre, V. (2000). The dynamics of a neuronal culture of dissociated cortical neurons of neonatal rats. Biol. Cybern. 83, 1–20.
Kobayashi, R., Tsubo, Y., and Shinomoto, S. (2009). Made-to-order spiking neuron model equipped with a multi-timescale adaptive threshold. Front. Comput. Neurosci. 3:9. doi: 10.3389/neuro.10.009.2009
Marom, S., and Shahaf, G. (2002). Development, learning and memory in large random networks of cortical neurons: lessons beyond anatomy. Q. Rev. Biophys. 35, 63–87.
Neher, E., Sakmann, B., and Steinbach, J. (1978). The extracellular patch clamp: a method for resolving currents through individual open channels in biological membranes. Pflugers Arch. 375, 219–228.
Sharp, A., O’Neil, M., Abbott, L., and Marder, E. (1993). Dynamic clamp: computer-generated conductances in real neurons. J. Neurophysiol. 69, 992.
Wagenaar, D., Madhavan, R., Pine, J., and Potter, S. (2005). Controlling bursting in cortical cultures with closed-loop multi-electrode stimulation. J. Neurosci. 25, 680.
Wagenaar, D., Pine, J., and Potter, S. (2004). Effective parameters for stimulation of dissociated cultures using multi-electrode arrays. J. Neurosci. Methods 138, 27–37.
Keywords: neuron, clamp, closed-loop, threshold, firing rate
Citation: Wallach A, Eytan D, Gal A, Zrenner C and Marom S (2011) Neuronal response clamp. Front. Neuroeng. 4:3. doi:10.3389/fneng.2011.00003
Received: 29 November 2010;
Accepted: 15 March 2011;
Published online: 06 April 2011.
Edited by:
Stefano Ferraina, Sapienza University of Rome, ItalyReviewed by:
Paolo Del Giudice, Italian National Institute of Health, ItalySteve M. Potter, Georgia Institute of Technology, USA
Michele Giugliano, University of Antwerp, Belgium
Copyright: © 2011 Wallach, Eytan, Gal, Zrenner and Marom. This is an open-access article subject to a non-exclusive license between the authors and Frontiers Media SA, which permits use, distribution and reproduction in other forums, provided the original authors and source are credited and other Frontiers conditions are complied with.
*Correspondence: Avner Wallach, Network Biology Research Laboratories, Lorry Lokey Interdisciplinary Center for Life Sciences and Engineering, Technion – Israel Institute of Technology, Technion, Haifa 32000, Israel. e-mail: avnerw@tx.technion.ac.il