Detailed characterization of local field potential oscillations and their relationship to spike timing in the antennal lobe of the moth Manduca sexta
- 1 Department of Biology, West Virginia University, Morgantown, WV, USA
- 2 Department of Neurosciences, Case Western Reserve, Cleveland, OH, USA
The transient oscillatory model of odor identity encoding seeks to explain how odorants with spatially overlapped patterns of input into primary olfactory networks can be discriminated. This model provides several testable predictions about the distributed nature of network oscillations and how they control spike timing. To test these predictions, 16 channel electrode arrays were placed within the antennal lobe (AL) of the moth Manduca sexta. Unitary spiking and multi site local field potential (LFP) recordings were made during spontaneous activity and in response to repeated presentations of an odor panel. We quantified oscillatory frequency, cross correlations between LFP recording sites, and spike–LFP phase relationships. We show that odor-driven AL oscillations in Manduca are frequency modulating (FM) from ∼100 to 30 Hz; this was odorant and stimulus duration dependent. FM oscillatory responses were localized to one or two recording sites suggesting a localized (perhaps glomerular) not distributed source. LFP cross correlations further demonstrated that only a small (r < 0.05) distributed and oscillatory component was present. Cross spectral density analysis demonstrated the frequency of these weakly distributed oscillations was state dependent (spontaneous activity = 25–55 Hz; odor-driven = 55–85 Hz). Surprisingly, vector strength analysis indicated that unitary phase locking of spikes to the LFP was strongest during spontaneous activity and dropped significantly during responses. Application of bicuculline, a GABAA receptor antagonist, significantly lowered the frequency content of odor-driven distributed oscillatory activity. Bicuculline significantly reduced spike phase locking generally, but the ubiquitous pattern of increased phase locking during spontaneous activity persisted. Collectively, these results indicate that oscillations perform poorly as a stimulus-mediated spike synchronizing mechanism for Manduca and hence are incongruent with the transient oscillatory model.
Introduction
Odor stimulation drives a combinatorial spatio-temporal response in first-order olfactory processing centers, the insect antennal lobe (AL), and the vertebrate olfactory bulb (OB). Several aspects of these physiological responses have been correlated with an animal’s ability to discriminate between even subtly different odorant stimuli in behavioral assays (Stopfer et al., 1997; Daly et al., 2001; Linster et al., 2001; Wright et al., 2002; Galán et al., 2004). For example, odor can drive local field potential oscillations (LFPOs) at species-specific frequencies (Gelperin and Tank, 1990; Heinbockel et al., 1998). Superimposed on these LFPOs are what has been described as slower temporal patterns of action potentials among populations of principal output cells of the AL/OB (for review see Laurent et al., 2001). At least a subset of action potentials from these responses has been shown to correlate to a specific phase range (i.e., phase lock) of the LFPOs in the locust (Laurent and Davidowitz, 1994; Laurent and Naraghi, 1994; Laurent et al., 1996a,b, 2001; MacLeod and Laurent, 1996; Wehr and Laurent, 1996).
Selective disruption of GABAA receptor signaling in the locust AL interferes with fast inhibitory synaptic interactions, thereby disrupting odor-driven oscillations in the AL and its primary projection fields (MacLeod and Laurent, 1996). Disruption of GABAA mediated oscillations also appears to affect discrimination of closely related monomolecular odors in mouse and honeybee (Stopfer et al., 1997; Nusser et al., 2001). Thus, based on comparative data from locust (Laurent and Davidowitz, 1994; Laurent and Naraghi, 1994; Wehr and Laurent, 1996, 1999), honeybee (Stopfer et al., 1997), zebra fish (Friedrich and Laurent, 2001), and mice (Nusser et al., 2001), a general model of olfactory encoding has been proposed, positing that stimulus driven LFPOs synchronize transiently active spiking responses across a distributed network of principal output cells in order to mediate enhanced odor discrimination over time in downstream brain centers, such as the insect mushroom bodies (MB; for review see Laurent, 2002).
However, odor discrimination is also correlated with more parsimonious encoding models such as odor dependent patterns of spike bursting (Stopfer et al., 2003; Daly et al., 2004b; Lehmkuhle et al., 2006), which optimize on a relatively shorter time scale (ca. ∼140–240 ms after stimulus onset). This rapid timescale is consistent with correspondingly rapid and accurate behavioral responses in discrimination tasks in both insects and mammals (Uchida and Mainen, 2003; Budick and Dickinson, 2006; Wesson et al., 2008a,b). Spatial mapping of odorant responses in the OB and AL suggest that fine odor discrimination can be largely accounted for by subtle differences in glomerular input patterns alone (Johnson et al., 1998, 1999, 2005; Linster et al., 2001; Galán et al., 2004). Consistent with the notion that both spatial and temporal processes contribute to odor discrimination, we have recently shown that both odor dependent spatial patterns of glomerular output and spatio-temporal sequences of activations of these glomeruli can be observed during a response (Staudacher et al., 2009). In this case temporal patterns evolved over a ∼120-ms response window in an odor dependent manner. However, when data are collapsed across time, the spatial pattern alone remains odor dependent. Thus even within a given species, there are odor dependent spatial and temporal components that correlate to an animal’s ability to discriminate.
The goal of the current study therefore was to better characterize oscillatory dynamics within the AL of the moth Manduca and to specifically establish whether odor-driven oscillations drive spike timing in a manner consistent with the transient oscillatory model. Specifically, we wanted to test the following predictions of this model: (1) Odor-driven LFPOs should be distributed across the AL; (2) The frequency content of these oscillations are: (a) of a consistent and stable frequency; (b) independent of the odor delivered and (c) occur reasonably consistently in response time across stimulus repeats; (3) unitary spiking responses should phase lock to oscillations; (4) this phase locking should be enhanced during odor-driven responses, relative to spontaneous activity; and (5) the local inhibitory network should establish oscillatory activity in the field and hence affect precise spike timing. To test these hypotheses, we placed 16 channel silicon microelectrode arrays within the AL to record spatial and temporal patterns of spiking activity across ensembles of sorted neural units. In addition, we recorded local field potentials (LFP) in multiple locations across the electrode array to investigate whether responses were localized or distributed. These recordings were made during both spontaneous activity and in response to odor stimulation in order to compare oscillatory and spiking activity during spontaneous epochs (i.e., ongoing processes of an active system), and during odor-driven responses. This allowed us to test whether the evolution of odor-driven oscillatory activity was associated with increased phase locking of individual cells. Finally, in order to address the functional role of local inhibition, the above observations were made before and during GABAA receptor blockade.
Materials and Methods
Moths
Male Manduca moths were reared at West Virginia University using standard rearing procedures (Bell and Joachim, 1976). At stage 18 of pupal development, pupae were placed individually into paper bags and stored in a Percival incubator at 25°C with a reversed 16:8 LD cycle and 75% relative humidity. Moths were allowed to develop 5–7 days post eclosion, prior to experimental use; this ensures complete development of the AL and is consistent with our other behavioral studies.
Neurophysiological Preparation
The method used for preparing moths has been described in detail elsewhere (Daly et al., 2004a,b). Briefly, individual moths were placed into a 14-mm ID copper tube and their heads firmly fixed to this tube with molten soft dental wax. An approximately 2 mm2 window was cut into the top center of the head capsule. Next, cuts were made around the perimeter of the bilateral pair of pharyngeal dilator muscles (again ∼2 mm2). The pharyngeal dilator muscles with attached head capsule cuticle were then slid forward into the previously cut window. The repositioned section of cuticle was then glued into position with superglue. By moving these feeding muscles, the brain can be directly accessed while leaving the animal functionally completely intact (Daly et al., 2004a). The prepared moth was then positioned on an air table and standard physiological saline was applied to the opened head to remove hemolymph and keep the brain moist. The flagellum of the ipsilateral antenna was then placed into a glass sleeve (ID 2.5 mm), which was connected to an olfactometer. Finally, the 16 channel electrode array (Neuronexus 2 × 2 tet) was placed into the AL using a high resolution motorized micromanipulator and controller (WPI HS6-3) under visual control. The probes were placed along a visually identifiable anatomical boundary between the AL and the rest of the brain, so that the probe array was located at the very caudal boundary of the AL. The depth of the deepest electrode in the array was between 500 and 600 μm, although this varied somewhat from moth to moth and was optimized for each recording. The completed preparation provided stable recordings for several hours. All recordings were performed between 1 and 4 h after the start of the moth’s subjective night when they are normally active.
Odor and Drug Delivery
Three microliters of monomolecular odorants were individually placed, undiluted, onto a ∼3-mm × 30-mm strip of Whatman filter paper and placed into a ∼1.7-ml glass cartridge (see Table 1 for odor list). The cartridge ends were made of 1/16 in ID nylon luer fittings. Prepared cartridges were then connected to the odor delivery system such that the cartridge was only 2 cm from the tip of the antenna. Under normal conditions, dried and charcoal filtered air passed through the air supply tubing to the antenna at a velocity of 280 cm/s. This velocity was more than sufficient to minimize boundary layer effects around the antenna’s sensilla, yet well within the normal flight speed of this moth (Stevenson et al., 1995). To stimulate with odor, clean air was shunted from the normally open line, which blows constantly on the antenna, to a second line which contained the odor cartridge, via a three-way valve (The Lee Co., model LFAA1200118H). The clean air and odor lines then merged into a T. The third arm of the T connected to the glass sleeve, in which the antennal flagellum had previously been inserted. Thus, air from either the clean air line or the odor line was continuously flowing over the flagellum.
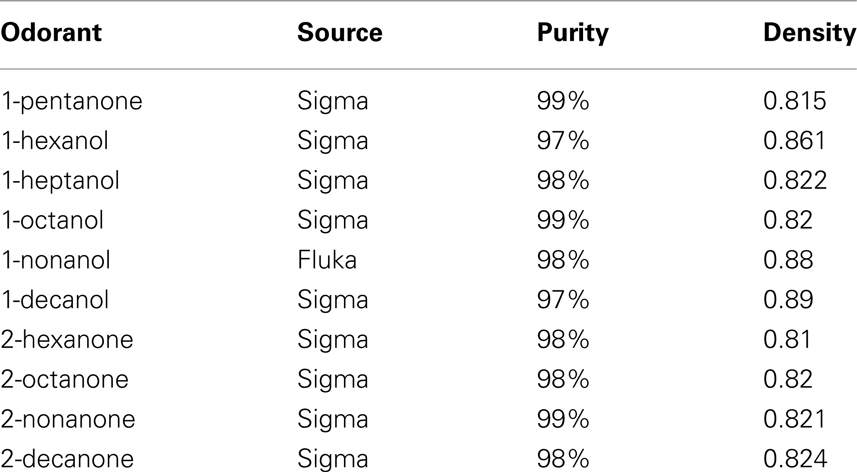
Table 1. List of odorants used.
Nine monomolecular odors were presented separately in random order. Each odorant was presented in 20 consecutive 100 ms pulses, each pulse spaced by 10 s. One hundred millisecond pulses were used based on empirical evidence indicating that this is the approximate mean exposure time for moths in the natural outdoor environment (Murlis and Jones, 1981) and a 10-s inter stimulus interval is sufficient to eliminate any modulation of responses due to repeated exposures in this model system (Daly et al., 2004b; Staudacher et al., 2009). This presentation scheme was repeated prior to, during and following bath application of 200 μM bicuculline methiodide (BMI) in physiological saline solution. This dose level has been shown to be effective in this (Waldrop et al., 1987; Christensen et al., 1998) and other insect species (Stopfer et al., 1997; Hosler et al., 2000). Drug treatment was initiated 10 min prior to the start of the second block of odor stimulations.
In a subset of two recordings, we also varied stimulus duration (50, 100, 500, and 1000 ms) to assess the effect of both briefer and more prolonged stimulation on the patterns of oscillatory activity. In this case we presented a restricted number of odors and did not apply GABAA receptor antagonists. We again presented 20 repeats of each stimulus/duration; each stimulus was again spaced by 10 s.
Physiological Recording and Spike Sorting
Data from the four tetrodes on the electrode array were recorded using a 24 channel Neuralynx amplifier array and Cheetah data acquisition and stimulus control software. Spike data were recorded at 32 kHz using the tetrode sampling technique and local field recordings were sampled at 10.7 kHz from one electrode in each of the four tetrodes. Figure 1A highlights the approximate size relationship of the AL with the microelectrode array and identifies the relative position of the LFP recording sites on the array. In this case, LFP recordings were made from the top and bottom-most electrode sites to provide the greatest vertical coverage (250 μm deep by 200 μm wide); note that this represents approximately one-half the width of the AL. Spike channels were amplified between 2000 and 10,000 times, whereas all LFP recordings were amplified 2000 times. Hardware band pass filter settings were 600–6000 Hz for spike data and 1–125 Hz for LFP data.
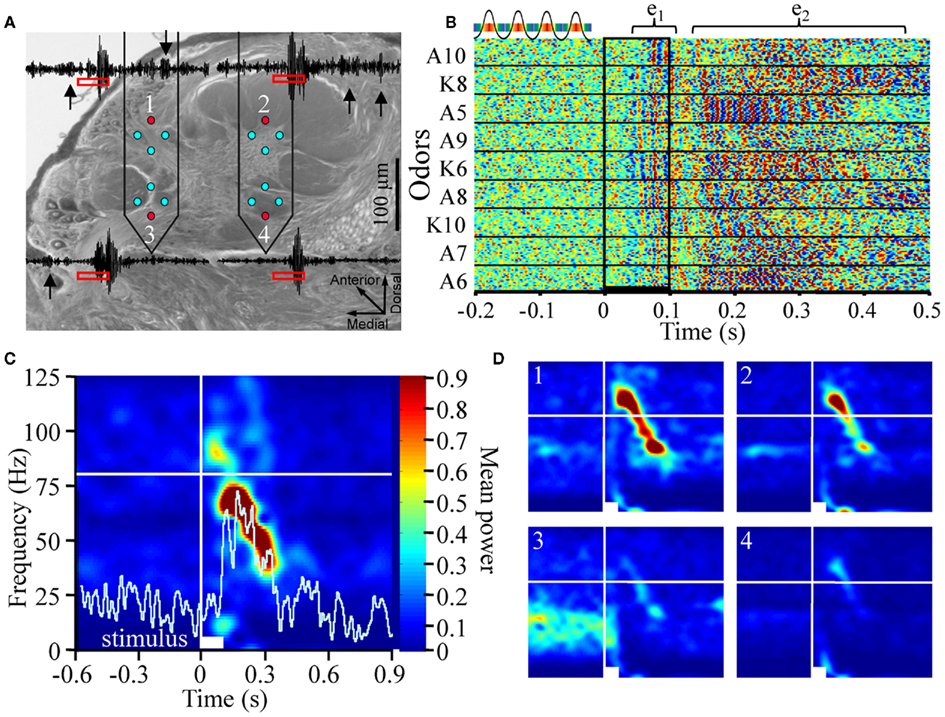
Figure 1. Odor-driven oscillations are frequency modulating and localized to a subset of recording sites (A). Schematic of the multichannel electrode array configuration within the antennal lobe (AL; Cason stain). Neuronexus two-shank 2 × 2 tetrode silicon electrodes array, each shank containing eight electrodes, which are arrayed into two tetrodes (for tetrode sampling of spiking activity), are placed into the AL. One electrode from each tetrode was used to record local field potentials (LFP; red circles). This provided four parallel LFP recordings (inset) from across the AL. Note in these example traces, which have been band pass filtered to highlight 25–100 Hz that there are several instances of spontaneously occurring “bouts” of oscillatory activity (inset black arrows). (B) Rasterized peri-stimulus LFP traces from 20 presentations of 9 different alcohols and ketones. Each trace has been converted to a one dimensional color coded line to indicate whether the voltage was high (reds) or low (blues; see above inset). All 180 responses are aligned by stimulus onset (stimulus duration indicated by vertical black lines) and stacked to create a single composite panel. Odors are separated by black horizontal lines and identified (left of panel) by moiety (A = alcohol; K = ketone) and carbon chain length (5–10). Highlighted above are two distinct oscillatory response epochs; an early phase (e1), and a later phase (e2). (C) Averaged time frequency response spectrogram showing consistent oscillatory power (normalized color scale) as a function of frequency (Y-axis) and peri-stimulus time (X-axis) for a single odor (1-pentanol). Displayed are the averaged results of 20 independent TFR analyses for each of the 20 presentations 1-pentanol. Inset white bar (bottom) indicates stimulus duration. Vertical white line indicates odor onset. Horizontal white line is an 80-Hz frequency reference. Inset histogram (light blue) is the corresponding mean population spiking response to highlight the relationship between the onset and duration of the spiking response and the oscillations. (D). Comparison of the spectrogram results from the four parallel recording sites in response to 2-octanone. Inset numbers correspond to electrode recording site shown in (A). Power is normalized to the same range to make panels directly comparable. All panels are scaled and referenced as in (C).
Spikes were sorted in Matlab using the BubbleClust toolbox supplied by Neuralynx. This tool box implements a kth nearest neighbor algorithm in a 12 dimensional spike waveform feature space. BubbleClust identified clusters of spikes that were subsequently assessed and “cleaned” manually based on a number of descriptive and parametric statistics used to assess the overall quality and statistical separation of each cluster (see Daly et al., 2004b for complete description). Only those clusters that were significantly distinct from all other clusters and stable for the duration of the recording were considered for further analysis.
Local field potential recordings were re-filtered off-line via a windowed-sync FIR band pass filter provided by Neuralynx, using a rectangular smoothing window and 800 taps. This filtering procedure caused a linear phase lag that was then corrected to ensure accurate alignment of the LFPs with the spike data. Results were compared to several other filter implementations (including Butterworth and Chebyshev filters) to confirm that any oscillatory activity was not attributable to filtering artifacts, such as ringing. All implementations produced essentially identical results. Finally, for time frequency analysis (below) we also implemented a 60-Hz (±2 Hz, unless otherwise noted) windowed-sinc notch filter to the LFP data to remove line noise.
Analysis
Several analytic techniques were used in order to quantify the relationship between parallel recorded LFPOs and between LFPOs and unitary spiking. These methods include LFP–LFP and unit–LFP cross correlations, vector strength analysis, power spectral density (PSD), cross spectral density (CSD), and time frequency response spectrograms (TFRs). In all cases a 1-ms binning window was used unless otherwise noted and all calculations were performed in either MATLAB or Neuroexplorer. Statistical analyses of the data generated from these methods were performed in MATLAB and SAS.
First, in order to characterize the frequency content of odor-driven oscillations, TFR spectrograms were generated via the Short Time Fourier Transform method. TFRs were calculated with the “tfrsp” function in the Time Frequency Toolbox for Matlab (freely available from the Centre National de la Recherche Scientifique at http://tftb.non-gnu.org). This analysis was performed on individual responses to odor stimulation and the results averaged to highlight consistent oscillations whilst averaging out inconsistent oscillatory activity. Because TFRs were calculated individually for each response, then averaged across repeats, the approach abstracts from (and is hence tolerant of) variation in oscillatory phase between stimulus-aligned traces. This is important because averaging of raw oscillations from repeated trials for example could potentially cancel out oscillations that are not phase aligned across trials. TFR results were z-score normalized to highlight possible differences in frequency content and relative amplitude across the four LFPO recording sites (see Figure 1A). Normalization also allowed comparison of pre- versus post- GABAA receptor blockade in order to highlight changes in frequency content for these specific comparisons.
To assess whether each odorant produced a unique frequency modulating (FM) sweep pattern (i.e., differences in frequency range, onset/offset, and duration) we implemented a discriminant analysis using a supervised classification approach. Specifically we used the support vector classifiers method (Boser et al., 1992; Galán et al., 2004; see also Methods in Appendix). Here the goal was to determine if TFR’s generated from individual odor responses could be classified accurately into odor groups based on the multidimensional shape of the FM sweep. Briefly, we first implemented a data reduction step. This involved cropping the TFRs generated from each individual stimulus to a 12 to 124-Hz frequency range, and a −30 to 1000-ms time range and then defined a region of interest (ROI) within each TFR, consisting of all pixels that were above the 99th percentile of power density. Next we generated a filtering mask which represented all pixels from all odors that were above the 99th percentile and applied it to all TFRs. This data reduction step effectively selects all significant frequency–time content both within odor repeats and between different odorants and removes all irrelevant data. We then implemented the support vector classifiers using both a linear and third order polynomial kernel functions. This analysis was performed on two recordings. Finally, we calculated an experiment wide 95% confidence interval to identify classification performance as significantly above chance.
In order to statistically quantify differences in odor-driven spectral content prior to and during GABAA receptor blockade, PSD analysis was performed. For this analysis we calculated the PSD for each odor-driven response in a 1000-ms window starting at stimulus onset. Note that in response to a 100-ms stimulus, TFR analysis indicated that most evidence of odor-driven oscillatory activity terminated within ∼500 ms, thus all odor-driven oscillatory activity should be encapsulated within this 1000 ms window. Furthermore, TFR analysis indicated that odor-driven responses were typically no higher than 100 Hz, thus PSD analysis was performed on a 1 to 100-Hz frequency range, in 0.5 Hz steps using Neuroexplorer. Resulting PSD data were then statistically analyzed using ANOVA in SAS to determine if spectral power at each frequency step was affected by GABAA receptor blockade.
To quantify the precise relationship between LFPs recorded from different sites across the AL, we calculated all possible pair wise LFP–LFP cross correlations. For this analysis, a ±100-ms sliding window was used and data was sampled from spontaneous and odor-driven activity (−1000 to 0 and 0 to 1000 ms respectively; time relative to stimulus onset). This analysis was performed individually for each stimulus presentation, both before and during GABAA receptor blockade, for all recordings. The cross correlation not only indicates whether any two traces are correlated, but also highlights any temporal structure of that correlated activity. In order to extract and quantify the temporal structure embedded in the cross correlation, CSDs were calculated for each individually calculated cross correlation. CSDs specifically measure the relative power of any periodic structure present in the cross correlation, hence the CSD quantifies oscillatory activity that is distributed across the two recording sites used for a given cross correlation. Results of the CSD analysis were then statistically analyzed using ANOVA in SAS to determine if distributed power at each frequency step varied as a function of spontaneous versus odor-driven sampling time, and as a function of GABAA receptor blockade.
We used two related methods to quantify the phase relationship between unitary spiking patterns and the LFPO, as both a function of spontaneous and odor-driven responses, and as a function of GABAA receptor disruption. First, the instantaneous phase of the LFP was calculated in MATLAB as the analytical phase of the signal, i.e., as the instantaneous angle of the complex time series obtained from the Hilbert transform of the LFP. Results of this analysis provided a visual display, as a series of histograms for each cell, highlighting the distribution of spikes relative to oscillatory phase. Our second approach was to use vector strength analysis. Vector strength quantifies the degree to which unitary spiking activity exhibits a tendency to occur at a particular phase of the LFPO by calculating the reciprocal of the circular variance of the distribution of phases of sampled spikes to the LFP; this was also performed in MATLAB. For this analysis data was sampled from three peri-stimulus epochs; spontaneous activity prior to stimulation (−300 to 0 ms), an early response epoch (50–350 ms), and a late response epoch (350–650 ms). Note that 0–50 ms was not considered in this analysis to account for the time lag between when the odor valve opened and the earliest physiological evidence of AL responses. Furthermore, because preliminary results indicated that odor-driven oscillatory activity was relatively broad band and in a different frequency range than what was observed during spontaneous activity, we performed the vector strength analysis on LFP data that was band pass filtered to highlight two frequency domains; low (25–55 Hz) and high (55–85 Hz). Filtering LFP oscillations into narrower pass bands results in a less complex wave and hence allows more accurate calculation of spike phase. Filtering also allows segregation and characterization of phase locking in the separate frequency domains. Subsequently, ANOVA was used to determine whether vector strength was dependent on: peri-stimulus time (i.e., pre, early, and late response epochs), the odorant used, and, GABAA receptor blockade. Analysis was performed after accounting for random effects such as individual recording (moth) and individual differences between spiking units. Finally, the filter implementation (low versus high frequency pass band) was also included in the statistical model to establish whether the different pass bands produced statistically similar results.
Finally, to establish whether vector strength values were above what might be expected by chance, these values were recalculated for one of the recordings using a bootstrapping method, whereby spike times were first jittered randomly within a series of time ranges from ±1 to ±10 ms in 1 ms steps (spikes were re-jittered 30 times for each step in the jitter width). Results were statistically analyzed using ANOVA in SAS to determine if vector strength was dependent on the amount of jittering for the three peri-stimulus epochs.
Results
Odor-Driven Oscillations are Frequency Modulating and Typically Localized to a Subset of Recording Sites
The transient oscillatory model of odor identity encoding posits that odor stimulation should produce a reasonably narrow (hence stable) frequency band of oscillatory activity, which is distributed across much if not all of the AL. This prediction is based on the morphological characteristics of LNs, which arborize broadly and mediate oscillatory activity. The model furthermore predicts that the elicited frequency should be independent of the odorant presented (Laurent and Davidowitz, 1994; Laurent et al., 1996a). A stable response frequency that is independent of varying stimuli is an important aspect of this model because the second-order olfactory center, the MB, are proposed to integrate inputs from the AL across a limited time window defined by delayed feed-forward inhibition from the lateral horn (Laurent, 2002; Perez-Orive et al., 2002). Therefore, we detailed the precise nature of the oscillatory activity in the AL of Manduca to determine if these criteria could be met.
Figure 1A is a schematic depicting the approximate positioning and size of the electrode array in the AL. This figure also highlights which electrodes from the 16 channel array were used for LFP recordings. In this case, we made parallel LFP recordings from the highest two and lowest two recording sites (shown in red), during periods of spontaneous activity and in response to odor stimulation. Superimposed on Figure 1A are peri-stimulus LFP traces representing a range of typical 25–100 Hz oscillations. These oscillations occur both spontaneously (black arrows) and in response to a 100-ms odor presentation (stimulus highlighted by red rectangles). Note that oscillations can be clearly observed during spontaneous activity on three of the four traces, albeit at a lesser amplitude than those observed during an odor-driven response. This suggests that oscillations are an ongoing product of a spontaneously active system.
Figure 1B displays rasterized peri-stimulus LFP traces from a single LFP electrode in response to the 20 repeats of each of the nine odors used, thus comprising a total of 180 rows of LFP data. First, in the 200-ms prior to odor stimulation, there is again evidence of spontaneous oscillations as indicated by the random “peppering” of interleaved red and blue “blips” in the horizontal (i.e., time) axis. The presence of spontaneous oscillatory field activity should not be particularly surprising given the spontaneously active nature of the insect AL (Perez-Orive et al., 2002; Stopfer et al., 2003; Daly et al., 2004b).
However, in the presence of odor, LFPOs become both larger in amplitude and in some cases coherent across repeats when aligned by the onset of odor stimulation. For example, inter-trial coherence can be seen in Figure 1B by the prominent vertical striping of blue and red across the 20 repeats of each odor as well as across odors in some instances. This indicates that consecutive oscillation peaks (red) and valleys (blue) were phase aligned from response to response. This “inter-trial coherence” across stimulus repeats is most prominent for 1-pentanol (A5) between 150 and 300 ms post stimulus onset. Figure 1B also suggests that odor-driven oscillations have two distinct epochs; these epochs are highlighted by inset brackets labeled e1 and e2. Early phase high frequency oscillations (e1) emerge reasonably consistently (∼60 ms post stimulus onset) and last for ∼50 ms. Early phase LFPO’s appear to some degree for most odors. This early phase oscillation precedes onset of the odor-driven I1, a bicuculline sensitive, fast inward Cl− conductance observed in Manduca PNs (Waldrop et al., 1987; Christensen et al., 1998). The I1 phase occurs prior to spiking responses of PNs. Thus, based on the timing of early phase oscillations, they likely relate to sensory cell input and early synaptic processing that occurs prior to the onset of PN spiking responses.
Starting no earlier than ∼120 ms is a second bout of high frequency LFPOs (e2), which appear less coherent in response time, though exceptions exist (again see responses to 1-pentanol). These later phase oscillations tend to be odor dependent. However, it is not always apparent, using this visualization method, whether odor-driven e2 oscillatory activity is consistent from trial to trial in terms of onset, frequency, and/or phase.
To establish whether odor-driven oscillations are consistent in response time and produce a reasonably stable frequency, thereby providing a faithful temporal encoding mechanism that is independent of odor identity (Laurent and Davidowitz, 1994; Laurent and Naraghi, 1994), we calculated TFRs. Figure 1C displays the averaged results of 20 separate TFR analyses performed on each of the 20 presentations of 1-pentanol; results are based on a single recording site. Power was normalized to a probability distribution and color coded. The first and most striking observation is that odor stimulation drives an oscillatory response that is FM. In response to all 9 odors for all 10 moths in the study (1,800 total odor presentations) we observed that odor-driven oscillatory responses produced a high-to-low frequency sweep that typically ranged from 80 to 100 Hz peak frequency down to 20–40 Hz. Superimposed on this TFR is the corresponding peri-stimulus histogram, highlighting the summed spiking response for all units in the corresponding population. Results were then averaged across the 20 stimulus repeats. Consistent with the above observation that oscillatory activity precedes spiking activity in AL neurons, Figure 1C shows that high frequency oscillatory activity precedes the population spiking response by ∼60 ms in this case.
Across the 10 moths used for this analysis, odor-driven FM oscillatory responses were also spatially localized. Figure 1D displays typical TFRs generated from the four parallel LFP recording sites from a single animal in response to 20 presentations of 2-octanone. In Figure 1D, the upper left electrode (1) recorded an FM sweep starting at ∼60 ms post stimulus onset and a peak frequency of 100 Hz. The frequency of this oscillation then modulated down to 35 Hz by 400 ms post stimulus onset. This pattern is evident in the upper right electrode (2) as well, although the relative power was lower. In the lower two electrodes (3 and 4) however, almost no evidence of this FM oscillation was present. As highlighted in Figure 1D electrode 3, there were also consistent spontaneous 20–50 Hz oscillations that were interrupted upon odor stimulation; this form of spontaneous oscillatory activity was observed in at least one of the LFP recording sites for 6 of the 10 moths that we analyzed using the TRF method (see Figure A1 in Appendix for examples from all six recordings). As suggested by the raw traces in Figure 1A, these ongoing oscillations tended to be spontaneous but intermittent; this accounts for the patchy power structure observed in Figure 1D. Thus, while 2.7 ± 1.15 (mean ± SD) recording sites exhibiting oscillatory activity of some sort, only 1.8 ± 1.2 (mean ± SD) recording sites actually displayed the same odor-driven FM response patterns as seen in electrodes 1 and 2. Contrary to the predictions made of the transient oscillatory model, this suggests that odor-evoked oscillations that were FM and typically constrained to a sub region of the AL.
Odor-Driven Oscillations Modulate in a Stimulus Specific Manner
As mentioned above, the transient oscillatory model posits that the oscillations should be frequency invariant across different odors (Laurent and Davidowitz, 1994; Laurent et al., 1996a). TFR results, however, suggest that odor-driven FM LFPOs were dependent on both the physical features of the odorant molecules used as well as the duration that a test odorant was presented. Figure 2A displays TFRs from a single recording electrode in response to each of the nine odors used (see also Figure A2A in Appendix). Responses driven by both the short chain alcohols and ketones exhibited a maximum frequency of approximately 100–105 Hz. As the carbon chain length of the stimulus was increased the peak frequency at response onset appeared to drop. For example, Figure 2 shows a maximum frequency of approximately 85–95 Hz when the moth was stimulated with 1-decanol and 2-decanone respectively. The duration of the oscillatory response also increased with carbon chain length. Note for example, the longer chain odors modulate more slowly, in the case of K10 the response persists across the time window whereas the shorter chain odors do not. Finally, this implies that the rate of the FM sweep (that is, how long it took to modulate from high-to-low frequency), is slower with the longer carbon chain odors. This resulted in a shallower and more prolonged downward sweep.
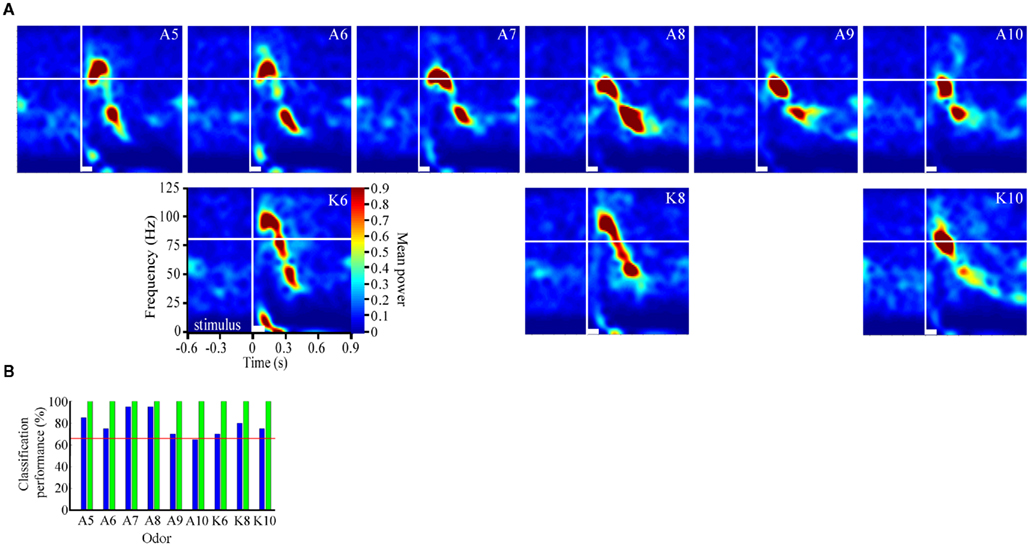
Figure 2. Odor-driven oscillations modulate in an odor-specific manner. (A) Time frequency response spectrograms calculated as a function of changing molecular features of the stimulus. All panels are the result of TFR analyses that were calculated, normalized, and presented as described in Figure 1. Each panel represents the averaged TFR result for a single odorant (inset and identified as described in Figure 1). Note that alcohols and ketones of common length are aligned into columns. Note that with the longer carbon side chains, the initial peak frequency is decreased by ∼15–20 Hz and the FM sweep appears both slower and longer in duration (see also Figure A2 in Appendix). (B) Results of the discriminant analysis, showing classification performance for each odorant as a function of both the linear (blue bars) and polynomial discriminant functions (green bars). Red line highlights the 95% confidence limit and hence identifies those odorants for which the linear and third order polynomial kernel functions were able to accurately classify significantly better than chance. Note that while the linear kernel in this case was not able to classify A10 significantly better than chance, the polynomial kernel could discriminate all odors with 100% accuracy (see also Figure A2 in Appendix).
To assess the odor dependency of FM responses we performed a discriminant analysis using support vector classifiers and implementing both a linear and polynomial discriminant (or kernel) function on a subset of two recordings. The results of this analysis for the dataset shown in Figure 2A are displayed in Figure 2B (for the second example see Figure A2 in Appendix). The linear discriminant function (blue bars) was able to accurately discriminate all odors significantly above chance (red line indicates 95% confidence level) for all but a single odor (A10), whereas the polynomial function (green bars) effectively classified with 100 percent accuracy for all odors. This indicates that each odorant produced a unique frequency response “signature.” This odor dependency can be interpreted as either volatility-dependent or carbon chain length-dependent. In either case, these results indicate that the qualitative nature of the oscillation is clearly stimulus-dependent.
In two moths we also varied stimulus duration for a subset of odors. Figure 3 displays TFRs results from an individual recording site where the odor 2-hexanone was presented 20 times for each of four different stimulus durations, ranging from 50 to 1000 ms. Note that there is a stimulus duration dependent elongation of the FM sweep; this was observed in both moths where duration was manipulated. Thus again, in contrast to theoretical expectations, the frequency content, and rate of modulation are clearly affected by the odorant used as well as the duration of the stimulus.
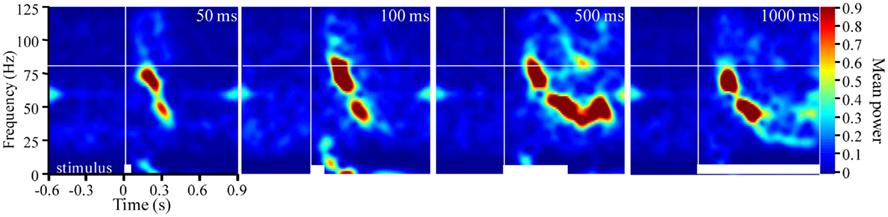
Figure 3. Frequency modulation is dependent on stimulus duration. Stimulus averaged TFR spectrograms for a single odor (2-hexanone) presented for durations ranging from 50 to 1000 ms (20 presentations/duration). White bars at the bottom of each panel indicate stimulus duration. Vertical and horizontal white lines reference stimulus onset and 80 Hz respectively. Note that with increased stimulus duration there are more prolonged FM sweeps.
Correlated Field Activity is State Dependent and Only Weakly Periodic
The observation that odor-driven FM oscillations are localized to a subset of recording sites does not necessarily imply the absence of more subtle distributed oscillatory activity that the TFR method was unable to quantify. Another method for identifying distributed activity across the four LFP recording sites was to directly compare pairs of sites using cross correlation analysis. Results of this analysis revealed that while different recording sites are in fact moderately to highly correlated, this correlation decays rapidly in time, producing very little evidence of periodic structure.
For example Figure 4A displays the cross correlation between LFP recording site 1 with all other LFP recording sites for a single animal. This analysis was based on one 40 min recording segment containing both spontaneous and odor-driven activity and serves to highlight that recording sites are clearly correlated at 0 s. Indeed, inspection of these cross correlations reveals that the peak correlations are centered on 0 s. and range from r = 0.33 (sites 1 and 3), to r = 0.68 (sites 1 and 2). This high degree of correlation occurs between sites which are as much as 250 μm apart. As highlighted in Figure 4A, the magnitude of these correlations does not appear to be dependent on the distance between recording sites. For example, the cross correlation between sites 1 and 4 in this experiment (250 μm) was considerably higher than between sites 1 and 3 (200 μm).
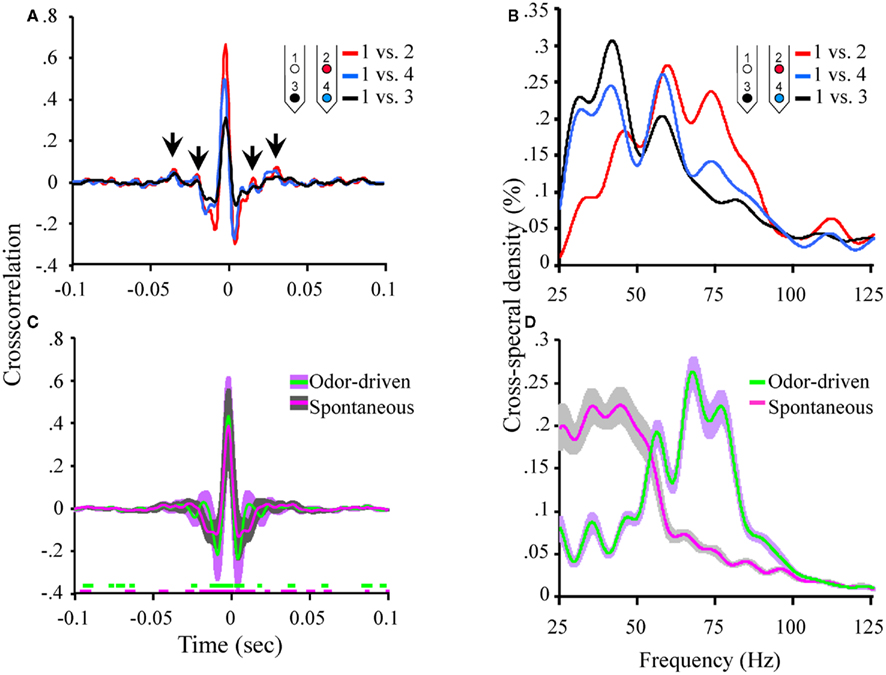
Figure 4. Oscillatory local field activity is weakly distributed and contains state dependent frequency content. (A) The cross correlation between LFPs recorded from site 1 (tetrode 1) and the three other LFP recording sites in the tetrode array (see Figure 1A). Inset schematic of the 2 × 2 tetrode array shows the respective LFP recording site positions. For purposes of simplification, only the site on each tetrode that was used for LFP recordings is shown. Sites are color coded to identify which cross correlation trace is associated with which recording electrode. Thus for example, the red trace is the cross correlation between site 1 (white) and site 2 (red). Results based on a total of ∼20 min of continuous recording time from a single moth and contain both spontaneous and odor-driven data. Inset arrows identify the periodic structure observed in the cross correlation between electrodes 1 and 2. Note that these small “off center” peaks in the cross correlations occur in a periodic manner suggesting the presence of a weak but distributed oscillation. (B) The corresponding cross spectral densities for the data shown in (A). These CSDs indicate that the cross correlation between electrodes 1 and 2 contained higher frequency content than 1 and 3 and 1 and 4 respectively. (C) Mean cross correlations for spontaneous versus odor-driven periods. Results based on all possible pair wise comparisons between the four LFP recording sites across seven moths. Odor-driven cross-correlation based on 1 s samples, starting at odor onset, for each of 180 odor stimuli per moth. Spontaneous cross correlation based on 180 1 s samples taken immediately prior to odor onset for each odor stimulus, per moth. Note that cross correlations were calculated for each stimulus and results were averaged. Shaded regions around the mean represent ±1 SD. Inset color coded broken lines above the X-axis indicate periods where a significant difference in the cross correlation value from 0 was observed. Significance threshold for these tests was set to 2.3 × 10⁻⁶ to maintain an overall alpha of 0.01 (see Figure A3 in Appendix for an expanded view). (D) Mean cross spectral densities as a function of spontaneous and odor-driven activity. Results based on all responses from the same seven moths shown in (C). Shaded area represents SE.
Note too that there are some small but regular “ripples” in the individual cross correlations (highlighted by inset arrows in Figure 4A). These small and roughly evenly spaced (in time) peaks and valleys, indicate that there is indeed some periodic temporal structure in the cross correlation. However, the peaks of these correlations are quite small (ca. r < 0.10). Nevertheless, by calculating the CSD of each individual cross correlation, any periodic temporal structure in the cross correlation can be quantified; the corresponding CSDs for the cross correlations displayed in Figure 4A are shown in Figure 4B. Figure 4B plots the amount of distributed oscillatory power by frequency and indicates that there was correlated periodic activity between sites 1 and 2 (red trace) centered around ∼60 Hz but spanning broadly from ∼40 to 85 Hz. By contrast, distributed oscillatory power present in the cross correlations between sites 1 and 3, and sites 1 and 4 contained frequency content in a lower frequency range indicating that the correlated oscillatory activity between sites 1 and 2 is not the same as that found between sites 1 and 3 or 1 and 4.
Figure 4C summarizes the mean of all possible unique pair wise cross correlations for all recordings used in this analysis (six possible unique pair wise comparisons per moth and seven moths used for this analysis). Results are based on a total of 360 1000 ms samples and are broken down as a function of spontaneous versus odor-driven activity. Mean cross correlations have been plotted with ±1 SD shading to provide a sense of variability in the cross correlations; this indicates that the greatest variability occurs in a ±50-ms window centered around 0 ms.
The mean peak cross correlation was 0.38 (SD = ± 0.18) for spontaneous activity and 0.43 (SD = ± 0.19) for odor-driven activity. A one-tailed paired t-test comparing the peak cross correlation revealed that odor produces a significant increase in this measure across the recording sites (p < 0.001). However, because these cross correlations are presented as means of multiple analyses, all but the most consistent and robust temporal details tend to be averaged out. To determine whether the secondary peaks (and valleys) that flank the central peak at 0 ms were significantly different from r = 0.0, a two tailed, t-test was calculated, for each frequency step; this was performed for both the spontaneous and odor-driven cross correlations. Inset along the X-axis in Figure 4C are the results of this test. In this case breaks in the colored lines indicate moments where the spontaneous or odor-driven cross correlations were not statistically different from 0. Conversely, the presence of colored lines highlights where there were significant deviations from 0. Thus, in spite of the fact that the flanking peaks and valleys were quite small, there were periods where the correlations were significantly different from 0, suggesting that there is indeed some correlated temporal structure that is distributed across pairs of recording sites.
Therefore, in order to quantify this distributed temporal structure, CSD’s were calculated for each individual cross correlation. Results of these CSD analyses were then averaged as a function of spontaneous versus odor-driven epochs and are displayed in Figure 4D. As shown in Figure 4D, the most striking difference between spontaneous and odor-driven CSDs is that they produce distributed temporal structure in nearly dichotomous frequency ranges. That is, during spontaneous epochs of time, the bulk of distributed periodic activity was in the range of ∼25–55 Hz. In the presence of odor however, there was relatively more distributed power in the range of ∼55–85 Hz. After accounting for all statistical main effects, ANOVA revealed distributed oscillatory power was significantly dependent on the interaction between the presence or absence of odor and frequency (p < 0.0001). Collectively then, this pattern of results indicate that both spontaneous and odor-driven activity produce weak but detectable distributed oscillatory activity in different frequency ranges. Our expectation was that the relationship between oscillations across recording sites would be far greater than actually observed; nevertheless the presence of distributed oscillations is consistent with the transient oscillatory model. The next question is whether these weak but distributed oscillations affect spike timing in a pattern consistent with the model.
Unitary Spiking Phase Locks to LFPOs as an Ongoing, Not Odor-Driven Process
The odor-driven increase in the amplitude and frequency of weakly but distributed oscillatory activity across the AL could provide enhanced synchrony of distributed spiking behavior from populations of AL neurons as predicted by the transient oscillatory model (Laurent and Davidowitz, 1994; Laurent et al., 1996a,b). This would require that phase locking of spikes to the oscillations occurs during odor-driven responses and this phase locking would presumably be stronger than what is observed during spontaneous activity. To test this hypothesis, we calculated unitary vector strength for the three peri-stimulus time epochs. These calculations were made for each unit across all stimulations of all odors. Thus for each moth, individual unitary vector strength calculations were based on 180 ms × 300 ms (or 54 s) samples for each of the three peri-stimulus time epochs. Furthermore, given that two relatively distinct frequency domains were observed for distributed oscillatory activity during spontaneous and odor-driven epochs (see Figure 4D), vector strength calculations were made based on both the low (25–55 Hz) and high (55–85 Hz) LFP band pass filter implementations. Finally, only vector strength values that were calculated based on 60 or more spikes were included in the analysis (376,518 spikes, or 87% of the 433,667 spikes sampled). This criterion was used because vector strength describes the variation in a distribution of spikes relative to the phase of a 360° oscillation cycle. Hence, with low spike counts, the vector strength measure is less reliable, particularly in cases where there are spikes that are outliers. To analyze variation in vector strength, we implemented a mixed General Linear Model in SAS using the GLM procedure to model data from five moths (90 neurons) for which we had comprehensive datasets (including both before and during GABAA receptor blockade via BMI application; BMI results described below).
The overall model was significant, explaining 49% of the variance in unitary vector strength scores (p < 0.0001). This analysis found that the main effects of odor identity (of the nine odors used), the peri-stimulus time epoch (−300 to 0; 50–350; and 350–650 ms, relative to onset of odor stimulation), and drug treatment (before versus during BMI application) all significantly influenced vector strength values (p < 0.0001). However, the LFP frequency range used to calculate the vector strength values (25–55 or 55–85 Hz) was not significant (p = 0.7274) indicating that vector strength values were approximately the same for both frequency domains.
Of particular importance is the significant main effect of peri-stimulus epoch, which compared vector strength as a function of the three different epochs of peri-stimulus time. Post hoc analysis of this effect (Figure 5A) indicates that, independent of the band pass filter implementation, spontaneous activity prior to odor stimulation (−300 to 0 ms relative to odor onset) produced the greatest overall vector strength values. Interestingly, from 50 to 350 ms, the peri-stimulus epoch typically associated with odor dependent spiking patterns (Stopfer et al., 2003; Daly et al., 2004b; Staudacher et al., 2009), produced about half the vector strength, indicating relatively weak phase locking during odor-driven responses. Even during the late response epoch (350–650 ms), while there was a significant increase in vector strength relative to the early response epoch (p < 0.01), it was still significantly lower than vector strength during spontaneous activity (p < 0.01). In order to better understand this “response epoch” effect at the single unit level, phase lag histograms are displayed for all 26 units from a single recording and in response to 20 presentations of 1-decanol, (Figure 5B). Results are displayed for the same three peri-stimulus epochs. Here we show that ongoing (i.e., spontaneous) spiking tends to occur, in this recording, on the rising phase of the oscillation cycle. In this exemplar case, all units show a decrease in their phase relationship to the oscillation during the early phase of the odor-driven response except one (Figure 5B, 50–350 ms; unit 7, light blue histogram), which increased and shifted phase essentially to the peak of the oscillation cycle. Finally, during the late phase of the response, units appear to come back into a similar phase alignment as was observed during spontaneous activity.
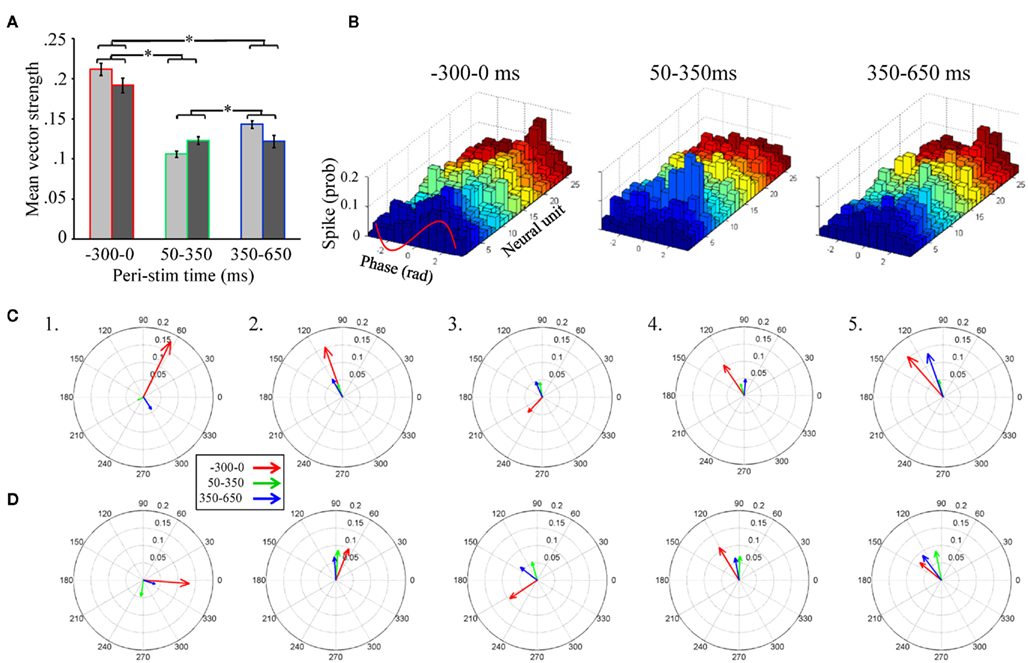
Figure 5. Unitary spiking phase locks to LFPOs as an ongoing not odor-driven process (A). Mean unitary vector strength as a function of the three stimulus epochs for the five moths used in this analysis. Results are broken down by LFP band pass filter range. However, note that there are no significant differences within any peri-stimulus response epoch between the 25–55 Hz (light gray) and 55–85 Hz (dark gray) band pass filter implementations. Inset are the results of statistical post hoc comparison mean vector strength values (averaged across filter implementation) across the different peri-stimulus time epochs; means with significant differences are indicated with an asterisk. Errors bars represent SE. (B) Phase lag histograms for all 26 recorded units from a single recording. Results based on one of the four LFPs recording sites, and in response to the 20 presentations of 1-decanol. Results are broken down by spontaneous (300 ms just prior to odor onset), early response (50–350 ms), and late response (350–650 ms). Note that several units (but not all, for example see the light green histogram) show a tendency to spike on the rising phase of the oscillation cycle (between 0 and 1.57 radians; see also inset red wave) during spontaneous activity. During odor-driven responses only one unit retains a strong (increased) phase relationship to the oscillation while the bulk of the units lose their phase relationships. (C) Population-level vector strength as a function of the three stimulus epochs. Results are for the 25 to 55-Hz band pass filter implementation and each panel represents a different animal. (D) The same as (C) except using LFP data that was 55–85 Hz band pass filtered.
In summary, of those units meeting the 60 spike minimum criterion for both spontaneous and early response epoch (N = 65 units), odor stimulation resulted in 68% of those units producing a 0.09 ± 0.08 (mean ± SD) reduction in vector strength relative to spontaneous activity, while only 32% produced a 0.03 ± 0.04 (mean ± SD) increase. Furthermore, consistent with the finding that vector strength recovers during the late response epoch, we found that 71% of units produced a 0.07 ± 0.05 (mean ± SD; N = 68 units) increase in vector strength scores from the early to late response epoch, while only 29% of cells produced a 0.06 ± 0.08 (mean ± SD; N = 68 units) decrease. Thus, more than two-thirds of units show a relative decrease in vector strength during the early response epoch and recover during the late response epoch.
Unitary vector strength measures represent the best possible scenario for highlighting the relationship between LFPO’s and spike timing of individual units because it is tolerant of differences in preferred phase angles between units. However, the transient oscillatory model predicts that not only do spikes phase lock to oscillations during an odor-driven response, but that phase locking of the responding assembly of output cells results in an increase of synchronized spiking of the population on an oscillatory timescale. In order to understand how oscillations might synchronize a population of parallel recorded neural units, the same vector strength analysis can be applied to a population vector, which is the summed spiking behavior of the recorded population. This population vector strength approach is sensitive to differences in preferred phase angles between units. Thus, as the variation in preferred phase angle among individual neurons in the population increases, the population-level measure of vector strength (and hence synchrony among individuals) will decrease. Figures 5C,D display population-level vector strength and preferred phase angle across all recorded units for the five recordings used in the statistical analysis. We again used the same 60 spike minimum for inclusion into the population vector. Each panel in Figures 5C,D displays the vector strength for the same three peri-stimulus response epochs for a single moth; results are collapsed across all presentations of all odors. Figure 5C displays results based on the 25–55 Hz band pass filter implementation, whereas Figure 5D is based on the 55–85 Hz filter. As statistically verified in Figure 4A and visualized in Figure 5B, the most striking result observed in Figure 5C is that, on average, vector strength is consistently greatest during spontaneous activity and consistently weakest during odor-driven responses; this pattern of results is consistent across all recordings and across both filtering ranges, with only one exception; in this case, vector strength values were roughly equal (see Figure 5D5). Also consistent with Figures 5A,B, vector strength values during the late response epoch were, on average, lower than the spontaneous epoch but greater than the early response epoch.
Given that CSD analysis indicated that distributed oscillatory activity was in a higher frequency range during odor responses (Figure 5D), we might have expected to observe greater vector strength values during odor-driven responses in the higher frequency domain. However, as shown in Figures 5A,D, the relative disparity between spontaneous and odor-driven phase locking was not statistically different as a function of the filter implementation and we found no examples where odor-driven phase locking was, on average, stronger than spontaneous phase locking. Thus, whether considering phase locking at the unitary or population-level, or at low versus high frequency ranges, the results shown here are in contrast to what the transient oscillatory model predicts; namely that phase locking should be (relatively speaking) an odor-driven phenomenon.
Finally, comparison of mean unitary vector strength values (Figure 5A) with mean population-level vector strength values (Figures 5C,D) provides an indicator of how well synchronized the population is on an oscillatory time scale. Specifically the mean unitary vector strength should be generally higher than those calculated based on a population vector simply because variability in preferred phase angle is ignored when averaging unitary vector strength. Recall that vector strength is defined as the reciprocal of the circular variance of the distribution of phases of sampled spikes to the LFP; the preferred phase angle is simply the mean of a given distribution of spikes. Thus as the variability in spike phases increases, vector strength decreases. Given a set of individual units with different preferred phase angles, when treated as a population, those different preferred phase angles (i.e., different means) will add variance to the population-level distribution of spike phases, resulting in lower population-level vector strength. The ratio of the mean population vector strength to mean unitary vector strength indicates the relative ability of all of the neurons to spike in the same phase (sic. synchronously). Based on the 25 to 55-Hz LFPs, the population: unit vector strength ratio of the three response epochs was 0.63, 0.33, 0.48 for spontaneous, early, and late response epochs respectively. These results indicate that the preferred phase angles during spontaneous activity are more consistent (i.e., producing more synchronous spiking) than the response epochs within this LFP frequency range. For the 55 to 85-Hz LFPs, the ratios were 0.40, 0.61, and 0.61 for spontaneous, early, and late response epochs respectively suggesting that units were relatively less phase aligned spontaneously in this frequency range. This pattern of results suggests that synchronous spiking from the population is more likely in the higher frequency range. In all cases, however, there is variation in individual units’ preferred phase relationships to the oscillations, which results in lower network synchronization. Furthermore, even within the higher LFPO frequency domain, vector strength values during the odor-driven response are still quite small.
The Phase Relationship between Spiking and Oscillations is Small but Significant
Relative to vector strength values commonly described in various regions of the vertebrates brain such as the auditory system (e.g., Goldberg and Brown, 1969; Moushegian et al., 1975; Kadner and Berrebi, 2008), the average vector strength values observed in the present study as well as those from other insect studies (Ito et al., 2009) are relatively small. However, we can determine whether these values are above what is expected by chance, by randomly jittering the spike timing within a restricted time range and recalculating vector strength. If the phase relation between spikes and the LFP are above what is expected by chance, then randomly jittering spike times will negatively impact vector strength values while maintaining much of the internal statistics of the dataset. First, to visualize this point, we randomly jittered all of the spikes from an individual spike train from a single recording (N = 44,758 across a 166-min recording session) by 0, ±3, or ±6 ms and cross correlated the spike train to one of the corresponding LFP recording sites (Figure 6A). Data includes both spontaneous and odor-driven activity. Note that in contrast to the cross correlations between LFPs (see Figure 4), this unit–LFP cross correlation shows clear temporal structure. Furthermore, random jittering of spikes by ±3 ms reduced and by ±6 ms eliminated this cross correlation. Next, using a bootstrapping method where spike trains were randomly re-jittered and vector strength recalculated, vector strength decay can be quantified as a function of the time range of the random jittering. In this case we used all units from a single recording and only spikes occurring within our three 300 ms peri-stimulus epochs (N = 19 units, 10,762 spikes). The initial data were re-jittered 30 times for each jitter width and vector strength was recalculated. Results of this analysis were then statistically analyzed using one-tailed paired t-tests. Figure 6B plots the mean vector strength by jitter width for each of the three peri-stimulus epochs and clearly indicate that the distributions of spikes tend to occur at a particular phase of the oscillation cycle. One-way t-test comparison of mean vector strength (significant results inset as asterisks) indicates a significant drop in strength as a function of increasing the jitter width by as little as ±1 ms up to the point at which the vector strength values approach 0 (±5 ms; p < 0.001; Figure 6B); this was true independent of the stimulus epoch used in the analysis. These results establish that while phase locking is weak relative to other sensory systems, it is nevertheless greater than what is expected based on chance.
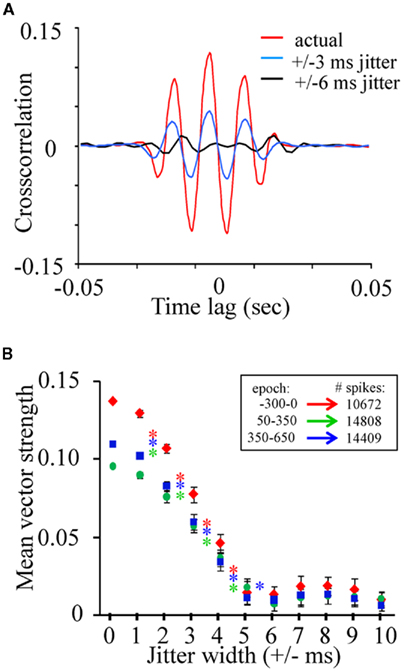
Figure 6. The phase relationship between spiking and oscillations is significant. (A) The cross-correlation of a single unit to a parallel recorded LFPO normally (in red), after spikes were randomly jittered by a width of ±3ms (blue) and after spikes were jittered by a width of ±6 ms (black). (B) Vector strength for the three epochs and their recalculation after jittering. Jittering width started at ±1 ms and was increased in 1 ms steps. Inset asterisks indicate significant differences in vector strength to neighboring jittering ranges (one-way paired t-tests; p < 0.01). Note that the resulting strength of the unit–LFP relationship is clearly dependent by the degree of jittering indicating that these correlations, though small, are dependent on precise spike timing with respect to the periodic nature of the local field.
Bicuculline Significantly Reduces Odor-Driven FM Oscillatory Responses and Decreases the Latency of Spiking Responses
Previous intracellular investigations on the effects of GABAA receptor blockade establish that BMI injection into Manduca ALs specifically and reversibly blocks a GABAA-dependent inward Cl− conductance in PNs (Christensen et al., 1998). This conductance normally results in a brief IPSP (44 ± 31 ms; Staudacher et al., 2009) and suppression of spontaneous PN spiking followed by a relatively prolonged supra-threshold EPSP, upon which an excitatory burst of spikes is superimposed. Thus, we first sought to establish if an additional function of GABAA receptors in the AL is to mediate the network’s ability to maintain distributed oscillatory activity across the AL using the same methods as above. This analysis was performed using a within-animal design so that the results could be directly compared with those obtained prior to GABAA receptor disruption.
First, application of BMI disrupted and in many cases completely eliminated the odor-driven FM LFPOs. Figure 7A presents four typical TFRs from four different moths before and during BMI application. In all four cases, application of BMI caused a qualitative decrease in oscillatory power relative to pre-BMI measures. This decrease ranged from near complete (Figure 7A panels 1 and 2) to partial (panels 3 and 4). Note too that in Figure 7A2i the spontaneous 20–50 Hz activity, which terminates with odor stimulation, was also greatly reduced as compared to Figure 7A2ii. This suggests that both ongoing and odor-driven oscillations were decreased. In order to statistically verify the loss of the FM responses, we modeled z-score normalized oscillatory power as a function of the main effects of individual differences between moths, the recording site the frequency step and the pharmacological treatment and their interactions using ANOVA. Results were based on five recordings for which we had comprehensive datasets for both pre and during BMI treatment. Results of the ANOVA indicate a significant drop in power from 0.32 ± 0.98 to −0.37 ± 0.81 (mean ± SD) as a result of BMI application (p < 0.001). Importantly the interaction of frequency by treatment was also significant. Post hoc analysis of oscillatory power as a function of the frequency by treatment interaction was performed using one-tailed paired t-tests comparing power at each of 84 frequency steps a p-value of 0.0005 was used to reduce experiment-wise type 1 error rate (0.05/84). Results of this analysis (inset in Figure 7B indicated that oscillatory power at nearly every frequency step from 25 to 100 Hz was significantly reduced during BMI application.
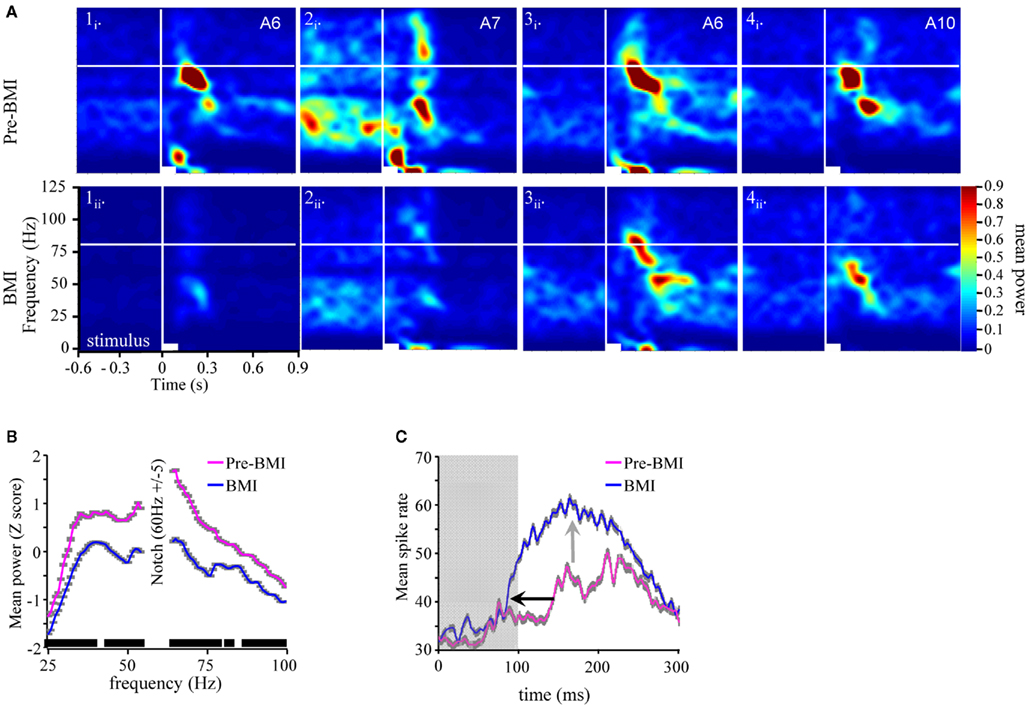
Figure 7. Bicuculline significantly reduces odor-driven FM oscillatory responses (A). TFR analyses from four separate experiments (columns 1–4) in response to odor prior to (i) versus during BMI application (ii). All panels are the result of TFR analyses that were calculated, normalized, and presented as described in Figure 1. Inset in the upper right corner of each panel (i) are the odorants used to generate both (i) and (ii). (B) Mean z-score normalized oscillatory power by frequency for pre versus during bicuculline (BMI) application. Inset in gray shading are the standard errors for each frequency step. We also performed a post hoc one-tailed paired t-test. Significance level was set at 0.0005 to maintain an overall post hoc type 1 error rate of 0.05. Inset black bars above X-axis represent ranges of frequencies where power was significantly decreased as a function of BMI application; breaks in the bar indicate frequencies that were not statistically different. Overall only 16 of 84 tests were not significant. (C) Mean peri-stimulus population response histogram averaged over all responses to all odors for the five moths used in this series of analyses (gray shaded area around each trace represents SEM). Gray box indicates Stimulus duration. Inset arrows highlight the decrease in response onset latency (black) and increased spike rate during the response (gray).
The corresponding spiking responses were also impacted by BMI application. Figure 7C represents the mean peri-stimulus response to all presentations of all odors across all five moths used in this analysis. Note that as the oscillatory activity is decreased during BMI application (Figures 7A,B), there is a corresponding ∼60 ms decrease in the mean onset latency of the spiking population response (inset black arrow). There is also an increase in spike rate (inset gray arrow) and overall duration of the spiking response. This pattern of results is consistent with the previous findings of Christensen et al. (1998). That is, by disrupting the inward Cl− conductance specifically, I1 inhibition is presumably lost and hence, PNs respond earlier, stronger, and longer.
GABAA Receptor Blockade Increases Odor-Driven Distributed Activity but Changes Frequency Content
A paired one-tailed t-test revealed that across all five moths and the six possible LFP–LFP cross correlations within each, GABAA receptor blockade did not significantly affect the mean peak LFP–LFP cross-correlation during spontaneous activity (p = 0.28) but did significantly increased the peak correlation for odor-driven epochs (p < 0.01; Figure 8A). Persistent cross correlations across recording sites during GABAA receptor blockade suggests that distributed activity is not entirely GABAA-dependent. Comparison of the pre versus during BMI cross correlations shown in Figure 8Aii suggests that odor-driven distributed frequency content has been affected. To address this question statistical comparison of CSD measures was performed using ANOVA. Figure 8B displays the mean CSD for spontaneous and odor-driven activity for pre versus during BMI application. ANOVA revealed that there was no significant change in mean CSD during spontaneous activity (p > 0.01) indicating that the relative power of distributed oscillations remained largely unchanged during this epoch. However, there was a significant shift in distributed frequency content during odor-driven responses that resulted in an increase in lower frequency content (between 40 and 55 Hz) while at the same time causing a relative reduction of higher frequency content (65–85 Hz; p < 0.01; Figure 8B).
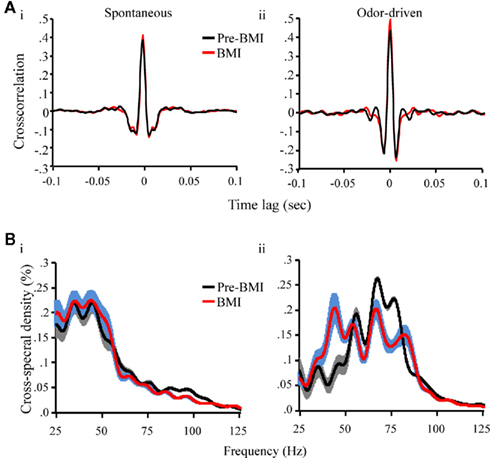
Figure 8. GABAA receptor blockade increases odor-driven distributed activity and broadens its periodic structure (A). The mean cross correlation prior to BMI application (red) and during BMI application. Results displayed for spontaneous (i) and odor-driven (ii) epochs. Results based on all possible pair wise comparisons across the four LFP recording sites. (B) Mean cross spectral density prior to BMI application (red) and during BMI application. Results displayed for spontaneous (i) and odor-driven (ii) epochs and based on the data represented in (A).
GABAA Receptor Blockade Decreases Phase Relationships between Unitary Spiking and Local Field Potential Oscillations
Finally, we investigated whether BMI application affected the phase relationship between unitary spiking and oscillatory activity. As mentioned above, results of the GLM analysis of vector strength indicated the BMI effect was significant (p < 0.01). Comparison of mean vector strength indicated that BMI application reduced mean vector strength (collapsed across all three peri-stimulus epochs) by 11% (pre-BMI = 0.14; BMI = 0.12). We again found that phase locking during spontaneous epochs was significantly stronger than either early or late odor-driven response epochs (Figure 9A). On a unit by unit basis BMI produced a notable decrease in phase locking in both spontaneous and odor-driven responses (Figure 9B). For purpose of comparison, Figure 9B data are based on the same units and in response to the same odor (1-decanol) as shown in Figure 5B. There was qualitative evidence of a phase relationship remaining in some cells in Figure 9B. However, as compared to pre-BMI application (see Figure 5B) phase locking has been greatly reduced during both spontaneous and odor-driven activity. Nevertheless, as demonstrated in Figure 9A, phase locking clearly remains across all recordings.
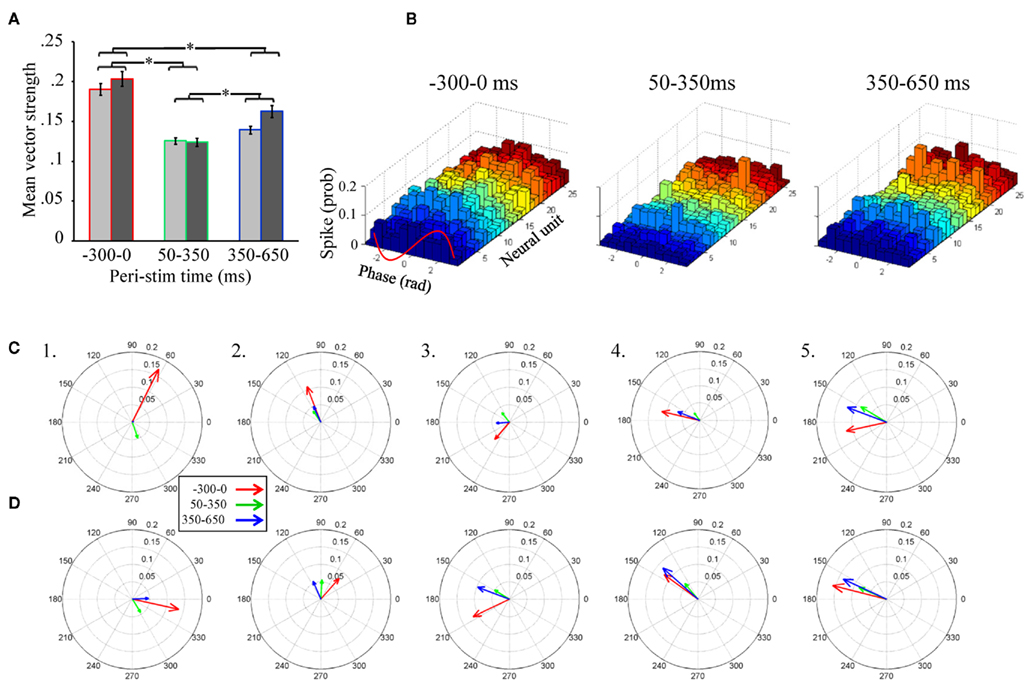
Figure 9. GABAA receptor blockade decreases phase correlations between unitary spiking and local field oscillations. (A) Mean vector strength as a function of the three stimulus epochs during BMI application. Results are broken down by filter implementation (25–55 Hz in light gray; 55–85 Hz in dark gray). The results of statistical post hoc comparison between means are inset; means with significant differences indicate by an asterisk. Errors bars represent standard errors. (B) Phase lag histograms for 26 individual units from a single recording during spontaneous and the two odor-driven response epochs during BMI application. For comparative purposes, these histograms were generated from the same moth and in response to the same odorants as shown in Figure 5B. (C) Population-level measures of vector strength as a function of the three stimulus epochs for the five moths used in this analysis. Results are for the 25 to 55-Hz band pass filter implementation and each panel represents a different animal. (D) The same as (C). except using the 55 to 85-Hz band pass filter.
Figures 9C,D shows population-level vector strength as a function of peri-stimulus epoch for both the low (Figure 9C) and high (Figure 9D) band pass filter settings; these data too are from the same animals and hence directly comparable to Figures 5C,D. Here again, phase locking during spontaneous activity was consistently greater than either of the response epochs with only one exception (see Figure 9D4). These results suggest that while phase locking is significantly reduced, what remains is still greatest during spontaneous rather than odor-driven activity.
Discussion
Currently there is a long standing debate about the role of temporal processing in odor identity encoding, at the level of primary olfactory networks. One hypothesis, the transient oscillatory synchrony model, posits that odor stimulation drives LFPOs, which in turn drives precise spike time synchronization of projection neurons from across the AL (i.e., in a distributed manner), thereby binding this distributed output at the level of MB input. These synchronized spikes are the proposed information carriers for subsequent odor identification by the MB. The MB in turn is structurally and functionally organized to receive and interpret synchronous input from the AL on an oscillatory timescale (for review see Laurent, 2002). This is an exciting model because it provides several predictions, some of which we have attempted to test.
The first major finding of the present study is that odor stimulation drives oscillatory responses that are strongly frequency modulated. Furthermore, this modulation occurs in a stimulus-dependent manner. Among vertebrates, both spontaneous and stimulus driven oscillations have been observed across several brain regions (including the OB) and across a broad spectral range of frequencies (for review see Buzsaki and Draguhn, 2004). In the olfactory system of mammals, stimulus driven oscillations can be observed in vivo from 15 to 35 Hz (beta band) to 40–90 Hz (gamma band; Buonviso et al., 2003; Martin et al., 2004) and there is evidence that spiking can phase lock to these oscillations during a stimulus driven response (Kashiwadani et al., 1999). Odor-driven oscillations have typically been described as a constant narrow band (sic 20–30 Hz) in insects, such as the locust and honey bee (e.g., Laurent and Davidowitz, 1994; Wehr and Laurent, 1996; Stopfer et al., 1997). Hence, according to the transient oscillatory model these oscillations should be of a reasonably constant frequency that should be independent of the odorant presented (Laurent et al., 1996a). However, we find that in the AL of Manduca, as in vertebrates, oscillations occur across a far broader spectral range, modulating across response time from as high as ∼100 Hz down to as low as ∼20–30 Hz; this modulation takes no more than ∼400 ms to evolve given a 100-ms stimulus and does so in an odor-specific manner. Odor-driven FM oscillations and their tendency to occur in two distinct epochs within the AL, while until now unreported in the insect literature, is strikingly similar to what has been observed in mammalian OB (Buonviso et al., 2003).
It has recently been shown that prolonged odor stimulation (ca. 500–4000 ms) drives FM oscillations ranging from 50 Hz down to 10 Hz in the MBs of Manduca (Ito et al., 2009). We find that FM LFPOs recorded in the AL occur across a broader spectral range, do not require prolonged stimulation and are furthermore clearly odor dependent. The two studies taken together suggest that the highest frequency content does not pass from AL to MB. Indeed, much of the higher frequency content that occurs during the early phase of the AL response (100–80 Hz at ∼60–110 ms post stimulus onset) occurs prior to initiation of PN spiking responses, which typically start no earlier than ∼110–120 ms after the odor valve is actuated (Daly et al., 2004b; Staudacher et al., 2009). Thus, at least some of the higher frequency content observed in the AL, because it occurs while PN output is suppressed, cannot be transmitted to the MB.
In insects, it has been proposed that the downstream receivers of AL output, the Kenyon cells of the MB, are normally under strong inhibitory control by inputs projecting from the lateral horn. Lateral horn cells, like the Kenyon cells of the MB calyx, receive direct excitatory input from the AL. It has been furthermore proposed that this circuitous pathway establishes an integration window that is opened for synchronous excitatory input from the AL then abruptly closed by inhibitory input from the lateral horn (Perez-Orive et al., 2002). This integrate-and-reset window occurs within the periodic timescale initially established by odor-driven AL oscillations. From a theoretical perspective, given that neurons have fixed conduction velocities, cable lengths, and synaptic delays, the circuit function proposed by Perez-Orive et al. (2002) will have a biophysically constrained integration window. As a result, such an integrate-and-reset circuit will have limited tolerance for the FM oscillations that we have observed (for review see Laurent, 2002). It remains to be determined if and how subsequent decoding in the MB could occur under the constraints of a static integration window.
A second finding of this study is that odor-driven FM oscillatory responses are largely restricted to a subset (less than 2 on average) of the four LFP recording sites and hence appears in most cases to be regionalized. Furthermore, cross correlation analysis also indicates that there is only a very small amount of activity that is both distributed across pairs of recording sites and temporally structured (i.e., oscillatory). This distributed oscillatory activity is state dependent; that is, spontaneous distributed activity is dominated by oscillatory activity in the 25 to 55-Hz range, whereas distributed odor-driven oscillations are in the 55 to 85-Hz range; this pattern of results of relatively higher frequency oscillatory content during odor-driven responses is consistent with prior findings in honeybee (Ritz et al., 2001). While the precise degree of this regionalization of responses remains an important area for further research, it is at odds with the transient oscillatory model.
One question that arises from these results is whether the relatively small amount of distributed oscillatory activity is sufficient to correlate with or otherwise influence spiking behavior in PNs in a manner that increases the amount of synchrony across AL PNs, as required by the transient oscillatory model. Our results demonstrate that spike timing is indeed biased to occur in a preferred phase relationship to the oscillation, though this bias was clearly state and cell (and recording) specific (see Figures 5 and 6). Contrary to the expectations of the transient oscillatory model, however, we observed that during an odor-driven response, as a population, this phase locking was largely lost. This occurred in part because unitary vector strength values dropped significantly during the odor response, which means that even at the level of individual cells, odor stimulation decoupled cells from the influence of LFPOs. Additionally, preferred phase angles of individual units became more variable and hence more evenly distributed across all phases of the oscillation cycle; this lowered population-level measures of phase locking. Thus, odor-driven oscillations per se had little effect on synchronizing the spikes across individual units of the recorded population. It is worth highlighting that strong phase locking has been typically observed in response to longer stimulations than we presented here (Laurent and Naraghi, 1994; Laurent et al., 1996b; Stopfer et al., 1997; Kashiwadani et al., 1999). While future work will explore the possibility that longer and temporally structured stimuli have differing effects on odor-driven phase locking, we note that 100 ms stimulations are entirely consistent with expected encounter times in natural plumes that the moth might encounter (Murlis and Jones, 1981) and are known to respond to in behavioral studies (Willis and Baker, 1984).
The fact that phase locking is lost during odor-driven responses in this model system should not be surprising. Indeed, it has long been known that in response to odor stimulation, AL PNs in Manduca are briefly inhibited followed by a sustained supra-threshold depolarization and spiking (for several examples see Christensen et al., 1996; Christensen et al., 1998; Heinbockel et al., 1998, 1999; Staudacher et al., 2009). This explains in part why odor responses appear to be characterized by a loss of phase relationship between our recorded units and LFPOs. This also likely explains why others were not able to establish phase locking during odor-driven responses in previous studies (Christensen et al., 2003). However, this does not explain the prolonged loss of phase locking.
In the AL of Manduca, LNs and PNs are spontaneously active under normal conditions; this has long been known (Matsumoto and Hildebrand, 1981; Kanzaki et al., 1989). Because oscillations are presumably the result of reciprocal synaptic connectivity within the network, it is expected that there is always some spontaneous oscillatory activity observable in the LFP, even though the amplitude may be small, relative to what is observed during odor-driven responses. Unexpectedly, we found that there is a tendency for individual cells to spontaneously spike in phase with oscillation cycles in the absence of odor stimulation.
It has been shown that even weak oscillatory signals in neural circuits can in some cases enhance signal to noise ratios; this phenomena is called stochastic resonance (Wiesenfeld and Moss, 1995; Wilkens et al., 2002; Korn and Faure, 2003). It has also been shown that weakly correlated noise in the olfactory circuit can enhance spike time synchrony (Galán et al., 2006). Perhaps then, the most intriguing finding in the current study is the significantly greater spike to LFP phase locking observed during spontaneous activity, relative to odor-driven responses; this was true independent of the frequency range of the oscillations under consideration. Thus, if oscillations were acting as a synchronizing mechanism in this model system, they are doing so during ongoing, spontaneous activity, and not during odor-driven responses. This is in sharp contrast to predictions made by the transient oscillatory model, which assumes that phase locking is a stimulus driven phenomenon involved in odor identity encoding. It is worth noting that we are unaware of any reported comparisons of spontaneous versus odor-driven phase locking prior to the present study, thus it is difficult to assess the generality of our findings. However, “bouts” of spontaneous oscillatory activity have been observed in both locust (Laurent and Naraghi, 1994) and honeybee (Ritz et al., 2001) olfactory pathways that appear to be consistent with our observations.
In response to odor stimulation, individual PNs recorded from Manduca AL are briefly inhibited via an inward Cl− conductance, then burst as the second epoch of oscillations emerge. Several lines of evidence from both vertebrate and invertebrate models establish that spatially co-localized principal output neurons tend to produce stimulus driven synchronous spike bursting patterns (Schoppa and Westbrook, 2001, 2002; Lei et al., 2002; Daly et al., 2004b; Hayar et al., 2005) in what has been described as onset synchrony (Christensen et al., 2001; Lei et al., 2002). Parallel recordings of neural ensembles as well as serial reconstructions of AL output activity suggest that the onset of this burst of activity is different for different glomeruli thereby producing a brief sequence of onsets that are odor dependent and optimize within ∼240 ms of odor onset (or ∼120 ms from the onset of the excitatory response) in this model system (Daly et al., 2004b; Staudacher et al., 2009); this is roughly consistent with calcium-imaging studies in honeybee (Galán et al., 2004). This time course for producing odor-specific activation patterns also appears to be consistent with physiological evidence from other model organisms (Muller et al., 2002; Lehmkuhle et al., 2006; Spors et al., 2006; Namiki and Kanzaki, 2008; Namiki et al., 2009) as well as behavioral evidence demonstrating odor identification/discrimination within the same approximate time frame or faster (Laska et al., 1999; Uchida and Mainen, 2003; Budick and Dickinson, 2006; Wesson et al., 2008a,b). Thus, it is reasonable to conclude that the temporal window for odor identification is in the range of 240 ms from stimulus onset or about ∼120 ms from initiation of the excitatory response within the AL (e.g., see Figure 1).
Stopfer et al. (1997) demonstrated that oscillations are abolished in the honeybee by application of the GABAA receptor antagonist picrotoxin. Based on a stimulus generalization paradigm they also suggest that GABAA receptor blockade disrupts fine odor discrimination in this insect. These findings represent a cornerstone of the transient oscillatory model because they identify a specific functional role for oscillations. More recently, however, the conclusion that GABAA receptor blockade affects discrimination only of closely related odors has been challenged by a more comprehensive behavior-pharmacological study in Manduca (Mwilaria et al., 2008). This study was based on pharmacological data from 1680 moths and established that discrimination of pairs of odors is generally disrupted independent of the relatedness of the odor pairs. Furthermore, Mwilaria et al. (2008) showed that GABAA receptor disruption increased detection thresholds. Based on these finding it was proposed that the disruption of the ability to discriminate closely related odors was most likely due to a general increase in detection thresholds, which increased task difficulty. These findings have been subsequently supported by physiological and wind tunnel experiments demonstrating that GABAA receptor blockade in the macroglomerular complex of the AL (the region of the male AL where the primary components of female pheromones are processed), does not affect pheromone detection at the level of spiking PNs but does reduce PN signal to noise (Lei et al., 2009). These researchers furthermore showed that reduction in signal to noise disrupts the ability of male moths to successfully plume track. This is consistent with the interpretation that at the level of sensory perception, loss of AL GABAA receptor function results in a loss of ability to clearly perceive the presence of (i.e., detect) an odor cue (Mwilaria et al., 2008). This too is in stark contrast to the transient oscillatory model, which predicts that the sole functional effect of GABAA receptor blockade is on the ability to discriminate closely related odors.
In conclusion, it is perhaps not surprising that the transient oscillatory model, which is based primarily on data from the locust, does not fit well with data from model systems such as Manduca given the differences in structural organization of the AL between these two species. For example, locusts have a derived AL morphology consisting of hundreds of small microglomeruli, in which both olfactory receptor neurons and PNs are multi glomerular and LNs are non-spiking (Anton and Homberg, 1999). In contrast, Manduca, like most insects and mammals, have exclusively uniglomerular ORNs and predominantly uniglomerular PNs as well as several LN morphologies, all of which produce action potentials. The differences in structure between the locust and Manduca likely reflect functional adaptations to distinct behavioral and chemical ecologies. Insects such as Manduca are more or less specialized upon a single food source as adults (i.e., floral nectars), and heavily dependent upon olfactory cues for locating these food sources from a distance (Bernays, 2001). For these insects there is a need to detect and rapidly discriminate among many faint and brief odor cues in the environment in order to locate a particular food source via odor plume tracking behavior. In contrast, orthopteran insects including locusts are extreme dietary generalists, consuming a wide variety of food sources consisting of both living and dead plant and animal material (Gangwere, 1961). Individual food preferences appear to be based upon a mixture of variables including local environmental conditions, the need to avoid predators (Despland and Simpson, 2005), what types of food are available, food quality, and nutrient need (Raubenheimer and Simpson, 2003). Given this pattern of food acquisition, it is likely that these insects are less dependent on identifying palatable food sources using specific olfactory cues, but may instead navigate to broad categories of food odors such as green leaf volatiles (Ochieng and Hansson, 1999; Chen and Kang, 2000). Unfortunately, while recent studies now support the notion that the locust can learn and discriminate between a pair of broadly different odorants (Simoes et al., 2011) there are no studies to date that integrate observations of fine odor discrimination, food choice, and AL physiology in locusts so it is not possible at present to speculate how this insect actually detects and utilizes odors in a behavioral context. We can, however, posit that the locust, an insect with an unusual wide open feeding ecology, in addition to possessing a unique AL anatomy and physiology, is unlikely to process odorants in a manner typical of the majority of insects or of odorant-sensing animals in general.
Conflict of Interest Statement
The authors declare that the research was conducted in the absence of any commercial or financial relationships that could be construed as a potential conflict of interest.
Acknowledgments
We thank Dr’s S. M. Farris, G. Spirou, B. G. Schreurs, and A. Agmon for critical review of this research. This research was funded by NIH/NIDCD R01DC009417 and NIH/NCRR P20RR015574 to Kevin C. Daly and by the Mt. Sinai Health Care Foundation and the Alfred P. Sloan Foundation to Roberto F. Galán.
References
Bell, R. A., and Joachim, F. G. (1976). Techniques for rearing laboratory colonies of tobacco hornworms and pink bollworms. Ann. Entomol. Soc. Am. 69, 365–372.
Bernays, E. A. (2001). Neural limitations in phytophagous insects: implications for diet breadth and evolution of host affiliation. Annu. Rev. Entomol. 46, 703–727.
Boser, B. E., Guyon, I. M., and Vapnik, V. N. (1992). “A training algorithm for optimal margin classifiers,” in COLT 1992 Proceedings of the Fifth Annual Workshop on Computational Learning (New York: ACM).
Budick, S. A., and Dickinson, M. H. (2006). Free-flight responses of Drosophila melanogaster to attractive odors. J. Exp. Biol. 209, 3001–3017.
Buonviso, N., Amat, C., Litaudon, P., Roux, S., Royet, J. P., Farget, V., and Sicard, G. (2003). Rhythm sequence through the olfactory bulb layers during the time window of a respiratory cycle. Eur. J. Neurosci. 17, 1811–1819.
Buzsaki, G., and Draguhn, A. (2004). Neuronal oscillations in cortical networks. Science 304, 1926–1929.
Chen, H. H., and Kang, L. (2000). Olfactory responses of two species of grasshoppers to plant odours. Entomol. Exp. Appl. 95, 129–134.
Christensen, T. A., D’Alessandro, G., Lega, J., and Hildebrand, J. G. (2001). Morphometric modeling of olfactory circuits in the insect antennal lobe: I. Simulations of spiking local interneurons. Biosystems 61, 143–153.
Christensen, T. A., Heinbockel, T., and Hildebrand, J. G. (1996). Olfactory information processing in the brain: encoding chemical and temporal features of odors. J. Neurobiol. 30, 82–91.
Christensen, T. A., Lei, H., and Hildebrand, J. G. (2003). Coordination of central odor representations through transient, non-oscillatory synchronization of glomerular output neurons. Proc. Natl. Acad. Sci. U.S.A. 100, 11076–11081.
Christensen, T. A., Waldrop, B. R., and Hildebrand, J. G. (1998). Multitasking in the olfactory system: context-dependent responses to odors reveal dual GABA-regulated coding mechanisms in single olfactory projection neurons. J. Neurosci. 18, 5999–6008.
Daly, K. C., Chandra, S., Durtschi, M. L., and Smith, B. H. (2001). The generalization of an olfactory-based conditioned response reveals unique but overlapping odour representations in the moth Manduca sexta. J. Exp. Biol. 204, 3085–3095.
Daly, K. C., Christensen, T. A., Lei, H., Smith, B. H., and Hildebrand, J. G. (2004a). Learning modulates the ensemble representations for odors in primary olfactory networks. Proc. Natl. Acad. Sci. U.S.A. 101, 10476–10481.
Daly, K. C., Wright, G. A., and Smith, B. H. (2004b). Molecular features of odorants systematically influence slow temporal responses across clusters of coordinated antennal lobe units in the moth Manduca sexta. J. Neurophysiol. 92, 236–254.
Despland, E., and Simpson, S. J. (2005). Food choices of solitarious and gregarious locusts reflect cryptic and aposematic antipredator strategies. Anim. Behav. 69, 471–479.
Friedrich, R. W., and Laurent, G. (2001). Dynamic optimization of odor representations by slow temporal patterning of mitral cell activity. Science 291, 889–894.
Galán, R. F., Fourcaud-Trocme, N., Ermentrout, G. B., and Urban, N. N. (2006). Correlation-induced synchronization of oscillations in olfactory bulb neurons. J. Neurosci. 26, 3646–3655.
Galán, R. F., Sachse, S., Galizia, C. G., and Herz, A. V. M. (2004). Odor-driven attractor dynamics in the antennal lobe allow for simple and rapid olfactory pattern classification. Neural Comput. 16, 999–1012.
Gangwere, S. K. (1961). A monograph on food selection in Orthoptera. Trans. Am. Entomol. Soc. 87, 67–230.
Gelperin, A., and Tank, D. W. (1990). Odour-modulated collective network oscillations of olfactory interneurons in a terrestrial mollusc. Nature 345, 437–440.
Goldberg, J. M., and Brown, P. B. (1969). Response of binaural neurons of dog superior olivary complex to dichotic tonal stimuli: some physiological mechanisms of sound localization. J. Neurophysiol. 32, 613–636.
Hayar, A., Shipley, M. T., and Ennis, M. (2005). Olfactory bulb external tufted cells are synchronized by multiple intraglomerular mechanisms. J. Neurosci. 25, 8197–8208.
Heinbockel, T., Christensen, T. A., and Hildebrand, J. G. (1999). Temporal tuning of odor responses in pheromone-responsive projection neurons in the brain of the sphinx moth Manduca sexta. J. Comp. Neurol. 409, 1–12.
Heinbockel, T., Kloppenburg, P., and Hildebrand, J. G. (1998). Pheromone-evoked potentials and oscillations in the antennal lobes of the sphinx moth Manduca sexta. J. Comp. Physiol. A 182, 703–714.
Hosler, J. S., Buxton, K. L., and Smith, B. H. (2000). Impairment of olfactory discrimination by blockade of GABA and nitric oxide activity in the honey bee antennal lobes. Behav. Neurosci. 114, 514–525.
Ito, I., Bazhenov, M., Ong, R. C., Raman, B., and Stopfer, M. (2009). Frequency transitions in odor-evoked neural oscillations. Neuron 64, 692–706.
Johnson, B. A., Farahbod, H., Saber, S., and Leon, M. (2005). Effects of functional group position on spatial representations of aliphatic odorants in the rat olfactory bulb. J. Comp. Neurol. 483, 192–204.
Johnson, B. A., Woo, C. C., Hingco, E. E., Pham, K. L., and Leon, M. (1999). Multidimensional chemotopic responses to n-aliphatic acid odorants in the rat olfactory bulb. J. Comp. Neurol. 409, 529–548.
Johnson, B. A., Woo, C. C., and Leon, M. (1998). Spatial coding of odorant features in the glomerular layer of the rat olfactory bulb. J. Comp. Neurol. 393, 457–471.
Kadner, A., and Berrebi, A. S. (2008). Encoding of temporal features of auditory stimuli in the medial nucleus of the trapezoid body and superior paraolivary nucleus of the rat. Neuroscience 151, 868–887.
Kanzaki, R., Arbas, E. A., Strausfeld, N. J., and Hildebrand, J. G. (1989). Physiology and morphology of projection neurons in the antennal lobe of the male moth Manduca sexta. J. Comp. Physiol. A 165, 427–453.
Kashiwadani, H., Sasaki, Y. F., Uchida, N., and Mori, K. (1999). Synchronized oscillatory discharges of mitral/tufted cells with different molecular receptive ranges in the rabbit olfactory bulb. J. Neurophysiol. 82, 1786–1792.
Korn, H., and Faure, P. (2003). Is there chaos in the brain? II. Experimental evidence and related models. C. R. Biol. 326, 787–840.
Laska, M., Galizia, C. G., Giurfa, M., and Menzel, R. (1999). Olfactory discrimination ability and odor structure-activity relationships in honeybees. Chem. Senses 24, 429–438.
Laurent, G. (2002). Olfactory network dynamics and the coding of multidimensional signals. Nat. Rev. Neurosci. 3, 884–895.
Laurent, G., and Davidowitz, H. (1994). Encoding of olfactory information with oscillating neural assemblies. Science 265, 1872–1875.
Laurent, G., and Naraghi, M. (1994). Odorant-induced oscillations in the mushroom bodies of the locust. J. Neurosci. 14, 2993–3004.
Laurent, G., Stopfer, M., Friedrich, R. W., Rabinovich, M. I., Volkovskii, A., and Abarbanel, H. D. I. (2001). Odor encoding as an active, dynamical process: experiments, computation, and theory. Annu. Rev. Neurosci. 24, 263–297.
Laurent, G., Wehr, M., and Davidowitz, H. (1996a). Temporal representations of odors in an olfactory network. J. Neurosci. 16, 3837–3847.
Laurent, G., Wehr, M., MacLeod, K., Stopfer, M., Leitch, B., and Davidowitz, H. (1996b). Dynamic encoding of odors with oscillating neuronal assemblies in the locust brain. Biol. Bull. 191, 70–75.
Lehmkuhle, M. J., Normann, R. A., and Maynard, E. M. (2006). Trial-by-trial discrimination of three enantiomer pairs by neural ensembles in mammalian olfactory bulb. J. Neurophysiol. 95, 1369–1379.
Lei, H., Christensen, T. A., and Hildebrand, J. G. (2002). Local inhibition modulates odor-evoked synchronization of glomerulus-specific output neurons. Nat. Neurosci. 5, 557–565.
Lei, H., Riffell, J. A., Gage, S. L., and Hildebrand, J. G. (2009). Contrast enhancement of stimulus intermittency in a primary olfactory network and its behavioral significance. J. Biol. 8, 21.
Linster, C., Johnson, B. A., Yue, E., Morse, A., Xu, Z., Hingco, E. E., Choi, Y., Choi, M., Messiha, A., and Leon, M. (2001). Perceptual correlates of neural representations evoked by odorant enantiomers. J. Neurosci. 21, 9837–9843.
MacLeod, K., and Laurent, G. (1996). Distinct mechanisms for synchronization and temporal patterning of odor-encoding neural assemblies. Science 274, 976–979.
Martin, C., Gervais, R., Chabaud, P., Messaoudi, B., and Ravel, N. (2004). Learning-induced modulation of oscillatory activities in the mammalian olfactory system: the role of the centrifugal fibres. J. Physiol. Paris 98, 467–478.
Matsumoto, S. G., and Hildebrand, J. G. (1981). Olfactory mechanisms in the moth Manduca sexta: response characteristics and morphology of central neurons in the antennal lobe. Proc. R. Soc. Lond. B Biol. Sci. 213, 249–277.
Moushegian, G., Rupert, A. L., and Gidda, J. S. (1975). Functional characteristics of superior olivary neurons to binaural stimuli. J. Neurophysiol. 38, 1037–1048.
Muller, D., Abel, R., Brandt, R., Zockler, M., and Menzel, R. (2002). Differential parallel processing of olfactory information in the honeybee, Apis mellifera L. J. Comp. Physiol. A Neuroethol. Sens. Neural Behav. Physiol. 188, 359–370.
Murlis, J., and Jones, C. D. (1981). Fine-scale structure of odor plumes in relation to insect orientation to distant pheromone and other attractant sources. Physiol. Entomol. 6, 71–86.
Mwilaria, E. K., Ghatak, C., and Daly, K. C. (2008). Disruption of GABA(A) in the insect antennal lobe generally increases odor detection and discrimination thresholds. Chem. Senses 33, 267–281.
Namiki, S., Haupt, S. S., Kazawa, T., Takashima, A., Ikeno, H., and Kanzaki, R. (2009). Reconstruction of virtual neural circuits in an insect brain. Front. Neurosci. 3:206–213. doi:10.3389/neuro.01.028.2009
Namiki, S., and Kanzaki, R. (2008). Reconstructing the population activity of olfactory output neurons that innervate identifiable processing units. Front. Neural Circuits 2:1. doi:10.3389/neuro.04.001.2008
Nusser, Z., Kay, L. M., Laurent, G., Homanics, G. E., and Mody, I. (2001). Disruption of GABA(A) receptors on GABAergic interneurons leads to increased oscillatory power in the olfactory bulb network. J. Neurophysiol. 86, 2823–2833.
Ochieng, S. A., and Hansson, B. S. (1999). Responses of olfactory receptor neurones to behaviourally important odours in gregarious and solitarious desert locust, Schistocerca gregaria. Physiol. Entomol. 24, 18–36.
Perez-Orive, J., Mazor, O., Turner, G. C., Cassenaer, S., Wilson, R. I., and Laurent, G. (2002). Oscillations and sparsening of odor representations in the mushroom body. Science 297, 359–365.
Raubenheimer, D., and Simpson, S. J. (2003). Nutrient balancing in grasshoppers: behavioural and physiological correlates of dietary breadth. J. Exp. Biol. 206, 1669–1681.
Ritz, R., Galán, R. F., Szyszka, P., and Herz, A. V. M. (2001). Analysis of odor processing in the mushroom bodies of the honeybee. Neurocomputing 38–40, 313–318.
Schoppa, N. E., and Westbrook, G. L. (2001). Glomerulus-specific synchronization of mitral cells in the olfactory bulb. Neuron 31, 639–651.
Schoppa, N. E., and Westbrook, G. L. (2002). AMPA autoreceptors drive correlated spiking in olfactory bulb glomeruli. Nat. Neurosci. 5, 1194–1202.
Simoes, P., Ott, S. R., and Niven, J. E. (2011). Associative olfactory learning in the desert locust, Schistocerca gregaria. J. Exp. Biol. 214, 2495–2503.
Spors, H., Wachowiak, M., Cohen, L. B., and Friedrich, R. W. (2006). Temporal dynamics and latency patterns of receptor neuron input to the olfactory bulb. J. Neurosci. 26, 1247–1259.
Staudacher, E. M., Huetteroth, W., Schachtner, J., and Daly, K. C. (2009). A 4-dimensional representation of antennal lobe output based on an ensemble of characterized projection neurons. J. Neurosci. Methods 180, 208–223.
Stevenson, R., Corbo, K., Baca, L., and Le, Q. (1995). Cage size and flight speed of the tobacco hawk moth Manduca sexta. J. Exp. Biol. 198, 1665–1672.
Stopfer, M., Bhagavan, S., Smith, B. H., and Laurent, G. (1997). Impaired odour discrimination on desynchronization of odour-encoding neural assemblies. Nature 390, 70–74.
Stopfer, M., Jayaraman, V., and Laurent, G. (2003). Intensity versus identity coding in an olfactory system. Neuron 39, 991–1004.
Uchida, N., and Mainen, Z. F. (2003). Speed and accuracy of olfactory discrimination in the rat. Nat. Neurosci. 6, 1224–1229.
Waldrop, B., Christensen, T. A., and Hildebrand, J. G. (1987). GABA-mediated synaptic inhibition of projection neurons in the antennal lobes of the sphinx moth, Manduca sexta. J. Comp. Physiol. A 161, 23–32.
Wehr, M., and Laurent, G. (1996). Odour encoding by temporal sequences of firing in oscillating neural assemblies. Nature 384, 162–166.
Wehr, M., and Laurent, G. (1999). Relationship between afferent and central temporal patterns in the locust olfactory system. J. Neurosci. 19, 381–390.
Wesson, D. W., Carey, R. M., Verhagen, J. V., and Wachowiak, M. (2008a). Rapid encoding and perception of novel odors in the rat. PLoS Biol. 6, e82. doi:10.1371/journal.pbio.0060082
Wesson, D. W., Donahou, T. N., Johnson, M. O., and Wachowiak, M. (2008b). Sniffing behavior of mice during performance in odor-guided tasks. Chem. Senses 33, 581–596.
Wiesenfeld, K., and Moss, F. (1995). Stochastic resonance and the benefits of noise – from ice ages to crayfish and squids. Nature 373, 33–36.
Wilkens, L. A., Hofmann, M. H., and Wojtenek, W. (2002). The electric sense of the paddlefish: a passive system for the detection and capture of zooplankton prey. J. Physiol. Paris 96, 363–377.
Willis, M. A., and Baker, T. C. (1984). Effects of intermittent and continuous pheromone stimulation on the flight behaviour of the oriental fruit moth Grapholita molesta. Physiol. Entomol. 9, 341–358.
Wright, G. A., Skinner, B. D., and Smith, B. H. (2002). Ability of honeybee, Apis mellifera, to detect and discriminate odors of varieties of canola (Brassica rapa and Brassica napus) and snapdragon flowers (Antirrhinum majus). J. Chem. Ecol. 28, 721–740.
Appendix
Methods
Discriminant analysis of time-frequency response spectrograms
The aim of this analysis was to establish whether odor-driven frequency modulation of the LFP oscillation was odor specific. There are two main approaches to investigate this: by means of unsupervised learning algorithms (e.g., k-means clustering analysis), or by means of supervised learning algorithms (e.g., discriminant analysis via support vector classifiers). In the unsupervised learning approach, all samples (in our case TFRs) are represented as points in a multidimensional space and groups of points that are closer among themselves than among others are classified together. One thus expects that all points from the same cluster belong to the same odor. In practice, however, this is seldom the case. The clouds of points from the same odor may not have radial symmetry and even worse, they may partially overlap with the “clouds” of other odors. Thus, the relative distance between points is not a good criterion to classify odors, regardless of the definition of distance (Euclidean, angular, etc.). The supervised classification approach, which is an alternative to unsupervised clustering, has been used previously to identify odor-specific patterns of neural activity in the antennal lobe of the honeybee (Galán et al., 2004). In this case, a multidimensional representation is also used but the points are labeled, i.e., assigned to an odor. Then, an optimization algorithm, the support vector classifier, (Boser et al., 1992) attempts to find a hyperplane (a plane in more than three dimensions) or another high-dimensional manifold that separates the points belonging to the same class (odor) from the rest. If successful, the manifold can be used as a classifier to identify that odor: on one side lie the points of the same odor; on the other side lie the rest. The same procedure can be repeated for each odor to compute odor-specific classifiers. Support vector classifiers have the advantage over clustering methods of tolerating some overlap (soft margin) between clouds of points from different stimuli. However, when the clouds overlap the mere existence of a separating manifold is not very informative, since both groups are not 100% separable. In such cases, the Classification Performance Index (CPI) provides a better parameter to quantify odor-specific TFR patterns; CPI is computed using the leave-one-out method (Boser et al., 1992; Galán et al., 2004): First, the separating manifold is computed after removing one point from the data set. Then, one tests if the point that was left out is correctly classified. These three steps (removal of a point, calculation of the discriminator, and classification of the point removed) are then iterated for all points of a given stimulus. The fraction of points that are correctly classified for each stimulus is the CPI. A high CPI means that the separating manifold is fairly insensitive to the removal of any given point, and hence robust to perturbations of the data set. A high CPI implies that the high-dimensional space in which the points are represented is divided into stimulus specific regions, despite some overlap between the clouds of points.
Dimensionality reduction
As a preprocessing step for TFRs discriminate analysis, we cropped out a reduced frequency–time window, which contained the vast bulk of the FM response across all TFRs (from 12 to 124 Hz and from −30 to 1000 ms); this resulted in a reduced data matrix of 118,800 pixels per TFR/response. For each response to each odor, we then defined a region of interest (ROI), consisting of all pixels that are above the 99th percentile of power density. All these ROI (9 odors × 20 repeats = 180 ROI) where overlaid to create a mask whose pixel values were “1” if that pixel was significantly activated by any odor in any trial and “0” if not. For the discriminant analysis with support vector classifiers, we only considered the pixels of the TFRs whose values in the mask were “1.” Each TFR is thus represented as a vector 24,969 components (pixels) instead of 118,800 for the cropped TFR, thereby leading to a substantial dimensionality reduction of roughly 80%.
Kernels for the support vector classifier
The vectors representing the TFRs are fed into the algorithm of the support vector classifier. The output of the algorithms returns a set of n “support vectors,”  , weights ai, and bias b that are used to classify a given vector
  according to the following equation:
where K is a kernel function. In the case of a linear kernel, it is the dot product:  and the Eq. A1 defines a plane in the high-dimensional space. If c ≥ 0, then
  is classified as a member of group 1 (e.g., odor Y), otherwise it is classified as a member group 2 (e.g., any other odor different from Y). In this paper, we also use a non-linear kernel, specifically, a third order polynomial given by:
This allows us to separate odors with a curvy manifold and the region assigned to a given odor may be composed of disjoint subregions. Using this kernel, we can discriminate TRFs from each odor group with 100% CPI.
Calculation of the confidence interval for the classification performance index
The null hypothesis to compute the confidence interval is that the two groups are completely intermingled and cannot be discriminated so that the probability that any point falls in one side of the classifier is p = 50%. In our case, the two groups correspond to the N = 20 trials of the same odor (first group) and the rest of points from all other odors (second group). Thus the probability that M out of the N points fall into the same side of the classifier is given by a binomial distribution whose mean and variance are N × P and N × P × (1-P), respectively. The binomial distribution itself is discrete. However, it can be smoothened by interpolation so that its cumulative distribution is also smooth, not staggered, and the percentiles can be calculated at any level. For example, the 95th percentile corresponds to the ratio M/N = 66.25%. This means that if the CPI is above 66.25%, we can reject the null hypothesis with 95% confidence and for each CPI value above this level the p-value is smaller than 0.05. In the CPI plots, the red line indicates this significance level.
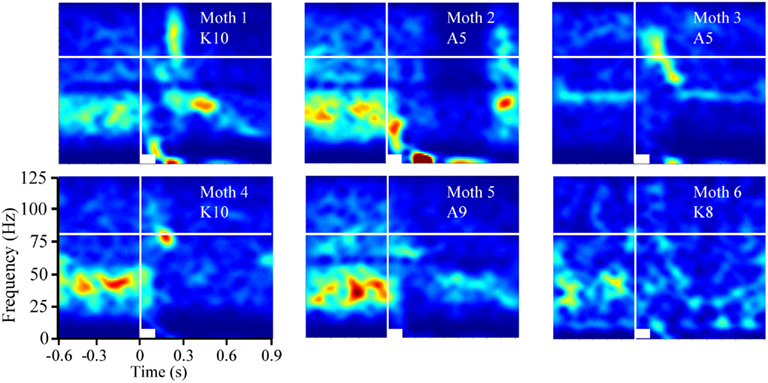
Figure A1. Averaged time frequency response (TFR) spectrogram from 6 of 10 total recordings. Displayed in each panel are the averaged results of 20 independent analyses for each of the 20 presentations for various odors (inset; K = ketone, A = alcohol; number = carbon chain length). Also inset are white bars indicating stimulus duration (100 ms). Vertical white line indicates odor onset. Horizontal white line is an 80-Hz frequency reference. Note the ongoing oscillatory activity present centered around 30–50 Hz that occurs between 600 ms until just after stimulus onset. Upon stimulus onset this activity abruptly terminates. Note too that the weakest examples are moths three and six.
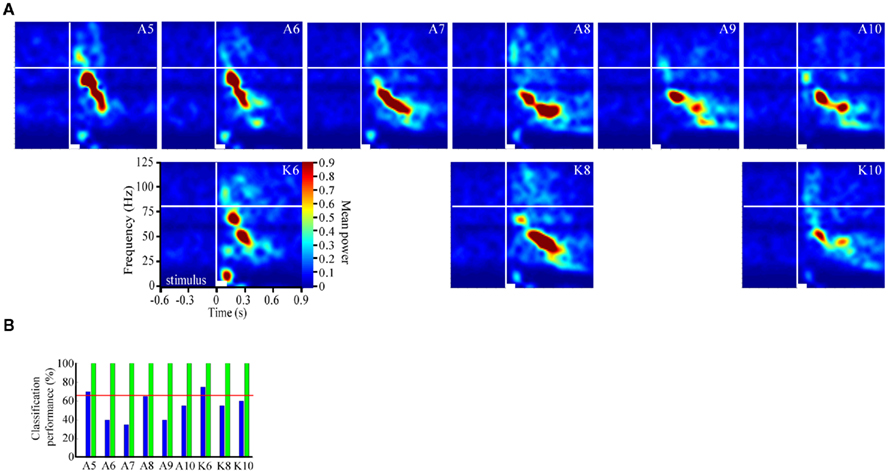
Figure A2. Replication of Figure 2 using data from a different moth to highlight that FM modulation is odor dependent. (A) Each panel represents the averaged result of 20 individual TFR analyses that were calculated, normalized and presented as described in Figure 1. Note that alcohols and ketones of common length are aligned into columns. (B) Results of the discriminant analysis for the data shown in (A). Blue Bars represent classification performance for the linear kernel function, whereas green bars represent performance of the third order polynomial kernel function. Inset red line represents the 95% confidence interval. Note that the linear kernel function classified responses of two of the nine odorants significantly above chance, whereas the polynomial function accurately classified all odor responses with 100% accuracy.
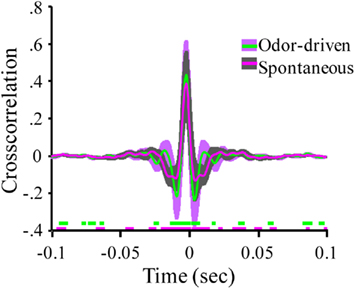
Figure A3. Expanded view of the mean cross correlations for spontaneous versus odor-driven periods. Results based on all possible pair wise comparisons between the four LFP recording sites (six in total). Odor-driven cross-correlation based on 1 s samples, starting at odor onset, for each of 180 odor stimuli per moth (N = 7 moths). Spontaneous cross correlation based on 180 1 s samples taken immediately prior to odor onset for each odor stimulus. Note that cross correlations were calculated for each stimulus and results were averaged across seven moths. Shaded regions around the mean represent ±1 SD. Inset broken lines just above the X-axis indicate where in time the cross correlation was significantly different from 0. Significance threshold for these tests was set to 2.3 × 10⁻⁶ to maintain an overall alpha of 0.01. Each color coded line corresponds to regions in time where the correlation was significantly different from zero for spontaneous (mauve) and odor-driven (green) cross correlations.
Keywords: olfaction, odor coding, oscillations, synchrony, GABAA, olfactory bulb, antennal lobe
Citation: Daly KC, Galán RF, Peters OJ and Staudacher EM (2011) Detailed characterization of local field potential oscillations and their relationship to spike timing in the antennal lobe of the moth Manduca sexta. Front. Neuroeng. 4:12. doi: 10.3389/fneng.2011.00012
Received: 07 July 2011; Paper pending published: 16 August 2011;
Accepted: 30 September 2011; Published online: 25 October 2011.
Edited by:
Thomas Nowotny, University of Sussex, UKReviewed by:
Vassiliy Tsytsarev, George Mason University, USAPaul Szyszka, Universität Konstanz, Germany
Copyright: © 2011 Daly, Galán, Peters and Staudacher. This is an open-access article subject to a non-exclusive license between the authors and Frontiers Media SA, which permits use, distribution and reproduction in other forums, provided the original authors and source are credited and other Frontiers conditions are complied with.
*Correspondence: Kevin C. Daly, Department of Biology, West Virginia University, PO Box 6057, Morgantown, WV 26506, USA. e-mail: kevin.daly@mail.wvu.edu