Study of heart rate variability in bipolar disorder: linear and non-linear parameters during sleep
- 1 Biomedical Engineering Department, Politecnico di Milano, Milano, Italy
- 2 Facultad de Ciencias, Universidad Autónoma de San Luis Potosí, San Luis Potosi, Mexico
The aim of the study is to define physiological parameters and vital signs that may be related to the mood and mental status in patients affected by bipolar disorder. In particular we explored the autonomic nervous system through the analysis of the heart rate variability. Many different parameters, in the time and in the frequency domain, linear and non-linear were evaluated during the sleep in a group of normal subject and in one patient in four different conditions. The recording of the signals was performed through a wearable sensorized T-shirt. Heart rate variability (HRV) signal and movement analysis allowed also obtaining sleep staging and the estimation of REM sleep percentage over the total sleep time. A group of eight normal females constituted the control group, on which normality ranges were estimated. The pathologic subject was recorded during four different nights, at time intervals of at least 1 week, and during different phases of the disturbance. Some of the examined parameters (MEANNN, SDNN, RMSSD) confirmed reduced HRV in depression and bipolar disorder. REM sleep percentage was found to be increased. Lempel–Ziv complexity and sample entropy, on the other hand, seem to correlate with the depression level. Even if the number of examined subjects is still small, and the results need further validation, the proposed methodology and the calculated parameters seem promising tools for the monitoring of mood changes in psychiatric disorders.
Introduction
It is now well known that the status of the central nervous system (CNS) is able to produce effects on the autonomic nervous system (ANS) and in particular on the sympatho-vagal balance. In fact, many researches reported that it is modified during stress conditions (Lambert and Lambert, 2011), mental load, attention tasks (Mizuno et al., 2011), different sleep stages (Scholz et al., 1997). Further, some psychiatric pathologies seem to be related to imbalance in the autonomic regulation (Grippo and Johnson, 2009).
One of the most diffused tools for the non-invasive assessment of the autonomic regulation is the study of the heart rate variability (HRV) signal. Its spontaneous oscillations in the short period (3–5 min) are the effect of the dynamic control exerted by the ANS, through the sympathetic and the vagal branches, on the heart frequency, and can be quantified through the calculation of many different parameters both in the time and in the frequency domain (Task Force, 1996). On the other hand also parameters related to the long-term correlation and complexity of the HRV signal (calculated on Holter recordings of 24–48 h) are indicative of the autonomic control and were found to be altered in some cardiovascular pathologies (Maestri et al., 2007).
In some mood disorders (i.e., depression or bipolar disorder) a dysregulation of the ANS was found (Cohen et al., 2003; Carney et al., 2005; Voss et al., 2006; Henry et al., 2010; Latalova et al., 2010), as testified by increased heart rate during sleep, reduced heart rate reactivity to stimuli, reduced or absent circadian heart rate rhythms. Other studies have also shown a higher heart rate in depressed patients as well as a reduced HRV (Task Force, 1996). All these are signs of an increased sympathetic activation that can be also confirmed by higher levels of plasma and urinary catecholamine in depressed patients.
On the other hand, other studies on HRV and clinical depression suggest a decrease in sympathetic tone in major depression. Patients with depression have an increased baseline heart rate in comparison with non-depressed patients. Furthermore, depressed patients have a rising heart rate pattern during sleep.
In addition, in depressed patients, the sleep/wake cycles as well as the sleep architecture are disturbed. Links between sleep and depression are strong. Literature reports that about three quarters of depressed patients have insomnia symptoms, and hypersomnia is present in about 40% of young depressed adults and 10% of older patients. These symptoms may cause distress and great impact on quality of life, and are strong risk factors for suicide. In addition to subjective experience of sleep symptoms, there are well-documented changes in objective sleep architecture related to depression. Epidemiological studies have pointed out that insomnia in non-depressed subjects is a risk factor for later development of depression (Wilson and Paterson, 2008).
Electroencephalographic studies put into evidence that a shortened rapid-eye-movements (REM) latency sometimes predicted, but sometimes did not predict a higher risk of relapse, whereas delta sleep ratio predicted a higher risk of relapse in one study. During manic episodes, patients report that they sleep very little and during episodes of depression, they often report sleeping too much. These observations have been confirmed by EEG studies (Duncan et al., 1979). Furthermore, many bipolar depressed patients show early morning awakening but also a shortened latency of the REM sleep stage in both manic and depressed episodes (Hudson et al., 1992).
In the present study we analyzed the HRV signal in one depressed patient, in different phases of the pathology, during sleep and compared the obtained results with the ones from a group of control subjects. The aims of the study are manifold: first of all we want to investigate the involvement of the ANS in depression or in bipolar disorders and its variations related to the different phases of the pathology; then we want to investigate some sleep characteristics that could be related to the pathology. The study was limited to the night period, both for short time parameters and for long-term correlation analysis. In fact, the night studies offer the possibility to record the HRV signals in a more stable condition and then to obtain more comparable results among different recordings and among different subjects: in fact, many interference variables, that are present during the day, are absent during the night. In addition, time and frequency parameters obtained from the HRV signal during the night allow estimating sleep macrostructure (as alternance of REM, non-REM, and wake stages), REM latency, sleep efficiency, and percentage of REM sleep (Mendez et al., 2010) which are able to provide useful information about quality of sleep.
Section “Clinical Protocol” describes the clinical protocols and the analysis steps, while methodologies for the calculation of HRV parameters related to the autonomic control system, both in the short and in the long period, are described in Section “Analysis Protocol,” as well as the algorithms for sleep evaluation based on HRV and movement recordings. Results related to a group of control subjects and the comparison with the patient are shown in Section “Results,” while the discussion of the results and the conclusions are in Section “Discussion and Conclusion.”
Materials and Methods
Clinical Protocol
In this work the recordings of eight healthy subjects and of one bipolar patient were considered. Healthy subjects were recorded at Forenap R&D, Rouffach, France, they are all female, between 18 and 45 years, with oral contraceptive treatment (minipills) and without:
• any psychiatric disorders;
• history of, or family history of psychiatric disorders;
• chronic medication.
They took part in the protocol implemented for the PSYCHE EU project (www.psyche-project.org) and underwent night recordings through standard polysomnography and sensorized T-shirt (SMARTEX) at the same time (Pradiso et al., 2010). The signals recorded through the T-shirt were ECG, at a sampling frequency of 250 Hz, respiratory activity at a sampling frequency of 25 Hz, and three activity signals obtained through a three-axis accelerometer (sampling frequency 25 Hz).
The bipolar patient is a 37-year-old female treated with electro convulsive therapy (ECT), and recorded at University of Pisa. The patient underwent periodic visits at time intervals of 1 week for the assessment of her clinical state. This was coded as shown in Figure 1: depression and mania are divided into three levels, while anxiety (number in parentheses) is divided in two levels: (1) means that the patient is in low anxiety state and (2) means that she is in high anxiety state (e.g., 8(2) means that the patient is mildly depressed, severely maniac, and highly anxious). After each visit she was asked to wear a sensorized T-shirt (SMARTEX) in order to allow the recording of physiological signals during the following night. The same signals as in the Forenap protocol were recorded.
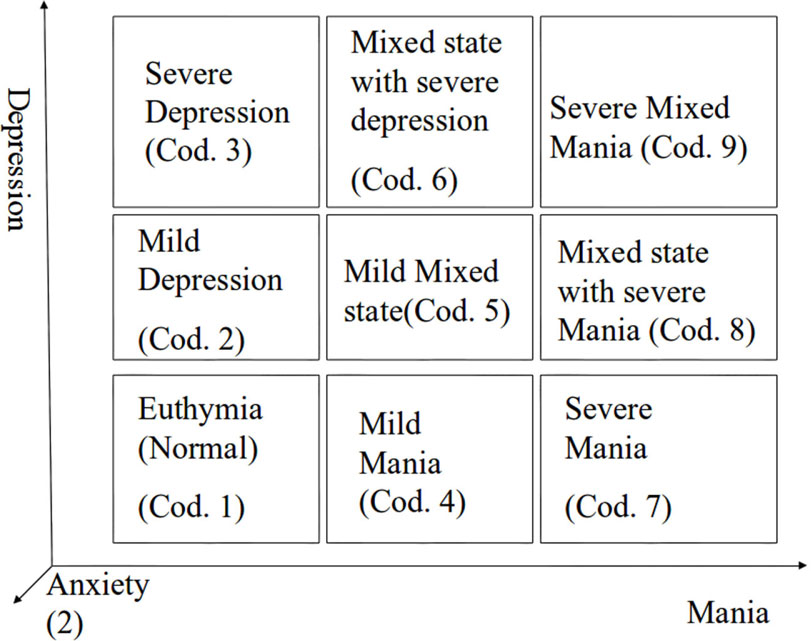
Figure 1. Graph of clinical state coding; numbers from 1 to 9 are related to Depression and Mania levels, numbers in brackets are indicator of the anxiety level.
The study was approved by the Ethical committee in Forenap and in University of Pisa and all the subjects gave their informed and written consent to participate in the study.
Analysis Protocol
For the present study the ECG and the activity signals recorded through the T-shirt were considered.
R peaks were detected from ECG using the Pan–Tompkins algorithm (Pan and Tompkins, 1985) with a fixed threshold set as the mean value of the signal, after applying filters and excluding 50% of outliers. In order to obtain only NN intervals the outliers present in the original signal (due to movement noise or to low quality in the signal, ectopic beats or arrhythmias) were discarded according to the following procedure: a new signal was created as the filtered version of the original RR series using a moving average filter with a window of 1000 samples; outliers were found as those samples respecting the condition:

where RRi is ith sample of the tachogram, Average100 and Std100 are the mean and SD values of the previous 100 samples without outliers, and then they were replaced with the value of the corresponding sample of the smoothed signal (Kemper et al., 2007).
As regard the body activity, only a Boolean activity level was considered. The three movement components in the three space directions, as recorded by the accelerometers on the T-shirt were composed in order to obtain a measure of movement:

A threshold was chosen after normalization, which was the moving average on a 60-s window of the derivative of the movement. A movement is detected when the signal overcomes the threshold.
The analysis of the NN sequences was carried out for the estimation of the parameters described in the following section.
Linear parameters
Several linear parameters were calculated both in the time and in the frequency domain.
Time-domain parameters. Three standard measures were used (Task Force, 1996):
• MEANNN – average value of the NN intervals;
• SDNN – SD of the NN intervals;
• RMSSD – square root of the mean of the sum of the squares of differences between subsequent NN intervals.
Frequency-domain parameters. In order to quantify the sympatho-vagal balance the standard frequency-domain parameters were calculated:
• Very low frequency (VLF): this spectral component is in general below 0.04 Hz (sometimes centered around 0 Hz, it accounts for long-term regulatory mechanisms that cannot be resolved in the time window usually considered for the frequency-domain analysis;
• Low frequency (LF): this component is centered around 0.1 Hz, ranging between 0.04 and 0.15 Hz. This component seems mainly related to the sympathetic activation: in fact, its power increases after sympathetic stimulation;
• High frequency (HF): this component is the expression of the respiratory arrhythmia of the heart which is the result of the vagal activity and thus is considered a marker of the parasympathetic activity controlling the heart rate.
The power of the LF and HF components evaluated in absolute, as well as in normalized units (LFn and HFn), together with their ratio LF/HF, are quantitative indices of the sympatho-vagal balance.
Different methods are commonly used for the calculation of the power spectral density (PSD) of the HRV signal. In this work an autoregressive (AR) model was used. In particular its time-variant formulation was implemented (Bianchi et al., 1993), in order to allow the analysis of the signals also during non-stationary periods that may occur during sleep.
The time-variant model returns a series of model parameters on a beat-to-beat bases that are used for the calculation of the indices of physiological interest described above.
Non-linear parameters
In order to properly describe the long-term correlation and dynamics, different parameters have been implemented as described in Bianchi et al. (2010). The parameters of interest are listed in the following.
Sample entropy. The Sample Entropy (SampEn) measures the regularity of a pattern by matching it with a given pattern of length m. If the sample pattern and the given pattern match point wise within a tolerance r, the SampEn is the negative natural logarithm of the probability that the two also match at the next point. The parameters m and r are fixed, and can be interpreted as the level of detail of the analysis and the threshold that filters out irregularities (Richman and Moorman, 2000). In this study m = 2 and r = 0.2 were adopted.
Lempel–ziv complexity. The Lempel–Ziv complexity is one of the several techniques used in information theory to measure algorithmic complexity, i.e., the minimum quantity of information needed to define a binary string. To compute the LZ complexity, a numeric sequence has to be first transformed into a symbolic sequence (Ferrario et al., 2007), then, the symbolic sequence can be parsed to obtain distinct words, and the words encoded. If LZC(n) is the length of the encoded sequence from those words, where n is the length of the original series, the LZC can be computed as LZC(2). The LZC reflects the increase of new patterns along the sequence, thus, we expect a value for LZC(n) close to n for totally random strings, in fact, any compression effort on the string would cause a loss of information.
Detrended fluctuation analysis. The detrended fluctuation analysis (DFA) is a modified root mean square analysis of a random walk (Peng et al., 1995), introduced to address the complications arisen by the highly non-stationary nature of physiological time series. The DFA is performed by the following steps:
• The time series to be analyzed, e.g., an heartbeat time series x(i), is integrated, thus mapping it to a self-similar process;
• the integrated time series is divided into boxes of equal length, n. In each box of length n, a least squares line is fit to the data;
• in each box, the integrated time series, y(k), is detrended by subtracting the local trend in the nth box;
• for a given box size n, the characteristic size of fluctuation for this integrated and detrended time series is calculated.
This computation is repeated over all time scales (box sizes) to provide a relationship between F(n) and the box size n. A linear relationship on a log–log graph indicates the presence of scaling (self-similarity) in the time series of interest, i.e., the fluctuations in small boxes are related to the fluctuations in larger boxes in a power-law fashion. The slope of the line relating log[F(n)] to log[n]determines the scaling exponent α (self-similarity parameter) of the time series (Peng et al., 1995). Two scaling exponents were used: one for the short-term fractal properties (a1: n = 4–16) and one for the long-term properties (a2: n = 16–64) (Cusenza et al., 2010).
1/f slope. The RR time series follows a power-law distribution, that means that its PSD in log–log scale can be fitted with a regression line for frequencies in the range (0–0.01 Hz). This, together with its fractal-like pattern in time, characterizes RR series as a self-affine process (Cusenza et al., 2010), at least in physiological conditions. The slope of the regression line, if a scaling law is present, is strongly correlated both with the scaling exponent of the DFA and with the fractal dimension of the process that generated the time series.
Sleep parameter
The beat-to-beat frequency-domain parameters were averaged in time windows of 30 s, according to the procedure described in Mendez et al. (2010) and used for the classification of sleep during one night of recording in non-REM, REM, and WAKE stages. The sleep staging was performed using Linear Discriminant on the features extracted from the RR series and body movements (Migliorini et al., 2010).
Body movements extracted as described above, were mainly used to identify WAKE stages, according to the observation that during sleep body movements are reduced (Ancoli-Israel et al., 2003).
The percentage of REM sleep with respect of the total sleep time (REM% TST) was calculated. Figure 2 shows the tachograms related to a normal subject (panel B) and a patient (panel C), while panels A and D represent, respectively the sleep stages during the night as estimated form the HRV and movement signals according to the described procedure. It is possible to note differences in the amount of REM stage percentage between healthy subject and bipolar patient.
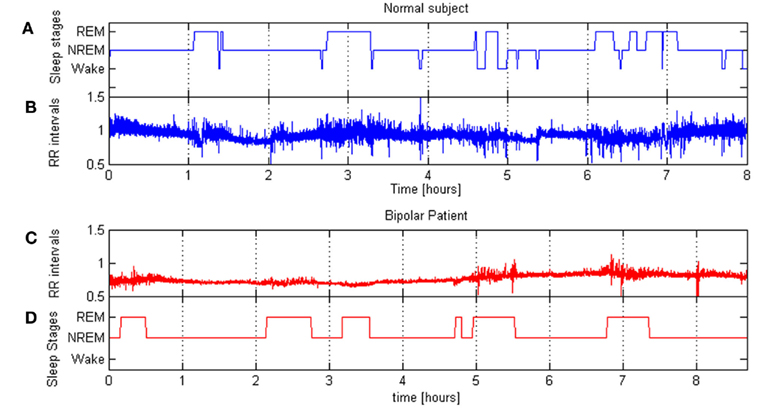
Figure 2. (B,C) show RR series of a normal subject and a bipolar patient during a night sleep; (A,D) show corresponding hypnograms.
The extracted parameters were analyzed, in order to show differences between the bipolar patient and the healthy subjects. An extensive statistical analysis was not possible, as only one patient was included in the study, thus we calculated normal ranges from healthy subjects’ parameters. For each parameter, the lower threshold for the normal range was set in correspondence of the 5th percentile, while the higher threshold was set at the 95th percentile.
Results
Our database consists in the RR series and movement signals from eight healthy subjects recorded during one night of sleep, and in four RR series and movement signals from one bipolar patient recorded during different nights in correspondence of the periodic clinical visits as described in Section “Clinical Protocol.” The present work aims at comparing the patient with the control group, in order to identify parameters which could be able to discriminate pathological states.
Table 1 shows the values of the parameters for the healthy subjects, together with their mean values and SD represented in the last column. Besides the parameters listed in Section “Analysis Protocol,” also Δ_LFn and Δ_LF/HF were calculated as the difference between the maximum and then minimum value of LFn and LF/HF during the night. Maximum and minimum are referred to epochs of 30 min each, on which sleep staging is based. These parameters quantify the capability of the ANS to react to sympathetic stimuli, and are usually decreased when the circadian variations of the autonomic balance is compromised or when the subject presents a high basal level of sympathetic activation (i.e., in stressed subjects; Lucini et al., 2005).
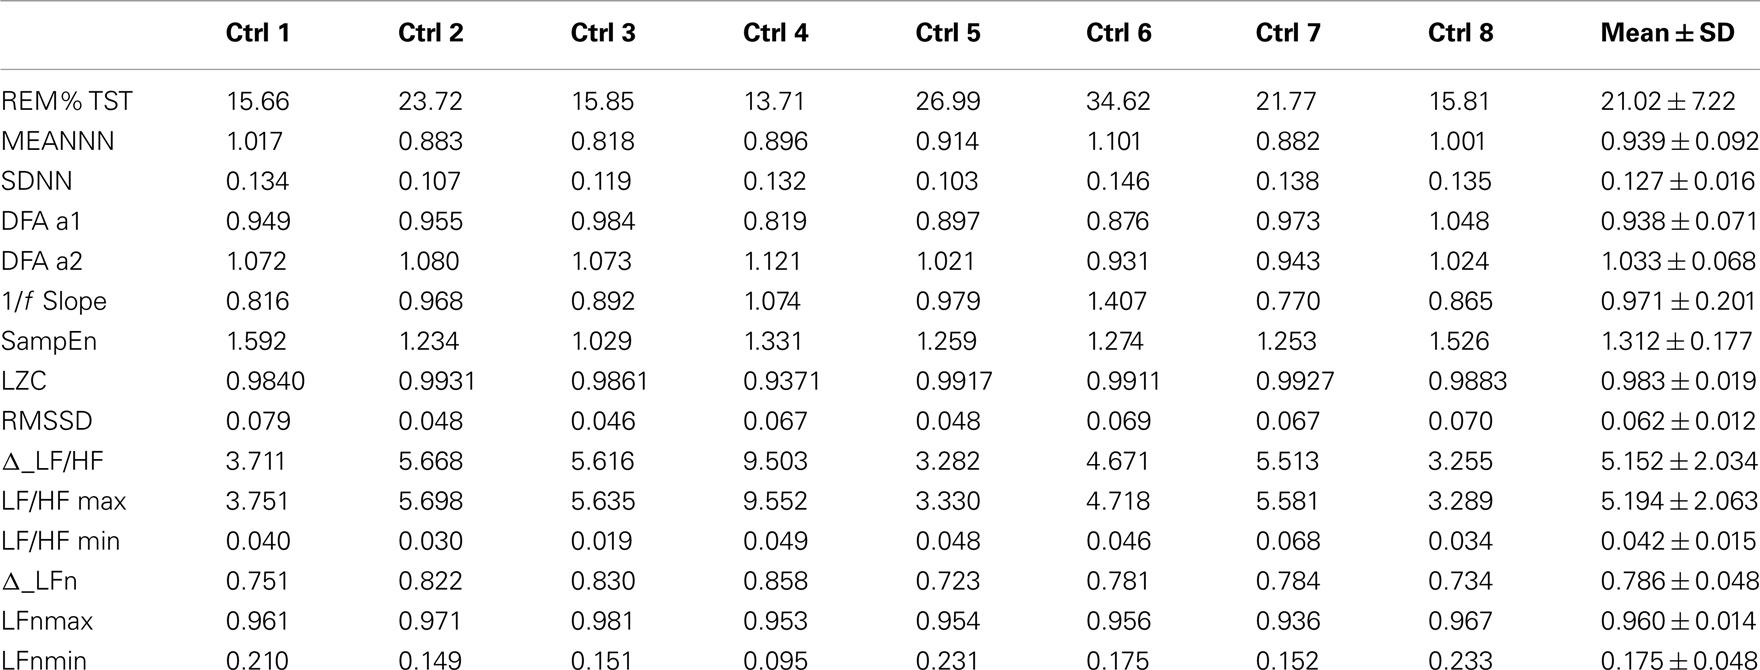
Table 1. Values of the parameters considered in this work from healthy subjects (Ctrl).
Table 2 shows the same parameters for the bipolar patient: each column is related to a different night recording. She was recorded while she was in different clinical states: her variations in mood state were related to changes in depression and anxiety levels. During the first and the third night the patient was anxious and mildly depressed, during the second night she was also anxious but the depression level was higher, while during the fourth night the patient was in a normal state (no anxiety and no depression).
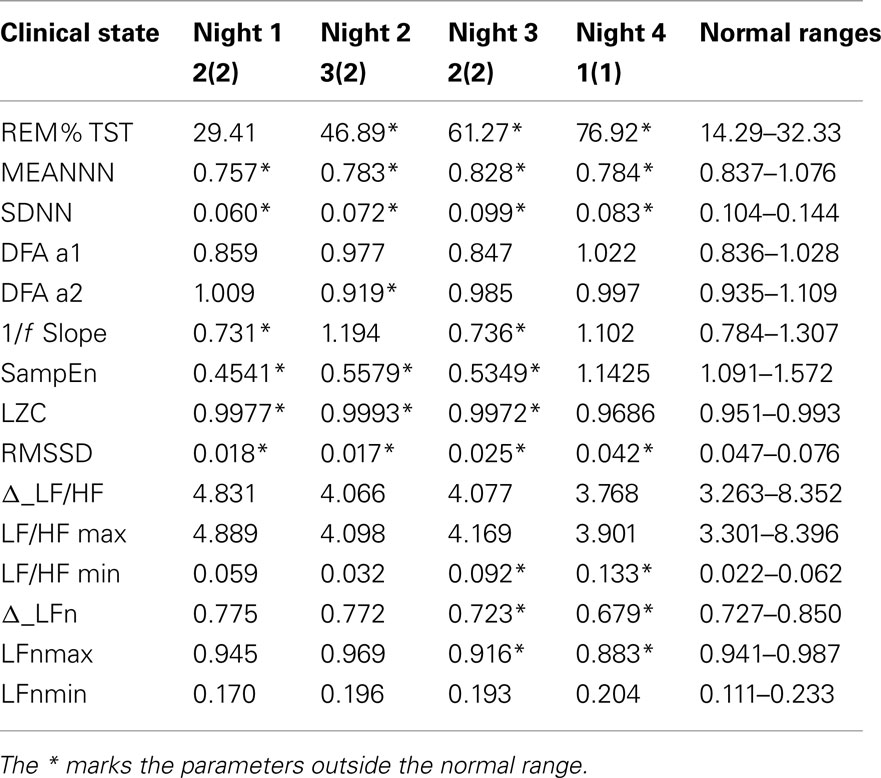
Table 2. Values of the parameters considered in this work from four nights of sleep of a bipolar patient, and then related normality ranges obtained from the control group.
As only one patient was available for this study, a statistical analysis is not possible. In order to compare the patient with the control group, normal ranges were defined as the 5th and the 95th percentiles of each variable. These normality ranges are represented in Table 2 and a * marks the patient’s parameters that fall outside the normality range.
In particular the percentage of REM sleep, the SD of the RR series and the SampEn are indices that seem to discriminate this patient from the controls. Figure 3 shows some of the calculated parameters as median values with the 5th and the 95th percentile from the control group. The values obtained from the patient (red dots) fall outside these ranges, except for RR mean value and the binary LZC that return into the normal range in state 1(1).
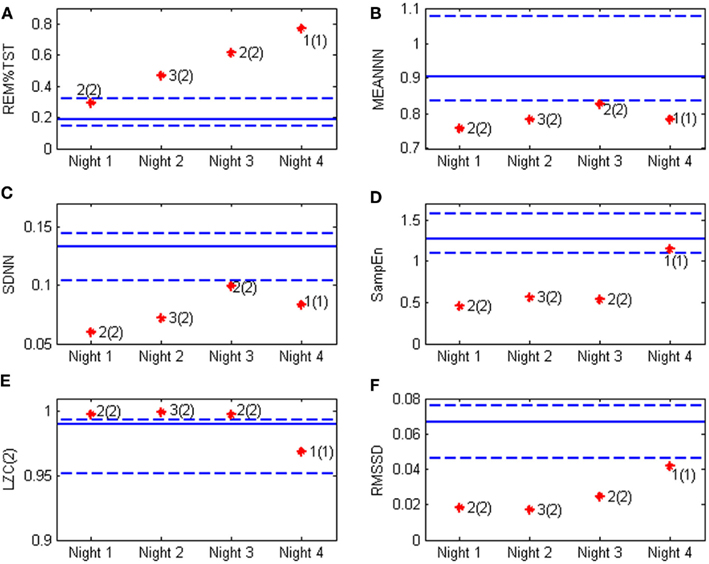
Figure 3. Heart rate variability and sleep parameters obtained from the bipolar patient (stars) compared with the values obtained from the control group. Continuous line represent the median value in normal subjects, while the dotted lines are respectively the 5th and the 95th percentile, the red stars represent the patient’s values in the four night of recording and the clinical evaluation is also reported according to the classification depicted in Figure 1. The values of interest are (A) REM%TST: the percentage of REM sleep on total sleep time; (B) MEANNN: the mean value of the NN sequence; (C) SDNN: the SD of the NN sequence; (D) SampEn: the sample entropy; (E) LZC(2) the Lempel–Ziv complexity; and (F) RMSSD: the square root of the mean of the sum of the squares of differences between subsequent NN intervals.
Figure 4 shows the scatterplot of LZC and SampEn values for normal subjects (blue dots) and the patient during the four recorded nights (red dots). This plot is particularly interesting because it shows that the bipolar patient is well separated from healthy subjects when the depression level is high, while she is inside the healthy cluster for the fourth night, when she was evaluated in state 1(1) by clinicians.
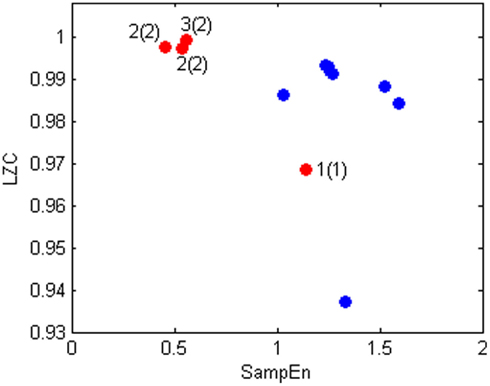
Figure 4. Scatter plot of LZC(2) and SampEn values of bipolar patient (red) and healthy subjects (blue).
Discussion and Conclusion
In this paper we have compared many different HRV parameters (time and frequency-domain parameters, linear and non-linear indices, sleep quality) from one bipolar patient recorded during different phases and levels of her pathology, with a group of normal subjects. The aim was to put into evidence ANS dysfunctions that might be related to the bipolar disorder. The shown results put into evidence that some of the presented parameters were able to reach the aims of this work. The obtained results reflect what was already reported in literature: in fact, reduced values of MEANNN in the bipolar patient denote an increase of heart rate and reduced values of SDNN and RMSSD suggest a lower HRV (Task Force, 1996) that may be related to an increased sympathetic drive on the heart. It is also possible to notice an increased percentage of REM sleep with respect of the TST in the bipolar patient. This abnormality was previously reported by Hudson et al. (1992). However, REM percentage remains high also when the clinical state is classified as normal [state 1(1)]. This finding is confirmed in Paykel et al. (1995) which report REM sleep anomalies as a residual symptom after remission in depression.
Some other interesting considerations can be done on the basis of the extracted parameters. Differences between the bipolar patient and the group of healthy subjects were found in SampEn and LZC values. These parameters seem to be well related to the mood state; Figure 4 shows an increase of regularity (decrease in entropy) but also of complexity related to the increase in depression and anxiety levels.
According to the comparison with normal ranges, MEANNN, SDN, RMSSD, and REM% TST might be therefore considered as useful indicators to discriminate between healthy and bipolar subjects, while SampEn and LZC may be related the level of depression and anxiety.
It is worth noting that all the parameters considered in this work were obtained during night recordings, and not through the study of Holter data, as usually reported in literature. This, however is not a limitation, because during sleep and night it is possible to study the ANS without all the external disturbances (activity level, environmental conditions, emotional states, etc.) that may affect the results during the day, and the observed variations can be more easily related to the clinical conditions of the subjects (Bianchi et al., 1993). However, it is important to remark that this is only a preliminary study on a single subject compared to a small group of control subjects. A more detailed study on more subjects is needed to (i) obtain a better estimation of the normality ranges for the evaluated parameters; (ii) validate the results found on this single subject; (iii) explore possible correlations with other clinical states. In addition, it will be important to better explore other factors that may have an influence on the calculated parameters, and in general on HRV, such as age, gender, and comorbidities.
On the other hand it is important also to observe that the RR series and body movements examined in the present work were obtained through a wearable device (the SMARTEX T-shirt system; Pradiso et al., 2010) which can record signals without interfering with the subject’s daily life. This system was used at home by the patient and represents an innovative approach for monitoring psychiatric disturbances. Furthermore the presented parameters are automatically calculated and the needed software can be easily implemented on a portable device, due to its simplicity and low computational cost: this further improves the effective possibility of home-care applications. This opens new possibilities for the home monitoring of subjects affected by psychiatric pathologies, for the early detection of mood changes and relapses and for a more focused and personalized therapy.
Conflict of Interest Statement
The authors declare that the research was conducted in the absence of any commercial or financial relationships that could be construed as a potential conflict of interest.
Acknowledgments
The present research was founded by the PSYCHE 247777 EU project. The authors are thankful to the physicians who took part in the clinical recordings and provided the data and the clinical evaluation of the examined subjects. In particular we would like to thank Dr. Sandra Werner and Dr. Geoffrey Viardot form Forenap and Dr. Claudio Gentili and Dr. Emiliano Ricciardi Form University of Pisa.
References
Ancoli-Israel, S., Cole, R., Alessi, C., Chambers, M., Moorcroft, W., and Pollak, C. P. (2003). The role of actigraphy in the study of sleep and circadian rhythms. Sleep 26, 342–392.
Bianchi, A. M., Mainardi, L. T., Petrucci, E., Signorini, M. G., and Cerutti, S. (1993). Time-variant power spectrum analysis for the detection of transient episodes in HVR signal. IEEE Trans. Biomed. Eng. 40, 136–144.
Bianchi, A. M., Mendez, M. O., Ferrario, M., Ferini-Strambi, L., and Cerutti, S. (2010). Long-term correlations and complexity analysis of the heart rate variability signal during sleep: comparing normal and pathologic subjects. Methods Inf. Med. 49, 479–483.
Carney, R. M., Freedland, K. E., and Veith, R. C. (2005). Depression, the autonomic nervous system, and coronary heart disease. Psychosom. Med. 67, S29–33.
Cohen, H., Kaplan, Z., Kotler, M., Mittelman, I., Osher, Y., and Bersudsky, Y. (2003). Impaired heart rate variability in euthymic bipolar patients. Bipolar Disord. 5, 138–143.
Cusenza, M., Accardo, A., D’Addio, G., and Corbi, G. (2010). Relationship between fractal dimension and power-law exponent of heart rate variability in normal and heart failure subjects. Comput. Cardiol. 935–938.
Duncan, W. C. Jr., Pettigrew, K. D., and Gillin, J. C. (1979) , REM architecture changes in bipolar and unipolar depression. Am. J. Psychiatry 136, 1424–1427.
Ferrario, M., Signorini, M. G., and Magenes, G. (2007). Comparison between fetal heart rate standard parameters and complexity indexes for the identification of severe intrauterine growth estriction. Methods Inf. Med. 46, 186–190.
Grippo, A. J., and Johnson, A. K. (2009). Stress, depression and cardiovascular dysregulation: a review of neurobiological mechanisms and the integration of research from preclinical disease models. Stress 12, 1–21.
Henry, B. L., Minassian, A., Paulus, M. P., Geyer, M. A., and Perry, W. (2010). Heart rate variability in bipolar mania and schizophrenia. J. Psychiatr. Res. 44, 168–176.
Hudson, J. I., Lipinski, J. F., Keck, P. E. Jr., Aizley, H. G., Lukas, S. E., Rothschild, A. J., Waternaux, C. M., and Kupfer, D. J. (1992). Polysomnographic characteristics of young manic patients. Comparison with unipolar depressed patients and normal control subjects. Arch. Gen. Psychiatry 49, 378–383.
Kemper, K. J., Hamilton, C., and Atkinson, M. (2007). Heart rate variability: impact of differences in outlier identification and management strategies on common measures in three clinical populations. Pediatr. Res. 62, 337–342.
Lambert, E. A., and Lambert, G. W. (2011). Stress and its role in sympathetic nervous system activation in hypertension and the metabolic syndrome. Curr. Hypertens. Rep. 13, 244–248.
Latalova, K., Prasko, J., Diveky, T., Grambal, A., Kamaradova, D., Velartova, H., Salinger, J., and Opavsky, J. (2010). Autonomic nervous system in euthymic patients with bipolar affective disorder. Neuro Endocrinol. Lett. 31, 829–836.
Lucini, D., Di Fede, G., Parati, G., and Pagani, M. (2005). Impact of chronic psychosocial stress on autonomic cardiovascular regulation in otherwise healthy subjects. Hypertension 46, 1201–1206.
Maestri, R., Pinna, G. D., Accardo, A., Allegrini, P., Balocchi, R., D’Addio, G., Ferrario, M., Menicucci, D., Porta, A., Sassi, R., Signorini, M. G., La Rovere, M. T., and Cerutti, S. (2007). Nonlinear indices of heart rate variability in chronic heart failure patients: redundancy and comparative clinical value. J. Cardiovasc. Electrophysiol. 18, 425–433.
Mendez, M. O., Matteucci, M., Castronovo, V., Ferini-Strambi, L., Cerutti, S., and Bianchi, A. M. (2010). Sleep staging from heart rate variability: time-varying spectral features and hidden Markov models. Int. J. Biomed. Eng. Technol. 3, 246–263.
Migliorini, M., Bianchi, A. M., Nistico‘, D., Kortelainen, J., Arce-Santana, E., Cerutti, S., and Mendez, M. O. (2010). “Automatic sleep staging based on ballistocardiographic signals recorded through bed sensors,” Annual International Conference of the IEEE Engineering in Medicine and Biology Society (EMBC), Buenos Aires, 3273–3276.
Mizuno, K., Tanaka, M., Yamaguti, K., Kajimoto, O., Kuratsune, H., and Watanabe, Y. (2011). Mental fatigue caused by prolonged cognitive load associated with sympathetic hyperactivity. Behav. Brain Funct. 23, 7–17.
Pan, J., and Tompkins, W. J. (1985). A real-time QRS detection algorithm. IEEE Trans. Biomed. Eng. 32, 230–236.
Paykel, E. S., Ramana, R., Cooper, Z., Hayhurst, H., Kerr, J., and Barocka, A. (1995). Residual symptoms after partial remission: an important outcome in depression. Psychol. Med. 25, 1171–1180.
Peng, C. K., Havlin, S., Stanley, H. E., and Goldberg, A. L. (1995). Quantification of scaling exponents and crossover phenomena in nonstationary heartbeat time series. Chaos 5, 82–87.
Pradiso, R., Bianchi, A. M., Lau, K., and Scilingo, E. P. (2010). “PSYCHE: personalised monitoring system for care in mental health,” in 32 International Annual Conference of IEEE-EMBS, Buenos Aires, 1–4.
Richman, J. S., and Moorman, J. R. (2000). Physiological time-series analysis using approximate entropy and sample entropy. Am. J. Physiol. Heart Circ. Physiol. 278, H2039–H2049.
Scholz, U. J., Bianchi, A. M., Cerutti, S., and Kubicki, S. (1997) , Vegetative background of sleep: spectral analysis of the heart rate variability. Physiol. Behav. 62, 1037–1043.
Task Force. (1996). Heart rate variability. Standards of measurement, physiological interpretation and clinical use. Task Force of the European Society of Cardiology, and the North American Society of Pacing, and Electrophysiology. Eur. Heart J. 17, 354–381.
Voss, A., Baier, V., Schulz, S., and Bar, K. J. (2006). Linear and nonlinear methods for analyses of cardiovascular variability in bipolar disorders. Bipolar Disord. 8, 441–452.
Keywords: bipolar disorder, HRV signal, sleep, entropy, detrended fluctuation analysis, 1/f slope, symbolic dynamics, wearable devices
Citation: Migliorini M, Mendez MO and Bianchi AM (2012) Study of heart rate variability in bipolar disorder: linear and non-linear parameters during sleep. Front. Neuroeng. 4:22. doi: 10.3389/fneng.2011.00022
Received: 31 July 2011;
Accepted: 20 December 2011;
Published online: 10 January 2012.
Edited by:
Enzo Pasquale Scilingo, University of Pisa, ItalyReviewed by:
Hun-Kuk Park, Kyung Hee University, South KoreaHari S. Sharma, Uppsala University, Sweden
Copyright: © 2012 Migliorini, Mendez and Bianchi. This is an open-access article distributed under the terms of the Creative Commons Attribution Non Commercial License, which permits non-commercial use, distribution, and reproduction in other forums, provided the original authors and source are credited.
*Correspondence: Anna M. Bianchi, Department of Biomedical Engineering, Politecnico di Milano, Piazza L. da Vinci 32, Milano 20133, Italy. e-mail: annamaria.bianchi@polimi.it