Olfactory sensor processing in neural networks: lessons from modeling the fruit fly antennal lobe
- Department of Neurobiology, University of Konstanz, Konstanz, Germany
The insect olfactory system can be a model for artificial olfactory devices. In particular, Drosophila melanogaster due to its genetic tractability has yielded much information about the design and function of such systems in biology. In this study we investigate possible network topologies to separate representations of odors in the primary olfactory neuropil, the antennal lobe. In particular we compare networks based on stochastic and homogeneous connection weight distributions to connectivities that are based on the input correlations between the glomeruli in the antennal lobe. We show that moderate homogeneous inhibition implements a soft winner-take-all mechanism when paired with realistic input from a large meta-database of odor responses in receptor cells (DoOR database). The sparseness of representations increases with stronger inhibition. Excitation, on the other hand, pushes the representation of odors closer together thus making them harder to distinguish. We further analyze the relationship between different inhibitory network topologies and the properties of the receptor responses to different odors. We show that realistic input from the DoOR database has a relatively high entropy of activation values over all odors and receptors compared to the theoretical maximum. Furthermore, under conditions in which the information in the input is artificially decreased, networks with heterogeneous topologies based on the similarity of glomerular response profiles perform best. These results indicate that in order to arrive at the most beneficial representation for odor discrimination it is important to finely tune the strength of inhibition in combination with taking into account the properties of the available sensors.
1. Introduction
The design of artificial olfactory systems can benefit greatly from a comparison with natural olfactory systems in animals. For example, the olfactory system of insects has an evolutionary history of more than 400 million years, resulting in a highly efficient and functional network of neurons that process olfactory information. To make use of this evolutionary design knowledge, we need to understand the interaction between the characteristics of olfactory receptors and the processing in the first olfactory neuropil, the antennal lobe (AL).
Drosophila melanogaster is an ideal model system to study this interaction. The available genetic tools have allowed the detailed and extensive study of both olfactory receptor neurons and the architecture of downstream processing networks. The processing stream in Drosophila starts with a number of olfactory receptor neurons (ORNs) on the antenna that transduce chemical stimuli into neural signals. Each ORN expresses a few olfactory receptor types and then projects to one glomerulus in the AL where ORNs synapse onto projection neurons (PNs; Vosshall et al., 1999; Gao et al., 2000; Bargmann, 2006). Receptor neurons of the same type expressing the same receptor mostly project to only one glomerulus (Vosshall et al., 1999). The PNs then carry information from the glomeruli to higher brain areas like the mushroom bodies or the lateral horn (Stocker, 1994). Glomeruli can be identified on anatomical and physiological optical sections of the AL and it has therefore been possible to establish the spatiotemporal response patterns specific to particular odor stimuli (Fiala et al., 2002; Wang et al., 2003; Silbering and Galizia, 2007; Silbering et al., 2008). The activation patterns in the AL are not only caused by stimulus-dependent receptor activation but also by secondary lateral activation within the AL. This internal AL processing is mediated by local interneurons (LNs) that are activated by ORNs and PNs and influence the activity of other ORNs and PNs (Wilson and Laurent, 2005). Drosophila harbors different subsets of LNs both inhibitory as well as excitatory (Olsen et al., 2007; Shang et al., 2007), with the inhibitory type being more prominent (Wilson et al., 2004; Kazama and Wilson, 2008).
The LNs in the AL of Drosophila and other insects play an important role in the processing of odor information. For example in honeybees it has been shown that the specific heterogeneous connectivity patterns of LNs in the AL are able to decorrelate similar odor representations and hence facilitate odor identification (Sachse and Galizia, 2002). This type of connectivity has been analyzed in detail (Linster et al., 2005). In Drosophila homogenous global inhibition is beneficial for the processing of odor stimuli by means of stimulus normalization that allows for efficient encoding of odorant stimuli at different concentrations (Kazama and Wilson, 2008; Asahina et al., 2009) and equalization that maximizes the mutual information of stimuli and representation in downstream processing areas (Luo et al., 2010; Olsen et al., 2010; Satoh et al., 2010). These results also fit well with evidence from anatomical studies in which in Drosophila inhibitory LNs have dense connections throughout the antennal lobe (Stocker et al., 1990; Olsen and Wilson, 2008).
In this study we investigate the interaction between the distribution of receptor response profiles and the processing in different AL network architectures. In particular we focus on the ability of a processing network to make odor representations easier to discriminate. If, in a simplified model, one assumes linear interactions between glomeruli it is possible to represent AL networks as matrices and the resulting processing as a dot product of this matrix with the input vector. The input to our model network comes from the DoOR database (Galizia et al., 2010) which interpolates real physiological response data into relative activation values over a large bank of test odors. This allows us to integrate the odor-response data from the Drosophila olfactory system into our model.
We start off by analyzing the odor separation performance in AL networks derived from basic connectivity principles. In a simplified example we show the relationship between excitation and inhibition for these networks. Performance is evaluated by looking at the pair-wise angular separation between odor vectors. This generic description of separation of representations makes reasonable assumptions about the downstream readout networks. We show that with the default response profile distributions of the receptors in the DoOR matrix best performance is achieved with global inhibition between glomeruli and moderate connection weights. Lastly we systematically change the entropy of the input matrix while simultaneously evaluating the performance of our model networks. Under conditions with relatively low entropy in the input matrix connectivity that is based on input correlations is more successful in separating odors than other networks.
2. Materials and Methods
2.1. Linear Transformations in the AL
Drosophila with its roughly 50 glomeruli (Laissue et al., 1999) and the ease of targeted genetic manipulations is an ideal animal for detailed cellular and molecular analyses. It thus offers a lot of detailed information that can be used for computational models. However, even in this very limited system the number of free parameters can quickly become unfeasible to chart. Also, neurons in the AL have a complex structure and are most likely not straight-forward to model with Hodgkin-Huxley equations derived from the squid giant axon. In this study we therefore made the following simplifying assumptions:
1. We neglected the temporal structure of odor stimuli and represented each odor as a static N-dimensional vector of activation values where N corresponds to the number of measured receptor neurons.
2. We assumed that transfer of activity between ORNs and PNs in the glomeruli has a linear input/output relationship and that interactions with other glomeruli by means of excitatory and inhibitory local neurons are also linear.
3. We set all diagonal values in the connectivity matrix to 1. This implies that every olfactory receptor neuron activates its directly efferent projection neurons with the same strength. If there are no intra-AL connections the input vectors get multiplied with a unity matrix and hence the input equals the output.
4. We assume that an activation of zero represents a completely silent cell. Hence we set all negative activation values to 0.
Under these assumptions it is possible to represent the transformation of olfactory neuron activation to PN output as a single connectivity matrix that incorporates all intermediate steps of processing. Let x be the input vector of olfactory receptor activations and y be the output of PN activations, where h, g are activations of intermediate interneuron populations (only two of them considered for simplicity, without loss of generality). These neuron populations have size nx, ny, nh, and ng, respectively. The connectivity between population α to population β can be expressed in terms of a matrix Wαβ of size nα-by-nβ. In this matrix the element Wi,j maps the activation of unit i in the source population to unit j in the target population (Figure 1).
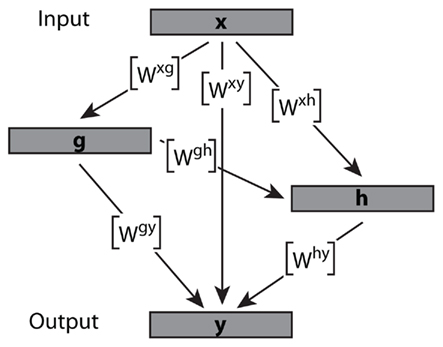
Figure 1. Example of a hierarchical AL network in which the interactions between neuron populations can be reduced to a single weight matrix. The activation of neuron subpopulations is contained within vectors x, g, h, and y. Ultimately the combined matrices map the input x onto the output vector y.
Then the output of this feedforward network can be characterized as:

where Wαβ is the connectivity matrix from population α to population β of size nα-by-nβ. The non-x terms can be described within a linear regime as
Substituting the terms from equations 2 and 3 into equation 1 results in
By means of distributivity
where all matrix multiplications inside the brackets result in matrices of size nα-by-nβ and can hence be added to give one single connectivity matrix. This simplification holds for all linear feedforward networks.
The anatomy of the first-order olfactory relay in insects can hence be approximated by a single compound connectivity matrix that represents the functional interactions between glomeruli (Figure 2A). This matrix provides a linear map from the input x to PN output y:
where yj is the activity of a projection neuron, xi is the activity of an olfactory receptor neuron in response to an odorant stimulus, wij is the connection weight from ORN i to PN j, and Φ is the activity transfer function. This is equivalent to the dot product between a vector and a matrix in linear algebraic terms. Conveniently the vector elements correspond to the activation of ORNs and the weight matrix represents the functional interactions between glomeruli (Figure 2B). In our simulations the dimensionality of x and of y are identical, reflecting the natural situation in insects, where the number of glomeruli corresponds to the number of receptor neuron input families, an where uniglomerular projection neurons of a single glomerulus share their response properties (Hallem and Carlson, 2006).
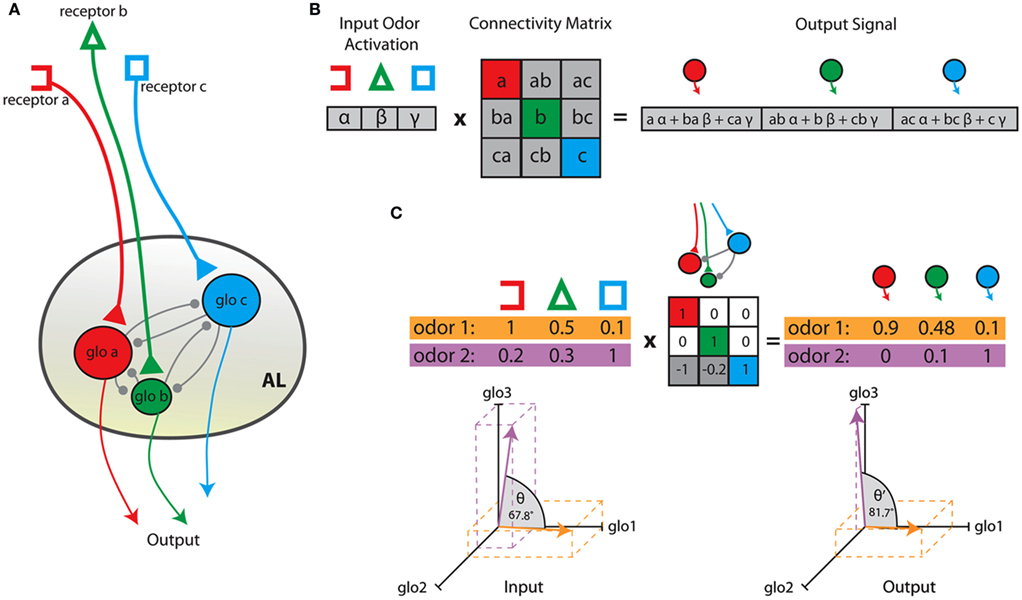
Figure 2. Schematic of the relationship between antennal lobe anatomy and the linear transformation model. (A) Shows a simplified antennal lobe architecture. Different receptor types innervate one glomerulus exclusively (color-coded). Local interactions (gray) between glomeruli are mediated by local interneurons. The output from the AL is the activation of PNs in each glomerulus. (B) Odors are represented as vectors of receptor activation and can be transformed into PN output by means of multiplication of the input vector with a connectivity matrix. Diagonal values correspond to a gain factor on the activation of each glomerulus whereas non-zero off-diagonal values lead to interglomerular interactions. (C) Shows an example multiplication for two odors and a hypothetical AL network with inhibitory connections from glomerulus c to a and from glomerulus c to b. Negative output neuron activity is set to 0. The diagrams show an increase in angular distance in 3D space between the two odor vectors before (left) and after (right) AL processing.
The activation values from the DoOR input matrix are scaled between 0 and 1 where 0 corresponds to the neuron being silent. Similarly we implement a lower limit for the projection neurons creating linear threshold dynamics:
2.2. Input Data
As input data we used the DoOR database of odorant responses (Galizia et al., 2010). This database uses a sophisticated interpolation algorithm to combine odorant responses from different studies and provides response values from 50 receptor types to 250 odorant stimuli (Figure 3A). In order to decrease the amount of empty values in the input matrix we excluded all receptors that (a) did not have a known glomerular target, and (b) had recorded responses to less than 70 odorants. We also excluded all odorants with responses measured in less than 8 receptor types. This left us with an odorant receptor response matrix with 137 odorant responses in 22 receptor types. All missing values (ca. 10%) were filled in with the spontaneous activity values. All receptor types in our input matrix had a known one-to-one correspondence with one AL glomerulus so that we could assume the receptor activation to be equal to the input activation in the corresponding glomerulus.
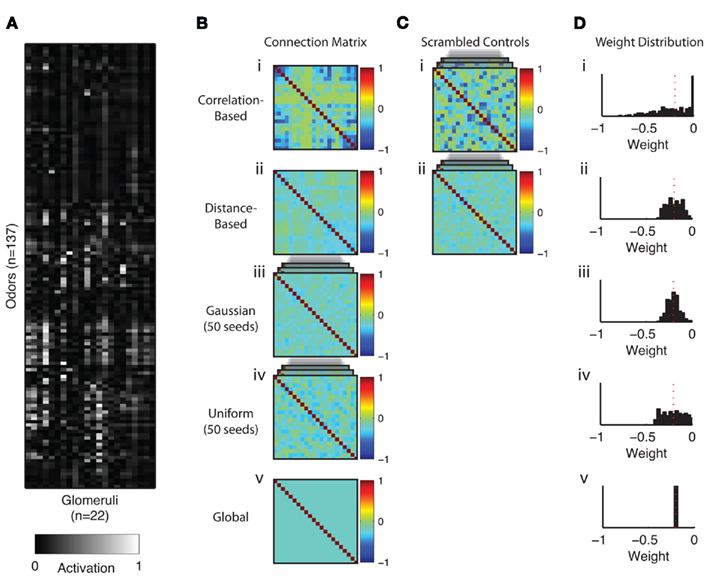
Figure 3. Input data and connection matrices derived from different schemes. (A) Activation values in the DoOR input matrix. (Bi–v) AL connectivity matrices. (C) Scrambled control matrices (50 different random seeds). (D) Distribution of connection weights in the matrices. All matrices were normalized to have the same mean of the off-diagonal values as the correlation-based matrix. This is indicated by the red dotted line. The positive diagonal values are not shown in the histograms.
2.3. Generation of Connectivity Matrices
We generated connectivity matrices according to certain design principles previously hypothesized to play a role in the interglomerular interactions in Drosophila and other insects (e.g., Linster et al., 2005). In particular, we were interested in the question if networks based on external factors such as response similarity or spatial position in the antennal lobe provide advantages over random networks of similar connection strength distributions. To this end we calculated a matrix of correlation coefficients of size 22 by 22 from the input matrix. There are several possible ways to translate correlation coefficients into connection weights. The main question is how to interpret negative values (indicating anti-correlation between input vectors of two glomeruli). We set all negative coefficients in the matrix to zero and then normalized all values to fall in the range from 0 to 1. We also tested alternative scenarios, e.g., to scale all correlation values or to translate anti-correlation into excitatory connections, with only minor quantitative effects (data not shown). As a last step the diagonal values were all set to 1 in order to simulate the direct input from the ORNs to the PNs in the glomeruli. This resulted in a 22 × 22 connection matrix with unity value on the diagonal and otherwise negative values. Glomeruli with highly correlated input profiles were thus set to have inhibitory influence on each other, proportional to their input correlation coefficients (Figure 3Bi). In order to test to what extent this correlation-based matrix is superior to a random matrix we scrambled the values in the original matrix, keeping the diagonal and overall symmetry intact (Figure 3Ci). Repeating this step with different random seeds generated 50 control matrices with the same distribution of connection weights as the original (Figure 3Di).
In a second step we also generated matrices based on the spatial location of glomeruli within the antennal lobe. We calculated the Euclidean distance between the center of the glomeruli from a 3D reconstruction of a whole AL (Laissue et al., 1999), normalized these values to fit on a range between 0 and 1. Again, the diagonal was set to 1 (Figure 3Bii). We generated 50 control matrices as described above (Figure 3Bii). There are in fact many ways in which the spatial distances between glomeruli can be assessed, e.g., taking into account the connectivity paths of neurites in the antennal lobe. Here we restricted ourselves to a simple Euclidean distance assuming that the resulting connectivities form a generic, if not necessarily accurate, representation of distances in the AL. It should be noted that in the fruit fly, glomeruli fill the antennal lobe in the entire volume. The situation is different to that found in mammals or in honeybees, where glomeruli form a hemispheric sheet. In the latter situation, geometric distance can be calculated in multiple ways (along the sheet, through the center of the AL, etc.). This does not apply for the fruit fly.
Two unrelated types of matrices were constructed by sampling connections from a Gaussian and uniform probability distribution. Fifty matrices were generated with different random seeds (Figures 3Biii,iv) and the diagonal set to 1.
Lastly we tested the performance of a matrix approximating an architecture of global inhibition mediated by a single inhibitory neuron. For this connectivity matrix we fixed all off-diagonal weights to one value equivalent to the mean off-diagonal weight of the correlation-based matrix (Figure 3Bv). The diagonal was again set to 1.
All resulting networks were normalized to have the same mean weight value (see Figure 3C). The overall efficacy of the inhibitory connections was changed by multiplying all off-diagonal values with a scaling factor. This factor was the only free parameter in our model. A negative scaling factor is hence equivalent to an inhibitory network and a positive scaling factor to an excitatory network.
2.4. Quantification of Separability
To benchmark the performance of different AL networks we measured the geometric angle between odorant response vectors. We assumed that two odorants are more easily separable if the angle between their response vectors is larger. The performance P of a network was quantified as the mean of the sine of the angles between all odors.
where P is the performance index and αij is the angle between odors i and j. The term before the sum normalizes the result by the number of angles between the vectors, taking into account only the top half of the angular distance matrix. Taking the sine of the angles has the advantage of promoting a large number of smaller angles over a few large angles in the performance index. Figure 2C shows an example of how input data and connectivity matrix interact to change the angle between two arbitrary vectors in two-dimensional space.
In addition, we sought to evaluate the metabolic efficiency of the tested networks. Since the possible activity value in each glomerular unit was limited to positive values strong inhibition that resulted in negative activation was wasted from a metabolic stand point. We hence evaluated the efficiency E of representation by first calculating zjk as the PN activations to odor k without setting negative values to 0:
and then calculating E as the mean negative overshoot over all odors for each network:
using Iverson brackets for the conditional sum. E is hence 0 in the most efficient case where there is no overshoot. The more negative the value for E the less efficient the network. Similarly, the sparseness S of a representation was estimated by calculating the proportion of silent glomeruli over all odors.
where yj,k are the PN activations as in equation 7 but for all odors, and njk is the number of elements in the output matrix (22 glomeruli × 137 odors).
Input data from the DoOR database was prepared in R. All simulations were carried out using MATLAB (Natick, MA, USA).
2.5. Changing Input Entropy
Lastly we were interested in how the specific distribution of receptor activations present in the DoOR matrix interacts with the network models described above. We hypothesized that networks based on relatively homogeneous inhibition would perform well in scenarios in which response profiles for different odors are well-separated in the input by their strongest responsive glomeruli. If, however, the input is structured so it is often the same glomeruli that is the most active across odors, homogeneous inhibition will not be able to implement a winner-take-all mechanism as efficiently. In order to evaluate this systematically we calculated a measure for the input matrix that is related to the Shannon entropy (Shannon, 1948) of the responses of each glomerulus over all odorants in the database, Hglo:
where n is the number of glomeruli used, 22, and p(x) is the probability of seeing a particular activity value in this glomerulus. Instead of binning the response values we transformed them into a rank order code by first assigning a number to each odor response in the input matrix so that for each odor stimulus the most active glomerulus was 1, the second most active glomerulus was 2 and so on. The total entropy of an input matrix was then calculated as
where m is the number of odors in the matrix. The original DoOR input matrix had an Htot of 57.6. The theoretical maximum of our measure value distribution of a 137 × 22 input matrix would be 68.0 if activity values were optimally distributed over glomeruli for all odors. Interestingly the original DoOR derived input matrix scores quite high on our entropy score, showing that over the tested odors glomerular responses are distributed quite homogeneously.
We generated input matrices with different Htot by taking the original DoOR matrix and progressively ordering individual odor vectors to have the first glomerulus responding the strongest, the second glomerulus the second strongest, and so on. The extreme case where all odor vectors are ordered for response strength then has an Htot of 0.
3. Results
3.1. Simulations in a Two-Dimensional System
We first asked what network types are more successful in separating odors in our simple vector model. We started by looking at the angular separation of two arbitrary vectors (Figure 4A) in two-dimensional space. This is equivalent to 2 odors being represented by 2 hypothetical glomeruli and the interaction between the glomeruli is the algebraic equivalent of a multiplication of the vectors with a shear matrix. An example with 2 different sets of parameters for m and n shows an increase of angular separation with negative and a decrease of separation with positive values (Figure 4B). Figure 4C shows the increase in angular separation between the two vectors shown in Figure 4A as the off-diagonal values m and n are altered systematically from negative to positive values. The highest increase in angular distance between the two vectors is in the lower left corner approaching point 2 with negative values of m and n. This indicates that inhibition will be particularly efficient in separating the angular distance between odor vectors in contrast to lateral excitation. If m, n ∈ ℝ+ as in point 1 the angle between the two vectors decreases toward 0.
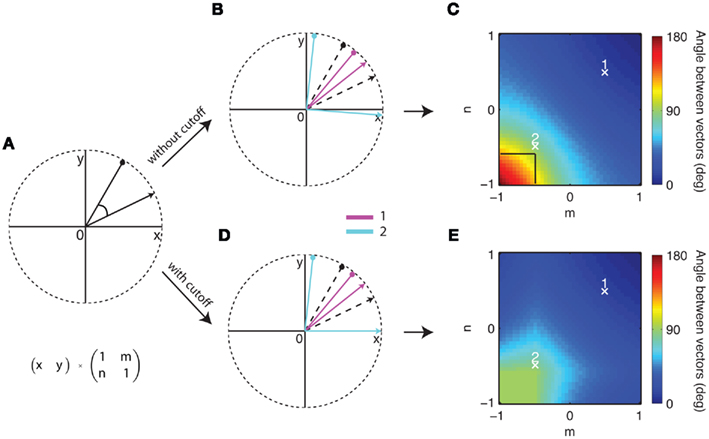
Figure 4. The effect of a two-dimensional shear matrix on two arbitrary vectors (A). (B) Shows an example of the separation of the input vectors in (A) – black dashed lines – at two points in m, n space. Negative values of m, n separate the vectors (cyan) whereas positive decrease the angle between them (magenta). (C) Shows the angle between the example vectors from (A) over a range of m and n from −1 to 1. The example values from (B) are marked with white crosses. In general, the more negative m and n the larger the angle of separation between the two vectors becomes. In the (D,E) all negative values in the output vector are set to zero restricting the maximum separation that can be achieved to 90°. For a direct comparison the black box in (C) indicates the maximum separation in (E).
In our networks we limit the activation values of our model neurons to values between 0 and 1. If these boundary conditions are implemented with the two example vectors a similar pattern emerges as before (Figure 4D). It becomes apparent that the dependence of angular separation on the parameters m/n in this “cutoff” condition (Figure 4E) is similar to the general case (Figure 4C) in the sense that the best separation is achieved with negative values m and n.
The first analysis of the two-vector scenario does not easily allow us to postulate that inhibition is necessarily the best way to achieve angle separation in the realistic case with 22 dimensions and 137 odor vectors. The following analysis is therefore based on numerical simulations with real input data from the DoOR database.
3.2. Simulations with Real-World Input Data
We next asked how different network architectures performed in separating the input odor vectors for a potential downstream readout mechanism in a multidimensional system. We measured the angular distance between all odor pairs in these different conditions. We assumed that in general a larger Euclidean angle between two odor vectors will make the two underlying odors more easily separable. Note, that we did not make any explicit assumptions about the exact form of a readout mechanism.
This multidimensional analysis confirmed that in general lateral inhibition pushes the distribution of angles between odor vectors up toward the maximum of 90° (Figure 5). If the scaling parameter is positive (i.e., the lateral interaction is excitatory) the angles between odors decrease, pushing individual vectors closer together, and making them more difficult to separate by a readout mechanism. It can be observed that with moderate inhibition the natural distribution of angles between odor vectors is shifted toward larger angles. This is due to the resulting sparsification of the odor vectors. Small glomerular activations get pushed to zero by strong lateral inhibition. Geometrically, this means that an increasing number of angles between odors become perpendicular in glomerulus space. At a scaling factor around the value of −0.5 many vectors have become perpendicular and the distribution is not visible any more. However, this comes at the cost that some odor representations end up with an identical representation in the output. With very high negative scaling an increasing number of vectors effectively have zero length and cannot be distinguished from each other (Figure 6A). The number of vectors that are effectively identical starts to increase with scaling values lower than −0.5 (Figure 6B). This image is the same for all network types tested with the notable exception of the correlation-based network. This network type has a much less homogeneous development of the distribution of angles between odor vectors with high negative scaling factors (Figure 5A). This is mirrored in the minimum vector length which is generally higher than in the other networks for scaling factors below −0.5 (Figure 6A). With such high negative scaling the correlation-based network also has an advantage when comparing the number of identical vectors after processing to the other network types (Figure 6B).
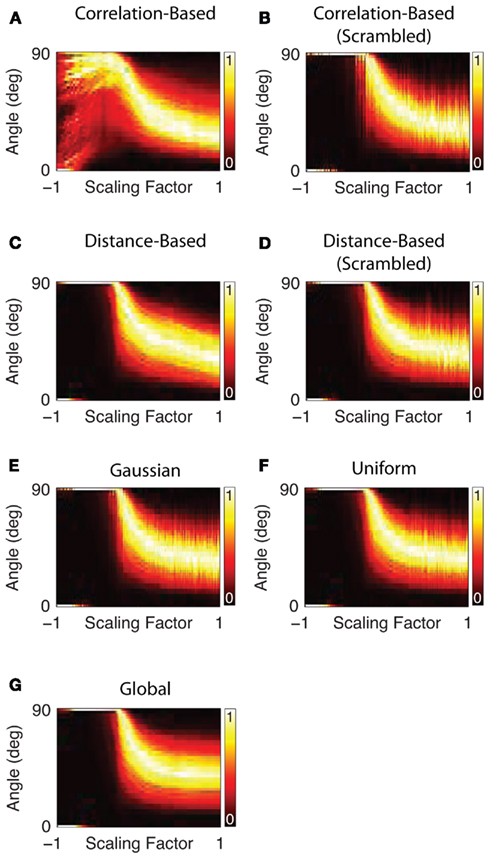
Figure 5. Angle separation between all odor pairs in different AL network models. Each figure shows the distribution of pairwise angles between odor vectors (false-color coded) as a function of the scaling factor. For each scaling value the resultant distribution of angles is normalized so that the most probable angle is 1. A positive scaling factor indicates excitation and a negative scaling factor inhibition. The flip from the condition where all angles are 90–0° is an artifact of the very small vector lengths due to high negative scaling (see Figure 6).
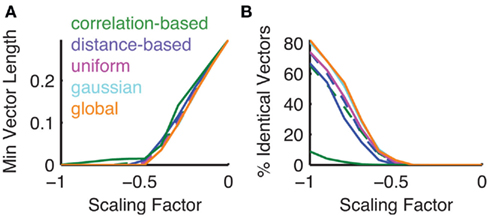
Figure 6. Analysis of vectors after processing by different network types. (A) The minimum vector length for all network types apart from the correlation-based network shows a decrease to 0 at scaling values around −0.5. Dashed lines indicate mean results over 50 seeds for the scrambled versions of the correlation-based (green) and distance-based networks (blue). (B) Similarly the number of identical vectors that cannot be distinguished increases drastically at scaling values more negative than 0.5. This effect is attenuated in the correlation-based network.
A systematic comparison of the separation performance of different types of network using the performance index in equation 9 is shown in Figure 7. Again moderate inhibition was able to separate odor representations whereas excitation and strong inhibition decreased the separation performance. In our model with the natural DoOR matrix input, networks derived from input correlations performed worse in separating odor vectors from each other than random networks, globally inhibited networks, or the network derived from the spatial relationships between glomeruli in the AL. Note, that this is not due to the heterogeneous distribution of connection weights (see Figure 3Di) as the scrambled version of the correlation-based matrix performs similarly to the other networks.
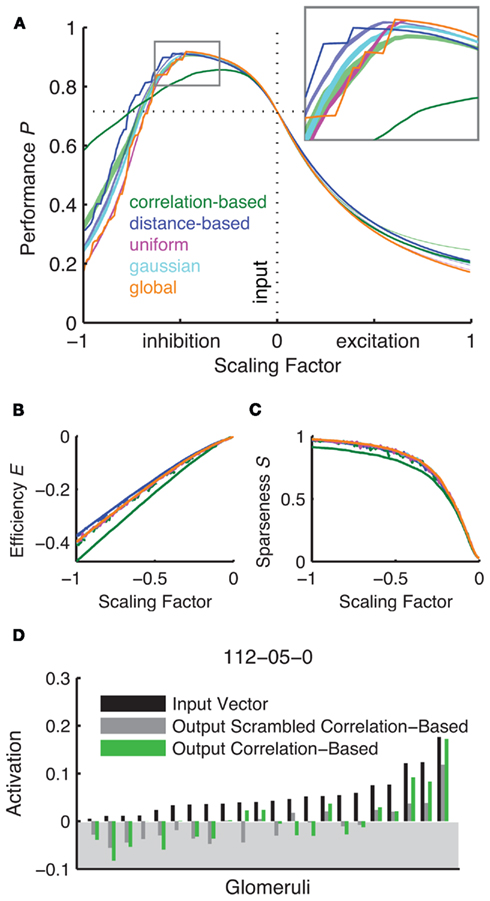
Figure 7. Inhibitory networks lead to an increase in angular separation between odor pairs. A peak in performance can be observed with moderate inhibition (A) as compared to strong inhibition and excitation. The inset shows a magnification of the different network types’ performance around the peak. Unity connection matrix performance is indicated with the dotted horizontal line. The random networks are represented by shaded areas of 50 seeds ±1 SEM (green for the correlation-based scrambled network and blue for the distance-based scrambled network). (B,C) Show the efficiency and sparseness of the resulting transformation against different scaling factor values. Here the mean of 50 different scrambled version is shown as a dashed line in green for the correlation-based and blue for the distance-based network. Positive scaling factors are excluded as they do not produce overshoot/sparseness. (D) Shows example odor representations before and after AL processing for nonaic acid at a scaling factor of 0.25, negative activity would be set to 0 (shaded area).
Another important factor is the metabolic efficiency with which a system is able to perform its tasks. We therefore asked to what extent each of the networks produces inhibition that exceeds the necessary amount for silencing the glomeruli. The efficiency as calculated in equation 11 mirrors the results from network performance. It is near identical for all network types apart from the correlation-based network which is slightly less efficient in this measure.
To explain why the performance and angle distributions of the correlation-based network are different from the other networks we next looked at how sparse the odor vectors become after AL processing. We hypothesized that in the input-correlation-based network strong glomeruli tend to inhibit each other selectively and prevent the winner-take-all mechanism inherent in the more homogeneously inhibited networks. If this was the case then we would expect that sparseness as defined by the number of silent glomeruli (equation 12) would be lower than in the other networks. Figure 7C shows the relationship between the sparseness S and the scaling factor. Indeed, the correlation-based network produces noticeably less sparse representations of odors than the other networks. This becomes even more apparent when looking at the representation of an example odor after processing. Figure 7D shows the relative activation values before (input) and after processing by two networks of the correlation-based type and its scrambled control. While both the correlation-based and scrambled correlation-based network generate sparse representations this sparseness is more heterogeneous in the correlation-based network, i.e., the amount of input activation is no reliable predictor for the resulting output activation in this network. Due to the stochasticity of the scrambled network the weakest inputs also lead to the weakest outputs. Because the amount of effective inhibition is the same in both networks the heterogeneous output in the functional network case interacts with the zero-cutoff threshold to result in less sparse networks. This is most visible in the distribution of angles after processing (Figure 5A).
3.3. Different Input Entropies
In order to compare the performance of different AL network types under changing input statistics we first generated a number of networks with different Shannon entropies. We determined the best possible network instance for each network type by sweeping over a range of negative scaling factors and then plotting only the best possible performance against the entropy of the input network (Figure 8). The random network types (scrambled controls, Gaussian, and uniform) were tested with 10 different random seeds and did not show large SEM. We also tested two different types of correlation-based networks: one that was based on the original input data (correlation-based) and one where the correlation-based weights were recomputed for each instance of the input data (correlation-based flexible).
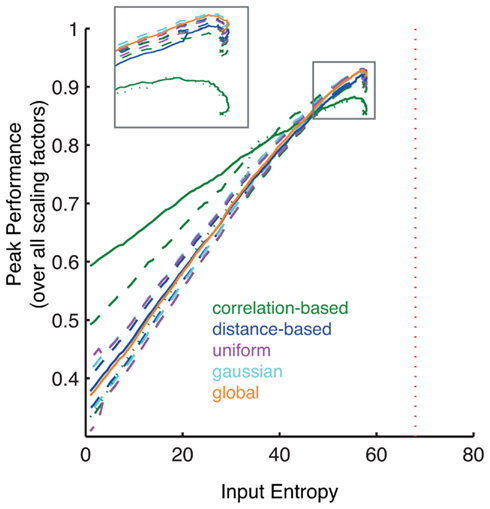
Figure 8. Change of peak performance with different constructed input entropies. The lower the entropy the less random the input odor matrix. The Peak Performance refers to the mean sine angle differences as in Figure 7A, tested over a range of negative scaling factors. The vertical red dotted line is the theoretical maximum. The crosses represent the peak performances of the input from the original DoOR matrix. Dashed lines indicate the mean ± 1 SD for the random networks, testing 10 different random seeds. The dotted line is a correlation-based network that has been recalculated with each new instance of the input data. With increasing entropy the peak performances decrease. The inset shows a magnification of the peak performances with high entropies. Note, that the lower SD line for the scrambled correlation-based networks is mostly hidden underneath the line for the uniform networks.
At first, the performance in all networks increases slightly (Figure 8). The input data set contains some correlations and therefore has entropy below the theoretical maximum. These inherent correlations are reduced when odor vectors are ordered, leading to the initial increase in entropy.
After the transient increase the peak performances decrease drastically: input with less information leads to less information in the output. Note, that the peak performance values drop below their initial values at lower entropies levels than in the original data. This asymmetry is based on the entropy formula (equation 13). At first the entropy increases because individual rank order values in a given response profile become more likely. As more and more values become identical though, the log term increases non-linearly.
The peak odor-response separation performance of each network type is thus highly dependent on the total entropy of the input matrix (as measured by our index). While the correlation-based network performs worse than the other networks at the entropy of the DoOR input it performs better than other networks with input matrices of lower entropy. This can not be attributed to the heterogeneous distribution of connection weights in this matrix, as its scrambled control also falls below the performance of the unscrambled network. Surprisingly, if the correlation-based network is recomputed with each new instance of the input this network type loses its advantage at low entropies.
A different pattern emerges with the global inhibition network with decreasing entropy. Under high entropy conditions this network type performs generally better (Figure 8, inset) but performance decreases more drastically under low input entropy conditions. The networks based on random distributions have performances in between these two network type. These results emphasize the importance of the interaction between the statistical properties of the input and the AL network processing. Studying both independently does not reveal the full picture.
4. Discussion
Here we have presented a model of the Drosophila antennal lobe input-output transformation under the assumption that the topological effect of the network at this level in the odorant processing stream can be approximated by linear functions. This facilitates both the modeling and analysis and provides an intuitive understanding of underlying interactions. Thus while our model – as every simplifying model – can analyze some critical features of the AL network, it can not be taken as an explanation of the natural situation. It can, however, be used as a guide for artificial olfaction, where simplified algorithms add to the efficiency.
In particular, our results help to understand the role that inhibitory interactions play in influencing separability of odorant stimuli as measured by the average pair-wise angular distance between odor representations. To start with, the simplification of the problem into a two-dimensional space allows us to appreciate the connectivity between glomeruli and the resulting interactions as the off-diagonal values in a shear-type transformation matrix. We showed that both in an unbounded scenario and in a scenario where only positive activations are allowed negative shear values separate vectors inside the space (Figure 4). This underlines the robustness of this modeling approach. Positive shear values push vectors together with the extreme scenario of making the vectors all point in the same direction.
Such a simplified description can only serve to highlight the key principles of linear interactions in the AL. It is important to also take into account both the statistics of real input data. One aspect not analyzed here is the interaction of v vectors in n-dimensional space where v ( n, i.e., when the number of odors that need to be coded is much higher than the number of available odor sensors (glomeruli). We anticipate that in this case the optimal solution is likely to be based on the exact distribution of the input vectors in space, as suggested by our entropy analysis (Figure 8, and see below). A study by Schmuker and Schneider (2007) used a large input dataset generated from the chemical properties of more than 800 odorants and found similar winner-take-all dynamics in a correlation-based lateral inhibition network under the assumption that receptive fields in olfactory sensory neurons are indeed equivalent to the ones generated in the study.
The high level of abstraction in our model has some advantages over more classical approaches. The simplicity of the underlying equations leads to a relatively small number of free parameters.
A neural network model with close-to-realistic neurons needs to model the electrical properties of the neurons (Bazhenov et al., 2001; Linster et al., 2005). A single Hodgkin-Huxley neuron model with only sodium, potassium, and leak currents will already require at least 19 parameters to be tuned (maximum conductance and reversal potential plus 4 parameters for activation and inactivation variables for each current, plus membrane capacity; Hodgkin and Huxley, 1952). As a consequence, a simplification of the theoretical description of such networks has already been implemented in other studies (Luo et al., 2010; Papadopoulou et al., 2011). We believe that our simplified model with linear threshold neurons and only one free parameter (scaling factor) and one set of assumptions (the connectivity values in the matrix) is the most parsimonious model that allows to draw conclusions about the network topology. In addition, the resulting speed of simulation allows for the efficient coverage of large parts of the parameter space. In this way it was possible to map the relationship between glomerular interaction and network performance exhaustively.
For the networks that we tested we observed a common pattern. As predicted by the reduced two-dimensional model, inhibition led to vector separation whereas excitation led to a reduction of angles between odor vectors. This has potential advantages for the reliability of recognition of certain odors but comes at the cost of a lower capacity for odor representation when the number of available coding dimensions is much lower than the number of odor identities the fly needs to be able to distinguish. It is not known what this number is in flies (i.e., how many odors need to be distinguished ecologically); in our simulation the number of odors was about 6-fold (137 odors for 22 glomeruli). It should be noted that the antennal lobe does not only compute odor discriminability. Odor identity (as an interplay of generalization and discriminability) and concentration invariance are but two of several additional tasks likely to be relevant in the antennal lobe network. It is feasible that excitatory interneurons play an important role here. The processes observed here potentially allow for a graded mechanism in which modulatory connections attenuate interglomerular inhibition and hence the sparseness of AL output. This could serve to adjust the reliability-capacity trade-off to the requirements of the animal’s environment or life stage. We also found that in all networks inhibition strength has a sweet spot, suggesting that biological systems carefully adjust the amount of inhibition that is exerted in their networks. With increasing inhibition the network degenerates, i.e., several odors collapse onto the same output vector. In addition, output vectors become too short, thus losing robustness against noise.
All networks were subject to a soft winner-take-all mechanism. The network based on input correlations exhibited a more complex behavior when subjected to strong interglomerular inhibition and the winner-take-all effect was attenuated. This is due to the fact that the inhibition in the correlation-derived connectivity matrices focuses on the glomeruli that have the highest correlations. This biases the inhibition toward active glomeruli and can leave less active glomeruli that have uncorrelated response profiles unaffected. The separation of odor vectors by soft-winner-take-all dynamics can thus only occur in part in this type of network. This effect is no consequence of the heterogeneity of the connection weights in the correlation-based networks, as shown by the fact that the scrambled version of the network (with the same distribution of weights) performs like the stochastic versions. One important side-effect is that the correlation-based network is less sensitive to non-optimal scaling factors at the cost of lower peak performance – that is performance degrades more gracefully in correlation-based networks.
We compared odor separability by measuring the angle between all available odor vectors. A maximum odor separation capacity would result from a maximization of the angles between all the odors in the high-dimensional coding space. This measure does not make precise assumptions about the possible readout mechanism nor does it include a measure of ecological relevance for the animal. While in our benchmark all odors are equally important it is likely that the biological system places emphasis on odors that are frequently encountered or ecologically very important. Further, with some odor families, generalization might be more desirable than discrimination. Unfortunately, we currently lack the data to encorporate such features in our objective function. One study in honeybees looked at the output activation patterns of PNs in the AL and found that in these insects the physiological solution appears to be a correlation-based connectivity pattern (Linster et al., 2005). Apart from the anatomical differences between honeybees and fruit flies, this apparent contradiction could well be explained by such heterogeneity in the optimal odorant representation map. It is likely that different benchmark functions will lead to different optimal AL networks. Nevertheless the processing strategy characterized here can still be implemented whenever odors of similar ecological value need to be distinguished.
Our benchmark is based on physiological observations first studied in bees and later in several animal species, and considers concentration invariance (Sachse and Galizia, 2003). When dynamic odor-evoked activity patterns are represented in a multidimensional space, they form characteristic trajectories which quickly reach a set point, and then decay more slowly back to baseline (Friedrich and Laurent, 2001; Stopfer et al., 2003; Galán et al., 2004; Silbering et al., 2008). Interestingly, different concentrations of the same stimulus have transients that point into the same direction, but reach less far. Thus, in a static representation that considers only the set point, and not the dynamic trajectory (as done in this study), the vector direction contains the information about odor quality, and vector size contains the information about odor concentration (Sachse and Galizia, 2003).
Of course such a reduced description can not account for all aspects of information processing that have been shown to play an important role in the discrimination of odors in the AL of Drosophila and other species. Firstly, the transfer functions of individual PNs are not linear but saturate toward high activations. This is especially important for coding requirements like concentration invariance. Our linearity assumption is thus valid over a restricted dynamic range in which the transfer function evolves roughly linearly. Secondly, the neglect of temporal information rules out any sort of temporal coding strategy. Such strategies have been found to play an important role for example in locusts (Wehr and Laurent, 1996).
Our numerical simulations clearly indicate that a connectivity in the Drosophila AL that is based on input correlations is not superior in separating odor vectors as compared to randomly constructed networks, which show superior performance. Connectivity matrices that are based on the distance between glomeruli fare similarly well as the random networks. This is an important result especially in the light of recent studies that characterize LN connections in Drosophila as homogeneous and global (Olsen and Wilson, 2008; Olsen et al., 2010). Here we show that under realistic input conditions derived from the DoOR database a globally inhibited network with homogeneous connection weights has the best odor separating performance. In neuroengineering scenarios in which neural networks are implemented on a VLSI chips this network is also the most simple to realize (Beyeler et al., 2010; Schmuker et al., 2011).
An analog picture is painted when looking at the total amount of inhibition that is exerted between the glomeruli. When measuring how much excess inhibition was produced by each network type we observed a less efficient inhibition only with the correlation-based network (Figure 7). This is important if one considers the metabolic costs of extensive inhibitory networks. This measure of metabolic costs and efficiency in our simplified model is admittedly far removed from a physiological description of metabolic efficiency and can only serve as a rough estimate of coding costs.
Lastly, we aimed to characterize the interaction between the statistical properties of the input matrix with the performance of our model networks. Our findings have important implications for the design of artificial olfaction systems. We have shown that different network types have contrasting odor separation performance depending on the response profiles of the odorant receptors. Global inhibition is most successful under conditions in which odor representations are evenly distributed over glomeruli, that is when the input network has high entropy (Figure 8). On the other hand, AL networks that inhibit glomeruli based on the degree of similarity between their response profiles (e.g., as calculated with a pair-wise correlation coefficient) perform better than random networks when the entropy of the input data is artificially reduced. This effect is somewhat surprising as in our simulations lower entropy networks are also less similar to the correlation matrix that underlies the connectivity. This effect can neither be attributed to the distribution of connection weights nor to the decorrelation between glomeruli because both the scrambled correlation-based network (with the same distribution) nor the flexible correlation-based network that was recomputed for each instance of the input (with higher decorrelation) perform worse than the simple correlation-based network.
Surprisingly, performance first increases slightly and then goes on to decrease drastically over all network types, as was to be expected. The initial increase is an expression of how much entropy is present in the original input data set. Some of the correlations in the dataset are decreased by the ordering of individual odor vectors when generating input matrices with lower entropy. If the receptor activations were mathematically optimally distributed across the whole input space this increase would disappear.
Summing up, our results show that a moderate level of global inhibition creates improved odor representations in the natural case of the Drosophila antennal lobe. Thus, this would be a good starting point for the processing of data from artificial chemosensory arrays. More importantly, however, we show that the best network is also dependent on the input statistics, which in turn is dictated both by the sensors used, and by the chemical to be detected. As a consequence, it is worth investigating the optimal network for each application. We propose a simplified simulating environment that allows for an efficient analysis of many possible networks, easy to be implemented when designing artificial noses.
Conflict of Interest Statement
The authors declare that the research was conducted in the absence of any commercial or financial relationships that could be construed as a potential conflict of interest.
References
Asahina, K., Louis, M., Piccinotti, S., and Vosshall, L. B. (2009). A circuit supporting concentration-invariant odor perception in Drosophila. J. Biol. 8, 9.
Bazhenov, M., Stopfer, M., Rabinovich, M., Huerta, R., Abarbanel, H. D. I., Sejnowski, T. J., and Laurent, G. (2001). Model of transient oscillatory synchronization in the locust antennal lobe. Neuron 30, 553–567.
Beyeler, M., Stefanini, F., Proske, H., Galizia, C. G., and Chicca, E. (2010). “Exploring olfactory sensory networks: simulations and hardware emulation,” in Biomedical Circuits and Systems Conference BIOCAS, 2010 IEEE, Paphos, 270–273.
Fiala, A., Spall, T., Diegelmann, S., Eisermann, B., Sachse, S., Devaud, J.-M., Buchner, E., and Galizia, C. G. (2002). Genetically expressed cameleon in Drosophila melanogaster is used to visualize olfactory information in projection neurons. Curr. Biol. 12, 1877–1884.
Friedrich, R. W., and Laurent, G. (2001). Dynamic optimization of odor representations by slow temporal patterning of mitral cell activity. Science 291, 889–894.
Galán, R. F., Sachse, S., Galizia, C. G., and Herz, A. V. M. (2004). Odor-driven attractor dynamics in the antennal lobe allow for simple and rapid olfactory pattern classification. Neural Comput. 16, 999–1012.
Galizia, C. G., Münch, D., Strauch, M., Nissler, A., and Ma, S. (2010). Integrating heterogeneous odor response data into a common response model: A door to the complete olfactome. Chem. Senses 35, 551–563.
Gao, Q., Yuan, B., and Chess, A. (2000). Convergent projection of Drosophila olfactory neurons to specific glomeruli in the antennal lobe. Nat. Neurosci. 3, 780–785.
Hallem, E. A., and Carlson, J. R. (2006). Coding of odors by a receptor repertoire. Cell 125, 143–160.
Hodgkin, A. L., and Huxley, A. F. (1952). A quantitative description of membrane current and its application to conduction and excitation in nerve. J. Physiol. 117, 500–544.
Kazama, H., and Wilson, R. I. (2008). Homeostatic matching and non-linear amplification at identified central synapses. Neuron 58, 401–413.
Laissue, P. P., Reiter, C., Hiesinger, P. R., Halter, S., Fischbach, K.-F., and Stocker, R. F. (1999). Three-dimensional reconstruction of the antennal lobe in Drosophila melanogaster. J. Comp. Neurol. 405, 543–552.
Linster, C., Sachse, S., and Galizia, C. G. (2005). Computational modeling suggests that response properties rather than spatial position determine connectivity between olfactory glomeruli. J. Neurophysiol. 93, 3410–3417.
Luo, S. X., Axel, R., and Abbott, L. F. (2010). Generating sparse and selective third-order responses in the olfactory system of the fly. Proc. Natl. Acad. Sci. U.S.A. 107, 10713–10718.
Olsen, S. R., Bhandawat, V., and Wilson, R. I. (2007). Excitatory interactions between olfactory processing channels in the Drosophila antennal lobe. Neuron 54, 89–103.
Olsen, S. R., Bhandawat, V., and Wilson, R. I. (2010). Divisive normalization in olfactory population codes. Neuron 66, 287–299.
Olsen, S. R., and Wilson, R. I. (2008). Lateral presynaptic inhibition mediates gain control in an olfactory circuit. Nature 452, 956–960.
Papadopoulou, M., Cassenaer, S., Nowotny, T., and Laurent, G. (2011). Normalization for sparse encoding of odors by a wide-field interneuron. Science 332, 721–725.
Sachse, S., and Galizia, C. G. (2002). Role of inhibition for temporal and spatial odor representation in olfactory output neurons: a calcium imaging study. J. Neurophysiol. 87, 1106–1117.
Sachse, S., and Galizia, C. G. (2003). The coding of odour-intensity in the honeybee antennal lobe: local computation optimizes odour representation. Eur. J. Neurosci. 18, 2119–2132.
Satoh, R., Oizumi, M., Kazama, H., and Okada, M. (2010). Mechanisms of maximum information preservation in the Drosophila antennal lobe. PLoS ONE 5, e10644. doi: 10.1371/journal.pone.0010644
Schmuker, M., Yamagata, N., Nawrot, M. P., and Menzel, R. (2011). Parallel representation of stimulus identity and intensity in a dual pathway model inspired by the olfactory system of the honeybee. Front. Neuroeng. 4:17. doi: 10.3389/fneng.2011.00017
Schmuker, M., and Schneider, G. (2007). Processing and classification of chemical data inspired by insect olfaction. Proc. Natl. Acad. Sci. U.S.A. 104, 20285–20289.
Shang, Y., Claridge-Chang, A., Sjulson, L., Pypaert, M., and Miesenböck, G. (2007). Excitatory local circuits and their implications for olfactory processing in the fly antennal lobe. Cell 128, 601–612.
Silbering, A. F., and Galizia, C. G. (2007). Processing of odor mixtures in the Drosophila antennal lobe reveals both global inhibition and glomerulus-specific interactions. J. Neurosci. 27, 11966–11977.
Silbering, A. F., Okada, R., Ito, K., and Galizia, C. G. (2008). Olfactory information processing in the Drosophila antennal lobe: anything goes? J. Neurosci. 28, 13075–13087.
Stocker, R. F. (1994). The organization of the chemosensory system in Drosophila melanogaster: a review. Cell Tissue Res. 275, 3–26.
Stocker, R. F., Lienhard, M. C., Borst, A., and Fischbach, K. F. (1990). Neuronal architecture of the antennal lobe in Drosophila melanogaster. Cell Tissue Res. 262, 9–34.
Stopfer, M., Jayaraman, V., and Laurent, G. (2003). Intensity versus identity coding in an olfactory system. Neuron 39, 991–1004.
Vosshall, L. B., Amrein, H., Morozov, P. S., Rzhetsky, A., and Axel, R. (1999). A spatial map of olfactory receptor expression in the Drosophila antenna. Cell 96, 725–736.
Wang, J. W., Wong, A. M., Flores, J., Vosshall, L. B., and Axel, R. (2003). Two-photon calcium imaging reveals an odor-evoked map of activity in the fly brain. Cell 112, 271–282.
Wehr, M., and Laurent, G. (1996). Odour encoding by temporal sequences of firing in oscillating neural assemblies. Nature 384, 162–166.
Wilson, R. I., and Laurent, G. (2005). Role of gabaergic inhibition in shaping odor-evoked spatiotemporal patterns in the Drosophila antennal lobe. J. Neurosci. 25, 9069–9079.
Keywords: olfaction, model, antennal lobe, inhibition, odor separation
Citation: Proske JH, Wittmann M and Galizia CG (2012) Olfactory sensor processing in neural networks: lessons from modeling the fruit fly antennal lobe. Front. Neuroeng. 5:2. doi: 10.3389/fneng.2012.00002
Received: 30 August 2011; Paper pending published: 27 September 2011;
Accepted: 18 January 2012; Published online: 08 February 2012.
Edited by:
Thomas Nowotny, University of Sussex, UKReviewed by:
Michael Schmuker, Freie Universtiät Berlin, GermanyKevin Daly, West Virginia University, USA
Copyright: © 2012 Proske, Wittmann and Galizia. This is an open-access article distributed under the terms of the Creative Commons Attribution Non Commercial License, which permits non-commercial use, distribution, and reproduction in other forums, provided the original authors and source are credited.
*Correspondence: C. Giovanni Galizia, Department of Neurobiology, University of Konstanz, 78457 Konstanz, Germany. e-mail: giovanni.galizia@uni-konstanz.de