Stop-event-related potentials from intracranial electrodes reveal a key role of premotor and motor cortices in stopping ongoing movements
- 1Department of Technologies and Health, Istituto Superiore di Sanità, Viale Regina Elena, Rome, Italy
- 2IRCCS Neuromed, Via Atinense, Pozzilli (IS), Italy
- 3PhD Program in Neurophysiology, Department of Physiology and Pharmacology, University of Rome La Sapienza Piazzale Aldo Moro, Rome, Italy
- 4Department of Physiology and Pharmacology, University of Rome La Sapienza, Piazzale Aldo Moro, Rome, Italy
In humans, the ability to withhold manual motor responses seems to rely on a right-lateralized frontal–basal ganglia–thalamic network, including the pre-supplementary motor area and the inferior frontal gyrus (IFG). These areas should drive subthalamic nuclei to implement movement inhibition via the hyperdirect pathway. The output of this network is expected to influence those cortical areas underlying limb movement preparation and initiation, i.e., premotor (PMA) and primary motor (M1) cortices. Electroencephalographic (EEG) studies have shown an enhancement of the N200/P300 complex in the event-related potentials (ERPs) when a planned reaching movement is successfully stopped after the presentation of an infrequent stop-signal. PMA and M1 have been suggested as possible neural sources of this ERP complex but, due to the limited spatial resolution of scalp EEG, it is not yet clear which cortical areas contribute to its generation. To elucidate the role of motor cortices, we recorded epicortical ERPs from the lateral surface of the fronto-temporal lobes of five pharmacoresistant epileptic patients performing a reaching version of the countermanding task while undergoing presurgical monitoring. We consistently found a stereotyped ERP complex on a single-trial level when a movement was successfully cancelled. These ERPs were selectively expressed in M1, PMA, and Brodmann's area (BA) 9 and their onsets preceded the end of the stop process, suggesting a causal involvement in this executive function. Such ERPs also occurred in unsuccessful-stop (US) trials, that is, when subjects moved despite the occurrence of a stop-signal, mostly when they had long reaction times (RTs). These findings support the hypothesis that motor cortices are the final target of the inhibitory command elaborated by the frontal–basal ganglia–thalamic network.
Introduction
Our survival depends on our ability to maximize the chances of achieving desired goals. Given that in the real-world events cannot be predicted with certainty, the opportunity of executing an action needs to be continuously evaluated during the entire period, from the instant when the initial decision whether to act is taken to the time when motor output is generated. In fact, during this temporal gap the environmental conditions might have changed and thus the cost of the selected action might turn out to be high or to be inappropriate for achieving the selected goal (Haggard, 2008). This check might be achieved by comparing the output of a predictive forward model with a goal description (Wolpert and Miall, 1996) and might lead to the suppression of the pending movement when the mismatch between the two becomes too large, i.e., in those situations in which a radical change of the planned motor strategy is required. Thus, voluntary inhibition is a hinge of our behavioral flexibility. This form of inhibitory control has often been studied by exploiting the countermanding paradigm (Logan, 1994). This paradigm probes a subject's ability to withhold a planned movement triggered by a go signal when an infrequent stop signal is presented after a variable delay. Starting from the behavioral performance during the countermanding task it is possible to yield an estimate of the duration of the suppression process (stop-signal reaction time, SSRT; Logan and Cowan, 1984; Band et al., 2003; Boucher et al., 2007). The SSRT is a key behavioral parameter for uncovering the neural substrates of inhibition. In fact, those brain regions showing a change in activity when a movement is produced with respect to when it is suppressed, and where the onset of this shift precedes the end of the SSRT, can be assumed to be causally related to the suppression process.
Several studies in humans have ascribed the inhibitory control of manual motor actions to a network of regions, belonging to the right hemisphere, which comprises two areas of the frontal cortex, the inferior frontal gyrus (IFG; Aron et al., 2003, 2007; Chambers et al., 2006) and the pre-supplementary motor area (Floden and Stuss, 2006; Aron et al., 2007; Nachev et al., 2007). Both areas are thought to modulate the cortical neural processes for movement initiation via the hyperdirect route, passing through the right subthalamic nucleus (STN) (Aron and Poldrack, 2006; Aron et al., 2007). However, the picture is far from complete. Some recent studies have suggested that both subthalamic nuclei contribute to voluntary inhibition (van den Wildenberg et al., 2006; Mirabella et al., 2012). Li et al. (2008) demonstrated that the head of the caudate nucleus of both hemispheres have a role in movement suppression, while activity of the STN would be related to attentional monitoring of the stop signal. In addition, Brass and Haggard (2007) showed that the left dorsal fronto-median cortex (dFMC; BA 9) is specifically associated with endogenous inhibition of intentional action. In this case a possible explanation for this divergence comes from the fact that previous studies focused on inhibition triggered by external stimuli rather than inner volition (see also Mirabella, 2007).
Even though both the neural substrates of voluntary inhibition and their specific role in this executive function are still hotly debated, it is very likely that commands generated by these brain regions have to influence in a top-down manner those cortical areas critically involved in limb movement preparation and initiation, i.e., M1 and PMA (Evarts, 1968; Tanji and Evarts, 1976; Cheney and Fetz, 1980; Weinrich and Wise, 1982; Crammond and Kalaska, 2000; Churchland et al., 2010). In fact, Coxon et al. (2006), by applying the transcranial magnetic stimulation on M1 during the execution of a countermanding task, demonstrated that this area is involved in movement suppression. Furthermore, a recent study by Mirabella et al. (2011) demonstrated the existence of neurons in the dorsal PMA which exhibit a pattern of activity compatible with the control of reaching arm movement initiation and suppression.
Scalp EEG studies exploiting the countermanding task have shown that successfully stopped trials are associated with an enhancement of the N200/P300 complex in the ERPs with respect either to unsuccessful-stop (US) trials or no-stop trials (Kok et al., 2004; Ramautar et al., 2006; Schmajuk et al., 2006; Liotti et al., 2007; Dimoska and Johnstone, 2008). Even though few studies have indicated PMA and M1 as the neural source of a component of this complex, because the spatial resolution of scalp EEG is limited it is not yet clear which brain regions contribute to its generation.
Swann et al. (2009) tried to overcome this limitation by recording directly from the cortical surface of pharmaco-resistant epileptic patients undergoing presurgical monitoring. In this study results were provided for only two electrodes for each patient, one located over the right IFG and the other located over M1. Swann et al. (2009) found that responses in the beta frequency band (13–18 Hz) at the two sites were differently modulated for successful-stop (SS) versus US trials. Thus, they concluded that the stopping command is implemented in a right IFG-basal ganglia circuit via synchronized activity in the beta band, and finally acts upon M1. This study left a number of unanswered questions. First of all, ERPs were not computed and thus it was not possible to assess whether an ERP complex associated with inhibitory control was expressed. Second, and more importantly, as just two out of many more electrodes were selected an overall picture of the activity changes recorded from the sampled regions of the brain could not be drawn. In order to provide answers to these questions we recorded the electrocorticogram (ECoG) of five epileptic patients with a grid placed over fronto-temporal regions. Thanks to the high spatiotemporal resolution of ECoG, we aimed to identify the cortical areas involved in inhibitory control and the timing of their activation. We found that a stereotyped ERP complex was selectively expressed in M1, PMA, and BA 9 on a single-trial level whenever a movement was successfully suppressed. As the ERP onset preceded the end of the SSRT, we concluded that motor cortices are causally involved in inhibitory control, and likely they might represent the final target on which inhibitory commands exert their action.
Materials and Methods
Participants
Five right-handed subjects with intractable epilepsy, who underwent temporary implantation of subdural electrode grids for the localization of seizure foci prior to surgical resection, participated in the present study. All subjects gave their informed consent and were free to withdraw from the study at any time. The general procedures were approved by the local Institutional Ethics Committee (IRCCS Neuromed, Pozzilli, Italy) and were performed in accordance with the ethical standards laid down in the Declaration of Helsinki of 1964.
Apart from the chronic epilepsy, none of the subjects showed major overt cognitive deficits and were functionally independent. Thus, all patients fully understood experimenters' instructions and performed the task easily. Their relevant demographic, clinical, neuropsychological, and neuroradiological data are reported in Table 1.
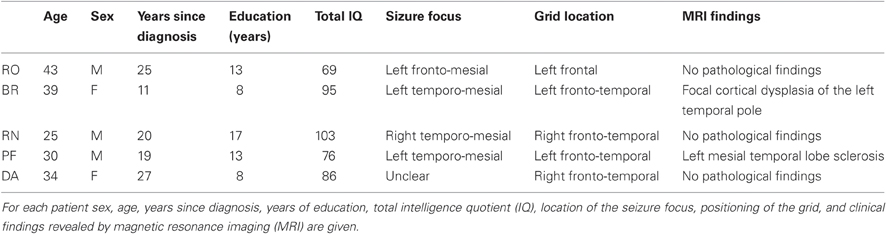
Table 1. Clinical data of patients affected by refractory epilepsy participating in the experiment.
Electrodes and ECoG Acquisition
The implanted electrode grids (Ad-Tech Medical Corp., Racine, WI, USA) consisted of circular (1 mm height, 4 mm diameter) platinum–iridium contacts embedded in a thin (0.5 mm) flexible transparent silastic plate and evenly spaced at 10 mm centers. All patients but one had 64-contact grids; one (RO) had a 48-contact grid. The number and placement of electrodes were determined solely by clinical considerations.
Data acquisition relied on a 128-AC-channel Beehive Millenium monitoring system (Grass Telefactor, West Warwick, RI, USA), with sampling rate of 400 Hz and a bandpass filter between 0.1 and 70 Hz. All recording contacts were referenced to an electrode placed outside the skull (either at Fpz or on the mastoid bones).
Exploiting the same apparatus we also recorded the electromyogram (EMG) of the flexor digitorum superficialis, the electrocardiogram (ECG), and both eye movements and blinking via an electro-oculogram (EOG) derived from electrodes placed over the lateral canthus of the left eye.
Electrode Localizations
Subdural electrodes were localized exploiting a 3-D high-resolution computed tomography (CT; General Electric Light Speed Multi Slice, Milwaukee, WI, USA), made one day after grid placement. The CT scans of the electrode array were projected onto a brain template using the “Location on Cortex” package (Miller et al., 2007), which returns the location of each electrode in Tailarach coordinates. Finally, Tailarach coordinates were converted in the corresponding MNI (Montreal Neurological Insitute) coordinates using the Tailarach-Client application (Lancaster et al., 2000).
Apparatus
Patients were lying on their beds, in front of a PC monitor (17 inch, LCD, refresh rate 75 Hz, 640 × 480 resolution) on which visual stimuli, consisting of red circles (2.4 cd/m2) with a diameter of 2.8 cm against a dark background of uniform luminance (<0.01cd/m2), were presented. The PC monitor was equipped with a touch screen (MicroTouch; sampling rate 200 Hz) for touch-position monitoring. A non-commercial software package, CORTEX, was used to control stimulus presentation and collect behavioral responses. The temporal arrangements of stimulus presentation were synchronized with the monitor refresh rate. Salient behavioral events (start of the trial, go-signal onset, stop-signal onset, finger detach, end of trial) were sent to the ECoG data system acquisition via TTL pulses reduced in amplitude by a voltage divider and decoupled through an optoisolator chip.
Behavioral Tasks
Patients performed a reaching version of the countermanding task previously described (Mirabella et al., 2006, 2008, 2009). The countermanding task consisted of a random mix of 67% no-stop trials and 33% stop trials (Figure 1A). All trials began with the appearance of a central cue which the subjects had to touch with their right index finger, holding that position for a variable period (500–800 ms). Then, in no-stop trials the central cue disappeared and, simultaneously, a peripheral target appeared (go-signal) 15 cm to the right or to the left of the center of the screen. Subjects had to perform a speeded reaching movement toward the peripheral target. In contrast, in stop trials the central cue re-appeared (stop-signal) at a variable delay (stop-signal delay; SSD) following the go-signal. In this instance subjects were instructed to inhibit their movements, holding the central cue for a period of 400–600 ms. SS trials were those in which subjects withheld the movement, while US trials were those in which they moved. Auditory feedback was given for correct responses.
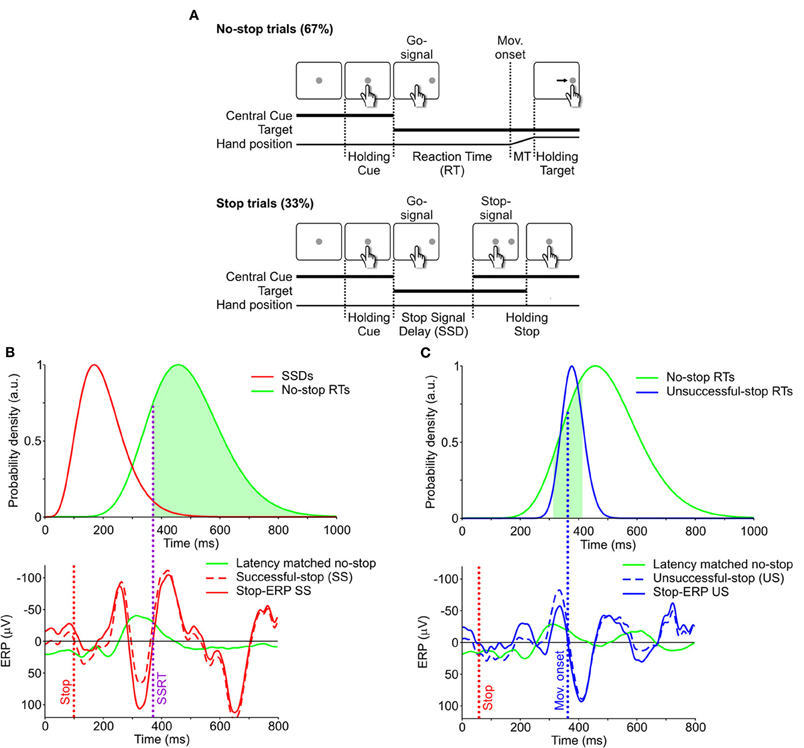
Figure 1. Behavioral task and single-trial estimate of stop-ERPs. (A) Sequence of screen displays (white boxes) and subject responses (hand positions) during no-stop (top) and successful-stop (SS, bottom) trials of the countermanding task. No-stop trials were randomly interspersed with stop trials, which were 33% of the total trials. MT, movement time. See “Materials and Methods” for further details. (B) Top: distributions of SSDs in stop trials (red) and of RTs in no-stop trials (green). Bottom: event-related potentials (ERPs) aligned to the go-signal. Green curve: average ERP of “latency-matched” no-stop trials (green area in top panel), i.e., trials having RT longer than the stop signal reaction time (SSRT, vertical purple dotted line). Dashed red curve: ERP of a single SS trial. Solid red curve: stop-ERP for the same SS trial resulting from the difference between dashed-red and solid-green curves. Red vertical dotted line: stop-signal presentation. (C) Top panel. Distributions of RTs in unsuccessful-stop (US) trials (blue) and in no-stop trials (green, same as in panel B). Bottom panel: solid green curve: average ERP of no-stop trial latencies matched with US trials (green area in top panel), i.e., trials having RTs in the 100 ms interval centered around movement onset (blue vertical dotted line) of the given US trial. Blue dashed curve: ERP of a single US trial. Blue solid curve: stop-ERP resulting from the difference between dashed-blue and solid-green curves.
The SSD is the critical dependent variable in this paradigm because stopping becomes increasingly difficult as it lengthens. To allow the participants to succeed in cancelling the response in about 50% of the stop trials, SSDs were changed using a staircase procedure (Levitt, 1971; Osman et al., 1990). In each stop trial, SSD increased by three display refresh intervals (or 39.9 ms) if in the previous stop-trial the patient succeeded in cancelling the response. SSD decreased by the same amount of time if patients failed. The staircase started from an SSD of 119.7 ms (9 refresh rates), an appropriate delay suggested by pilot experiments to quickly achieves the desired failure rate for stop trials.
We verbally informed patients about the staircase procedure and thus we made them aware that the probability of stopping would approximate to 50%, irrespective of whether they were postponing their response or not. In addition we set an upper reaction time (RT) limit for no-stop trials; whenever the RTs were longer than 800 ms, no-stop trials were aborted.
Patients were required to complete four (three patients) or six (two patients) blocks of 60 trials (240 or 360 trials). Resting periods were allowed between blocks whenever requested. Before starting the task, about 50 practice trials were given for familiarizing subjects with the apparatus.
Behavioral Data Analysis
For each experimental condition the corresponding SSRT was estimated, according to the procedure described in detail in Mirabella et al. (2009). Briefly, we exploited the so-called integration method, relying on the hypothesis of a stop process modeled by a constantly growing state variable, the SSRT, which is the time needed to cross a threshold value (Logan and Cowan, 1984; Logan, 1994; Band et al., 2003). Using the so-called mid-run estimate method (Wetherill and Levitt, 1965; Levitt, 1971), we computed the “representative SSD” as the delay that best allows the subject to withhold a response half of the times. This value was calculated as follows. In each session, the sequence of SSDs displayed ramps of either increasing or decreasing values according to the performance of the subject; the “representative SSD” was estimated by averaging the values corresponding to the midpoint of every second ramp. The ending time of the stop process was calculated by integrating the RT distribution of no-stop trials from the onset of the go-signal until the integral equaled the corresponding observed proportion of US trials (Logan, 1994; see Figure 1C). Finally, the SSRT estimate was computed as the difference between the ending time of the stop process and the “representative SSD.”
Electrophysiological Data Post-Processing
Electrode recordings from all patients were post-processed in order to improve the signal-to-noise ratio and to remove possible artifacts. A cross-correlation analysis showed a significant and non-specific correlation between acquired electrical potentials from electrodes of the grid and the EOG. No correlation was found with other “external” signals such as EMG, ECG, and trigger channels used to synchronize timing of the ECoG data with behavioral events (see section “Apparatus”).
To remove ocular electrical artifacts, for each subject we performed an independent component analysis (ICA) on a time interval of 400 s using the FastICA toolbox for Matlab (Natick, MA, USA; Hyvärinen and Oja, 1997; Hyvärinen, 1999). The independent component (IC) most closely correlated with every ECoG channel was the one best representing the EOG. Hence, we “cleaned” ECoG by subtracting this IC from the originally acquired signals.
Artifact-free ECoG potentials were smoothed in time by low-pass filtering time series with a moving average on a sliding window of 50 ms. This window size was a good compromise between improvements in signal-to-noise ratio and lack of temporal resolution.
Finally, we performed spatial filtering to remove possible nonspecific global fluctuations in electrical potentials across nearby electrodes. We applied a variant of the surface Laplacian proposed by Hjorth (1975), recently adapted to high-density EEG data processing (Cimenser et al., 2011). Following this procedure we computed, as local reference for each ECoG electrode of the grid, the average voltage of the closest neighboring ECoG channels. Electric potential Vi(t) at location i and time t was detrended as follows:
where the sum was over the four nearest neighbors of the given electrode. On the grid border, where fewer than four neighbors were present, only the two symmetric nearby electrodes were taken into account. The following ERP analysis relied only on filtered voltages Ji(t), to which we simply referred as electrical potentials or electrode voltages.
Estimate of Stop-ERPs
In this paper we adopted a novel approach to isolate the electrophysiological activity related to movement suppression, i.e., we tried to extract it at the single-trial level exploiting the following approach. In each SS trial the inhibitory activity overlaps with two other processes, (1) the perceptual elaboration of the go-signal and (2) movement planning. In order to subtract these two components and to detect the countermanding-related activity, we contrasted the neural responses during a single SS trial with that recorded in the so-called “latency-matched” no-stop trials, i.e., those trials whose RTs were longer than the sum of SSD and SSRT calculated from the same data (see Hanes et al., 1998 and Mirabella et al., 2011). These are the trials in which, given the length of the SSRT, the movement would have been canceled if the stop signal had been presented at the given SSD (represented by the subset of trials under the green area in the top panel of Figure 1B). We first computed the average ERPs of latency-matched no-stop trials (Figure 1B, bottom panel), centered on the go-signal, and we obtained a “stop-ERP” (dashed line) by subtracting it from the ERP measured during a single SS trial (continuous line).
Using the same method we also computed the US ERPs by subtracting the ERP in a given US trials from the average ERP computed from the subset of no-stop trials corresponding to a 100 ms RT interval centered around the time of movement onset of the US trial (Figure 1C, green area of the top panel). These are the trials in which the movement would not have been canceled if the stop-signal had been presented. This comparison reveals whether a stop-ERP was present even though the subject made a mistake.
Results
Behavioral Results
Behavioral data relevant to the performance of the countermanding task are reported in Table 2. The average SSRT was compatible with that measured in epileptic patients tested in similar conditions (Swann et al., 2009). Some subjects (PF and BR) showed a lower stopping rate than desired; however, they performed the task sufficiently well. Furthermore, for each subject we found that in all occurrences the distributions of the RTs of US trials were significantly shorter than those of no-stop trials (Kolmogorov–Smirnov test, P < 0.05), as required by the race model (Logan and Cowan, 1984; Logan, 1994; see also Boucher et al., 2007) in order to obtain a reliable estimate of the SSRT.
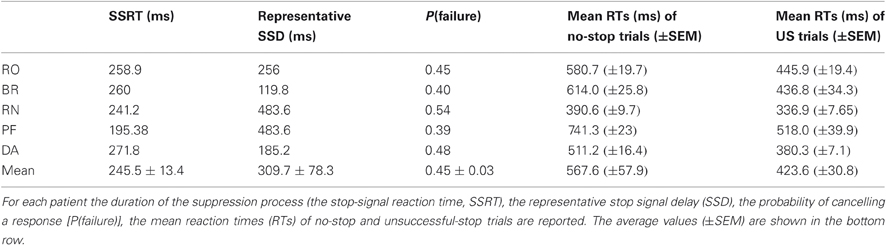
Table 2. Behavioral data describing the performance in the countermanding task.
Single-Trial Detection of Stop-ERP in SS Trials
Neural activity correlated with inhibition processes might be effectively coupled with a machine decoder or an automated controller only if it fulfills a minimum requirement: it has to be detectable at the single-trial level with high enough time resolution. From a visual inspection of average ERPs in stop trials aligned to the stop-signal appearance, we found evidence of a characteristic pattern of delayed deflections of electrode voltages. To find out whether such average ERP complexes were observable in single trials we performed a correlation analysis comparing the ERPs from each couple of SS trials (see Figure 2A). As stop-ERPs are likely to occur at different times in different trials, we measured the Pearson correlation coefficient ρ between ERPs artificially shifted in time (Figure 2A, right). Exploiting this procedure we aimed to identify the time shift which would give the maximum ρ (Figure 2A, left). We considered only ERPs in a time interval between 100 and 350 ms following stop-signals. For each grid electrode we computed the correlation between all possible couples of SS trials. The matrix of maximum ρ values between couples of SS trials from the same example channels (Figure 2B) clearly shows that in most instances a high value of ρ (reddish pixels) was found. This indicates that the same, or a very similar, ERP complex was present in most SS trials. In order to detect in which trials the stop-ERPs emerged more neatly, we computed the median of the maximum ρ for each SS trial (Figure 2B, right). We discarded those trials with median values lower than a threshold (dotted vertical line) as they did not show the typical stop-ERP complex (gray diamonds). The threshold value was computed as the median of the medians (dashed vertical line) minus three times the standard deviation (SD) of the 50% larger medians (black diamonds on the right of dashed line). Figure 2C represents the matrix of the “optimal” time shifts producing the maximum ρ matrix. From this matrix we extracted the “absolute” time shift for each trial, that is, the amount of time shift needed to realign the voltage trace in order to obtain the maximum ρ. The array of absolute time shifts X was carried out by inverting the linear equation A X = B, where values of B were the optimal shifts shown in Figure 2C and A was a matrix of 0, 1, and −1 to express optimal shifts as differences between absolute time shifts. Because such a linear system is over-determined (A was not a square matrix) its solution is the best one in the least-squares sense.
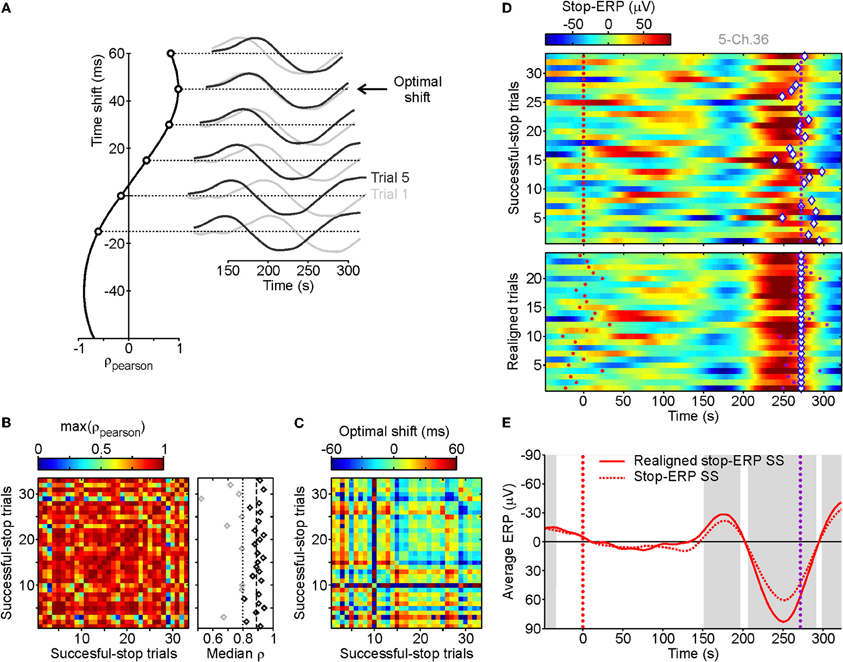
Figure 2. Stop-ERP detection at single-trial level for successful-stop (SS) trials. (A) Pearson correlation (ρ, leftmost panel) between two stop-ERPs derived from the two example SS trials, represented in the rightmost panel (dark and light gray curves), obtained when they are artificially and progressively shifted in time. The optimal shift is the time shift for obtaining the maximum positive correlation (45 ms). (B) Matrix of maximal ρs obtained at the optimal shifts between all SS trials for one grid contact. Rightmost panel, medians of the maximal ρs for each SS trial (represented in a row of the left matrix). Vertical dashed line, median of the median ρs across SS trials. Vertical dotted line, lower threshold for selected SS trials (black diamonds represent SS trials with median correlation above threshold, gray diamonds represent those below threshold; see Result section for details). (C) Matrix of optimal shifts between SS trials leading to the maximal correlation. Optimal shifts ranged from −60 to +60 ms. (D) Top panel: raster plot of stop-ERPs in SS trials from the same example recording. Red dotted line, stop-signal occurrence. Purple dotted line, end of the SSRT. Diamonds, absolute time shift related to the SSRT for each SS trial estimated from the time shift matrix of panel C. Bottom panel: realignment of stop-ERPs with respect to the absolute time shift of SS trials with a median correlation above the threshold (n = 24 of 33). (E) Average stop-ERP obtained from trials of top and bottom raster plots of panel D. Gray areas, time intervals at which the realigned stop-ERP was significantly different from 0 (Wilcoxon signed-rank test, P < 0.01).
In the top panel of Figure 2D, voltage changes with time for each SS trial are reported with respect to the end of the SSRT in a raster plot. In each trial the absolute time shift is indicated by a diamond. Stop-ERP complexes have a recognizable negative–positive peak sequence. To make it clearer we realigned the selected SS trials with respect to the absolute time shift (Figure 2D, bottom). The realignment gave an improvement in the signal-to-noise ratio in the average ERPs, as shown in Figure 2E where the original and realigned stop-ERPs are superimposed. Interestingly, this ERP complex started to emerge within the SSRT, that is, voltage deflection was significantly different from 0 before the end of the SSRT (first gray area). This suggests a causal relationship between the average stop-ERPs and the ongoing inhibition process.
Distribution of Average Stop-ERPs Across the Cortex
Subdural grids give the opportunity of simultaneously sampling wide regions of the cortex with a relatively high spatial resolution, so this technique makes it possible to investigate the cortical regions where the stop-ERPs originate and which areas are involved in the suppression process.
As a preliminary step we selected those recording channels with no pathological EEG activity throughout the investigation (e.g., pathological interictal activity) and those located outside the seizure onset area (identified by expert neurologists PQ and GD). To be as objective as possible, for each electrode contact we computed the trial-by-trial SD of ERPs in the 100 ms following the go-signal in SS trials (see Figure 3A for an example patient). To discard noisy channels we computed a threshold value as follows. We calculated the median of the SDs across all the grid contacts, selected the 50% of channels with the lowest SDs and then calculated the standard deviation of their SDs; we then added three times this SD to the median to give the threshold value. Those electrodes with SDs larger than the threshold value were excluded. For the remaining channels we computed the realigned stop-ERPs, as previously described. As can be seen from Figure 3B, the average stop-ERP was selectively expressed in only a few areas (mainly BA4, BA6, BA9), where it occurred well before the end of SSRT (purple dotted lines). The selective occurrence of average stop-ERPs in this example patient can be better appreciated from the contour map of Figure 3C where the largest peaks of each ERP are plotted. A hot spot in BA6 (PMA) is apparent, together with smaller peaks located at other contacts of the same area and in the nearby regions BA4 (M1) and BA9 (dFMC) (the same dashed regions as in Figure 3B).
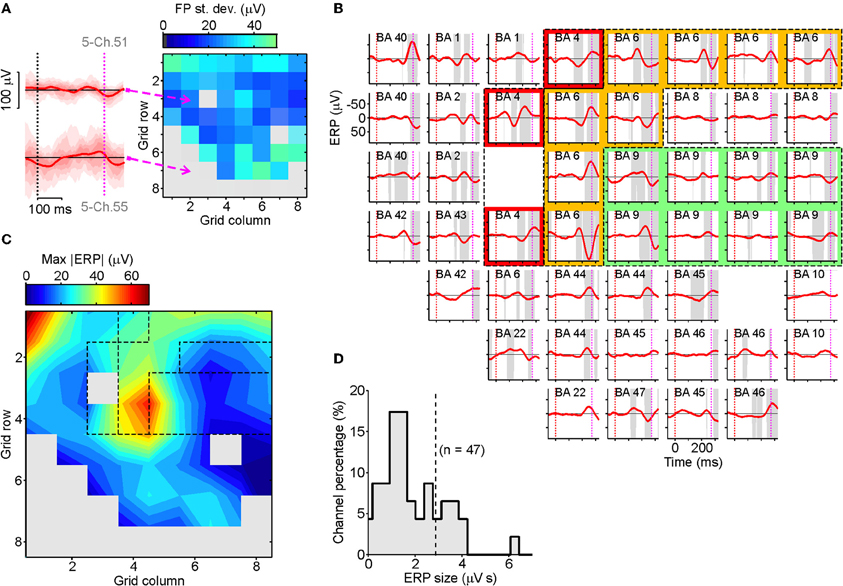
Figure 3. Spatiotemporal distribution of stop-ERPs in successful-stop (SS) trials. (A) Map of the standard deviations (SDs) of field potentials (FPs) in SS trials at each contact of the grid for an example patient (right). SDs of FPs were evaluated in a time window of 100 ms following the go-signal onset. Gray elements were excluded from further analyses because they had SDs greater than a threshold value (see Results section for further details). Left, ERPs for two example channels with low (top) and high (bottom) voltage variability. Solid curves, average ERPs. Reddish areas represent time course of ERP distribution across trials: different shadings mark percentiles multiples of 10. (B) Average realigned stop-ERPs (solid red curves) of SS trials centered on stop-signal appearance corresponding to the selected channels. Other conventions as in Figure 2E. Subplot labels: Broadmann's areas (BAs) over which electrodes were positioned. Colored areas: electrodes placed over the primary motor cortex (red, BA4), the premotor cortex (yellow, BA6) and the dorsal fronto-median cortex (green, BA9). (C) Smoothed contour map of the maximum absolute stop-ERP amplitudes (ERP) shown in panel B. Dashed areas correspond to the colored area of panel B. (D) Histogram of the stop-ERP sizes of panel B. Stop-ERP sizes were computed as the integral of absolute values of stop-ERP voltage deflections in the interval periods marked by gray areas within SSRT. Dashed line: threshold value for selecting the subset of channels with large enough stop-ERPs used for population analyses (see text for details).
To identify grid contacts showing the largest average stop-ERPs, we measured the stop-ERP size by computing the integral of the absolute voltage within those time intervals where the ERPs were significantly different from 0 (gray intervals) during the SSRTs (Figure 3D). Then we selected those channels whose ERP size was larger than the median plus three times the SD of the ERP sizes of the 50% of contacts with the smallest sizes. In the example patient, Figure 3D, 14 out of 47 channels passed the selection.
The same analysis was performed across all other patients, and overall we retained a population of 39 electrodes. The distribution of these contacts (Figure 4A) clearly showed that most of them were located either in M1, in PMA or in dFMC. Other BAs never had more than two channels with large enough average stop-ERPs (blue bar). Importantly, in the overwhelming majority of contacts the onset time of average stop-ERPs always preceded the end of SSRT (Figure 4B, right, average time lag: −82.7 ± 7.3 ms), suggesting a causal relationship between these ERPs and successful movement inhibition. Furthermore, average stop-ERP complexes seemed to emerge first in motor cortices (M1, PMA, BA9) and later in other areas (t-test, df = 37; P < 0.05).
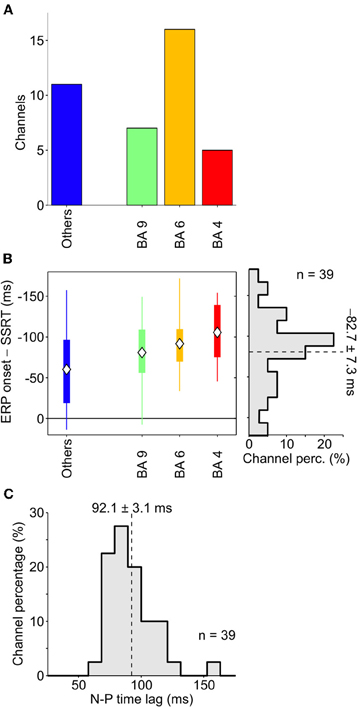
Figure 4. Onset of stop-ERPs in successful-stop trials. (A) Number of channels showing large enough average stop-ERPs (n = 39) grouped by Brodmann area (BA; see text for details). Blue bar (others) represents those areas where channels were not selected more than twice across all patients (B) Box plot of stop-ERP onsets measured with respect to the end of SSRT across all selected channels in all patients. Stop-ERP onset was defined as the first time that an electrode voltage was significantly different from 0. Diamonds indicate average onset times. Thick bars indicate the first and the third quartile. Vertical lines indicate the extreme time lags in the channel group. Right, distribution of stop-ERP onset times. Dashed line, average stop-ERP onset (± SEM) across all selected channels. (C) Distribution of time lags between negative and positive (N-P) peaks across stop-ERPs. Dashed line, average peak distance (± SEM).
We also evaluated the similarity between average stop-ERPs across all selected channels, computing the time lag between the negative and positive (N-P) peak of the complex. As shown in Figure 4C, we found that the distribution of this time interval was fairly narrow, the SD being only 21% of the mean (92.1 ± 19.4 ms; SE 3.1 ms); this supports the idea of the existence of a stereotyped stop-ERP complex across cortical areas and subjects.
Single-Trial Detection of Stop-ERP in US Trials
We have interpreted the emergence of stop-ERP at the single-trial level as a footprint of the inhibitory process of pending reaching arm movements. Clearly it could not be linked to either eye movements or blinking as ocular artifacts were removed (see Materials and Methods). The ERP could not even be related to the sensory processing of the go-signal given that we subtracted neural responses during SS trials from those recorded during no-stop trials (see Materials and Methods). However, it could be argued that the countermanding-related modulation during SS trials could be driven by the visual presentation of the stop-signal. In fact, only in stop trials did the stop-signal appear after the SSD.
To rule out this possibility we compared the neural activity in SS and US trials as the stop-signal is presented in both type of trials and therefore possible differences cannot be ascribed merely to its appearance.
In top panel of Figure 5A, the raster plots of ERPs computed from US trials were shown for the same contact as illustrated in Figure 2D. Interestingly, using the same procedure described in section “Behavioral Results,” we found in several US trials stop-ERPs closely matched with those detected in SS trials. They occurred sparsely across trials, mainly when the RTs were longer (top trials in Figure 5A, top). The realignment of stop-ERPs according to the optimal time shift (Figure 5A, bottom) evidently displayed the similarity with ERP complexes of SS trials. The average ERP of US trials (Figure 5B, solid blue curve) showed that, although the shape of stop-ERPs was preserved, voltage deflections in SS trials (red curve) occurred earlier than in US trials. The presence and the timing of stop-ERPs in US trials ruled out the possibility that such ERPs could be merely a visually-evoked reaction to the stop-signal. In fact, if this were the case then ERPs should have occurred in both SS and US trials with the same frequency and average latency from the stop-signal appearance.
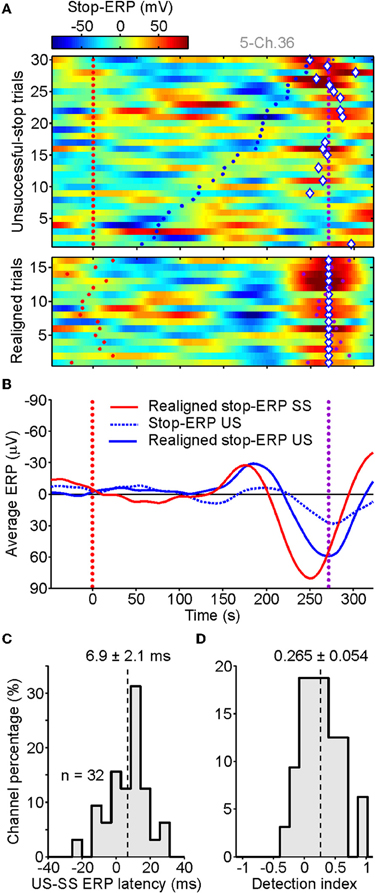
Figure 5. Stop-ERPs in unsuccessful-stop (US) trials. (A) Raster plots of stop-ERPs in US trials from the same channel illustrated in Figure 2. Top panel. Red dotted line, stop-signal occurrence. Purple dotted line, end of the SSRT. Blue dots: movement onset time. Diamonds, optimal shift with respect to SSRT (purple dots; see text for futher details). Bottom panels: stop-ERP of US trials realigned to the optimal shift. (B) Average of realigned stop-ERPs of SS trials (solid red, the same as in Figure 2E) and US trials (solid blue). Dotted blue curve, average across not-shifted US trials. (C) Distribution of latency differences between realigned stop-ERPs of US and SS trials (see text for details). (D) Histogram of detection index values indicating how many stop-ERPs were found for late movement onset times (last third of US trials in panel A-top) versus early detaches (first third of US trials).
We tested the robustness of this result across our population by probing whether the 39 contacts at which we previously detected stop-ERPs in SS trials also showed them in US trials. We found that a large subset of electrodes (n = 32 of 39; 82%) showed stop-ERPs in both types of trial. To assess the latency between the two average stop-ERPs, we computed the time lag between the midpoint of the negative and the positive peaks of the complex and the stop-signal presentation. Then we calculated the difference between such time lags for US and SS trials. As shown in Figure 5C, average stop-ERPs in US trials occurred mainly later than those of SS trials (mean delay: 6.9 ± 2.1 ms, Wilcoxon signed-rank test, P < 0.01).
Finally, we worked out a detection index D to quantify how many times a stop-ERP was detected in US trials with short versus long RTs as follows:
where Fearly and Flate are, respectively, the fraction of stop-ERPs detected in the first and in the last 33% of US trials sorted by RTs, as in Figure 5A. The index can be negative down to minus one, when stop-ERPs are not present in the late fraction of US trials, or up to plus one, when stop-ERPs are present only in the fraction of US trials with long RTs. The result of this analysis (Figure 5D) shows a distribution of D significantly shifted above 0 (mean: 0.265 ± 0.054; Wilcoxon signed-rank test, P < 0.001), confirming that most stop-ERPs occur for those US trials with the longest RTs.
Discussion
Role of Motor Cortices in Inhibiting Reaching Arm Movements
The main goal of the present study was to investigate the neural activity associated with arm movement suppression across several brain regions, mostly located over the lateral surface of the frontal lobe. Among these areas motor cortices (e.g., PMA, Coxon et al., 2006; M1, Mirabella et al., 2011), as well as IFG (Aron et al., 2003) have been shown to be involved in preventing planned arm movements. However, to date none have been recorded simultaneously from all these regions exploiting the high spatiotemporal resolution allowed by the ECoG. To this aim we did not select a priori any electrode but, after discarding those contacts with a high noise level, we analyzed the activity of all the remaining ones.
In addition, taking advantage of the larger amplitude of EEG signals recorded from subdural electrodes with respect to scalp EEG signals, we extracted neural activity at the single-trial level (stop-ERP) related to the inhibitory process of reaching movements and excluding other confounding factors (e.g., the appearance of the go-signal, eye movement or movement planning). We found that a characteristic signature of the cancellation process occurs in the great majority of SS trials. Because, as expected, there was a trial-by-trial variability in the timing of stop-ERP emergence, we improved the signal-to-noise ratio by realigning the trials with respect to the end of the SSRT (see section “Single-trial detection of stop-ERP in SS trials” for further details). Then we computed the average stop-ERP across realigned trials at each contact and we selected those contacts that had the largest voltage amplitudes. At the end of this “blind” procedure we found that the selected recording channels were mainly located in M1, PMA, and dFMC. Crucially, the analysis of the stop-ERP onset revealed that the change in the electrical activity took place well before the behavioral estimate of the end of the cancellation process. This finding indicates that these areas are causally involved in stopping ongoing movements and that they are probably the source of the N200/P300 complex found in scalp EEG studies.
Clearly, these are not the only neural substrates of the cancellation process. In fact, it is very well known that ERPs are generated by fixed-latency phase-locked responses, especially at low frequencies (Heinze et al., 1994). At the same time brain dynamics also entail non-phase-locked oscillations (Tallon-Baudry and Bertrand, 1999; Bernat et al., 2007), as those occurring when multiple task conditions and/or many stimulus types are processed (Jung et al., 2001). Therefore, there is no contradiction between our results and those obtained by Swann et al. (2009) showing an increase in the beta frequency band in the right IFG for SS versus US trials. In fact it is known that the IFG is implicated in several cognitive functions such as stimulus-driven attention (Corbetta and Shulman, 2002), response selection (Mostofsky and Simmonds, 2008), working memory (Mars et al., 2008) and inhibitory control (Aron et al., 2003).
Interestingly, Swann et al. (2009) demonstrated that, in agreement with our data, M1 is involved in inhibitory processes because US trials induce a larger desynchronization in the alpha/beta band than do SS trials. Even though they did not explore PMA activity, the study by Mirabella et al. (2011) identified in the dorsal part of PMA of monkeys a population of neurons showing a pattern of activity which correlates with the suppression of programmed arm movements. Overall our findings are fully congruent with the existing literature, but for the first time they offer a clearer picture of the involvement of motor cortices in the countermanding task, strongly suggesting that inhibition occurs at relatively low levels in the motor hierarchy (see also Stinear et al., 2009). We also found that the dFMC has a role in voluntarily inhibiting actions based on external stimuli, extending previous findings indicating a role for this area just in the suppression of self-generated movements (Brass and Haggard, 2007). Classically this is considered a high hierarchy motor area; however, at least in this context it seems to behave similarly to lower lever motor regions.
Motor cortices are probably the final target on which the inhibitory command generated by the frontal–basal ganglia–thalamic network acts. The components of this network and the precise way it works are still hotly debated. However, on the basis of the available anatomical and physiological data, we can put forward the following hypothesis of network functioning. Whenever we are about to move, the motor cortices (M1 and PMA) send an efferent copy of their descending output to the input components of the basal ganglia, the striatum, and the STN. These projections are somatotopically organized (Mink, 1996) and influence the activity in the thalamocortical pathway, projecting back to M1 and PMA. Both the STN (Aron and Poldrack, 2006; van den Wildenberg et al., 2006; Mirabella et al., 2011) and the striatum (Li et al., 2008; Zandbelt and Vink, 2010) are involved in inhibitory control, but possibly they have different roles (see Mirabella et al., 2011). STN should have a direct role in the suppression of the movement, while the striatum should play a role in proactive control during countermanding. Whenever the stop signal is presented its appearance would be detected by some of the frontal areas of the network, probably by the right IFG, given that it monitors unexpected changes in the external environment (Corbetta and Shulman, 2002). In its turn the IFG would activate the STN through the hyperdirect pathway (Nambu et al., 2002), allowing for quick braking of the motor output from motor cortices (Aron and Poldrack, 2006; Aron et al., 2007). Therefore, according to this schema PMA and M1 would represent the final target of the inhibitory command elaborated by the frontal–basal ganglia–thalamic network.
It has to be stressed that in the present study we could not assess whether the inhibitory network is right-lateralized (Aron et al., 2007). Among our patients, three had a grid placed over the surface of the fronto-temporal lobes of the right hemisphere and two had a grid over the same regions of the left hemisphere. Qualitatively, data were not different even though subjects were right-handed and all used the dominant hand. This might be explained by the fact that we mainly found inhibitory signals in PMA and M1. These regions are known to be bilaterally activated during the production of reaching movements (Kawashima et al., 1998; Donchin et al., 2002; Cisek et al., 2003) and thus it is likely that, to suppress a reaching movement, inhibitory commands have to be sent bilaterally to both motor cortices. This topic definitely deserves further studies.
Finally, it is noteworthy to underline that the present findings can be affected to some extent by the coarse spatial sampling of our clinical grids. Indeed the optimal inter-electrode distance of 1.25 mm (Srinivasan et al., 1998; Freeman et al., 2003) is much smaller than the 1 cm spacing of the grids we employed. Thus, neural activity might be more localized than that we have detected. Furthermore, our procedure for electrode localization, based on the projection of electrode contacts onto a brain template (see section “Electrode localizations”), is less precise than the estimates relying on the projection of the electrode position on the subjects' own brain maps. In particular, as all the selected electrodes in BA 9 where just on the border with PMA we suspect they actually might be located in PMA.
Stop-ERP in US Trials and the Horse Race Model
In its original formulation the race model assumed that the go process (the process initiated by the go-signal leading to the execution of the movement) and the stop process (the one initiated by the stop-signal leading to the inhibition of the movement) were stochastically independent, i.e., their ending times were uncorrelated (Logan and Cowan, 1984). However, complete independence between the go and stop process is unlikely. In fact, Boucher et al. (2007) revised the model, proposing that the go and stop processes are independent for most of their duration but they interact briefly and strongly near the end of the race (interactive race model). However, even in this interactive race model, the length of the SSRT primarily reflects the period during which stop and go processes are independent, so its predictions correspond to those of the original race model.
One prediction of the race model testing the independence assumption between go and stop processes is that the mean RT of US trials should be shorter than the mean RT of no-stop trials (Logan and Cowan, 1984). That is because reaching movements were produced in both the no-stop trials and the US, but the latter were initiated because the go process finished before the stop process. Therefore, considering the distribution of the RTs of the no-stop trials, the responses that escape inhibition should be those corresponding to reaching movements that had RTs shorter than the SSD plus the estimated SSRT. We found that this prediction was satisfied for all patients.
Nonetheless we also found that stop-ERPs occurred not only when subjects successfully stopped their movement but also when they wrongly moved their arm despite the occurrence of a stop-signal. Crucially, stop-ERP in US trials are mainly present in the fraction of US trials with long RTs (see Figure 5A). This finding is compatible with a late modulation of neural activity determined by an ineffective stop process, namely by a stop processes which is incapable of suppressing an arm movement. In conclusion, stop-ERPs in US trials might represent the effect of the interaction between the stop and the go process taking place around the end of the race (Boucher et al., 2007), when the stop process loses.
Decoding of Response Inhibition: Brain-Computer Interface and Rehabilitation
Decoding cortical signals underpinning motor decisions is the backbone of brain-computer interfaces (BCI) to recover or improve motor functions (Nicolelis, 2003; Schwartz, 2004). In particular, ECoG signals, although more invasive, have been proven to allow a more effective decoding of motor intentions and to outperform EEG-based BCI (Leuthardt et al., 2004; Schalk et al., 2008; Schalk, 2010).
Effective BCIs have to read not only detailed information about overt movements to perform but also their volitional control (Fetz, 2007; Moritz et al., 2008). In other words, to drive external devices, automated decoders have to access not only motor program features but also those signals indicating the intention to move. From this perspective, it is rather surprising that the wide literature on BCIs has paid no attention to neural correlates of cognitive and behavioral inhibition. The capability of detecting a neural correlate of response inhibition at the single-trial level from ECoG signals might represent a first step in the direction of taking into account all the features of voluntary movement. BCI could rely on the stop-ERPs we have detected to take into account a sudden need to suppress planned movements, especially because on average they appear early, i.e., about 100 ms before the SSRT.
Developments in BCI have also provided robust evidence that closed-loop approaches, in which decoding performances are fed back, allow subjects to adapt their brain activity to BCI capabilities and constraints, and hence to improve motor control (Nicolelis, 2003; Schwartz, 2004). Recently, closed-loop BCIs have been suggested as a way to selectively enhance brain plasticity, envisaging more effective rehabilitative approaches to recovering from motor and cognitive impairments such as those due to strokes (Dobkin, 2007; Daly and Wolpaw, 2008). Such improvements can be driven by a closer monitoring of how brain activity changes with exercise well before any behavioral output. Another possibility is to induce subjects to perform suited mental practice, such as motor imagery, capable of speeding up an activity-dependent plasticity for proper rewiring of compromised cortical circuits (Millán et al., 2010; Wang et al., 2010). Accessing in real time the cortical fingerprints of the suppression process extends the possible clinical applications of such neurofeedback. In fact, rehabilitation strategies for cognitive deficits characterized by inefficient inhibitory control (Chamberlain et al., 2005; Chamberlain and Sahakian, 2007), such as obsessive–compulsive disorder or attention-deficit hyperactivity disorder, might benefit from closed-loop BCIs relying on stop-ERP detection.
Conflict of Interest Statement
The authors declare that the research was conducted in the absence of any commercial or financial relationships that could be construed as a potential conflict of interest.
Acknowledgments
We thank all patients participating in the study, the nurses and technicians assisting us and the patients during the experiments, and Sara Iaconelli for the help provided with data collection. This research was supported by the Italian Ministry of Work, Health and Social Policies (Bando Giovani Ricercatori 2007 to G. Mirabella) and by the Italian Ministry of University and Research (PRIN n.2008_RBFNLH_005 to G. Mirabella).
References
Aron, A. R., Behrens, T. E., Smith, S., Frank, M. J., and Poldrack, R. A. (2007). Triangulating a cognitive control network using diffusion-weighted magnetic resonance imaging (MRI) and functional MRI. J. Neurosci. 27, 3743–3752.
Aron, A. R., Fletcher, P. C., Bullmore, E. T., Sahakian, B. J., and Robbins, T. W. (2003). Stop-signal inhibition disrupted by damage to right inferior frontal gyrus in humans. Nat. Neurosci. 6, 115–116.
Aron, A. R., and Poldrack, R. A. (2006). Cortical and subcortical contributions to Stop signal response inhibition: role of the subthalamic nucleus. J. Neurosci. 26, 2424–2433.
Band, G. P., van der Molen, M. W., and Logan, G. D. (2003). Horse-race model simulations of the stop-signal procedure. Acta Psychol. (Amst.) 112, 105–142.
Bernat, E. M., Malone, S. M., Williams, W. J., Patrick, C. J., and Iacono, W. G. (2007). Decomposing delta, theta, and alpha time–frequency ERP activity from a visual oddball task using PCA. Int. J. Psychophysiol. 64, 62–74.
Boucher, L., Palmeri, T. J., Logan, G. D., and Schall, J. D. (2007). Inhibitory control in mind and brain: an interactive race model of countermanding saccades. Psychol. Rev. 114, 376–397.
Brass, M., and Haggard, P. (2007). To do or not to do: the neural signature of self-control. J. Neurosci. 27, 9141–9145.
Chamberlain, S. R., Blackwell, A. D., Fineberg, N. A., Robbins, T. W., and Sahakian, B. J. (2005). The neuropsychology of obsessive compulsive disorder: the importance of failures in cognitive and behavioral inhibition as candidate endophenotypic markers. Neurosci. Biobehav. Rev. 29, 399–419.
Chamberlain, S. R., and Sahakian, B. J. (2007). The neuropsychiatry of impulsivity. Curr. Opin. Psychiatry 20, 255–261.
Chambers, C. D., Bellgrove, M. A., Stokes, M. G., Henderson, T. R., Garavan, H., Robertson, I. H., Morris, A. P., and Mattingley, J. B. (2006). Executive “brake failure” following deactivation of human frontal lobe. J. Cogn. Neurosci. 18, 444–455.
Cheney, P. D., and Fetz, E. E. (1980). Functional classes of primate corticomotoneuronal cells and their relation to active force. J. Neurophysiol. 44, 773–791.
Churchland, M. M., Cunningham, J. P., Kaufman, M. T., Ryu, S. I., and Shenoy, K. V. (2010). Cortical preparatory activity: representation of movement or first cog in a dynamical machine? Neuron 68, 387–400.
Cimenser, A., Purdon, P. L., Pierce, E. T., Walsh, J. L., Salazar-Gomez, A. F., Harrell, P. G., Tavares-Stoeckel, C., Habeeb, K., and Brown, E. N. (2011). Tracking brain states under general anesthesia by using global coherence analysis. Proc. Natl. Acad. Sci. U.S.A. 108, 8832–8837.
Cisek, P., Crammond, D. J., and Kalaska, J. F. (2003). Neural activity in primary motor and dorsal premotor cortex in reaching tasks with the contralateral versus ipsilateral arm. J. Neurophysiol. 89, 922–942.
Corbetta, M., and Shulman, G. L. (2002). Control of goal-directed and stimulus driven attention in the brain. Nat. Rev. Neurosci. 3, 201–215.
Coxon, J. P., Stinear, C. M., and Byblow, W. D. (2006). Intracortical inhibition during volitional inhibition of prepared action. J. Neurophysiol. 95, 3371–3383.
Crammond, D. J., and Kalaska, J. F. (2000). Prior information in motor and premotor cortex: activity during the delay period and effect on pre-movement activity. J. Neurophysiol. 84, 986–1005.
Daly, J. J., and Wolpaw, J. R. (2008). Brain-computer interfaces in neurological rehabilitation. Lancet Neurol. 7, 1032–1043.
Dimoska, A., and Johnstone, S. J. (2008). Effects of varying stop-signal probability on ERPs in the stop-signal task: do they reflect variations in inhibitory processing or simply novelty effects? Biol. Psychol. 77, 324–336.
Dobkin, B. H. (2007). Brain-computer interface technology as a tool to augment plasticity and outcomes for neurological rehabilitation. J. Physiol. 579, 637–642.
Donchin, O., Gribova, A., Steinberg, O., Mitz, A. R., Bergman, H., and Vaadia, E. (2002). Single-unit activity related to bimanual arm movements in the primary and supplementary motor cortices. J. Neurophysiol. 88, 3498–3517.
Evarts, E. V. (1968). Relation of pyramidal tract activity to force exerted during voluntary movement. J. Neurophysiol. 31, 14–27.
Fetz, E. E. (2007). Volitional control of neural activity: implications for brain-computer interfaces. J. Physiol. 579, 571–579.
Floden, D., and Stuss, D. T. (2006). Inhibitory control is slowed in patients with right superior medial frontal damage. J. Cogn. Neurosci. 18, 1843–1849.
Freeman, W. J., Holmes, M. D., Burke, B. C., and Vanhatalo, S. (2003). Spatial spectra of scalp EEG and EMG from awake humans. Clin. Neurophysiol. 114, 1053–1068.
Hanes, D. P., Patterson, W. F., and Schall, J. D. (1998). Role of frontal eye fields in countermanding saccades: visual, movement, and fixation activity. J. Neurophysiol. 79, 817–834.
Heinze, H. J., Münte, T. F., and Mangun, G. R. (1994). Cognitive Electrophysiology. Boston, MA: Birkhäuser.
Hjorth, B. (1975). An on-line transformation of EEG scalp potentials into orthogonal source derivations. Electroencephalogr. Clin. Neurophysiol. 39, 526–530.
Hyvärinen, A. (1999). Fast and robust fixed-point algorithms for independent component analysis. IEEE Trans. Neural Netw. 10, 626–634.
Hyvärinen, A., and Oja, E. (1997). A Fast Fixed-Point Algorithm for Independent Component Analysis. Neural Comput. 9, 1483–1492.
Jung, T. P., Makeig, S., McKeown, M. J., Bell, A. J., Lee, T. W., and Sejnowski, T. J. (2001). Imaging brain dynamics using independent component analysis. Proc. IEEE Inst. Electr. Electron. Eng. 89, 1107–1122.
Kawashima, R., Matsumura, M., Sadato, N., Naito, E., Waki, A., Nakamura, S., Matsunami, K., Fukuda, H., and Yonekura, Y. (1998). Regional cerebral blood flow changes in human brain related to ipsilateral and contralateral complex hand movements – a PET study. Eur. J. Neurosci. 10, 2254–2260.
Kok, A., Ramautar, J. R., De Ruiter, M. B., Band, G. P., and Ridderinkhof, K. R. (2004). ERP components associated with successful and unsuccessful stopping in a stop-signal task. Psychophysiology 41, 9–20.
Lancaster, J. L., Woldorff, M. G., Parsons, L. M., Liotti, M., Freitas, C. S., Rainey, L., Kochunov, P. V., Nickerson, D., Mikiten, S. A., and Fox, P. T. (2000). Automated Talairach Atlas labels for functional brain mapping. Hum. Brain Mapp. 10, 120–131.
Leuthardt, E. C., Schalk, G., Wolpaw, J. R., Ojemann, J. G., and Moran, D. W. (2004). A brain-computer interface using electrocorticographic signals in humans. J. Neural Eng. 1, 63–71.
Li, C. S., Yan, P., Sinha, R., and Lee, T. W. (2008). Subcortical processes of motor response inhibition during a stop signal task. Neuroimage 41, 1352–1363.
Liotti, M., Pliszka, S. R., Perez, R. 3rd, Luus, B., Glahn, D., and Semrud-Clikeman, M. (2007). Electrophysiological correlates of response inhibition in children and adolescents with ADHD: influence of gender, age, and previous treatment history. Psychophysiology 44, 936–948.
Logan, G. D. (1994). “On the ability to inhibit thought and action: a users' guide to the stop signal paradigm,” in Inhibitory Processes in Attention, Memory and Language, eds D. Dagenbach and T. H. Carr (San Diego, CA: Academic Press), 189–239.
Logan, G. D., and Cowan, W. B. (1984). On the ability to inhibit thought and action: a theory of an act of control. Psychol. Rev. 91, 295–327.
Mars, R. B., Coles, M. G., Hulstijn, W., and Toni, I. (2008). Delay-related cerebral activity and motor preparation. Cortex 44, 507–520.
Millán, J. D. R., Rupp, R., Müller-Putz, G. R., Murray-Smith, R., Giugliemma, C., Tangermann, M., Vidaurre, C., Cincotti, F., Kübler, A., Leeb, R., Neuper, C., Müller, K.-R., and Mattia, D. (2010). Combining brain–computer interfaces and assistive technologies: state-of-the-art and challenges. Front. Neurosci. 4:161. doi: 10.3389/fnins.2010.00161
Miller, K. J., Makeig, S., Hebb, A. O., Rao, R. P., den Nijs, M., and Ojemann, J. G. (2007). Cortical electrode localization from X-rays and simple mapping for electrocorticographic research: the “Location on Cortex” (LOC) package for MATLAB. J. Neurosci. Methods 162, 303–308.
Mink, J. W. (1996). The basal ganglia: focused selection and inhibition of competing motor programs. Prog. Neurobiol. 50, 381–425.
Mirabella, G. (2007). Endogenous inhibition and the neural basis of “free won't.” J. Neurosci. 27, 13919–13920.
Mirabella, G., Iaconelli, S., Romanelli, P., Modugno, N., Lena, F., Manfredi, M., and Cantore, G. (2012). Deep brain stimulation of subthalamic nuclei affects arm response inhibition in Parkinson's patients. Cereb. Cortex 22, 1124–1132.
Mirabella, G., Pani, P., and Ferraina, S. (2008). Context influences on the preparation and execution of reaching movements. Cogn. Neuropsychol. 25, 996–1010.
Mirabella, G., Pani, P., and Ferraina, S. (2009). The presence of visual gap affects the duration of stopping process. Exp. Brain Res. 192, 199–209.
Mirabella, G., Pani, P., and Ferraina, S. (2011). Neural correlates of cognitive control of reaching movements in the dorsal premotor cortex of rhesus monkeys. J. Neurophysiol. 106, 1454–1466.
Mirabella, G., Pani, P., Paré, M., and Ferraina, S. (2006). Inhibitory control of reaching movements in humans. Exp. Brain Res. 174, 240–255.
Moritz, C. T., Perlmutter, S. I., and Fetz, E. E. (2008). Direct control of paralysed muscles by cortical neurons. Nature 456, 639–642.
Mostofsky, S. H., and Simmonds, D. J. (2008). Response inhibition and response selection: two sides of the same coin. J. Cogn. Neurosci. 20, 751–761.
Nachev, P., Wydell, H., O'Neill, K., Husain, M., and Kennard, C. (2007). The role of the pre-supplementary motor area in the control of action. Neuroimage 36(Suppl. 2), T155–T163.
Nambu, A., Tokuno, H., and Takada, M. (2002). Functional significance of the cortico-subthalamo-pallidal ‘hyperdirect’ pathway. Neurosci. Res. 43, 111–117.
Nicolelis, M. A. (2003). Brain-machine interfaces to restore motor function and probe neural circuits. Nat. Rev. Neurosci. 4, 417–422.
Osman, A., Kornblum, S., and Meyer, D. E. (1990). Does motor programming necessitate response execution? J. Exp. Psychol. Hum. Percept. Perform. 16, 183–198.
Ramautar, J. R., Kok, A., and Ridderinkhof, K. R. (2006). Effects of stop-signal modality on the N2/P3 complex elicited in the stop-signal paradigm. Biol. Psychol. 72, 96–109.
Schalk, G. (2010). Can electro-corticography (ECoG) support robust and powerful brain-computer interfaces? Front. Neuroeng. 3:9. doi: 10.3389/fneng.2010.00009
Schalk, G., Miller, K. J., Anderson, N. R., Wilson, J. A., Smyth, M. D., Ojemann, J. G., Moran, D. W., Wolpaw, J. R., and Leuthardt, E. C. (2008). Two-dimensional movement control using electrocorticographic signals in humans. J. Neural Eng. 5, 75–84.
Schmajuk, N. A., Larrauri, J. A., Hagenbuch, N., Levin, E. D., Feldon, J., and Yee, B. K. (2006). Startle and prepulse inhibition as a function of background noise: a computational and experimental analysis. Behav. Brain Res. 170, 182–196.
Srinivasan, R., Nunez, P. L., and Silberstein, R. B. (1998). Spatial filtering and neocortical dynamics: estimates of EEG coherence. IEEE Trans. Biomed. Eng. 45, 814–826.
Stinear, C. M., Coxon, J. P., and Byblow, W. D. (2009). Primary motor cortex and movement prevention: where Stop meets Go. Neurosci. Biobehav. Rev. 33, 662–673.
Swann, N., Tandon, N., Canolty, R., Ellmore, T. M., McEvoy, L. K., Dreyer, S., DiSano, M., and Aron, A. R. (2009). Intracranial EEG reveals a time- and frequency-specific role for the right inferior frontal gyrus and primary motor cortex in stopping initiated responses. J. Neurosci. 29, 12675–12685.
Tallon-Baudry, C., and Bertrand, O. (1999). Oscillatory gamma activity in humans and its role in object representation. Trends Cogn. Sci. 3, 151–162.
Tanji, J., and Evarts, E. V. (1976). Anticipatory activity of motor cortex neurons in relation to direction of an intended movement. J. Neurophysiol. 39, 1062–1068.
van den Wildenberg, W. P., van Boxtel, G. J., van der Molen, M. W., Bosch, D. A., Speelman, J. D., and Brunia, C. H. (2006). Stimulation of the subthalamic region facilitates the selection and inhibition of motor responses in Parkinson's disease. J. Cogn. Neurosci. 18, 626–636.
Wang, W., Collinger, J. L., Perez, M. A., Tyler-Kabara, E. C., Cohen, L. G., Birbaumer, N., Brose, S. W., Schwartz, A. B., Boninger, M. L., and Weber, D. J. (2010). Neural interface technology for rehabilitation: exploiting and promoting neuroplasticity. Phys. Med. Rehabil. Clin. N. Am. 21, 157–178.
Wetherill, G. B., and Levitt, H. (1965). Sequential estimation of points on a psychometric function. Br. J. Math. Stat. Psychol. 18, 1–10.
Wolpert, D. M., and Miall, R. C. (1996). Forward models for physiological motor control. Neural Netw. 9, 1265–1279.
Keywords: volitional inhibition, stop signal task, countermanding task, voluntary movements, electrocorticography (ECoG), reaching movements, event-related potentials (ERP)
Citation: Mattia M, Spadacenta S, Pavone L, Quarato P, Esposito V, Sparano A, Sebastiano F, Di Gennaro G, Morace R, Cantore G and Mirabella G (2012) Stop-event-related potentials from intracranial electrodes reveal a key role of premotor and motor cortices in stopping ongoing movements. Front. Neuroeng. 5:12. doi: 10.3389/fneng.2012.00012
Received: 11 April 2012; Paper pending published: 28 May 2012;
Accepted: 15 June 2012; Published online: 29 June 2012.
Edited by:
Laura Ballerini, University of Trieste, ItalyReviewed by:
Hari S. Sharma, Uppsala University, SwedenLiang Guo, Massachusetts Institute of Technology, USA
Copyright: © 2012 Mattia, Spadacenta, Pavone, Quarato, Esposito, Sparano, Sebastiano, Di Gennaro, Morace, Cantore and Mirabella. This is an open-access article distributed under the terms of the Creative Commons Attribution Non Commercial License, which permits non-commercial use, distribution, and reproduction in other forums, provided the original authors and source are credited.
*Correspondence: G. Mirabella, Department of Physiology and Pharmacology “V. Erspamer”, La Sapienza University, Piazzale Aldo Moro 5, 00185 Rome, Italy. e-mail: giovanni.mirabella@uniroma1.it