
- 1 Department of Bioengineering, Graduate School of Engineering, The University of Tokyo, Tokyo, Japan
- 2 Department of Biomedical Engineering, Reykjavik University, Reykjavik, Iceland
Studies in adult mammals (rats, cats, mice, and humans) have revealed a surprising regularity in the duration of sleep and wake bouts. In particular, wake bout durations exhibit a power-law distribution whereas sleep bout durations exhibit an exponential distribution. Moreover, in rodents, sleep bouts exhibit an exponential distribution at all ages examined, whereas wake bout durations exhibit exponential distributions early in ontogeny with a clear power-law emerging only at the older ages. Thus, the data examined thus far suggests a similar developmental trajectory for a wide range of mammals which in turn may offer a novel metric to directly compare human and animal sleep–wake data. Therefore, we tested the generalizability of these findings by examining the distributions of sleep and wake bouts during the night in a healthy human sample – from premature infants to 70-year-olds. We find that sleep bouts elongate over the first years. At the same time wake bouts shorten but elongate again with increasing age. Moreover, sleep bout durations exhibit exponential distributions at all ages tested, except for the youngest (premature infants). Wake bouts exhibit a power-law distribution – but only during a restricted time window during adulthood. We conclude that the developmental trajectory of human sleep–wake cycles does not map well onto those of rodents; however, the method of characterizing sleep–wake cycles, using bout distribution, holds great promise for classifying sleep, its disorders, and tracking its developmental milestones across the lifespan in humans.
Introduction
In “Study wakefulness. Study the rest-activity cycle. Don’t just study sleep” Nathaniel Kleitman argues that the mysteries of sleep may be lost to the sleep-researcher who does not also study wakefulness (Kleitman, 1970). Indeed, brief periods of wakefulness frequently interrupt the much longer sleep bouts during, what to most of us seems to be, an uninterrupted night’s sleep. Moreover, these awakenings have recently been shown to be non-random events (Lo et al., 2002, 2004); the durations of the alternating bouts of sleep and wakefulness, which echo changes in the activity of neural mechanisms generating the behavioral states, exhibit a statistical regularity (Lo et al., 2002, 2004; Blumberg et al., 2005). The inclusion of the structure of durations of bouts of wakefulness as well as sleep, thus, holds information on the neural substrates of sleep and wakefulness and offers insights not included in many other models of sleep regulation (Borbély and Acherman, 2006).
In adult humans the duration of sleep bouts exhibits an exponential distribution with the rule P(t) ∼ exp(−t/τ) where t is the duration of an individual sleep bout, while wake bouts exhibit a power-law distribution with the rule P(t) ∼ t−α where t is the duration of an individual wake bout (Lo et al., 2002). Subsequently, it was demonstrated that the wake bouts exhibit a scale-free power-law behavior with an exponent, α, that remains constant across species (humans, cats, rats, and mice). In contrast, sleep bout durations follow an exponential distribution where τ represents a characteristic time scale whose main determinants are body size and metabolic rate (Lo et al., 2004). Turning to development, it was shown in neonatal rats and mice that both sleep and wake bouts exhibit an exponential distribution immediately after birth, with a clear power-law behavior of wake bouts emerging only after the second postnatal week (Blumberg et al., 2005, 2007). This occurs in spite of very little change in the overall duration of wake bouts; τ, on the other hand, increases sharply over the first postnatal weeks (Blumberg et al., 2005).
The data from adult humans, rodents, cats, and neonatal rats, therefore, indicate that the power-law exponent, α, is constant across multiple adult species; in contrast, the sleep-related time constant τ varies across species and age (Lo et al., 2002, 2004). The data from developing rats and mice, in turn, shows that during early development wake bout durations switch from exhibiting exponential to power-law behavior. Considering the conformity of the data from adult cats, rats, mice and humans (Lo et al., 2002, 2004) as well as from developing rats (Blumberg et al., 2005) and mice (Blumberg et al., 2007), it is tempting to speculate that these trends in sleep–wake bout distribution represent universal mammalian phenomena.
Currently, we predict that humans follow a similar developmental trajectory in sleep–wake bout duration dynamics as rodents. If this is the case, it would be most parsimoniously explained by a similar developmental trajectory at the neural level. This opens novel insights into the neural underpinnings of sleep–wake cycle dynamics and will pave the way for inter-species comparisons as the only information needed is analysis of the length of sleep and wake bouts. Thus, movement based sleep recordings in, for example, zebrafish or drosophila can be contrasted against human data. In addition, this method holds promise for elucidating the development of clinical sleep disorders and comparing them to normal sleep data, possibly helping with diagnosis (Bianchi et al.). Last but not least, the method holds promise for drug development, as it allows for drug testing and screening to be done in lower animals, e.g., drosophila and zebrafish, before clinical testing is done in rats and humans. In sum, the method described here allows for a direct comparison of sleep–wake cycles across ontogeny and phylogeny. And, in clinical terms the methodology used here could provide a novel, simple, metric for screening or for assessing the severity of disorders of sleep and wakefulness.
Materials and Methods
Participants
Fifty-eight participants, from prematurely born infants to 74-year-olds, provided data used in the study. Data were sampled from participants evenly across the lifespan and then assigned to pre-defined age groups, representing lifespan human development. We based our groups on previous studies indicating that the greatest changes in sleep-wake dynamics occur early in life (Roffwarg et al., 1966). At the young ages sampling was done with shorter age intervals. The groups were as follows: Prematurely born humans (group 1: 30–35 weeks post-conception); toddlers/children (group 2: 0–6 years); pre-adolescence (group 3: 7–12 years); adolescence (group 4: 13–20 years); young adults (group 5: 21–34 years); adults (group 6: 35–60 years), and old (group 7: 61–80 years). The study was, thus, conducted on sample that parsimoniously yet fully represents the human lifespan. The study was approved by the Icelandic National Bioethics Committee (permit VSNb2007100011/03-15). Participant characteristics are presented in Table 1; participant age and gender are presented in Figure 1.
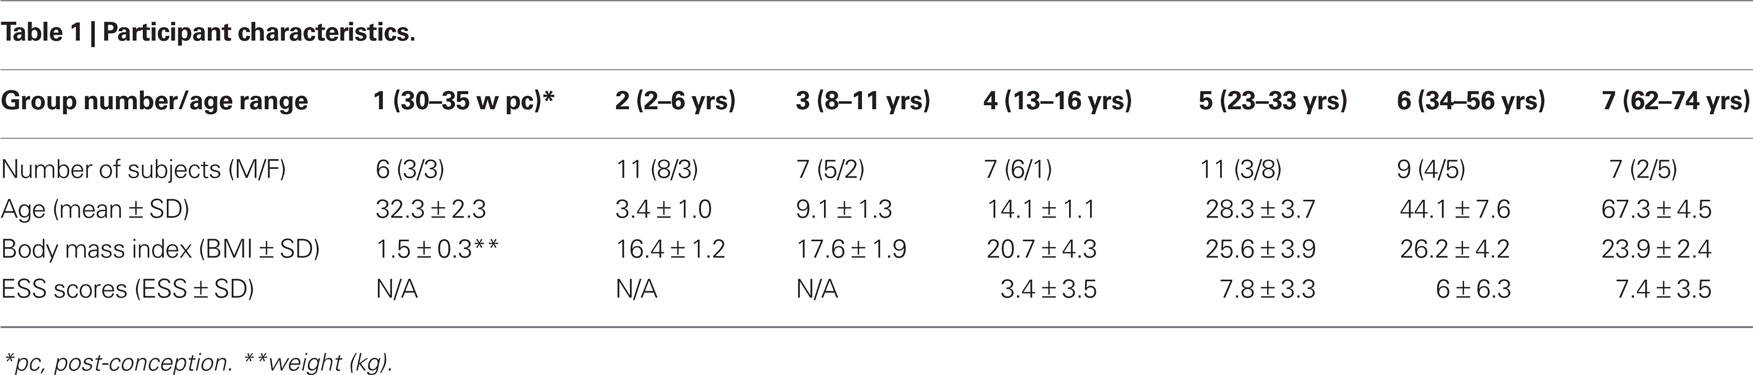
Table 1. Participant characteristics.
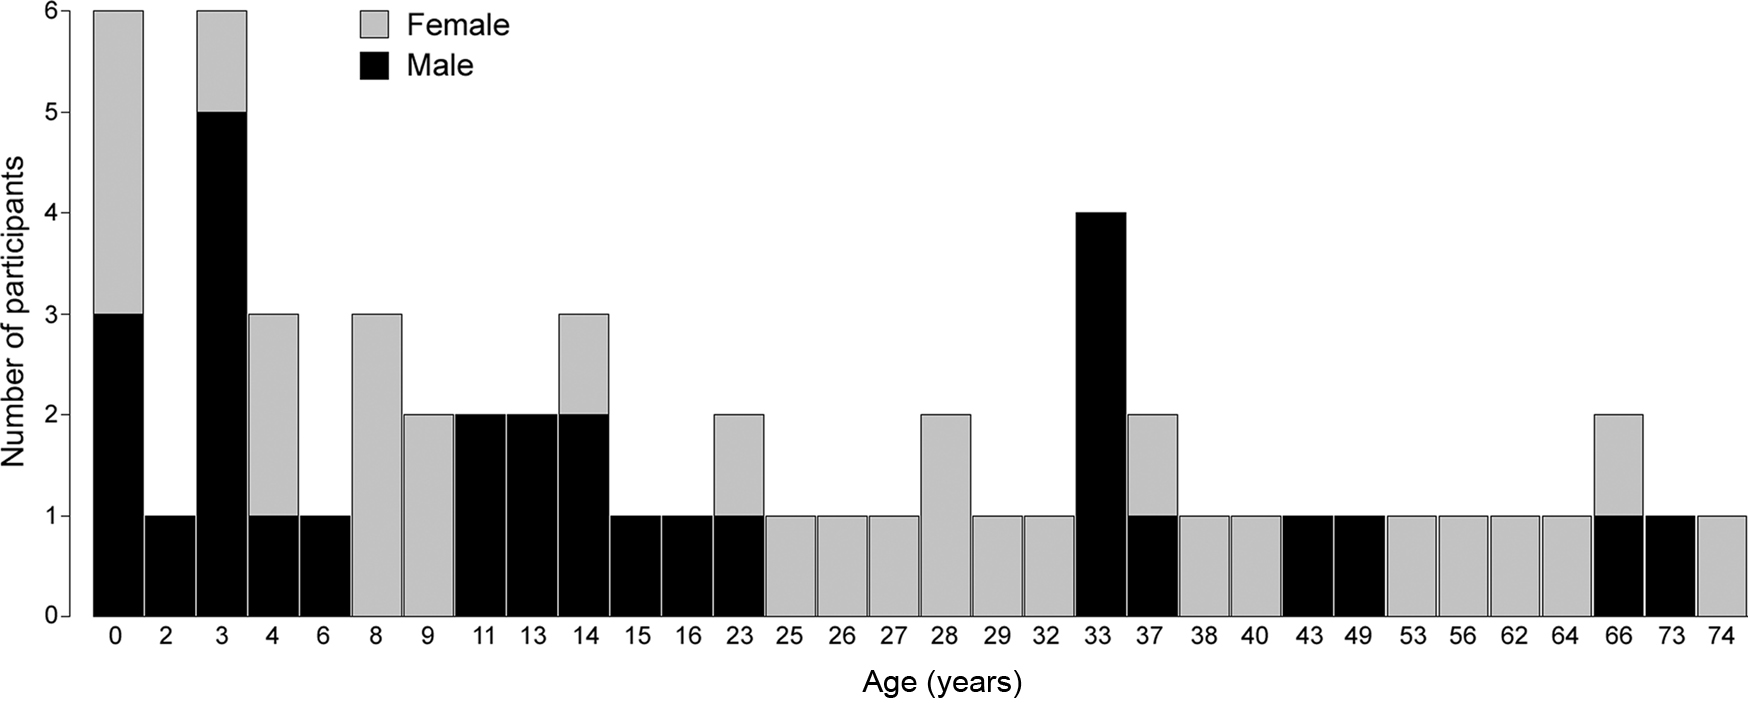
Figure 1. Graphical depiction of age and gender of all participants.
Recruitment
For group 1, eight consecutive preterm infants, born between 30 and 35 weeks of post-conception, were recruited at the National University Hospital in Iceland. They were inscribed at the neonatal intensive care unit (NICU) and deemed neurologically healthy by the attending physician. Parental informed consent was obtained by a neonatologist after a detailed description of the procedures had been given (two of the eight were omitted from the study: legal guardians of one preterm infant declined to take part and one recording was not usable for technical reasons). Health status of participants in group 1 was obtained from medical records.
For groups 2–7, participants were drawn from a randomized sample of 1000 inhabitants from the Reykjavik area, taken from the national registry of Iceland. Participants (or their legal guardians) were contacted by phone and offered to take part in the study. Of more than 250 potential participants contacted, 86 participants accepted to take part and were pre-screened for health status over the phone; subsequently 21 participants (9 female, 12 male; age range 13–66 years) were dropped from the study before undergoing the polysomnography (PSG) due to at least one of the following conditions that may alter sleep patterns: obesity, depression, insomnia, snoring, alcohol, and/or substance abuse, recent hospitalization, or the use of sleep altering medications. One participant underwent PSG but was dropped due to suspected hypothyroidism and six PSGs were unusable for technical reasons.
Questionnaire
Before the study each participant (or their legal guardians) completed a 38-item questionnaire, adapted from the National University Hospital of Iceland in addition to the Epworth sleepiness scale (ESS) (Johns, 1991). The questionnaire has been used to guide clinical assessment at the National University Hospital in Iceland for over two decades – but has not been formally validated. Thus, the questionnaire was used only to verify that participants did not suffer from conditions known to alter sleep patterns. The questionnaire included: five items about smoking and alcohol use, open ended questions on medical conditions, hospitalizations, and use of prescription medicines; 23 items on sleep quality; four items aimed at identifying complaints of restless leg syndrome and six items aimed at identifying complaints of respiratory disturbances. Legal guardians of participants in groups 1, 2, and 3, only answered the first five items on behalf of the participant; participants in group 4 answered the questionnaire excluding questions on alcohol and tobacco use, and the ESS; participants in groups 5, 6, and 7 answered the questionnaire in full. The questionnaire data suggested that none of the 58 participants that provided data for the current study suffered any condition that could alter sleep patterns.
Procedure
Group 1: Recordings were performed between 23:00 and 06:00 in an incubator at the NICU. At the NICU, during the period between 23:00 and 06:00, an effort is made to minimize environmental sounds and dampen the lights to the lowest possible level in order to enable infants to obtain sleep while still allowing staff to go about their necessary work. Nurses made notes on data sheets, listing all interruptions in the infant’s sleep due to care, e.g., feeding, diaper change, or any routine clinical checks that were made. These epochs were excluded in the data analysis. Electroencephalogram (EEG) was recorded continuously from four leads, T3, T4, C3, and C4, according to the international 10–20 system (Ag/AgCl disk electrodes; GrassTM F-E6SHC, Astro-Med Inc., West Warwick, RI, USA). A ground electrode was placed on the forehead. Before electrode placement, the scalp was cleaned thoroughly with abrasive gel to minimize impedance and electrodes were filled with electrode conductance gel (EC2, Astro-Med Inc., West Warwick, RI, USA). Electrodes were subsequently attached to each infant’s head using medical tape. Chin electromyogram (EMG) was recorded using gold electrodes. Four piezo-electric movement sensors, modified to fit premature infants were attached to ankles and wrists and used to record limb movements (1770G, Astro-Med Inc., West Warwick, RI, USA). All signals were sampled at 500 Hz using GrassTM amplifiers (15A12/15A54, Astro-Med Inc., West Warwick, RI, USA) and GammaTM data acquisition software (Astro-Med Inc., West Warwick, RI, USA). In addition, as a part of clinical routine electrocardiograph and Arterial oxygen saturation was constantly monitored throughout the procedure. During the recordings, no significant cardiac or desaturation events were noted.
Groups 2–7: Each participant underwent an un-attended ambulatory PSG with a digital recording system (Medcare Inc., Iceland). The experimenter prepared the recording at the participant’s house after 21:00 and instructed the participant to follow their normal daily sleep routine as closely as possible. All recordings were performed between 22:00 and 08:00. The PSG included four channels (C3-A2; C4-A1; O3-A2; O4-A1) EEG, electrooculogram (EOG), chin EMG, and electrocardiogram (ECG). Airflow was recorded with a nasal cannula. Thoracic and abdominal respiratory movements were recorded by uncalibrated impedance plethysmography. Arterial oxygen saturation was measured continuously via an infrared finger probe and a piezo-position sensor was used to monitor postural changes.
Data Analysis
Sleep–wake cycles were scored by an accredited sleep technologist; first the data were analyzed using the built-in analysis module of the Somnologica software (Medcare Inc., Iceland) subsequently the scoring was adjusted by the technologist. Since the PSG records were scored just prior to the AASM release of the current manual of scoring sleep and associated events, all sleep parameters were scored in accordance to the Rechtschaffen and Kales criteria (Rechtscaffen and Kales, 1968). For group 1, sleep states were scored using criteria adapted from prior work in premature infants (Curzi-Dascalova et al., 1993; Vecchierini et al., 2007). Scoring was done on the Neuroscore software (DSI, St. Paul, MN, USA). Briefly, sleep and wakefulness was scored in 30-s epochs, ignoring the distinction between rapid eye movement (REM) and slow wave sleep (SWS) – both were classified as sleep. Periods of wakefulness were identified as all epochs that contained continuous movements, sporadic single limb movements (5–15 per epoch) with elevated EMG, or elevated EMG with a higher ratio of beta (>50%) to delta/theta EEG frequencies. Periods of sleep were identified as all epochs that did not contain movements and encompassed discontinuous EEG, or contained single sporadic movements (<5 per epoch) and low or atonic EMG with a lower ratio of beta (<50%) to delta/theta EEG frequencies. In groups 2–7 sleep was scored in 30-s epochs according to conventional methods (Rechtscaffen and Kales, 1968) using the Neuroscore software (DSI, St. Paul, MN, USA). After conventional sleep–wake scoring and analysis, all bouts of SWS 1–4 and REM were merged, since the following analyses do not require information on alternations within sleep states (or other parameters such as respiratory indexes, micro-arousals, etc.). Next, sleep–wake bout duration data were imported into JMP 7.0 (SAS, Cary, NC, USA) and DeltaGraph 5.6.3 (SPSS, Chicago, IL, USA) for statistical analysis. Mean durations of sleep and wake bouts were calculated for each group. Survivor distributions were produced from each participant as well as from pooled data at each age. Data were plotted using log–log and semi-log coordinates and regression analyses were performed on the data for each participant to assess the r2 values and, therefore, the degree of fit of the data to power-law and exponential distributions. (To be able to compute the fit to an exponential or power-law distribution it is necessary that the data encompass five or more transitions between bouts of uneven length; data from 18 participants did not reach that criterion and could not be used for this part of the analysis). Finally, the values α and τ were constructed from log-survivor distributions and compared at each age possible. Analysis of variance (ANOVA) was used to test for differences across age groups and the Tukey–Kramer HSD was used for follow-up tests. Paired t-tests were used to test for within-age group differences. For all tests, the Type 1 error rate (alpha) was set at 0.05. All means are presented with their standard errors.
Results
Sleep Parameters
The sleep parameters indicate that the participant sample used here represents a healthy cross-section of the population. Sleep duration, movement patterns, and neurological status of premature infants (group 1) are comparable to what has been previously reported (Dreyfus-Brisac, 1970; Curzi-Dascalova et al., 1988, 1993; Watanbe, 1992; Mirmiran et al., 2003). Sleep parameters for participants in groups 2–7 are presented in Table 2. In all age groups total sleep time, REM and NREM amounts represent normal values (Bliwise, 2005; Carskadon and Dement, 2005), ESS scores do not indicate daytime sleepiness (Johns, 1991), and low oxygen desaturation index (ODI) values suggest the absence of sleep disordered breathing (Chiner et al., 1999).
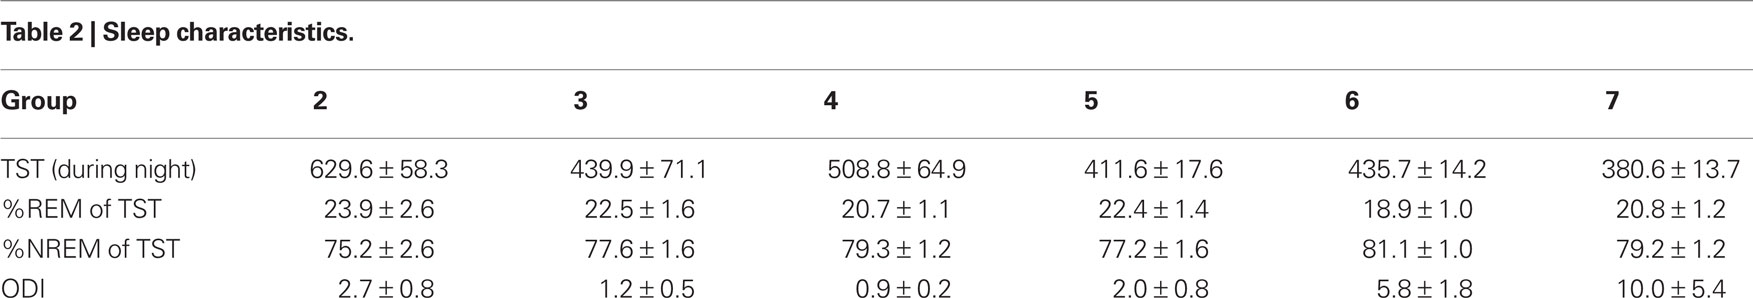
Table 2. Sleep characteristics.
Mean Sleep–Wake Bout Durations
Mean sleep bout durations differed significantly across the age groups tested here (F6,45 = 7.6, P < 0.0001). The mean sleep bouts are shortest in group 1 and a follow-up test revealed that they differ significantly from all other age groups; however, differences between all other pairs of means are non-significant. Mean sleep bout lengths (in seconds) are as follows: group 1: 647.7 ± 106.7; group 2: 1927.2 ± 163.3; group 3: 1828.2 ± 199.3 ; group 4: 1356.3 ± 147 group 5: 1163.7 ± 149.4; group 6: 1724.6 ± 176.3, and group 7: 1465 ± 134.4. Mean bout lengths are depicted as bars and significantly different pairs of means are denoted with asterisks in Figure 2A.
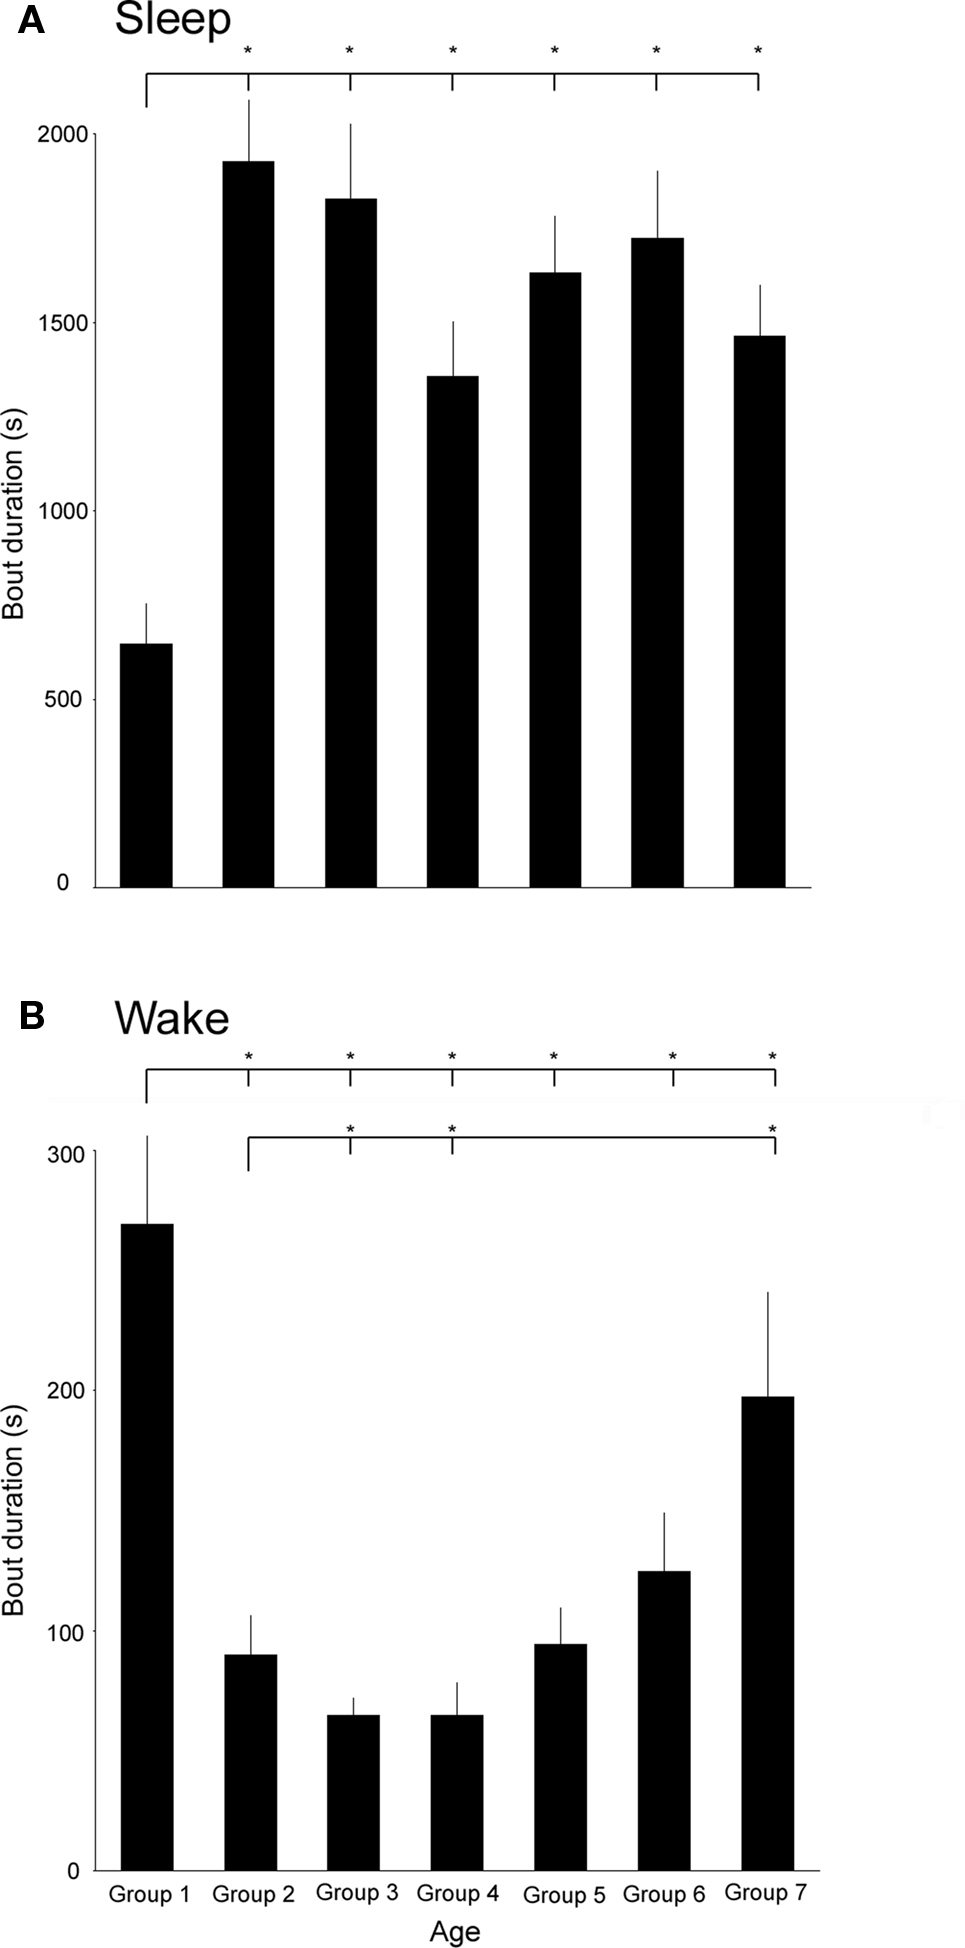
Figure 2. (A) Mean sleep bout durations in age groups 1–7. Line and asterisk indicate that the mean sleep bout duration of age group one is significantly smaller than in all other groups. (B) Mean wake bout durations in the age groups 1–7. Lines and asterisks indicate that the mean wake bout duration of age group one is significantly larger than in all other groups except group 7 and the mean wake bout duration is significantly longer in age group 7 than in groups 2–4.
Similarly, mean wake bout durations differed significantly across the age groups (F6,45 = 9.2, P < 0.0001). In contrast to sleep bouts, the longest mean wake bouts occur in the youngest and oldest age groups; the shortest occur in groups 3 and 4. The average wake bout durations are the greatest in group 1 and the follow-up test revealed that they differ significantly from groups 2 to 6. Bouts in group 7 were significantly greater than in groups 2–4. Mean wake bout lengths (in seconds) are as follows: group 1: 269.1 ± 36.8; group 2: 89.7 ± 16.7; group 3: 64.6 ± 7.5; group 4: 64.8 ± 13.5 group 5: 94.4 ± 15.03; group 6: 124.5 ± 24.4, and group 7: 197.3 ± 43.7. Mean bout lengths are depicted as bars and significantly different pairs of means are denoted with asterisks in Figure 2B.
Bout Length Distributions of Sleep–Wake Cycles
For clarity, survivor distributions of three selected groups (1, 5, and 7) are presented in Figure 3. Survival data that follow an exponential distribution fall on a straight diagonal line on a semi-log plot; those that follow a power-law distribution fall on a straight diagonal line on a log–log plot. From the plots it can be seen that sleep bout durations follow an exponential distribution in age groups 5 and 7 (Figure 3A). It is also noticeable that group 1 exhibits a different pattern from the other two, indicating that the bouts are not only shorter but are organized differently. The fit for wake bout durations is less clear. Bout durations for group 5 fall to the left (indicative of the shorter bouts) reflecting that wake bout length exhibits a U-shaped curve across development in humans; however, in contrast to rats (Blumberg et al., 2005), a clear straight-plot does not emerge.
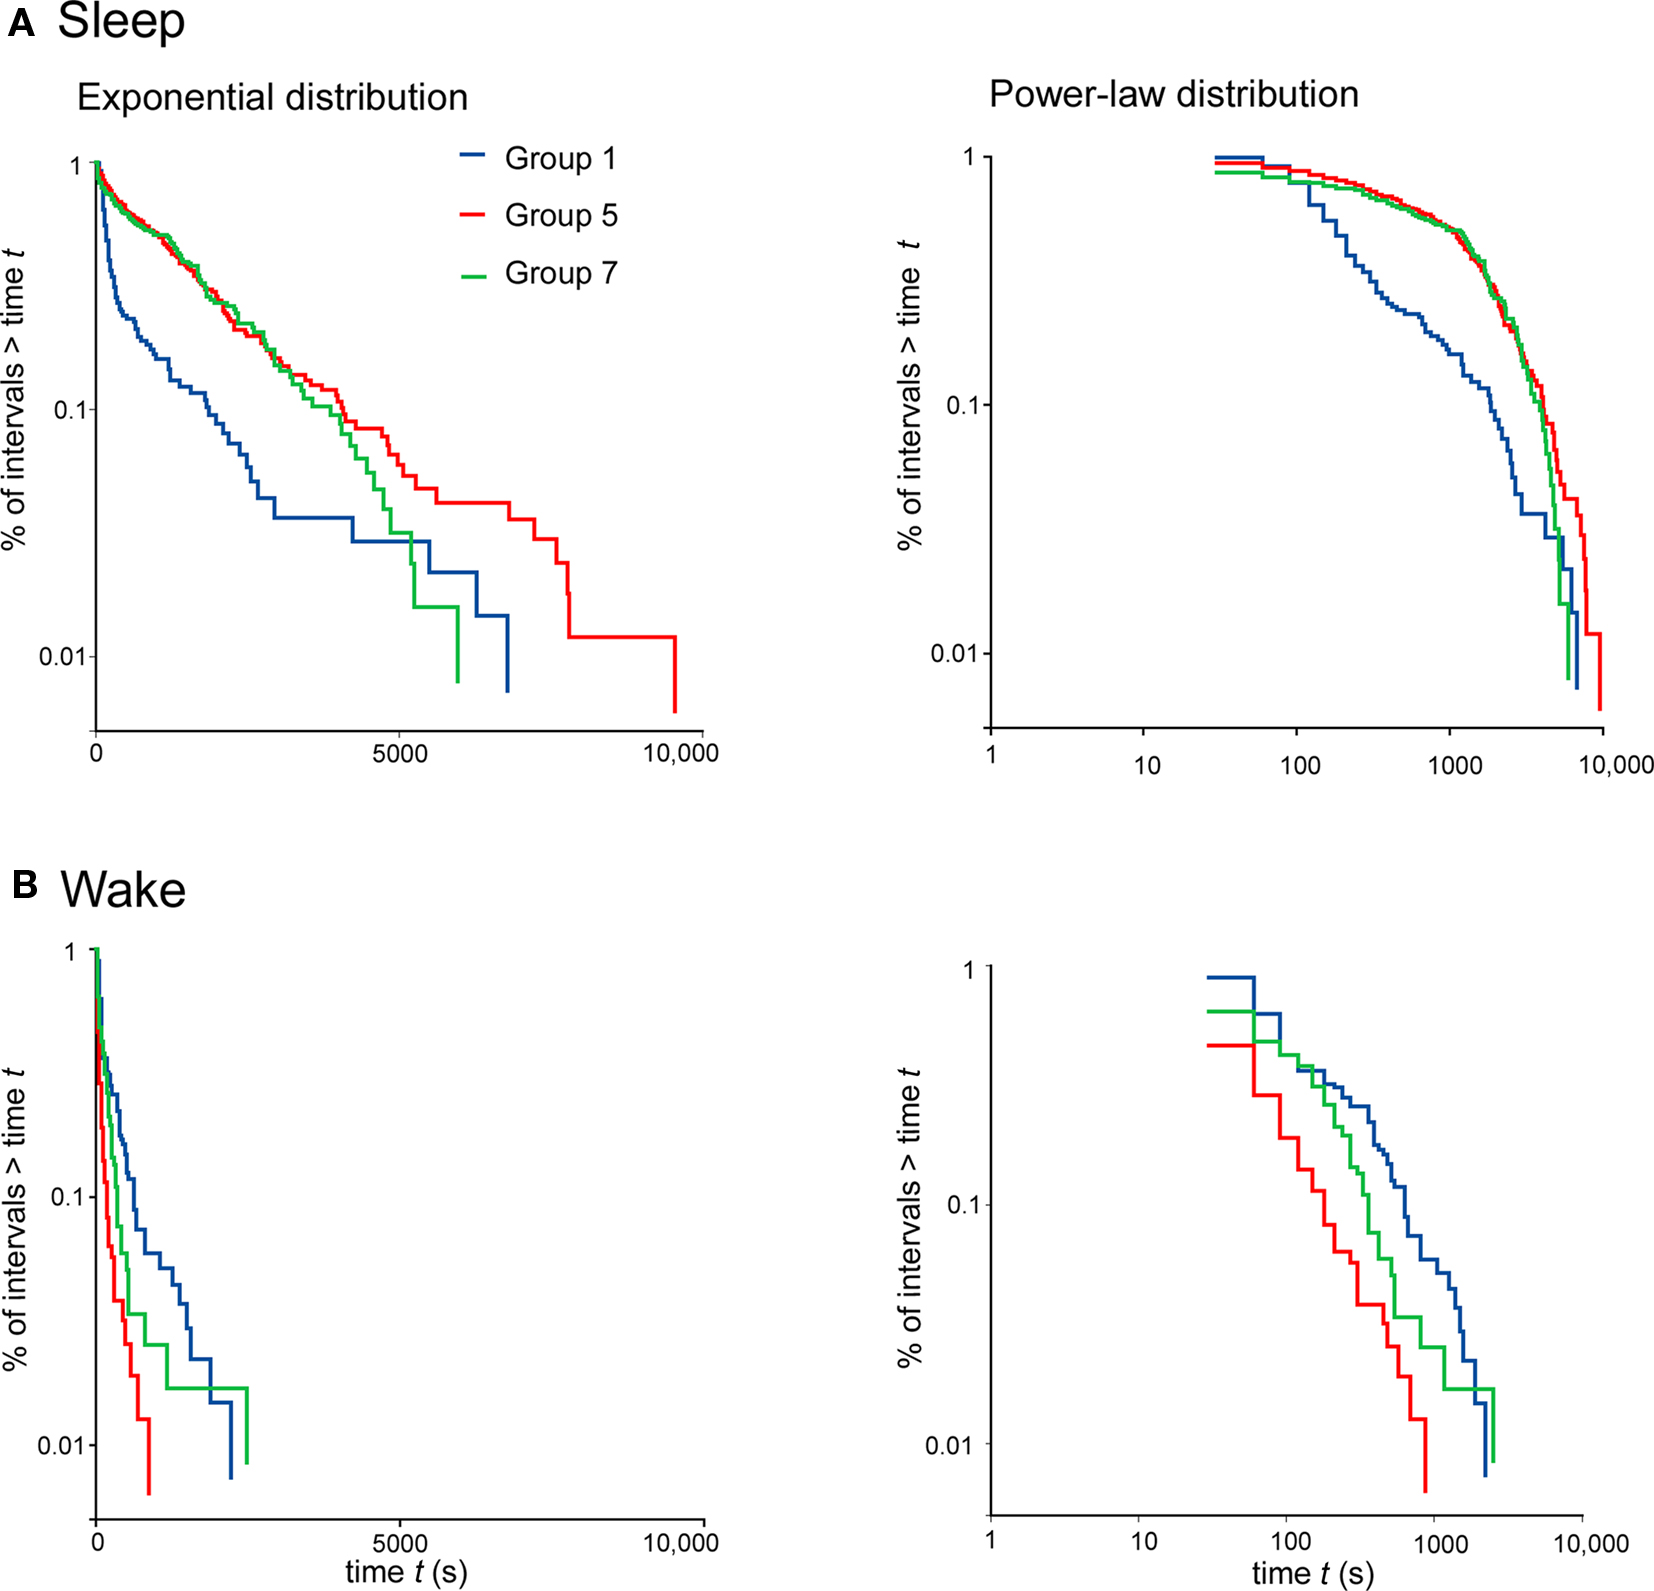
Figure 3. Survivor plots of sleep (A) and wake (B) for participants in age groups 1, 5, and 7; premature infants, 23- to 33-year-olds and over 62-year-olds, respectively. Each plot encompasses pooled data at each age. On the left, plots constructed using semi-log coordinates are depicted: straight diagonal lines on these plots indicate an exponential distribution of bout lengths. On the right, plots constructed using log-log coordinates are depicted: straight diagonal lines on these plots indicate a power law distribution.
To assess whether the sleep and wake bout functions are better described by exponential or power-law distributions at each age, regression analyses were performed for each participant, plotting the data using semi-log or log–log coordinates. For sleep bouts ANOVA revealed a significant effect of bout distribution (power-law vs. exponential) (F1,115 = 111.3, P < 0.0001) but no significant difference between age groups (F6,38 = 0.8) and no significant age group × bout distribution interaction (F6,115 = 2.2). For wake bouts ANOVA revealed that there were no significant differences between bout distributions (F1,87 = 0.3) but significant effects of age group (F6,87 = 3.1, P < 0.01) and age group × distribution interaction (F6,87 = 2.7, P < 0.05). The interaction was due to large changes in distribution over the age groups 6 and 7; in age group 6 wake bout durations fit significantly better with a power-law distribution (t = 2.42, df = 9.57, P = 0.036) whereas in age group 7 they fit significantly better with an exponential distribution (t = 3.28, df = 5.51, P = 0.019).
Paired t-tests were used to assess the degree of fit to power-law or exponential distribution at each age, revealing which distribution better describes the bout duration data at each age. Figure 4 depicts the r2 values produced using regression analyses of survivor data across all the age groups tested; significant differences between pairs are denoted with asterisks. At all age groups, except group 1, sleep bout durations exhibit significantly better fit to an exponential distribution. In age groups 1–5 wake bout durations do not exhibit a significantly a better fit to either a power-law or exponential distributions; however, in group 6 the wake bout durations do exhibit a better fit to a power-law distribution, whereas, in group 7 the trend reverses and wake bout durations exhibit a better fit to an exponential distribution.
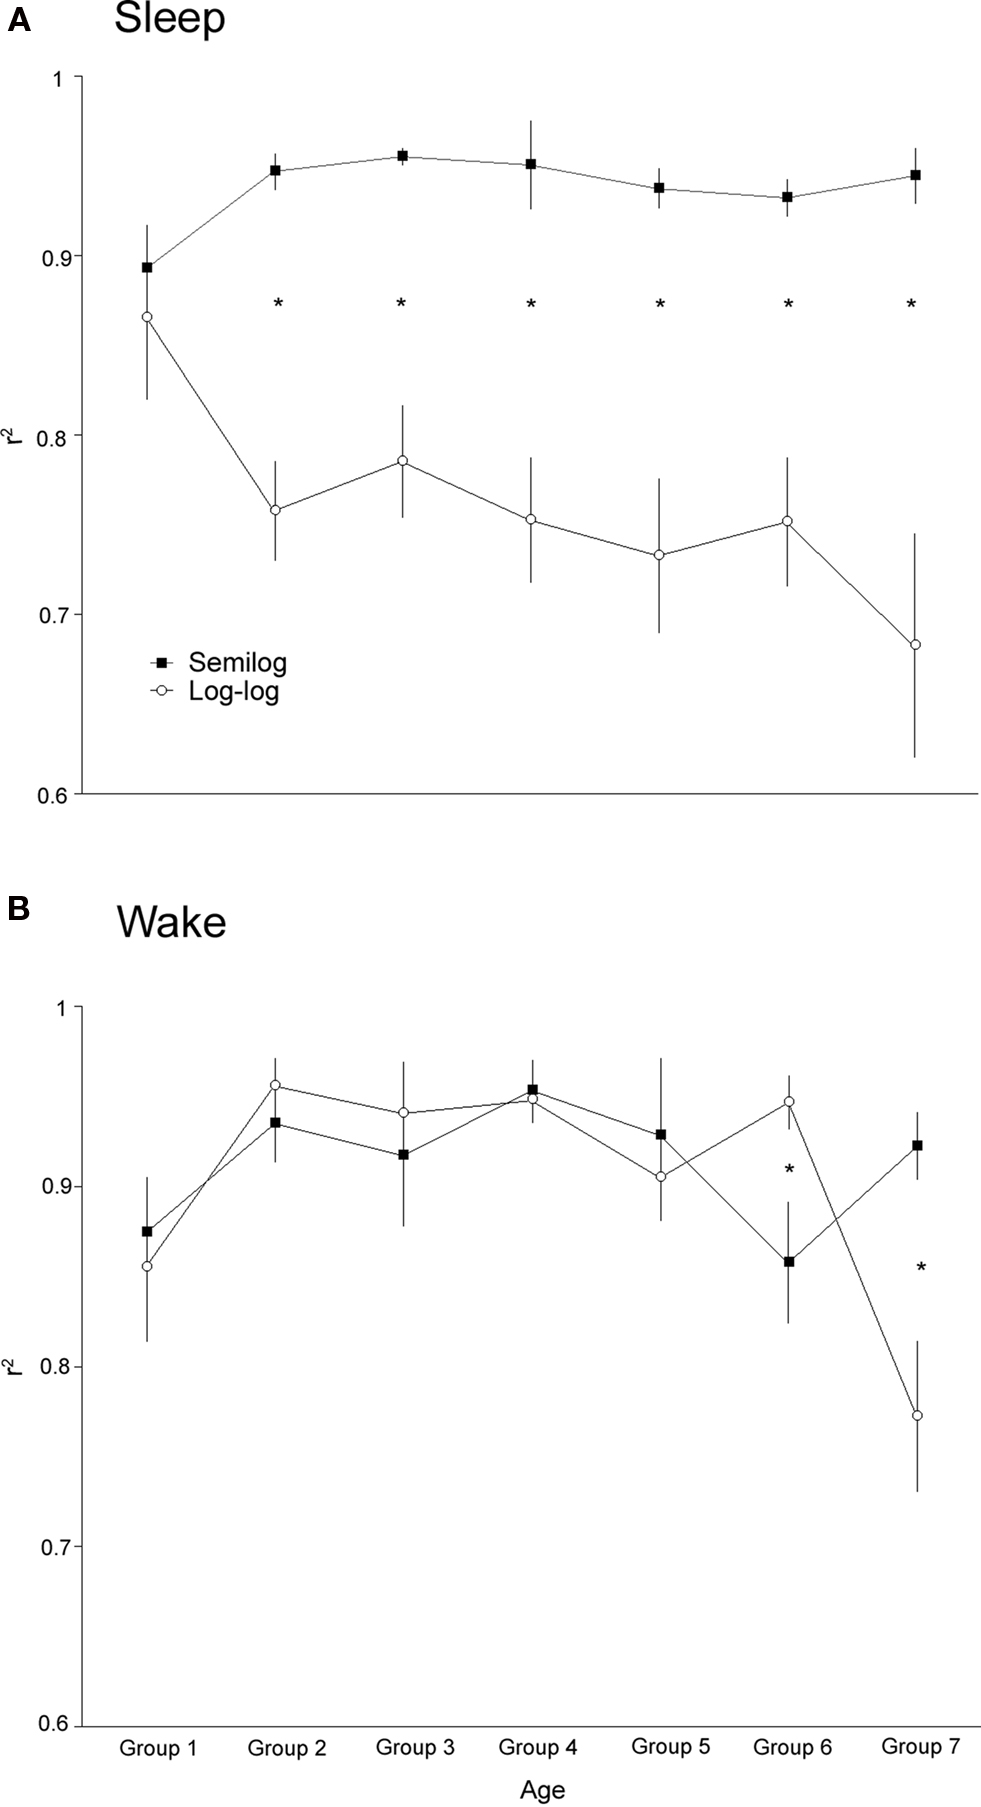
Figure 4. Values of r2 produced using regression analysis of survivor data at all ages examined. For each participant the degree of fit to exponential or power-law distribution was determined. (A) Average fit with exponential and power-law distribution for sleep bouts is depicted for each age. At all ages, except for the premature infants, sleep bouts are better described by an exponential distribution. (B) Average fit with exponential and power-law distribution for wake bouts is depicted for each age. For age groups 1–5 there is no significant difference between the fit to either distribution. At age group six wake bout lengths fit power-law distributions significantly better, whereas, at age group seven the inverse is true. Significant within-age differences are represented by an asterisk.
Due to the constant exponential behavior of sleep bout distributions we could track the evolution of the time constant, τ, across the lifespan. As expected, τ closely follows the mean sleep bout length across the age groups. A one-way ANOVA, however, revealed a non-significant main effect of age on τ (F6,51 = 0.8). The time constants were as follows (in minutes): group 1 = 22.9 ± 11.2; group 2 = 37.9 ± 3.8; group 3 = 38.7 ± 9.2; group 4 = 26.9 ± 4.5; group 5 30.4 ± 3.7; group 6 = 36.8 ± 8.0; group 7 = 31.1 ± 4.7. In comparison, a previous study, performed on participants aged 23- to 57-years-old, found a time constant of 20.0 ± 5.0 (Lo et al., 2002).
Only in one age group (6), did wake bouts exhibit power-law behavior, rendering it valid to calculate the exponent, α, which measured 0.9 ± 0.12 compared to 1.3 ± 0.4 in the previous adult human study (Lo et al., 2002).
Discussion
We recorded and analyzed sleep–wake cycle data in healthy humans across the lifespan. The current findings offer support for the notion that sleep bout durations exhibit exponential behavior virtually throughout the lifespan; however, in contrast to what might be expected from prior rodent data (Blumberg et al., 2005), wake bout durations only exhibit power-law behavior during a restricted developmental time window. In the current study sleep data is collected at night only and the participants were instructed to closely follow their normal routine. This was done to maximize the likelihood of recording normal alternations of sleep and wake during the night’s sleep. Detailed analysis of the development of total sleep times, which is beyond the scope of this paper, necessitates 24-h recordings.
The mean sleep bout length exhibits a striking increase between the first and second age groups, that is, between prematurely born infants and 2- to 6-year-olds (see Figure 2A). After that, surprisingly, remarkably little changes occur. This is partly consistent with prior studies on infants showing consolidation of sleep bouts with age (Kleitman and Engelman, 1951; Dreyfus-Brisac, 1970; Curzi-Dascalova et al., 1988). The large differences in mean bout durations between the first and second age groups suggest that more densely sampled age groups over the first postnatal year are needed to fully describe this trend, whereas less dense data sampling at the older groups will suffice. Indeed, in a prior study, the development of sleep–wake bout durations in rats was described over the first 21 postnatal days, describing large differences and clear trends in bout length and distribution (Blumberg et al., 2005). The first 21 postnatal days in rats all roughly correspond to what is classified here as group 1 (Clancy et al., 2001). Mean wake bout lengths exhibit a U-shaped curve when examined across the lifespan. That is: the wake bouts shorten dramatically over the first age groups and then gradually increase again – approximating the levels of premature infants in the oldest (+62 years) group. It is important to note that this increase in wake bout length occurs in a healthy population and is, therefore, not due to an increase in age-related illnesses. The increase in the mean wake bout length may thus reflect a normal age-associated inability to re-enter the sleep state after an awakening.
In all age groups, except for the youngest (premature infants), sleep bout durations exhibit an exponential distribution. This is partly in agreement with prior studies showing that both infant and adult rats, and other adult mammals, exhibit an exponential distribution of sleep bout durations (Lo et al., 2004; Blumberg et al., 2005). From the prior data one may have predicted that humans would exhibit exponential distribution of sleep bouts at all ages. Wake bouts exhibited a significantly better fit to a power-law distribution at age group 6 (34–56 years), but to an exponential distribution at age group 7 (+62 years). In all other age groups there were non-significant differences between the fit of wake bout durations with power-law or exponential distribution. Interestingly, age group 6, which indeed did exhibit a power-law distribution, is also the group that best corresponded to the age group used in the prior adult human study (i.e., 23–57 years of age compared to the 34–56 years of age currently used). The power-law distribution of wake-bouts may, thus, reflect a developmental stage of mammalian life where the most rapid ontogenetic changes have occurred but before the aging process has begun. Consistent with this notion is the fact that the longest wake bouts occur at the two extremes of the age groups examined here; however, in spite of the mean wake durations being similar, 269.1 ± 36.8 and 197.3 ± 43.7 s in the youngest and oldest age groups, respectively (NS), the bout length distributions differ widely. In the premature group the r2 to exponential and power-law distribution is 0.87 ± 0.03 and 0.86 ± 0.04 (NS), respectively, whereas the r2 in the oldest group is 0.92 ± 0.02, and 0.77 ± 0.04 (t = 3.28, df = 5.51, P < 0.001). This suggests that the elongated wake bouts of infancy and old age are of different neural origins.
The values of the exponent, α, and the time constant, τ, obtained here are roughly comparable to previously reported values (Lo et al., 2002). The value of α is somewhat smaller: 0.9 ± 0.12 compared to 1.3 ± 0.4. Possibly this discrepancy is due to different populations sampled, in the original report only age range and gender is given but not information on other parameters that are likely to affect sleep–wake cycle distributions (e.g., weight, drug intake, health status, etc.). The time constant, τ, is related with body size and age, as demonstrated by the increase in τ in larger species and increase in τ over the first postnatal weeks in rats (Lo et al., 2004; Blumberg et al., 2005). The currently documented changes in τ, albeit non-significant, reveal a trend where the largest difference may occur between age groups 1 and 2. This period is obviously a period of rapid increase in body weight but also of massive neural growth. Since the value of τ does not significantly correlate with increased body weight in age groups 2–7 (mean weights in groups) it is tempting to conclude that during development τ foremost reflects neural changes, or even the degree of encephalization, rather than changes in body weight.
This novel method of classifying sleep-wake states only requires knowledge on the duration of sleep and wake bouts, as opposed to the detailed knowledge of REM–NREM alternations, micro-arousals (too short to be classified as an epoch of wakefulness), or other phenomena required for traditional analysis methods (Rechtscaffen and Kales, 1968). This is important for several reasons. First, the bout distributions hold promise for screening of sleep disorders. As seen above, wake bout duration increases and becomes exponentially distributed with age in the healthy sample recorded here. Since most sleep disorders include sleep fragmentation, it is reasonable to assume that this trend is hastened in a younger – but unhealthy – population. Experiments performed in young rats and mice have indeed shown that insults to neural systems integral to sleep and wakefulness and sleep deprivation fundamentally alter sleep–wake bout distributions (Wisor et al., 2001; Blumberg et al., 2007; Gall et al., 2009; de Souza et al., 2010). We hypothesize that a comparison of healthy and a well-defined patient population (e.g., sleep apnea patients) will reveal significant differences in α and τ parameters. Indeed, it has been shown that sleep apnea significantly modifies sleep stage transitions (Bianchi et al., 2010) Second, since electrographic criteria are not a necessary pre-condition for the analysis (Blumberg et al., 2005), data from a large group of animals that have only recently begun to be used in sleep research, such as fruit flies and zebrafish (Shaw et al., 2000; Zhdanova, 2006), can be analyzed in a manner directly and meaningfully comparable to humans; paving the way for novel, simple animal models of sleep disorders (Hendricks et al., 2000). Moreover, since fewer parameters are needed for analysis, a simple measuring device will suffice for recording, rendering large-scale sleep–wake cycle recordings in humans achievable. Finally, we hypothesize that this method could be used to assess developmental processes. Performing a full PSG on neonates and infants is notoriously hard. Recording their sleep–wake cycles with simpler devices, using, for example, movement or EMG as key indicators, will provide sufficient data for the analysis routines described here. The immense changes in sleep–wake bout length and structure over the first months and years of life indicate that they could be used for gauging developmental milestones.
Rodent data indicates that the elongation of sleep–wake cycles depends on the functional integration of hypothalamic to mesopontine structures (Karlsson et al., 2004). Drastic change in sleep–wake bout length between participants in groups 1 and 2 in the current study could possibly be explained by similar neurological changes. The emergence of power-law behavior of wake bouts, however, has been shown to depend on the hypocretin system and the functional integrity of the locus coeruleus in rodents (Blumberg et al., 2007; Gall et al., 2009) and this fact is hard to reconcile with the late emergence of power-law behavior of wake bouts in humans. Possibly, the fit to either power-law or exponential behavior reveals a balance between rostral (e.g., basal forebrain and hypothalamic) and caudal (e.g., laterodorsal tegmental and pendunculopontine nuclei) neural structures; a balance that is tilted toward power-law during a restricted period during adulthood in humans.
We, thus, agree with Nathaniel Kleitman that sleep researchers should also study wakefulness; study the rest–activity cycle and not just study sleep. We have shown that in humans there is not a clear early developmental switch from exponential to power-law behavior of wake bouts, however, comparable with that seen in other mammals humans do exhibit an exponential distribution of sleep bouts post-natally. We conclude that the novel method of characterizing sleep–wake cycle dynamics discussed here holds promise for garnering novel, simple, ways of classifying sleep, its disorders, and tracking its developmental milestones across the lifespan.
Conflict of Interest Statement
The authors declare that the research was conducted in the absence of any commercial or financial relationships that could be construed as a potential conflict of interest.
Acknowledgments
This work was supported by European Research Council Marie Curie grant no 0044932 (Karl Ægir Karlsson) and Icelandic Centre for Research grant no 080441022 (Karl Ægir Karlsson). We thank Magdalena ó. Sigurgunnarsdóttir for help with data collection and sleep staging, Þórarinn Gíslason MD PhD for lending equipment, Atli Dagbjartsson, Laufey Ý. Sigurðardóttir, and Hjörtur Reynisson for help with collecting data from premature infants and Dr. Adele Seelke for helpful comments on an earlier version of the manuscript.
References
Bianchi, M. T., Cash, S. S., Mietus, J., Peng, C. K., and Thomas, R. (2010). Obstructive sleep apnea alters sleep stage transition dynamics. PLoS One 5, e11356. doi: 10.1371/journal.pone.0011356.
Bliwise, D. L. (2005). “Normal aging,” in Principles and Practice of Sleep Medicine, eds M. H. Kryger, T. Roth, and W. C. Dement (Philadelphia: Saunders), 24–39.
Blumberg, M. S., Coleman, C. M., Johnson, E. D., and Shaw, C. (2007). Developmental divergence of sleep-wake patterns in orexin knockout and wild-type mice. Eur. J. Neurosci. 25, 512–518.
Blumberg, M. S., Seelke, A. M., Lowen, S. B., and Karlsson, K. A. (2005). Dynamics of sleep-wake cyclicity in developing rats. Proc. Natl. Acad. Sci. U.S.A. 102, 14860–14864.
Borbély, A. A., and Acherman, P. (2006). “Sleep homeostasis and models of sleep regulation,” in Principles and Practice of Sleep Medicine, eds M. H. Kryger, T. Roth, and W. C. Dement (Philadelphia: Elsevier), 405–417.
Carskadon, M. A., and Dement, W. (2005). “Normal human sleep: an overview,” in Principles and Practice of Sleep Medicine, eds M. H. Kryger, T. Roth, and W. C. Dement (Philadelphia: Elsevier), 1131–1326.
Chiner, E., Signes-Costa, J., Arriero, J. M., Marco, J., Fuentes, I., and Sergado, A. (1999). Nocturnal oximetry for the diagnosis of the sleep apnoea hypopnoea syndrome: a method to reduce the number of polysomnographies? Thorax 54, 968–971.
Clancy, B., Darlington, R. B., and Finlay, B. L. (2001). Translating developmental time across mammalian species. Neuroscience 105, 7–17.
Curzi-Dascalova, L., Figueroa, J. M., Eiselt, M., Christova, E., Virassamy, A., d’Allest, A. M., Guimaraes, H., Gaultier, C., and Dehan, M. (1993). Sleep state organization in premature infants of less than 35 weeks’ gestational age. Pediatr. Res. 34, 624–628.
Curzi-Dascalova, L., Peirano, P., and Morel-Kahn, F. (1988). Development of sleep states in normal premature and full-term newborns. Dev. Psychobiol. 21, 431–444.
de Souza, L., Andersen, M. L., Smaili, S. S., Lopes, G. S., Ho, P. S., Papale, L. A., and Tufik, S. (2010). Age-related changes during a paradigm of chronic sleep restriction. Behav. Brain Res. 214, 201–205.
Dreyfus-Brisac, C. (1970). Ontogenesis of sleep in human prematures after 32 weeks of conceptional age. Dev. Psychobiol. 3, 91–121.
Gall, A. J., Joshi, B., Best, J., Florang, V. R., Doorn, J. A., and Blumberg, M. S. (2009). Developmental emergence of power-law wake behavior depends upon the functional integrity of the locus coeruleus. Sleep 32, 920–926.
Hendricks, J. C., Sehgal, A., and Pack, A. I. (2000). The need for a simple model to understand sleep. Prog. Neurobiol. 61, 339–351.
Johns, M. W. (1991). A new method for measuring daytime sleepiness: the Epworth sleepiness scale. Sleep 14, 540–545.
Karlsson, K. Æ., Kreider, J. C., and Blumberg, M. S. (2004). Hypothalamic contributions to sleep-wake cycle development. Neuroscience 123, 575–582.
Kleitman, N. (1970). Study wakefulness. Study the rest-activity cycle. Don’t just study sleep. Int. Psychiatry Clin. 7, 381–384.
Kleitman, N., and Engelman, T. G. (1951). Sleep characteristics in infants. J. Appl. Physiol. 6, 269–282.
Lo, C. C., Amaral, L. A. N., Havlin, S., Ivanov, P., Penzel, T., Peter, J. H., and Stanley, H. E. (2002). Dynamics of sleep-wake transitions during sleep. Europhys. Lett. 57, 625–631.
Lo, C. C., Chou, T., Penzel, T., Scammell, T. E., Strecker, R. E., Stanley, H. E., and Ivanov, P. (2004). Common scale-invariant patterns of sleep-wake transitions across mammalian species. Proc. Natl. Acad. Sci. U.S.A. 101, 17545–17548.
Mirmiran, M., Maas, Y. G., and Ariagno, R. L. (2003). Development of fetal and neonatal sleep and circadian rhythms. Sleep Med. Rev. 7, 321–334.
Rechtscaffen, A., and Kales, A. (Eds.). (1968). A Manual of Standardized Terminology, Techniques and Scoring System For Sleep Stages of Human Subjects. Washington, DC: Public Health Service, US Government Printing Office.
Roffwarg, H. P., Muzio, J. N., and Dement, W. C. (1966). Ontogenetic development of the human sleep-dream cycle. Science 152, 604–619.
Shaw, P. J., Cirelli, C., Greenspan, R. J., and Tononi, G. (2000). Correlates of sleep and waking in Drosophila melanogaster. Science 287, 1834–1837.
Vecchierini, M. F., Andre, M., and d’Allest, A. M. (2007). Normal EEG of premature infants born between 24 and 30 weeks gestational age: terminology, definitions and maturation aspects. Neurophysiol. Clin. 37, 311–323.
Watanbe, K. (1992). “The neonatal electroencephalogram and sleep-cycle patterns,” in The Neurophysiological Examination of the Newborn Infant, ed. J. A. Eyre (New York: Mac Keith Press), 11–47.
Wisor, J. P., Nishino, S., Sora, I., Uhl, G. H., Mignot, E., and Edgar, D. M. (2001). Dopaminergic role in stimulant-induced wakefulness. J. Neurosci. 21, 1787–1794.
Keywords: sleep, wakefulness, ontogeny, sleep–wake cycles
Citation: Arnardóttir H, Þorsteinsson H and Karlsson KÆ (2010) Dynamics of sleep–wake cyclicity at night across the human lifespan. Front. Neur. 1:156. doi: 10.3389/fneur.2010.00156
Received: 10 July 2010;
Accepted: 10 December 2010;
Published online: 24 December 2010.
Edited by:
Michael J. Decker, Georgia State University, USAReviewed by:
Rosana S. C. Alves, University of Sao Paulo, BrazilMichael J. Decker, Georgia State University, USA
Copyright: © 2010 Arnardóttir, Þorsteinsson and Karlsson. This is an open-access article subject to an exclusive license agreement between the authors and the Frontiers Research Foundation, which permits unrestricted use, distribution, and reproduction in any medium, provided the original authors and source are credited.
*Correspondence: Karl Ægir Karlsson, Biomedical Engineering, School of Science and Engineering, Reykjavik University, Menntavegur 1, 101, Reykjavik, Iceland. e-mail: karlsson@ru.is