
- 1 Department of Ophthalmology, Glostrup Hospital, Copenhagen, Denmark
- 2 Department of Ophthalmology, University Hospital Angers, Angers, France
- 3 Department of Neuro-ophthalmology, Hôpital Ophtalmique Jules Gonin, Lausanne, Switzerland
In this study, we evaluated the repeatability of pupil responses to colored light stimuli in healthy subjects using a prototype chromatic pupillometer. One eye of 10 healthy subjects was tested twice in the same day using monochromatic light exposure at two selected wavelengths (660 and 470 nm, intensity 300 cd/m2) presented continuously for 20 s. Pupil responses were recorded in real-time before, during, and after light exposure. Maximal contraction amplitude and sustained contraction amplitude were calculated. In addition, we quantified the summed pupil response during continuous light stimulation as the total area between a reference line representing baseline pupil size and the line representing actual pupil size over 20 s (area under the curve). There was no significant difference in the repeated measure compared to the first test for any of the pupil response parameters. In conclusion, we have developed a novel prototype of color pupillometer which demonstrates good repeatability in evoking and recording the pupillary response to a bright blue and red light stimulus.
Introduction
The pupil light reflex has interested clinicians and visual scientists for years because it represents an observable and objective marker of light input from the retina (Kawasaki, 1999). Automated computerized pupillometric systems have been developed in order to more accurately control the light stimulus and to record pupillary movements and have been used in various ways in a large number of medical subspecialities (Grünberger et al., 1990; McLaren et al., 2002; Rosen et al., 2002; Fliegert et al., 2005; Wilhelm et al., 2007; Kardon et al., 2009, 2011; Kawasaki et al., 2010).
More recently, quantification of pupil responses to selective wavelength (colored) light stimuli at pre-selected intensities has been described as a method to assess outer and inner retinal function (Gamlin et al., 2007; Grozdanic et al., 2007; Kardon et al., 2009, 2011). As the technique of chromatic pupillometry is still under active development, there are no commercially available models and no standardized stimulus protocols, particularly for use in the clinical setting.
The goal of this study was to develop a user-friendly colored light pupillometer which could be easily installed in a general clinic or private office and to report the test–retest repeatability of the pupil response using this prototype instrument.
Materials and Methods
Apparatus of the Prototype Pupillometer
The prototype was intended to present a controlled light stimulus at pre-selected wavelengths over a range of intensities while recording the pupillary image continuously (IdeaMedical, Copenhagen, Denmark; Figure 1). The apparatus consists of a slit lamp-based chin and headrest for the patient, a computer-controlled light stimulator, and infrared video recorder, all mounted on a portable base. The light stimulator is a metal tube designed to project the light along the visual axis of only one eye (details below). The proximal end of the stimulator has a soft telescopic cover that can be turned and moved axially and positioned in such a way to rest gently on the supraorbital ridge of the tested eye in order to eliminate scatter of light to the fellow eye. This prototype presented light stimulation to one eye while recording the pupil of the other, non-stimulated eye. Absence of light scatter over a range of intensities was verified by stimulating a patched eye and finding no evoked pupillary movement from the recorded eye.
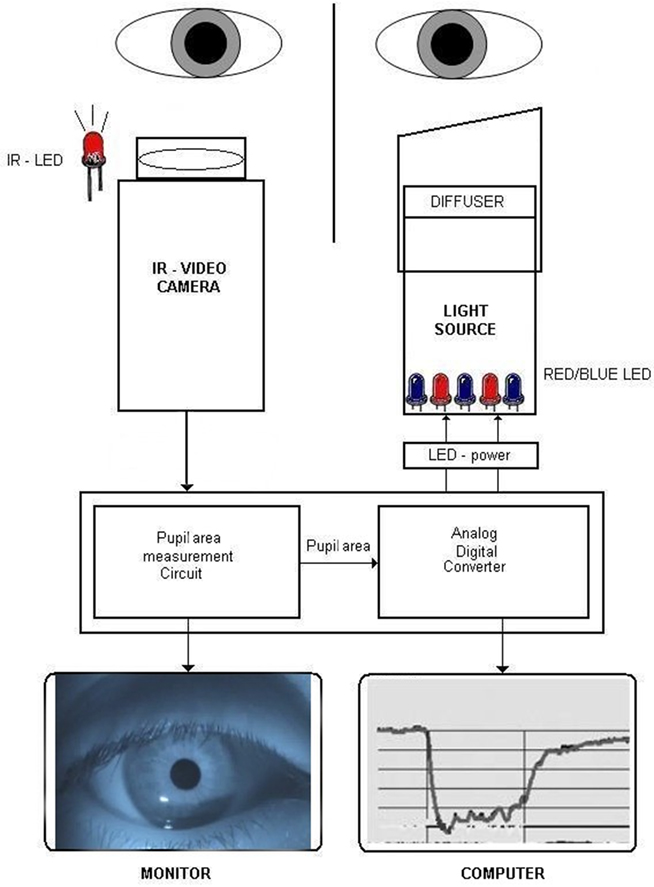
Figure 1. Diagram of the chromatic pupillometer apparatus. One eye is stimulated with colored light (blue or red) and the pupil response is recorded on the consensual eye by an infrared video camera under infrared illumination. The light stimulator is time locked to the recording system which is computer-controlled. During the pupil recording, real-time pupil movements can be observed on the LCD monitor and at the same time in graphic form on computer screen. IR, infrared; LED, light emitting diodes.
Light Stimulator
Diffuse chromatic light stimulation was obtained by means of an array of blue (470 nm) and red (660 nm) monochromatic narrow bandwidth light emitting diodes (LEDs) with 20–22 nm full width at half maximum. The diodes were mounted at the end of a metal tube with reflecting inner surfaces, illuminating a hemispheric plastic diffuser placed in front of the stimulated eye. The wavelength, intensity, and timing of the light stimulus were fully automated and controlled by a computer which was linked to the pupil recording system to mark the onset and offset of the light stimulus.
Recording of the Pupil
An infrared video camera (850 nm, 470 lines, Sony, Japan) was used to record the non-stimulated eye continuously. An external infrared light source consisting of 10 LEDs of 950 nm wavelength was placed on a flexible mount, allowing individualized positioning of the infrared light source to maximize contrast between pupil and iris. The apparatus was situated in a room with variable illumination in order to control background illumination.
The video signal was transferred to a control board which allowed the operator to visualize the real-time camera image of the pupil on an LCD screen during the whole recording procedure and to select pupil on the screen by adding an adjustable measuring window. The window allowed elimination of all dark artifacts outside its area. The real-time tracings of the pupil response were monitored on the computer screen. The video camera captured image frames by scanning horizontal lines of pixels in a video frame continuously at 25 Hz. The pupillometer had sampling rate of 20 Hz.
A built-in oscillator (electronic circuit) works simultaneously with the video camera and processes the digital video signal by generating pulses (electronic signals) at the rate of 4 MHz (4-min pulses per second) for each scanned line in an image frame. Every time the video signal was below a certain threshold (equal to dark pixels of the pupil), the pulses were sent to a digital counter (pupil area measurement circuit) where they were summed up. The counter sent a result of each frame to a digital/analog converter (Figure 1). The analog output voltage from the analog/digital converter was proportional to the area of the pupil, and the area of the pupil was converted to diameter assuming a circular pupil by custom software.
Subjects
Ten healthy subjects, seven men, and three women (mean age 25.09 years, range 24–30 years) were included in this study. None of the participants had a history of systemic or ophthalmic conditions. None of the subjects was on a medication known to influence the pupil light reflex. Clinical ophthalmologic examination including Snellen visual acuity, Ishihara color vision, swinging flash light test, visual field testing (Humphrey 24-2, San Leandro, CA, USA), and undilated fundoscopy was performed and within normal limits for all subjects. Optical coherence tomography (Stratus, Zeiss Meditec, San Jose, CA, USA) scanning of macula and retinal nerve fiber layer was added to confirm normal fundoscopic findings. Informed consent was obtained from all subjects after a full description of the procedure, in compliance with the Declaration of Helsinki. The study was approved by the local ethics committee.
Examination Procedure
For this study, the left eye was always the light stimulated eye and the right eye was the recorded eye. Subjects were tested between 10 am and noon in order to minimize any circadian influence on the pupil response (Higuchi et al., 2008). Each examination started by placing the subject in a quiet room under mesopic conditions (0.74 cd/m2) for several minutes. Prior to the first light exposure, the room was completely darkened (0 cd/m2) for 1 min during which a pre-stimulus, or baseline, pupil diameter was recorded. The blue light was then presented to the left eye for 20 s, followed by complete darkness (0 cd/m2) for 2 min (test 1 blue). After a short pause of 3 min while remaining seated quietly in mesopic light (0.74 cd/m2), the test protocol was repeated (test 2 blue). Another 3 min pause intervened and then the protocol was performed using red light (test 1 red) and repeated (test 2 red).
In this experiment, the light intensity was fixed at 300 cd/m2 for each wavelength after calibration with a spectral photometer. For safety reasons the light intensity was chosen well below the recommendations of American National Standard (ANSI-2007) and International Commission on Non-Ionizing Radiation Protection (ICNIRP) for red, blue, and infrared illumination.
Data Processing
An initial smoothing procedure was applied using a nearest neighbor approach, i.e., each data point was compared to the next point and recalculated as the mean of the start point and the three adjacent points to each side. The artifacts generated by eyelid blinks were removed by an internal customized algorithm which evaluated the recorded signal for five successive points.
Pupil Size Calculation and Main Outcome Parameters
The baseline pupil size (BS) was calculated for each test session as the mean diameter during the 10 s in darkness just before light exposure. Thereafter, the pupil size (PS) was expressed as a normalized parameter in which actual measured pupil diameter is divided by baseline size. This parameter was calculated automatically on every digital image during the entire recording. All the PS values were exported and displayed in graphic form as a function of time (Figure 2).
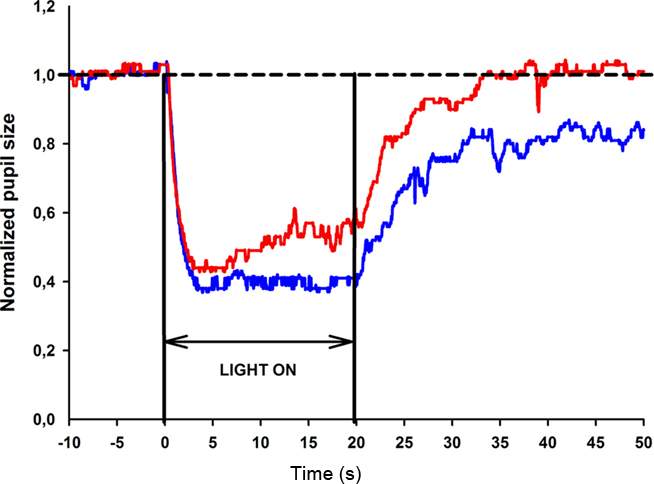
Figure 2. Pupil response curve to selected wavelength light stimulation for one healthy subject. The stimulus is a 470 or 660 nm light at 300 cd/m2 presented continuously for 20 s. The broken line represents the reference line of baseline pupil size. The normalized pupil size is displayed as a function of time for the blue light stimulus (blue line) and red light stimulus (red line). The pupil contraction is rapid, lasts approximately 2 s for both blue and red light stimuli and reaches maximum contraction at approximately the fourth second. The pupil remains contracted to blue light until the light termination (20th second), whereas pupillary escape is observed during red light stimulation.
The main outcome parameters for this study were maximal pupil contraction, sustained pupil contraction, and summed pupil response. The operational definition for each parameter is given below:
Maximal pupil contraction: This is maximal amplitude difference in PS from BS (expressed as percentage) within 5 s of light onset.
Sustained pupil contraction: This is the amplitude difference in PS from BS (expressed as percentage) at the 20th second after light onset, e.g., at the last second of the continuous light stimulus.
Summed pupil response, or area under the curve (AUC): This parameter reflects the overall pupil response to continuous light exposure. It is obtained from the pupil response curve and is the area from BS to PS between two points in time. Therefore, the area under the curve (AUC) during light exposure is the total area between a line extrapolated from BS and the graphic line representing PS between 0 and 20 s (Figure 3).
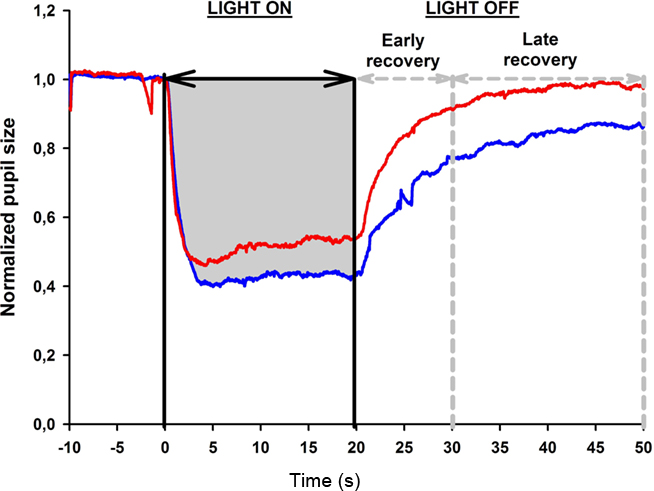
Figure 3. Determination of the area under the curve (AUC) from the pupil response curve. The pupil size is plotted as a function of time under red and blue light stimulus conditions (red and blue lines, respectively, see also Figure 2). Pupil recording begins 10 s before light onset which is marked as time 0. The light stimulation is continuous for 20 s; after light offset, the pupil redilation is recorded for 30 s in darkness (time 20–50 s) and divided into two time windows: early and late pupil recovery. In this example, the AUC for the pupil response during 20 s of blue light stimulation is shown in gray.
Three AUCs were calculated: AUC during the light exposure (0–20 s), AUC during the period immediately after light termination, defined as 0–10 s after light offset and called the early redilation phase, and AUC during late phase of pupillary redilation, defined as between 10 and 30 s after light termination, i.e., 30–50 s from the start of the light onset (Figure 3).
Statistical Analysis
Statistical analysis system (SAS) software (SAS version 9.1, SAS Institute Inc., Cary, NC, USA) was used for statistical analysis. Mean differences of pupil responses between test 1 and test 2 and between blue and red light conditions were compared using a 2-tailed paired t-test (α = 0.05), since data appeared to be normally distributed, but due to the limited sample size, main results were also confirmed with non-parametric tests (a Wilcoxon signed rank sum test). Repeatability of the outcome parameters between the test 1 and the test 2 for the same light stimulus was calculated as the within-subject difference in percent of the mean (diff%), i.e., (test 1 − test 2)/mean of test 1 and test 2. The correlation between test 1 and test 2 was reported as the intra-class correlation coefficient (ICC) with its 95% confidence interval. Assuming the measurement errors were distributed independently and identically as N (0;σε), the ICC was calculated as followed:  where
where  is the variance between subjects and
  is the average of the within-subject variance (Lachin, 2004; Lu and Shara, 2007; Bartlett and Frost, 2008). The ICC measures reliability, i.e., reproducibility of the measurement randomly repeated on the same subject.
Results
The testing procedure was well tolerated. There were no subjective complaints or reported side-effects from any of the subjects during or after testing. In all subjects, the maximal pupil contraction amplitude was reached within 5 s after light onset (test session 1: 60% for blue light and 55% for red light). The maximal contraction amplitude was always greater to blue compared to red light stimulation and this difference was statistically significant (p < 0.05). To continuous blue light stimulation, the pupil maintained a small size during the entire 20 s of light exposure, and the mean sustained contraction amplitude for test 1 was 57%. In contrast, the pupil showed partial redilation during continuous red light stimulation and the mean sustained contraction amplitude was 46% for test 1. An example of the pupillary light responses to blue and red light is shown for a single subject in Figure 2.
For the first test session, the AUC during 20 s of continuous light exposure was 10.8 for blue light and 9.3 for red light, as shown in Figure 3, and this difference was significant (p < 0.05). After termination of the red light, the pupil redilation was rapid and returned to its baseline size after approximately 20 s after light offset. The pupil recovered more slowly after blue light stimulation, and in all subjects, the pupil failed to return to its baseline size by 30 s after light offset.
For all outcome measures, the values obtained during the second test session were not significantly different compared to those from the first test session (p > 0.05). The mean values and ICC are shown in Table 1.
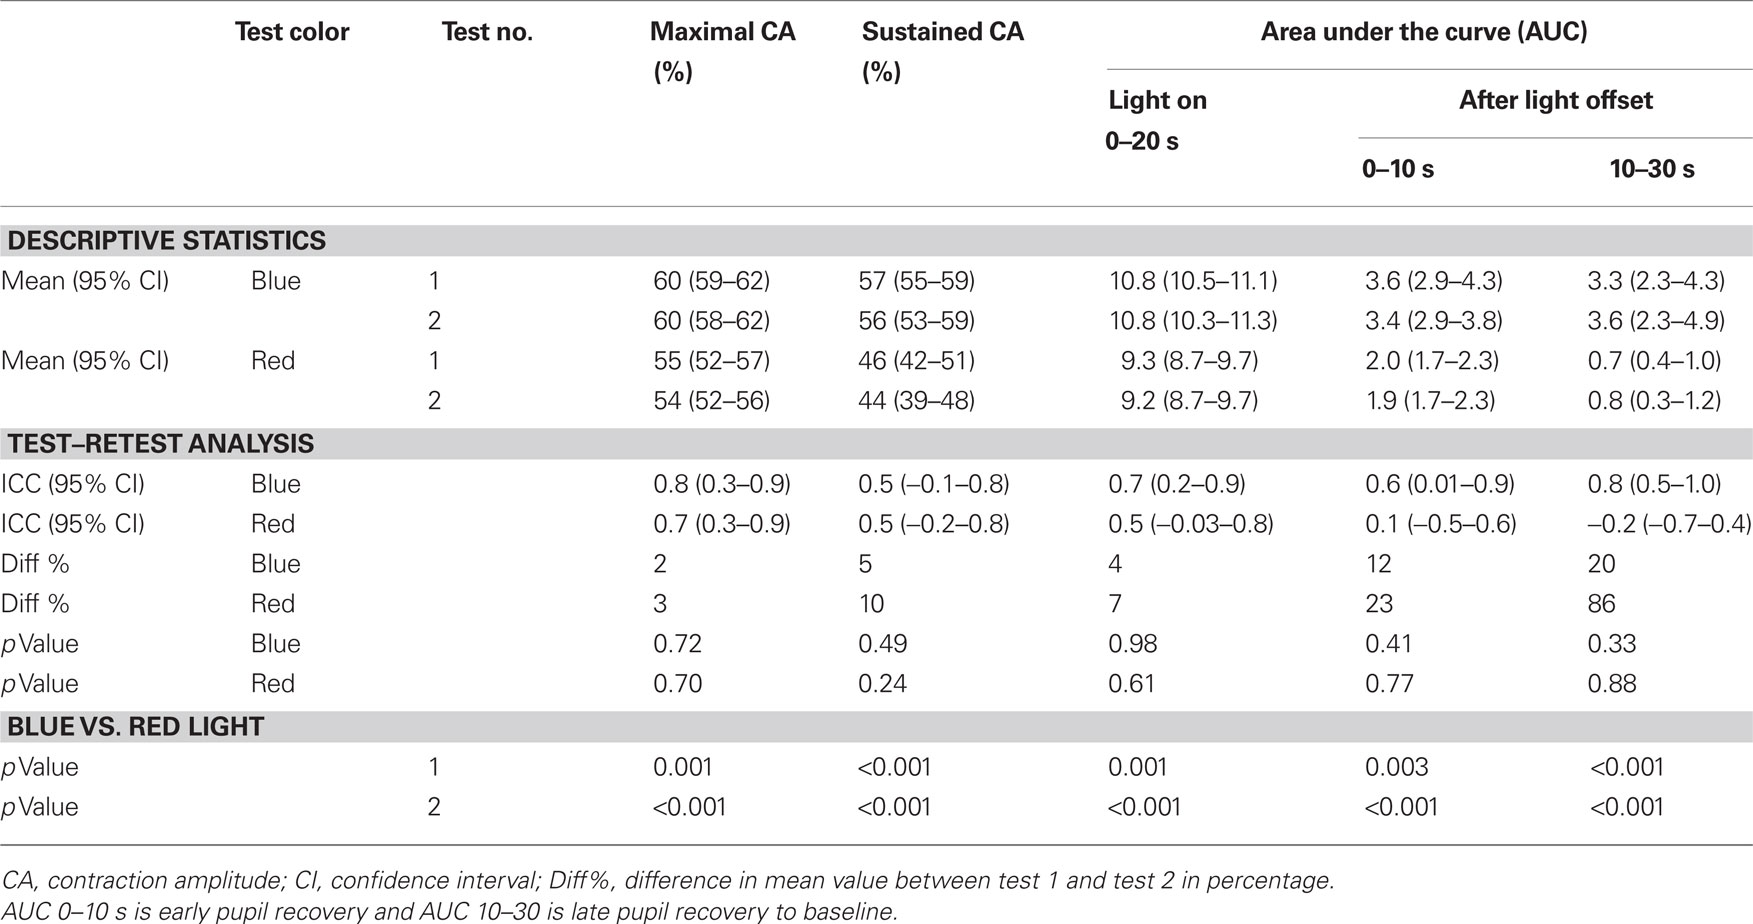
Table 1. Summary of pupil response parameters to blue and red light stimulation obtained in two separate test sessions and the intra-class correlation coefficients (IiCC).
Discussion
Interest in using colored light stimuli for the pupil light reflex has emerged because the discovery of a subgroup of intrinsically photosensitive retinal ganglion (also known as melanopsin ganglion cells) which has modified previous concepts about the neural basis of the pupil light reflex (Provencio et al., 1998). These melanopsin ganglion cells are the main source of afferent pupillomotor signal driving the pupil light reflex (Guler et al., 2008). Retinal input to this neural signal derives from both intrinsic melanopsin-mediated phototransduction and extrinsic trans-synaptic influence from rod and cone activity (Wong et al., 2007; Bailes and Lucas, 2010). These three photoreceptive elements (melanopsin, rods, cones) have functional differences in their sensitivity and response to light which can be emphasized to bias the afferent pupillomotor signal in favor of one element over the others (Dacey et al., 2005; Kardon et al., 2009). Thus, chromatic pupillometry may be useful as a non-invasive method to evaluate rod and cone function as well as retinal ganglion cell integrity. In this regard, we have designed and constructed a prototype pupillometer which allows stimulation with selective wavelength light under controlled stimulus conditions. The apparatus is portable, simple to use, and comfortable for the patient. The testing procedure is non-invasive and easy to learn without specialized training.
We examined the pupil response to a continuous light stimulus at two different wavelengths at fixed high intensity in 10 healthy subjects with normal eyes. No complications were encountered. We measured several different parameters of the pupil response and found no significant test–retest differences. We did note that the test–retest difference increased during the pupillary redilation phase (AUC for 0–10 and 10–30 s after light termination) and the intra-class coefficient decreased for this outcome measure especially for red light condition, but this difference was not statistically significant. While the increased test–retest difference of this parameter may be due to a true fluctuation in the neural signal that modulates pupillary redilation, further studies using a large sample, and perhaps other stimulus protocol are needed for clarification of this point.
In conclusion, this study has shown that the repeatability of the pupil recordings and the calculations of pupil response at various times during the recording were stable using this prototype pupillometer. As chromatic pupillometry may find increasing applicability in the diagnosis and monitoring of patients with neuroretinal visual loss, our study suggests that testing and quantifying the colored light pupil response is both practical and reliable.
Conflict of Interest Statement
The authors declare that the research was conducted in the absence of any commercial or financial relationships that could be construed as a potential conflict of interest.
Acknowledgments
The authors thank inventor Palle R. Jensen for constructing the color pupillometer, senior scientist Ph.D. Birgitte Thestrup, and associate professor Beata Kardynal (Technical University of Denmark, Department of Photonics Engineering) for technical assistance of safety issues. The project was supported by The VELUX Foundation, The John and Birthe Meyer Foundation, The University of Copenhagen (SUNDs Institut stipendium), The Danish Eye Health Society (Øjenforeningen Værn om Synet), The Danish Eye Research Foundation (Øjenfonden), Danish Research Council., Open Eyes Foundation, and Loterie Romande.
Financial Disclosure
Aki Kawasaki has received compensation from Bayer S.p.A. for work as consultant. None of the other authors have any financial disclosures.
References
Bailes, H. J., and Lucas, R. J. (2010). Melanopsin and inner retinal photoreception. Cell. Mol. Life Sci. 67, 99–111.
Bartlett, J. W., and Frost, C. (2008). Reliability, repeatability and reproducibility: analysis of measurement errors in continuous variables. Ultrasound Obstet. Gynecol. 31, 466–475.
Dacey, D. M., Liao, H. W., Peterson, B. B., Robinson, F. R., Smith, V. C., Pokorny, J., Yau, K. W., and Gamlin, P. D. (2005). Melanopsin-expressing ganglion cells in primate retina signal colour and irradiance and project to the LGN. Nature 433, 749–754.
Fliegert, F., Kurth, B., and Göhler, K. (2005). The effects of tramadol on static and dynamic pupillometry in healthy subjects-the relationship between pharmacodynamics, pharmacokinetics and CYP2D6 metaboliser status. Eur. J. Clin. Pharmacol. 61, 257–266.
Gamlin, P. D., McDougal, D. H., Pokorny, J., Smith, V. C., Yau, K. W., and Dacey, D. M. (2007). Human and macaque pupil responses driven by melanopsin-containing retinal ganglion cells. Vision Res. 47, 946–954.
Grozdanic, S. D., Matic, M., Sakaguchi, D. S., and Kardon, R. H. (2007). Evaluation of retinal status using chromatic pupil light reflex activity in healthy and diseased canine eyes. Invest. Ophthalmol. Vis. Sci. 48, 5178–5183.
Grünberger, J., Linzmayer, L., Fodor, G., Presslich, O., Praitner, M., and Loimer, N. (1990). Static and dynamic pupillometry for determination of the course of gradual detoxification of opiate-addicted patients. Eur. Arch. Psychiatry Clin. Neurosci. 240, 109–112.
Guler, A. D., Ecker, J. L., Lall, G. S., Haq, S., Altimus, C. M., Liao, H. W., Barnard, A. R., Cahill, H., Badea, T. C., Zhao, H., Hankins, M. W., Berson, D. M., Lucas, R. J., Yau, K. W., and Hattar, S. (2008). Melanopsin cell are the principal conduits for rod-cone input to non-image-forming vision. Nature 453, 102–105.
Higuchi, S., Ishibashi, K., Aritake, S., Enomoto, M., Hida, A., Tamura, M., Kozaki, T., Motohashi, Y., and Mishima, K. (2008). Inter-individual difference in pupil size correlates to suppression of melatonin by exposure to light. Neurosci. Lett. 440, 23–26.
Kardon, R., Anderson, S. C., Damarjian, T. G., Grace, E. M., Stone, E., and Kawasaki, A. (2009). Chromatic pupil responses: preferential activation of the melanopsin-mediated versus outer photoreceptor-mediated pupil light reflex. Ophthalmology 116, 1564–1573.
Kardon, R., Anderson, S. C., Damarjian, T. G., Grace, E. M., Stone, E., and Kawasaki, A. (2011). Chromatic pupillometry in patients with retinitis pigmentosa. Ophthalmology 118, 376–381.
Kawasaki, A. (1999). Physiology, assessment, and disorders of the pupil. Curr. Opin. Ophthalmol. 10, 394–400.
Kawasaki, A., Herbst, K., Sander, B., and Milea, D. (2010). Selective wavelength pupillometry in Leber hereditary optic neuropathy. Clin. Experiment. Ophthalmol. 38, 322–324.
Lachin, J. M. (2004). The role of measurement reliability in clinical trials. Clin. Trials 1, 553–566.
Lu, L., and Shara, N. M. (2007). Reliability Analysis: Calculate and Compare Intra-class Correlation Coefficients (ICC) in SAS. Northeast SAS Users Group, 14.
McLaren, J. W., Hauri, P. J., Lin, S. C., and Harris, C. D. (2002). Pupillometry in clinically sleepy patients. Sleep Med. 3, 347–352.
Provencio, I., Jiang, G., De Grip, W. J., Hayes, W. P., and Rollag, M. D. (1998). Melanopsin: an opsin in melanophores, brain, and eye. Proc. Natl. Acad. Sci. U.S.A. 95, 340–345.
Rosen, E. S., Gore, C. L., Taylor, D., Chitkara, D., Howes, F., and Kowalewski, E. (2002). Use of a digital infrared pupillometer to assess patient suitability for refractive surgery. J. Cataract Refract. Surg. 28, 1433–1438.
Wilhelm, H., Peters, T., Lüdtke, H., and Wilhelm, B. (2007). The prevalence of relative afferent pupillary defects in normal subjects. J. Neuroophthalmol. 27, 263–267.
Keywords: pupil light reflex, pupillometry, repeatability, melanopsin, retinal ganglion cells
Citation: Herbst K, Sander B, Milea D, Lund-Andersen H and Kawasaki A (2011) Test–retest repeatability of the pupil light response to blue and red light stimuli in normal human eyes using a novel pupillometer. Front. Neur. 2:10. doi: 10.3389/fneur.2011.00010
Received: 10 December 2010;
Paper pending published: 10 January 2011;
Accepted: 08 February 2011;
Published online: 22 February 2011.
Edited by:
Fion D. Bremner, University College London, UKReviewed by:
Fion D. Bremner, University College London, UKHelmut Wilhelm, University Eye Hospital, Germany
Copyright: © 2011 Herbst, Sander, Milea, Lund-Andersen and Kawasaki. This is an open-access article subject to an exclusive license agreement between the authors and Frontiers Media SA, which permits unrestricted use, distribution, and reproduction in any medium, provided the original authors and source are credited.
*Correspondence: Aki Kawasaki, Hôpital Ophtalmique Jules Gonin, Avenue de France 15, Lausanne CH 1004, Switzerland. e-mail: aki.kawasaki@fa2.ch