 Eva Wuerfel,†‡ Maureen Smyth,†‡ Jason M. Millward Eyk Schellenberger Jana Glumm Timour Prozorovski,†
Orhan Aktas,†
Ulf Schulze-Topphoff,†
Jörg Schnorr Susanne Wagner Matthias Taupitz Carmen Infante-Duarte,§ Jens Wuerfel§*
Eva Wuerfel,†‡ Maureen Smyth,†‡ Jason M. Millward Eyk Schellenberger Jana Glumm Timour Prozorovski,†
Orhan Aktas,†
Ulf Schulze-Topphoff,†
Jörg Schnorr Susanne Wagner Matthias Taupitz Carmen Infante-Duarte,§ Jens Wuerfel§*- Charité – University Medicine Berlin, Berlin, Germany
We present a novel highly efficient protocol to magnetically label T cells applying electrostatically stabilized very small superparamagnetic iron oxide particles (VSOP). Our long-term aim is to use magnetic resonance imaging (MRI) to investigate T cell dynamics in vivo during the course of neuroinflammatory disorders such as experimental autoimmune encephalomyelitis (EAE), an animal model of multiple sclerosis. Encephalitogenic T cells were co-incubated with VSOP, or with protamine-complexed VSOP (VProt), respectively, at different conditions, optimizing concentrations and incubation times. Labeling efficacy was determined by atomic absorption spectrometry as well as histologically, and evaluated on a 7 T MR system. Furthermore, we investigated possible alterations of T cell physiology caused by the labeling procedure. T cell co-incubation with VSOP resulted in an efficient cellular iron uptake. T2 times of labeled cells dropped significantly, resulting in prominent hypointensity on T2*-weighted scans. Optimal labeling efficacy was achieved by VProt (1 mM Fe/ml, 8 h incubation; T2 time shortening of ∼80% compared to untreated cells). Although VSOP promoted T cell proliferation and altered the ratio of T cell subpopulations toward a CD4+ phenotype, no effects on CD4 T cell proliferation or phenotypic stability were observed by labeling in vitro differentiated Th17 cells with VProt. Yet, high concentrations of intracellular iron oxide might induce alterations in T cell function, which should be considered in cell tagging studies. Moreover, we demonstrated that labeling of encephalitogenic T cells did not affect pathogenicity; labeled T cells were still capable of inducing EAE in susceptible recipient mice.
Introduction
T cells are key players in inflammatory and degenerative disorders of the central nervous system (CNS), including frequent illnesses such as Alzheimer’s disease (Weiner and Frenkel, 2006) or stroke (Hendrix and Nitsch, 2007), apart from their well described implication in infectious and autoimmune diseases. In multiple sclerosis (MS), encephalitogenic T cells are suspected to trigger demyelination and neuronal damage resulting in persisting disability in patients (Zipp and Aktas, 2006). T cells were shown to directly induce neuronal cell death in murine brain slices (Aktas et al., 2005). In order to gain further insight into the pathogenesis of T cell mediated diseases, a sensitive method to monitor lymphocyte trafficking in vivo would be of utmost interest. Novel imaging methods visualizing cells have recently emerged or undergone refinement. Among these, magnetic resonance imaging (MRI) has held its ground as an elaborate in vivo tool to non-invasively observe temporal and spatial migration of labeled cells (Modo et al., 2005; Arbab et al., 2006; Liu and Frank, 2008). A prerequisite for MR cell tracking is the efficient labeling of cells by a contrast agent that is able to evoke a high cell-to-tissue contrast. For this purpose, magnetic nanoparticles have become well appreciated. Magnetic particles cause strong susceptibility effects on T2- and T2*-weighted sequences, and are generally well tolerated by labeled cells and the organisms under investigation (Rogers et al., 2006). However, in contrast to phagocytic cells such as macrophages, that are easily labeled in vitro and in vivo due to their natural disposition to internalize particles, tagging of T lymphocytes has remained a particular challenge. Only few studies to data have achieved successful T cell labeling in vivo (Yeh et al., 1995; Dodd et al., 2001; Kircher et al., 2003; Anderson et al., 2004; Pirko et al., 2004; Billotey et al., 2005; Daldrup-Link et al., 2005; Hu et al., 2005; Smirnov et al., 2008). So far, the reluctance of T cells to incorporate magnetic nanoparticles has remained a major obstacle to MR investigations.
We here developed a novel T lymphocyte labeling protocol applying very small superparamagnetic iron oxide particles (VSOP). In contrast to commonly used polymer-coated magnetic nanoparticles, VSOP are extremely small, but inherit superior labeling properties due to an electrostatically stabilized citrate coating (Fleige et al., 2002). VSOP have already been successfully applied for the visualization of neuronal precursor cells (Focke et al., 2008), mesenchymal stem cells (Heymer et al., 2008), macrophages in a murine ischemia model (Stroh et al., 2005), as well as macrophages and activated microglia in a mouse model of MS (Wuerfel et al., 2007). Considering the limited phagocytic ability of T lymphocytes, we compared VSOP co-incubation with cell transfection applying protamine-complexed VSOP (VProt). Protamine is a naturally occurring peptide with membrane translocating properties (Reynolds et al., 2005); it is FDA approved as a routine antidote to heparin-induced blood anticoagulation. In the past, no modification of cell viability, proliferation, or differentiation has been noted when protamine was applied as a transfection agent (Arbab et al., 2004, 2005; Suzuki et al., 2007). Our protocol has been established on freshly isolated encephalitogenic murine T cells, which are commonly used to induce experimental autoimmune encephalomyelitis (EAE), via adoptive transfer (Wuerfel et al., 2007). The study was specifically designed to investigate the potential impact of the labeling procedure on T cell functionality as well as to optimize the labeling efficacy for future transfer EAE in vivo experiments.
Materials and Methods
Magnetic Nanoparticles for Cell Labeling
We applied VSOP (VSOP-C200, Ferropharm GmbH, Teltow, Germany) for T cell labeling with magnetic nanoparticles. VSOP are electrostatically stabilized nanoparticles coated with citrate monomers comprising a hydrodynamic diameter of 7.6 ± 2.1 nm and yielding a negative surface charge with a zeta potential of −45.6 ± 30.7 mV.
For the preparation of VProt, VSOP were decorated with protamine (protamine from salmon, Sigma-Aldrich, Munich, Germany) by non-covalent electrostatic attraction. Protamine, a peptide of about 32 amino acids, is positively charged due to 22 arginines. The positive surface charge of VProt keeps the particles in suspension. VSOP (25 ml; 6.6 mM Fe, pH 7.4) was rapidly mixed with 25 ml protamine (0.5 mM, pH 7.4). Thereafter, VProt was dialyzed for 24 h in a Spectra/Por-7 membrane against water (molecular weight cut-off 15000, Spectrum Laboratories, Eindhoven, The Netherlands). The hydrodynamic diameter and the zeta potential of VProt were determined by measuring dynamic light scattering with a Zetasizer nano ZS (Malvern Instruments, Worcestershire, UK) in water according to the manufacturers instructions. Compared to the parent material VSOP, the hydrodynamic size was substantially increased to 42 ± 16 nm and the surface charge was reversed (zeta potential +57.9 ± 6.78 mV). The iron concentration was determined spectrophotometrically (Shen et al., 1993).
Cell Culture and Labeling
T cells were obtained from 6- to 8-week-old female SJL mice (Charles River, Sulzfeld, Germany), housed in a pathogen free-environment. All experiments were approved by the by the local animal welfare committee (LAGeSo Berlin, Germany), and conformed to the European Communities Council Directive (86/609/EEC). Mice were immunized subcutaneously with 200 μg PLP 139–1051 (Pepceuticals, Leicester, UK), 600 μg Mycobacterium tuberculosis H37Ra (Difco Laboratories Detroit, MI, USA) emulsified in 100 μl Complete Freund’s adjuvant (CFA, Difco Laboratories Detroit, MI, USA) and 100 μl phosphate buffered saline (PBS). Mice were sacrificed 10 days after immunization, and paraaortal, popliteal as well as inguinal lymph nodes were extracted. For cell isolation, tissue was macerated through an 80-μm mesh (BD Falcon, Heidelberg, Germany). Lymph node cells were re-stimulated for 4 days with 12.5 μg PLP in RPMI 1640 cell culture medium (Sigma-Aldrich, Munich, Germany) supplemented with 10% fetal calf serum, 1% glutamine, 1% penicillin/streptomycin, and 1% Hepes buffer at 37°C. Thereafter, the fraction of CD3+ T cells was enriched (purity 90–95%) using a negative magnetic selection kit for T cells (Dynal Invitrogen, Oslo, Norway). Subsequently, T cells were plated at a concentration of 2 × 10⁶ cells/ml in cell culture medium with 100 U/ml IL-2 (Invitrogen, Karlsruhe, Germany) and left for 1 h at 37°C to recover. Optimal settings for cell labeling by co-incubation with VSOP were determined varying the incubation time (1 h, 4 h, 8 h, 12 h, 24 h, 2 days, 4 days) as well as the concentrations (0.5, 1, 3, 6, 9 mM Fe/ml), based on protocols previously approved for macrophage labeling (Fleige et al., 2002). Equivalent dose finding experiments were carried out applying VProt (0.001, 0.01, 0.05, 0.1, 1, 3 mM Fe/ml). After co-incubation, cells were thoroughly washed three times with PBS to remove excessive contrast agent. Cell viability was determined in a trypan-blue exclusion assay using a Neubauer counting chamber.
Assessment of Iron Uptake
Intracellular iron uptake was assessed by atomic absorption spectroscopy (AAS). For cell lysis, 6 × 10⁵ cells were incubated with 50 μl HCl 32% until complete dissolution and then topped up to 3 ml with distilled water. Samples could subsequently be measured by an atom absorption spectrometer (Unicam 969; Nicolet Instruments GmbH, Offenbach, Germany).
Additionally, nuclear magnetic resonance (NMR) transverse relaxation time (T2) was determined by relaxometry (Bruker Minispec MQ 40, 0.94 T, Karlsruhe, Germany), as previously described (Stroh et al., 2004, 2006). A suspension of 2 × 10⁶ cells in 1 ml cell culture medium supplemented with 5% fetal calf serum, 1% penicillin/streptomycin, and 1% Hepes buffer, was preheated to 40°C before measurement to avoid temperature equilibration artifacts.
In all in vitro MRI experiments, labeled and thoroughly washed T cells were resuspended in preheated 1% agarose in distilled water, and transferred to 500 μl tubes, which we embedded in agarose-prefilled 50 ml tubes. These gel phantoms were subsequently imaged applying a T2*-weighted sequence (GEFI, TR 1200 ms, TE 5.6 ms, 6 slices, 1 mm slice thickness, matrix 4 × 3.06 cm) on a 7 T small animal MRI Scanner (Pharmascan 70/16AS, Bruker BioSpin, Ettlingen, Germany). We included control samples of unsorted lymph node cells in all measurements to exclude a contamination of magnetic beads deriving from the cell separation kit.
For microscopy, cells were incubated on Poly-D-Lysine (BD Biosciences, Heidelberg, Germany) coated object slides for 2 h, washed three times with PBS, and fixed for 10 min in 4% paraformaldehyde in PBS. Prussian Blue staining was performed on the slides according to Pearl’s method (Perl and Good, 1992) for visualization of the iron oxide particles. Cells were examined by epifluorescence microscopy and digitally photographed (Olympus BX-51, Hamburg, Germany). Images were assembled using Adobe Photoshop (Adobe Systems, San Jose, CA, USA).
3[H]thymidine Incorporation Assay
Antigen-specific proliferation was assessed by a 3[H]thymidine incorporation assay. Briefly, PLP-primed CD3+-enriched T cells were incubated with irradiated splenocytes in cell culture medium in a 96-well plate (BD Falcon, Heidelberg, Germany) at concentrations of 50000 T cells and 150000 splenocytes per well. Proliferation was induced by 12.5 or 25 μg PLP added to the medium and compared to the untreated condition. Each condition was repeated with different VSOP concentrations (1, 3, 6, 9 mM Fe/ml). After 48 h, 0.5 μCi 3[H]thymidine (Amersham, Buckinghamshire, UK) was added to the culture, and the incorporation into the T cell DNA measured with a beta counter (Wallac, Freiburg, Germany) 18 h later.
Flow Cytometry
Cell death, activation as well as differentiation markers were investigated by flow cytometric analysis. After the labeling procedure, T cells were incubated with CD16/CD32 to avoid unspecific antibody binding and stained afterward with anti-CD3-FITC, anti-CD4-PE and anti-CD8-FITC antibodies. After staining, all samples were thoroughly washed, and analyzed by flow cytometry (FACSCalibur, BD Biosciences, Heidelberg, Germany). Cell viability was determined by adding 0.1 mg propidium iodide/ml to the sample immediately before acquisition.
Generation and Assessment of Proliferation and Cytokine Production of Differentiated IL-17 Producing T Cells
Spleen and lymph nodes were collected from TCR transgenic mice (2D2) specific for MOG 35–55, and a CD4 naive MACS separation was performed to generate Th17-polarized T cells. T cells were co-cultured in a 1:4 ratio with CD90-depleted, irradiated antigen presenting cells, taken from wild-type C57Bl/6 mice in the presence of TGF-β (3 ng/ml), IL-23 (20 ng/ml), and IL-6 (20 ng/ml) all from R&D. IL-2 was added to the cultures at day 3. After 7 days, the T cells were re-stimulated for 72 h at 37°C in 5% CO2 with cytokines in the presence of Vprot (0.3 or 1 mM) or an equivalent amount of protamine alone and carboxyfluorescein succinimidyl ester (CFSE, 2.5 μM) to assess proliferation. Subsequently, the cells were stained with anti-CD4 antibodies (BD, Heidelberg, Germany). Additionally, to monitor phenotypic stability, a cell fraction was fixed with 2% formaldehyde for 20 min and then permeabilized with saponin (0.5%; Sigma) for intracellular staining with anti-IL-17 antibodies (eBioscience, Frankfurt, Germany) as described previously (Infante-Duarte et al., 2000). The proportion of proliferating CD4-positive cells and IL-17-producing cells was analyzed by flow cytometry.
Adoptive Transfer EAE
For adoptive transfer EAE, PLP-specific T cells obtained from PLP immunized mice were cultured in the presence of VSOP or VProt for 4 days as described in 2.2. To induce EAE, 8–12 × 106 T-cell blasts in 100 μl PBS were injected intraperitoneally into syngenic recipients (Wuerfel et al., 2010). Mice were weighed daily and scored for neurological deficits as previously described (Wuerfel et al., 2010): 0, unaffected; 1, tail weakness or impaired righting reflex; 2, paraparesis; 3, paraplegia; 4, paraplegia with forelimb weakness or complete paralysis; score >3, to be sacrificed.
Data Analysis
Oneway/univariate ANOVA with post hoc Scheffé analysis was performed to determine significant differences (p < 0.05) between VSOP, VProt and negative controls. AAS measurements were run in triplicate. The relaxometry data presented in this study were pooled from three different experiments, each run in duplicate, except for the time course experiment in Figure 2C, which was conducted only once in duplicate, and hence excluded from further statistical analysis. Flow cytometry data were obtained from four independent experiments. The proliferation assay was conducted in quadruplicate. Data in the figures present mean values and standard deviation.
Results
T Cell Labeling by Co-Incubation with VSOP
First we determined the optimal concentration of VSOP and the best incubation time for labeling T cells. Efficient T cell labeling was achieved after 24 h co-incubation with VSOP at concentrations approved for macrophage labeling (1–9 mM Fe/ml) as reflected by Prussian Blue staining in Figure 1A. The vesicularly shaped distribution of particles suggested an accumulation within cytosolic endosomes. The amount of intracellular VSOP augmented with increasing concentrations of VSOP during co-incubation (Figure 1A1–3). However, at concentrations exceeding 6 mM Fe/ml, unspecific adherence of VSOP to the cellular surface became more prominent (Figure 1A3).
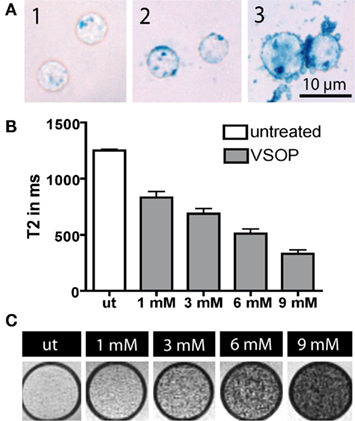
Figure 1. T cell labeling efficiency and magnetic nanoparticle distribution was evaluated microscopically by Prussian Blue staining. Higher labeling concentrations resulted in an augmentation of incorporated VSOP into cytoplasmatic endosomes [(A1), 3 mM Fe/ml; (A2), 6 mM Fe/ml; (A3), 9 mM Fe/ml]. At a concentration of 9 mM Fe/ml, VSOP aggregated and non-specific adherence to the cell surface occurred (A3). We assessed NMR transverse relaxation times (T2) as a measure of the T cell labeling efficacy by relaxometry (B). T2 times decreased significantly (p < 0.001) and in a concentration-dependent manner after incubation of T cells with VSOP for 20 h. Agarose phantoms containing labeled T cells at a concentration of 1000 cells/μl, imaged at 7 T, are presented at different labeling concentrations (ut, untreated; 1–9 mM Fe/ml) into (C).
Relaxometry measurements revealed a sequential shortening of T2 times by increasing VSOP concentrations during incubation. We observed a decrease of T2 times from 832.4 ms at 1 mM Fe/ml to 329.7 ms at 9 mM Fe/ml (Figure 1B). The ANOVA group difference between VSOP treated and unlabeled control cells was significant (p < 0.001). Post hoc Scheffé testing revealed a significant difference already at lowest VSOP concentrations at 1 mM Fe/ml VSOP (p < 0.001). Accordingly, the iron content per T cell determined by atomic absorption spectrometry increased with augmenting VSOP labeling concentrations between 1 and 9 mM Fe/ml. After 24 h of co-incubation, maximal uptake was reached for 9 mM Fe/ml VSOP, resulting in 34.92 pg iron per T cell (Table 1A). T cell phantoms were imaged on a 7 T rodent scanner. At a concentration of 1000 cells/μl agarose, T cells were clearly distinguishable as hypointense spots on T2*-weighted images (Figure 1C).
Table 1. Iron uptake into T cells after simple incubation with VSOP quantified with atomic absorption spectroscopy in probes containing 600000 cells.
Applying a moderate concentration of 3 mM Fe/ml during the labeling procedure, we assessed the time dependency of VSOP uptake. The amount of iron per T cell increased with the extension of incubation time, reaching a maximal concentration of 10.12 pg Fe/cell after 48 h (Table 1B).
Improved T Cell Labeling Capacity of VProt
Considering the limited phagocytic ability of T lymphocytes, we compared VSOP co-incubation with cell transfection applying protamine-complexed VProt. Protamine is a naturally occurring peptide with membrane translocating properties (Reynolds et al., 2005). We investigated whether complexation of VProt prior to the actual labeling procedure would improve the uptake of magnetic nanoparticles into the cells. Incubation of T cells with VProt resulted in significantly reduced incubation times and labeling concentrations for efficient labeling. In histology, Prussian Blue stained T cells incubated with VProt were more homogenously labeled (Figure 2A) compared to cells incubated with simple VSOP (Figure 1A). The distribution seemed less scattered within the cells but uniformly spread throughout the cytoplasm, potentially due to an additional uptake mechanism independent from the accumulation in endosomes. Labeling was visibly increased by prolongation of the incubation times (Figure 2A1–3). However, after 12 h of labeling, VProt also aggregated to the cell surface (Figure 2A3). Sufficient labeling was feasible at concentrations as low as 0.5 mM Fe/ml at incubation times of 12 h. T2 times dropped to 125.2 ms applying 1 mM Fe/ml VProt, considerably exceeding the T2 shortening achieved by VSOP (Figure 2B; p < 0.001, ANOVA). Investigating the kinetics of VProt and VSOP uptake, we applied a moderate concentration of 1 mM Fe/ml for both contrast agents. In T cells, VSOP incorporation increased steadily with time. In contrast, VProt-incubated T cells achieved high T2 time reductions even in the early phase. After 8 h of incubation, T2 time reduction reached a peak, widely exceeding the levels of VSOP treated cells (Figure 2C). Imaging of VProt labeled cells suspended in agarose using a 7 T rodent scanner confirmed the high labeling efficacy detected by microscopy. Compared to bare VSOP, T cells incubated with VProt at concentrations as low as 0.5–1 mM Fe/ml caused a strong hypointensity on T2*-weighted images (Figure 2D).
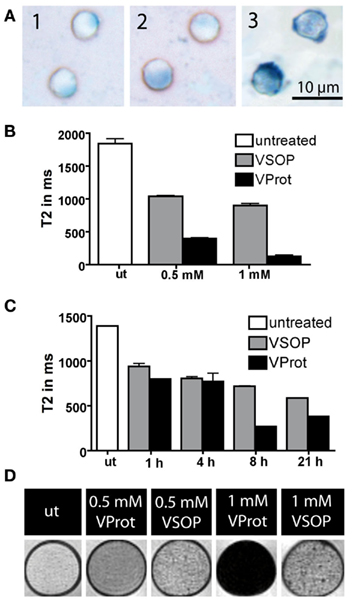
Figure 2. In T cells, diffusely distributed intracellular magnetic nanoparticles are present after labeling with 1 mM Fe/ml VProt for 1 h (A1), 4 h (A2), and 10 h (A3). NMR transverse relaxation time (T2) after T cell labeling was estimated by relaxometry. Comparing the labeling efficacy of VSOP to that of protamine-complexed VSOP (VProt), we found that after 10 h of incubation, T2 times were significantly reduced (p < 0.001) in VProt samples already at low concentrations (B). In a longitudinal experiment we noted a continuous reduction of T2 times at a concentration of 1 mM Fe/ml over 21 h in VSOP-labeled T cells. In contrast, VProt labeled T cells reached a maximum already after 8 h of incubation (C). In agarose phantoms containing T cells at a concentration of 1000 cells/μl, imaged on a 7 T scanner, hypointensities caused by VProt labeled cells in T2*-weighted images were more homogenously distributed and produced pronounced signal extinctions even at low labeling concentrations (0.5–1 mM Fe/ml) compared to VSOP-labeled T cells (D). Untreated T cells (ut) caused only discrete signal hypointensities.
Effects of VSOP and VProt on the Viability of Encephalitogenic T Cells
Incubation with VSOP did not suppress T cell proliferation measured by a 3[H]thymidine assay. VSOP-labeled CD3+ cells showed increased proliferation rates in the presence of specific antigen (PLP), equivalent to control cells, in a concentration-dependent manner (Figure 3). Scheffé testing indicated a significantly increased proliferation capacity at low VSOP concentrations (1 mM Fe/ml) compared to untreated cells (p < 0.01), but not at higher VSOP concentrations (3–9 mM Fe/ml). The viability of T cells after 24 h incubation at different concentrations (1–9 mM Fe/ml VSOP) determined by propidium iodide incorporation in flow cytometry was not significantly impaired (Figure 4A). We assessed potential effects of VSOP on T cell differentiation analyzing CD4+ and CD8+ T cell subpopulations. The proportion of CD4+ T cells appeared slightly increased, while the proportion of CD8+ T cells was decreased at high VSOP co-incubation concentrations (Figure 4B), although this effect did not reach statistical significance. Subsequent propidium iodide staining revealed that a significant shift was caused by selective induction of cell death in the CD8+ T cell population labeled with VSOP compared to untreated T cells (Figure 4C; p < 0.05). In CD4+ T cells, only the highest VSOP concentration (9 mM Fe/ml) reduced viability (p < 0.05).
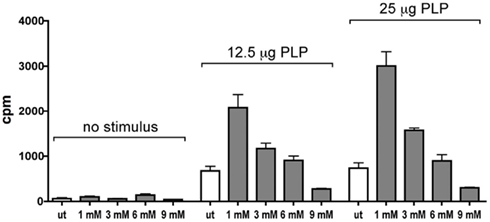
Figure 3. Changes in the proliferative capacity of T cells were assessed in a 3[H]thymidine assay. T cells incubated with VSOP concentrations of 1–9 mM Fe/ml were compared to unlabeled cells (ut). Proliferation rates were determined in the presence of the specific antigen proteolipid protein (PLP) in two concentrations (12.5 and 25 μg/ml) and without stimulation. After incubation with low VSOP concentrations (1–3 mM Fe/ml), the proliferation rate was significantly increased compared to untreated cells (p = 0.003).
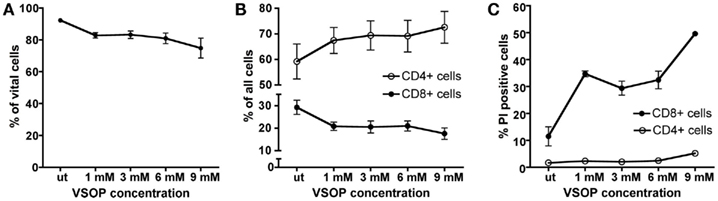
Figure 4. We investigated the influence of VSOP on T cell viability, differentiation and activation. The number of dead cells was quantified by FACS analysis using propidium iodide (PI). No significant reduction of cell viability was detected using VSOP concentrations of 1–9 mM Fe/ml in comparison to untreated cells (ut) (A). The percentage of CD4+ cells within the CD3+ T cell pool was augmented by increasing VSOP concentrations, while the percentage of CD8+ cells diminished slightly, although without reaching statistical significance (B). With increasing VSOP concentrations, we noted an increasing number of PI positive cells in the CD8+ cell pool indicating cell death (C).
Effects of VProt on the Phenotype of Differentiated Th17 Encephalitogenic T Cells
The relative effects of VSOP (1 mM) on PLP-specific T cell proliferation, as described above, may also result from a more pronounced induction of apoptosis in CD8 positive cells, that could be detected at equivalent VSOP concentrations. Therefore, we established a simplified system using TCR transgenic CD4 T cells (our target cells), to monitor the effects of VSOP, and in particular VProt, on CD4 T cell physiology. In these experiments, we also compared protamine alone versus VProt, affecting antigen-specific proliferation and cytokine production.
Hence, MOG-specific 2D2-TCR transgenic CD4 T cells were differentiated in vitro under Th17-polarizing conditions. VProt at 0.3 and 1 mM, or equivalent concentrations of protamine, respectively, were added to the cell culture medium at day 7, the time point of restimulation. Proliferation of 2D2-TCR transgenic T cells in the presence of the specific antigen MOG was assessed by CFSE dilution assays and monitored by flow cytometry. The effect of VProt or protamine alone on phenotype profile, as defined by the production of IL-17, was determined by intracellular staining of IL-17 in CD4 T cells.
CFSE based dilution assays showed that neither VProt nor protamine alone affected the proliferation of MOG-specific CD4 T cells in vitro at the applied concentrations (Figure 5A).
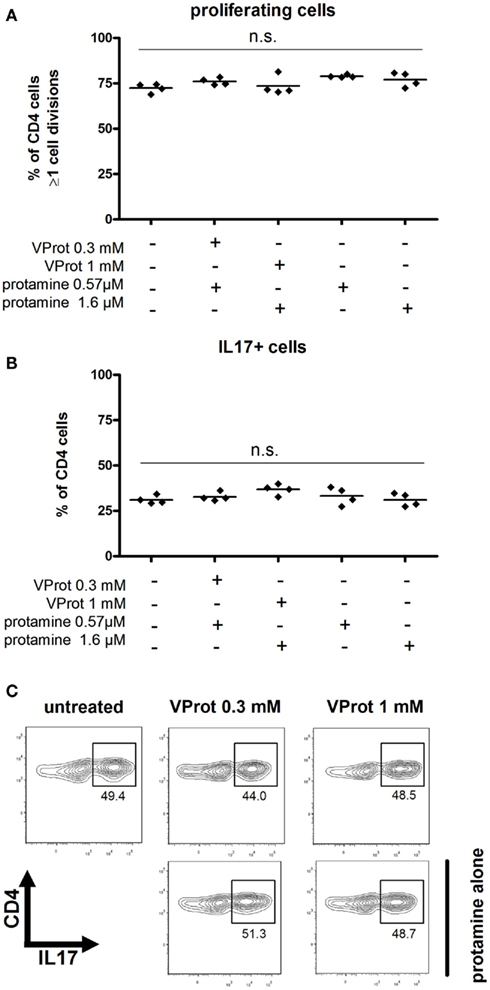
Figure 5. Effects of VProt on Th17 proliferation and cytokine production. (A) Incubation of Th17 cells for 3 days with VProt or protamine alone had no effect on Th17 proliferation, given as the percentage of cells showing one or more cell divisions, gated on CD4-positive cells. (B) Incubation of Th17 cells with VProt or protamine alone did not affect IL-17 production, shown as the percent of CD4-positive cells which were IL-17-positive. Percentages reflect anti-CD3/anti-CD28-stimulated cells after subtraction of baseline values from non-stimulated cells. (C) Representative flow cytometry plots showing the uncorrected percentage of IL-17-producing CD4-positive cells. n.s. not significant compared to control, by one-way ANOVA with Dunnet’s post hoc test.
Furthermore, the amount of CD4 cells expressing IL-17 or the production of IL-17 was not influenced by the addition of VProt or protamine alone (Figure 5B, representative flow cytometry profiles are given in Figure 5C). About 30% of CD4 T cells differentiated into Th17 T cells under both conditions.
Adoptive Transfer EAE by Encephalitogenic VSOP-CD4 T cells
In order to demonstrate the encephalitogenic potential of labeled T cells, we performed a murine adoptive transfer SJL-EAE with PLP-specific T cells obtained from PLP immunized mice, which were subsequently labeled in vitro with VSOP or VProt. Five out of seven recipient mice transferred with VSOP-T cells developed EAE with a median onset at day 10 after immunization (range 6–12) and maximum disease severity ranging from score 1 to 4 (Figure 6). As proof of principle, two recipient mice were transferred with VProt labeled T cells, and both of these mice developed EAE, presenting first signs of disability at day 9 and 10, respectively, after transfer.
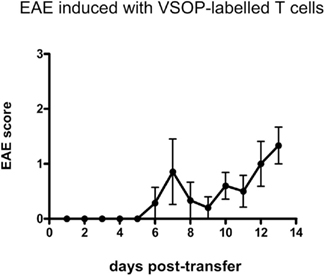
Figure 6. VSOP-labeled cells are able to induce EAE. PLP-specific T cells labeled with VSOP induced EAE in five out of seven SJL mouse recipients. Graph shows mean clinical score, ±SEM.
Thus, in vitro labeled PLP-specific T cells were capable of inducing EAE.
Discussion
The motivation for this study was the development of a lymphocyte labeling technique suited for longitudinal visualization and tracing of encephalitogenic T cells within the CNS during the induction and the course of EAE in vivo by MRI. Recently, successful labeling and in vivo tracking of lymphocytes have been shown in different tumor models (Kircher et al., 2003; Daldrup-Link et al., 2005; Hu et al., 2005) and a model of autoimmune diabetes (Billotey et al., 2005). To our knowledge, imaging of T cell migration to the CNS has been reported only twice up to now (Anderson et al., 2004; Pirko et al., 2004), and both studies were hampered by relatively low resolution and difficulties to assign hypointensities in T2*-weighted images to labeled cells, as distinct from blood vessels or other confounders. Thus the need to improve T cell labeling for subsequent use in in vivo studies during EAE is obvious. This represents a particular challenge because of the time gap of 8–12 days between T cell transfer and disease onset (Wuerfel et al., 2007) and the consequent T cell divisions and dilution of the nanoparticles, that takes place during this time interval in the recipient mice. An additional difficulty is that only a very low fraction of the initially transferred T cells infiltrate into the CNS (Raine et al., 1990). Externalized nanoparticles, e.g., released from dying labeled T2 cells, will eventually be internalized by local macrophages or activated microglia, as shown in previous murine (Wuerfel et al., 2007) as well as human (Vellinga et al., 2008) studies, or adhere to the perivascular extracellular matrix (Wuerfel et al., 2007).
We applied electrostatically stabilized very small particles, VSOP, since these nanoparticles showed excellent labeling properties, achieving a 5.7-fold higher labeling efficacy of macrophages compared to conventional dextran-coated magnetic nanoparticles, as demonstrated in a previous study (Fleige et al., 2002). In our hands, incubation of freshly isolated T lymphocytes with VSOP in a concentration of 3 mM Fe/ml over 24 h was well tolerated, and resulted in an iron uptake of 17.37 pg per cell, well above the level of 1–5 pg of iron per cell achieved with commonly used protocols (Arbab et al., 2006), and corresponding to a 55% shortening of the T2 time, as compared to unlabeled control cells. The uptake of VSOP was dependent on the concentration as well as on the incubation time applied, and could thus be slightly increased using higher VSOP dosages or extending the incubation period.
A commonly used method to further enhance labeling efficacy relies on the use of secondary compounds with transfection agents (Walczak et al., 2005). Among various approaches including viral transactivator transcription proteins (Lewin et al., 2000; Dodd et al., 2001; Kircher et al., 2003), polycationic transfection agents (Frank et al., 2003; Berger et al., 2006), or electroporation (Daldrup-Link et al., 2005; Suzuki et al., 2007), protamine has recently been employed by several groups. Delivering high cell transfection efficacy, this compound confers only very low toxicity in comparison to other transfection agents (Arbab et al., 2004; Reynolds et al., 2005; Anderson et al., 2006). We did not detect any influence of VProt on T cell viability and activation (data not shown), confirming other studies that excluded influences of protamine on cell viability, proliferation, and stem cell differentiation (Arbab et al., 2004, 2005; Suzuki et al., 2007).
We show here that the complexation of protamine to VSOP boosted the uptake of nanoparticles into T cells, and allowed for a reduction of VSOP dosage as well as of incubation times. In comparison to VSOP only, T2 relaxation times were reduced by 62% after 12 h of incubation with a concentration of 0.5 mM Fe/ml VProt. MR images of T cell phantoms confirmed the high labeling efficacy of VProt. VProt uptake reached a maximum after 8 h of incubating T cells with 1 mM Fe/ml, potentially resulting from different cellular uptake mechanisms of VSOP compared to VProt. Intracellular storage of VProt appeared diffuse in light microscopy differing from the vesicular distribution evident in T cells incubated with VSOP. Fleige et al. (2002) showed that macrophages internalize VSOP via phagocytosis. In contrast, polycationic transfection agents promote ingestion by macropinocytosis (Arbab et al., 2006). Whether these pathways also apply to the entry of VSOP and VProt into lymphocytes remains to be determined. Recent reports stress the importance of the surface charge and the size of magnetic nanoparticles as being crucial for the uptake into non-phagocytic cells (Thorek and Tsourkas, 2008). Accordingly, the improved labeling efficacy of VProt might thus result from a larger diameter and positive zeta potential of VProt compared to the negatively charged VSOP.
In summary, balancing results from the different labeling conditions, an incubation time of 8 h with a VProt concentration of 1 mM Fe/ml can be recommended for subsequent in vivo studies, combining high labeling with minimal unspecific extracellular binding.
We were particularly interested to rule out potential alterations of the immunological T cell profile as a prerequisite for future EAE trials. However, we noted an increased proliferation capacity of T lymphocytes after incubation with a VSOP concentration of 1 mM Fe/ml. Our findings are in line with studies showing that moderate concentrations of iron have a growth-promoting effect on lymphocytes whereas high iron concentrations may reduce cell proliferation (Djeha and Brock, 1992). Yet, in our cultures, this increased relative CD4+ T cell proliferation may be linked to the selectively enhanced cell death of CD8+ T cells observed at the same time. Since we were particularly interested in the immunological profile of the encephalitogenic CD4+ cell subpopulation labeled with protamine-complexed VSOP, we focused in the next experiments on this system exclusively. IL-17 producing T cell are regarded as key players in the development of autoimmune demyelinating disease (Zepp et al., 2011). Therefore, we investigated the effect of VProt on proliferation and phenotype stability of TCR transgenic CD4 T cells specific for MOG35–55 that were differentiated in vitro toward a Th17 phenotype. Our data indicate that, using this simplified set-up, labeling of T cells with VProt did not affect IL-17 expression in T cells, and did not influence the proliferative capacities of the MOG-specific Th17 cells.
Furthermore, we aimed to prove that VSOP-labeled encephalitogenic T cells were able to induce EAE in recipient mice. We showed that PLP-specific T cells labeled with VSOP or VProt successfully induced EAE. Thus, our results demonstrate that the T cell labeling method described herein does not inhibit the encephalitogenic capacity, and highlights the potential of this method performing future in vivo investigations.
In conclusion, in vivo studies on cell migration, e.g., in EAE, require a high labeling efficacy in order to facilitate tracking of labeled cells during a longer period of time. Additionally, the impact of T cell labeling on cell viability, functionality, or pathophysiological potency are of utmost importance when studying T cell behavior and their role in vivo. We optimized T cell labeling, applying VSOP and VProt at different concentrations and incubation times, comparing labeling efficacy in vitro. Best results were achieved with VProt at a concentration of 1 mM Fe/ml and an incubation time of 8 h. These conditions did not affect CD4 T cell physiology in terms of proliferative capacities or phenotypic stability. Finally, we showed that labeled encephalitogenic T cells T cells maintained their pathologic potential and are able to induce EAE in recipient mice.
Conflict of Interest Statement
The authors declare that the research was conducted in the absence of any commercial or financial relationships that could be construed as a potential conflict of interest.
Acknowledgments
This work was supported by the Deutsche Forschungsgemeinschaft (KFO213). We thank Martina Paetzel for editing this manuscript as native English speaker, and Thordis Hohnstein for technical assistance. We thank Constantin Scharlach for his contribution in protamin-coupling as well as Prof. Frauke Zipp for supporting this study and critically discussing a previous manuscript version.
References
Aktas, O., Smorodchenko, A., Brocke, S., Infante-Duarte, C., Schulze Topphoff, U., Vogt, J., Prozorovski, T., Meier, S., Osmanova, V., Pohl, E., Bechmann, I., Nitsch, R., and Zipp, F. (2005). Neuronal damage in autoimmune neuroinflammation mediated by the death ligand TRAIL. Neuron 46, 421–432.
Anderson, S. A., Lee, K. K., and Frank, J. A. (2006). Gadolinium-fullerenol as a paramagnetic contrast agent for cellular imaging. Invest. Radiol. 41, 332–338.
Anderson, S. A., Shukaliak-Quandt, J., Jordan, E. K., Arbab, A. S., Martin, R., Mcfarland, H., and Frank, J. A. (2004). Magnetic resonance imaging of labeled T-cells in a mouse model of multiple sclerosis. Ann. Neurol. 55, 654–659.
Arbab, A. S., Liu, W., and Frank, J. A. (2006). Cellular magnetic resonance imaging: current status and future prospects. Expert Rev. Med. Devices 3, 427–439.
Arbab, A. S., Yocum, G. T., Kalish, H., Jordan, E. K., Anderson, S. A., Khakoo, A. Y., Read, E. J., and Frank, J. A. (2004). Efficient magnetic cell labeling with protamine sulfate complexed to ferumoxides for cellular MRI. Blood 104, 1217–1223.
Arbab, A. S., Yocum, G. T., Rad, A. M., Khakoo, A. Y., Fellowes, V., Read, E. J., and Frank, J. A. (2005). Labeling of cells with ferumoxides-protamine sulfate complexes does not inhibit function or differentiation capacity of hematopoietic or mesenchymal stem cells. NMR Biomed. 18, 553–559.
Berger, C., Rausch, M., Schmidt, P., and Rudin, M. (2006). Feasibility and limits of magnetically labeling primary cultured rat T cells with ferumoxides coupled with commonly used transfection agents. Mol. Imaging 5, 93–104.
Billotey, C., Aspord, C., Beuf, O., Piaggio, E., Gazeau, F., Janier, M. F., and Thivolet, C. (2005). T-cell homing to the pancreas in autoimmune mouse models of diabetes: in vivo MR imaging. Radiology 236, 579–587.
Daldrup-Link, H. E., Meier, R., Rudelius, M., Piontek, G., Piert, M., Metz, S., Settles, M., Uherek, C., Wels, W., Schlegel, J., and Rummeny, E. J. (2005). In vivo tracking of genetically engineered, anti-HER2/neu directed natural killer cells to HER2/neu positive mammary tumors with magnetic resonance imaging. Eur. Radiol. 15, 4–13.
Djeha, A., and Brock, J. H. (1992). Uptake and intracellular handling of iron from transferrin and iron chelates by mitogen stimulated mouse lymphocytes. Biochim. Biophys. Acta 1133, 147–152.
Dodd, C. H., Hsu, H. C., Chu, W. J., Yang, P., Zhang, H. G., Mountz, J. D. Jr., Zinn, K., Forder, J., Josephson, L., Weissleder, R., Mountz, J. M., and Mountz, J. D. (2001). Normal T-cell response and in vivo magnetic resonance imaging of T cells loaded with HIV transactivator-peptide-derived superparamagnetic nanoparticles. J. Immunol. Methods 256, 89–105.
Fleige, G., Seeberger, F., Laux, D., Kresse, M., Taupitz, M., Pilgrimm, H., and Zimmer, C. (2002). In vitro characterization of two different ultrasmall iron oxide particles for magnetic resonance cell tracking. Invest. Radiol. 37, 482–488.
Focke, A., Schwarz, S., Foerschler, A., Scheibe, J., Milosevic, J., Zimmer, C., and Schwarz, J. (2008). Labeling of human neural precursor cells using ferromagnetic nanoparticles. Magn. Reson. Med. 60, 1321–1328.
Frank, J. A., Miller, B. R., Arbab, A. S., Zywicke, H. A., Jordan, E. K., Lewis, B. K., Bryant, L. H. Jr., and Bulte, J. W. (2003). Clinically applicable labeling of mammalian and stem cells by combining superparamagnetic iron oxides and transfection agents. Radiology 228, 480–487.
Hendrix, S., and Nitsch, R. (2007). The role of T helper cells in neuroprotection and regeneration. J. Neuroimmunol. 184, 100–112.
Heymer, A., Haddad, D., Weber, M., Gbureck, U., Jakob, P. M., Eulert, J., and Noth, U. (2008). Iron oxide labeling of human mesenchymal stem cells in collagen hydrogels for articular cartilage repair. Biomaterials 29, 1473–1483.
Hu, D. E., Kettunen, M. I., and Brindle, K. M. (2005). Monitoring T-lymphocyte trafficking in tumors undergoing immune rejection. Magn. Reson. Med. 54, 1473–1479.
Infante-Duarte, C., Horton, H. F., Byrne, M. C., and Kamradt, T. (2000). Microbial lipopeptides induces the production of IL-17 in Th cells. J. Immunol. 165, 6107–6115.
Kircher, M. F., Allport, J. R., Graves, E. E., Love, V., Josephson, L., Lichtman, A. H., and Weissleder, R. (2003). In vivo high resolution three-dimensional imaging of antigen-specific cytotoxic T-lymphocyte trafficking to tumors. Cancer Res. 63, 6838–6846.
Lewin, M., Carlesso, N., Tung, C. H., Tang, X. W., Cory, D., Scadden, D. T., and Weissleder, R. (2000). Tat peptide-derivatized magnetic nanoparticles allow in vivo tracking and recovery of progenitor cells. Nat. Biotechnol. 18, 410–414.
Liu, W., and Frank, J. A. (2008). Detection and quantification of magnetically labeled cells by cellular MRI. Eur. J. Radiol. 70, 258–264.
Perl, D. P., and Good, P. F. (1992). Comparative techniques for determining cellular iron distribution in brain tissues. Ann. Neurol. 32(Suppl.), S76–S81.
Pirko, I., Johnson, A., Ciric, B., Gamez, J., Macura, S. I., Pease, L. R., and Rodriguez, M. (2004). In vivo magnetic resonance imaging of immune cells in the central nervous system with superparamagnetic antibodies. FASEB J. 18, 179–182.
Raine, C. S., Cannella, B., Duijvestijn, A. M., and Cross, A. H. (1990). Homing to central nervous system vasculature by antigen-specific lymphocytes. II. Lymphocyte/endothelial cell adhesion during the initial stages of autoimmune demyelination. Lab. Invest. 63, 476–489.
Reynolds, F., Weissleder, R., and Josephson, L. (2005). Protamine as an efficient membrane-translocating peptide. Bioconjug. Chem. 16, 1240–1245.
Rogers, W. J., Meyer, C. H., and Kramer, C. M. (2006). Technology insight: in vivo cell tracking by use of MRI. Nat. Clin. Pract. Cardiovasc. Med. 3, 554–562.
Shen, T., Weissleder, R., Papisov, M., Bogdanov, A. Jr., and Brady, T. J. (1993). Monocrystalline iron oxide nanocompounds (MION): physicochemical properties. Magn. Reson. Med. 29, 599–604.
Smirnov, P., Poirier-Quinot, M., Wilhelm, C., Lavergne, E., Ginefri, J. C., Combadiere, B., Clement, O., Darrasse, L., and Gazeau, F. (2008). In vivo single cell detection of tumor-infiltrating lymphocytes with a clinical 1.5 Tesla MRI system. Magn. Reson. Med. 60, 1292–1297.
Stroh, A., Faber, C., Neuberger, T., Lorenz, P., Sieland, K., Jakob, P. M., Webb, A., Pilgrimm, H., Schober, R., Pohl, E. E., and Zimmer, C. (2005). In vivo detection limits of magnetically labeled embryonic stem cells in the rat brain using high-field (17.6 T) magnetic resonance imaging. Neuroimage 24, 635–645.
Stroh, A., Zimmer, C., Gutzeit, C., Jakstadt, M., Marschinke, F., Jung, T., Pilgrimm, H., and Grune, T. (2004). Iron oxide particles for molecular magnetic resonance imaging cause transient oxidative stress in rat macrophages. Free Radic. Biol. Med. 36, 976–984.
Stroh, A., Zimmer, C., Werner, N., Gertz, K., Weir, K., Kronenberg, G., Steinbrink, J., Mueller, S., Sieland, K., Dirnagl, U., Nickenig, G., and Endres, M. (2006). Tracking of systemically administered mononuclear cells in the ischemic brain by high-field magnetic resonance imaging. Neuroimage 33, 886–897.
Suzuki, Y., Zhang, S., Kundu, P., Yeung, A. C., Robbins, R. C., and Yang, P. C. (2007). In vitro comparison of the biological effects of three transfection methods for magnetically labeling mouse embryonic stem cells with ferumoxides. Magn. Reson. Med. 57, 1173–1179.
Thorek, D. L., and Tsourkas, A. (2008). Size, charge and concentration dependent uptake of iron oxide particles by non-phagocytic cells. Biomaterials 29, 3583–3590.
Vellinga, M. M., Oude Engberink, R. D., Seewann, A., Pouwels, P. J., Wattjes, M. P., van der Pol, S. M., Pering, C., Polman, C. H., de Vries, H. E., Geurts, J. J., and Barkhof, F. (2008). Pluriformity of inflammation in multiple sclerosis shown by ultra-small iron oxide particle enhancement. Brain 131, 800–807.
Walczak, P., Kedziorek, D. A., Gilad, A. A., Lin, S., and Bulte, J. W. (2005). Instant MR labeling of stem cells using magnetoelectroporation. Magn. Reson. Med. 54, 769–774.
Weiner, H. L., and Frenkel, D. (2006). Immunology and immunotherapy of Alzheimer’s disease. Nat. Rev. Immunol. 6, 404–416.
Wuerfel, E., Infante-Duarte, C., Glumm, R., and Wuerfel, J. T. (2010). Gadofluorine M-enhanced MRI shows involvement of circumventricular organs in neuroinflammation. J. Neuroinflammation 18, 70.
Wuerfel, J., Tysiak, E., Prozorovski, T., Smyth, M., Mueller, S., Schnorr, J., Taupitz, M., and Zipp, F. (2007). Mouse model mimics multiple sclerosis in the clinico-radiological paradox. Eur. J. Neurosci. 26, 190–198.
Yeh, T. C., Zhang, W., Ildstad, S. T., and Ho, C. (1995). In vivo dynamic MRI tracking of rat T-cells labeled with superparamagnetic iron-oxide particles. Magn. Reson. Med. 33, 200–208.
Zepp, J., Wu, L., and Li, X. (2011). IL-17 receptor signaling and T helper 17-mediated autoimmune demyelinating disease. Trends Immunol. 32, 232–239.
Keywords: magnetic resonance imaging, magnetic nanoparticles, protamine, cell labeling, T cell, EAE
Citation: Wuerfel E, Smyth M, Millward JM, Schellenberger E, Glumm J, Prozorovski T, Aktas O, Schulze-Topphoff U, Schnorr J, Wagner S, Taupitz M, Infante-Duarte C and Wuerfel J (2011) Electrostatically stabilized magnetic nanoparticles – an optimized protocol to label murine T cells for in vivo MRI. Front. Neur. 2:72. doi: 10.3389/fneur.2011.00072
Received: 16 May 2011; Accepted: 01 November 2011;
Published online: 16 December 2011.
Edited by:
Hans-Peter Hartung, Heinrich-Heine University Duesseldorf, GermanyReviewed by:
Thomas G. Forsthuber, University of Texas at San Antonio, USAJörg Kraus, Paracelsus Medical University, Austria
Copyright: © 2011 Wuerfel, Smyth, Millward, Schellenberger, Glumm, Prozorovski, Aktas, Schulze-Topphoff, Schnorr, Wagner, Taupitz, Infante-Duarte and Wuerfel. This is an open-access article subject to a non-exclusive license between the authors and Frontiers Media SA, which permits use, distribution and reproduction in other forums, provided the original authors and source are credited and other Frontiers conditions are complied with.
*Correspondence: Jens Wuerfel, NeuroCure, Charité – University Medicine Berlin, Charitéplatz 1, 10117 Berlin, Germany. e-mail: jens.wuerfel@charite.de
†Present address: EvaWuerfel , Department of Pediatrics, University Luebeck, Luebeck, Germany;
Timour Prozorovski , Department of Neurology, Medical Faculty, Heinrich-Heine-University Duesseldorf, Duesseldorf, Germany;
Orhan Aktas, Department of Neurology, Medical Faculty, Heinrich-Heine-University Duesseldorf, Duesseldorf, Germany;
Ulf Schulze-Topphoff , Department of Neurology, School of Medicine, University of California, San Francisco, CA, USA
‡ Eva Wuerfel and Maureen Smyth equally contributing first authors.
§ Carmen Infante-Duarte and Jens Wuerfel are equally contributing last authors.