
- Department of Animal Biology 209E/VET, School of Veterinary Medicine, University of Pennsylvania, Philadelphia, PA, USA
Background: Obstructive sleep apnea (OSA) is associated with glucose intolerance. Both chronic sleep disruption and recurrent blood oxygen desaturations (chronic–intermittent hypoxia, CIH) may cause, or exacerbate, metabolic derangements. Methods: To assess the impact of CIH alone, without accompanying upper airway obstructions, on the counter-regulatory response to glucose load and cardiorespiratory parameters, we exposed adult male Sprague-Dawley rats to CIH or sham room air exchanges for 10 h/day for 7, 21, or 35 days and then, 1 day after conclusion of CIH exposure, conducted intravenous glucose-tolerance tests (ivgtt) under urethane anesthesia. Additional rats underwent 35 days of CIH followed by 35 days of regular housing, or had 35 day-long CIH exposure combined with daily administration of the type 1 angiotensin II receptor antagonist, losartan (15 mg/kg, p.o.), and then were also subjected to ivgtt. Results: Compared with the corresponding control groups, CIH rats had progressively reduced glucose-stimulated insulin release and impaired glucose clearance, only mildly elevated heart rate and/or arterial blood pressure and slightly reduced respiratory rate. The differences in insulin release between the CIH and sham-treated rats disappeared in the rats normally housed for 35 days after 35 days of CIH/sham exposure. The losartan-treated rats had improved insulin sensitivity, with no evidence of suppressed insulin release in the CIH group. Conclusion: In adult rats, the glucose-stimulated insulin release is gradually suppressed with the duration of exposure to CIH, but the effect is reversible. Elimination of the detrimental effect of CIH on insulin release by losartan suggests that CIH disrupts glucoregulation through angiotensin/catecholaminergic pathways. Accordingly, treatment with continuous positive airway pressure may ameliorate pre-diabetic conditions in OSA patients, in part, by reducing sympathoexcitatory effects of recurrent nocturnal hypoxia.
Introduction
In patients with obstructive sleep apnea (OSA), chronic nocturnal episodes of a transient loss of upper airway patency lead to recurrent blood oxygen desaturations and sleep fragmentation. Clinical studies show that such chronic, intermittent disruption of both sleep and breathing has adverse consequences for cardiorespiratory regulation, metabolism, and cognitive functions. OSA patients are frequently obese, hypertensive, and glucose intolerant – features typical of the metabolic syndrome (Peppard et al., 2000; Newman et al., 2001; Tatsumi et al., 2005). Importantly, recent association studies suggest that OSA is an independent risk factor for glucose intolerance (Ip et al., 2002; Punjabi et al., 2002; reviewed by Punjabi and Polotsky, 2005; Lévy et al., 2008; Tasali and Ip, 2008), but the mechanistic bases linking different aspects of sleep-disordered breathing to distinct cardiorespiratory, metabolic, and other morbidities characteristic of OSA are still poorly understood.
To elucidate the cellular and systemic pathophysiologic consequences of OSA, rodents have been used to model, in a controllable manner, conditions similar to those associated with sleep-disordered breathing (e.g., Li et al., 1996, 2003, 2005; Lesske et al., 1997; Carley and Radulovacki, 2002; Reeves et al., 2003; Zoccal et al., 2007; Nair et al., 2011a). In particular, rodents exposed to chronic–intermittent hypoxia (CIH) exhibit selected symptoms typical of OSA patients (reviewed by Neubauer, 2001; Prabhakar and Kumar, 2004); they have increased arterial blood pressure and vascular reactivity (reviewed by Foster et al., 2007), increased sleep propensity (Veasey et al., 2004), and impaired cognitive functions (Li et al., 2003; Nair et al., 2011a). Normal mice exhibit insulin resistance during acute exposure to intermittent hypoxia (Iiyori et al., 2007). Leptin-deficient mice exposed to CIH for 12 weeks have reduced glucose-tolerance (Polotsky et al., 2003), and healthy humans acutely exposed to CIH have reduced insulin sensitivity and impaired glucose disposal (Louis and Punjabi, 2009). Together, these studies demonstrate that CIH alters glucose metabolism and suggest that the effects of acute and chronic CIH are different and that genetic background modifies the effects of CIH on the mechanisms of glucose disposal.
Obstructive sleep apnea in humans and CIH in animal models cause recurrent episodes of increased stimulation of the sympathetic system and the associated elevation of catecholamines and angiotensin II (Fletcher et al., 1992, 1999; Greenberg et al., 1999; Iiyori et al., 2007; Gilmartin et al., 2010; Knight et al., 2011; Tamisier et al., 2011). These sympathoexcitatory effects outlast the period of acute disturbance of breathing and sleep (Knight et al., 2011; Tamisier et al., 2011), and likely play a key role in the multiple cardiorespiratory and metabolic dysregulations associated with OSA. Indeed, in addition to their blood pressure-elevating actions, catecholamines, and angiotensin II acutely suppress the counter-regulatory insulin response to high carbohydrate intake and glucose disposal (Deibert and DeFronzo, 1980; Ogihara et al., 2002; Vicini et al., 2002), and exacerbate the negative effects of oxidative stress (Ogihara et al., 2002), which is a major pathogenic factor in OSA (Prabhakar and Kumar, 2004; Nair et al., 2011a). Furthermore, data from both rodents and healthy human subjects indicate that systemic antagonism of type 1 angiotensin II receptors attenuates the negative effects of CIH on arterial blood pressure and sympathetic tone (Fletcher et al., 1999; Foster et al., 2010; Marcus et al., 2010), and reduces insulin resistance in obese Zucker rats (Henriksen et al., 2001).
Our main goals were to assess the time-course of changes in glucose-stimulated insulin release following different periods of exposure to CIH and determine whether the effects of CIH are reversible when the animals are returned to normal housing. We also set out to assess whether the angiotensin II type 1 receptor antagonist, losartan, can ameliorate the adverse effects of CIH on the counter-regulatory response to glucose load. Preliminary reports have been published (Fenik et al., 2007; Kubin et al., 2008).
Materials and Methods
Animals and Experimental Groups
Experiments were performed on 83 adult, male Sprague-Dawley rats weighting 280–349 g at the beginning of the experimental protocol. Of those, 42 were subjected to CIH for periods of 7, 21, or 35 days and the remaining 41 to room air exchanges (sham treatment) of matching durations. Of the 42 rats subjected to CIH, 9 underwent the treatment for 7 days, 7 for 21 days, 10 for 35 days, 10 for 35 days followed by normal housing for another 35 days, and 6 for 35 days with concomitant daily treatment with losartan (see Table 1 for details). All rats were anesthetized on the day after the last day of exposure and were subjected to intravenous glucose-tolerance test (ivgtt). All procedures followed the guidelines for the care and use of experimental animals established by the National Institutes of Health and were approved by the Institutional Animal Care and Use Committee of the University of Pennsylvania.
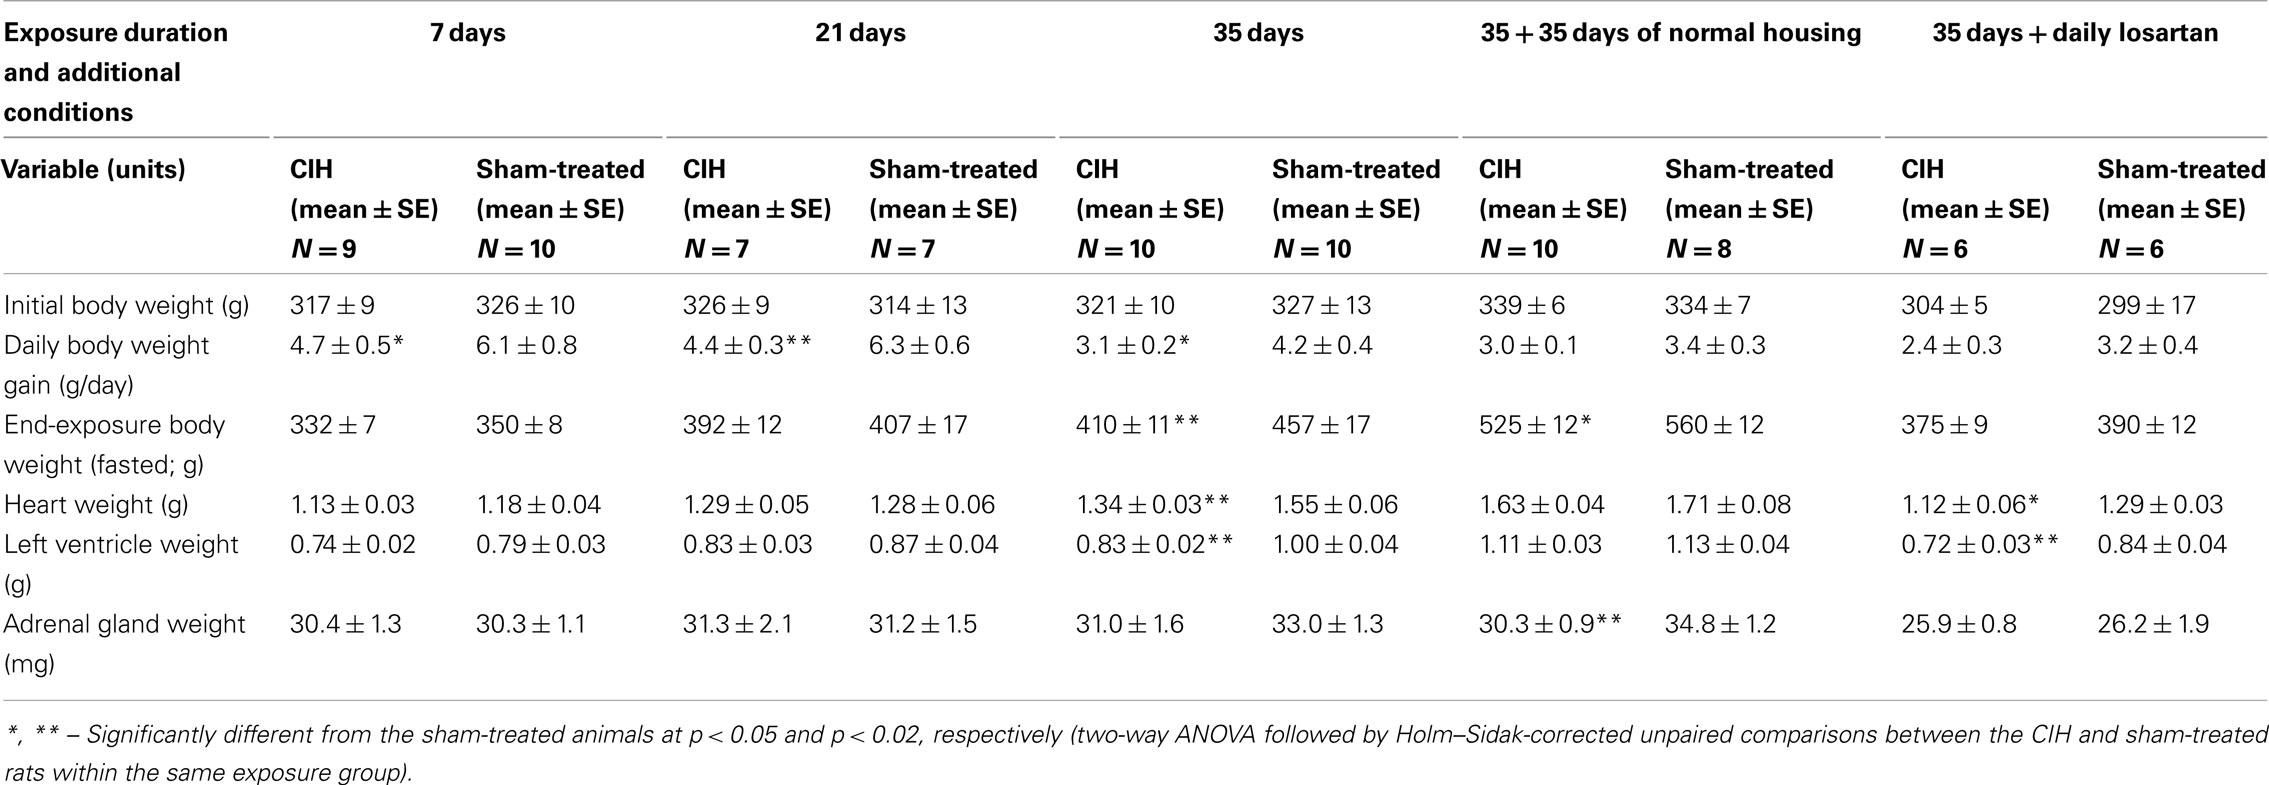
Table 1. Body and organ weights in CIH and sham-treated rats.
Chronic–Intermittent Hypoxia and Sham Exposures
The animals were group-housed, two or three per standard cage, under 12/12 h light/dark cycle (lights on at 7:00 a.m.), with standard chow diet (5001/AIN76; Purina), and water provided ad libitum. The cages were placed inside 28.5 cm × 30.0 cm × 51.5 cm chambers in which oxygen (O2) level was controlled by alternating flows of nitrogen (N2) and O2 (Oxycycler; Biospherix, Redfield, NY, USA). Sham-treated rats were housed in identical chambers and experienced changes in flow of compressed room air with a timing that replicated gas flows in one of the experimental chambers. The O2 level in CIH chambers was nominally set to cycle between 20.9% for 90 s and 10% for 90 s for 10 h/day from 7:00 a.m. to 5:00 p.m. daily (180 s cycle period). To accelerate gas exchanges, an initial undershoot was applied at the onset of the hypoxic half-cycle that transiently lowered O2 level to 7%, and an overshoot was programmed-in at the onset of the normoxic half-cycle that resulted in O2 level transiently reaching a peak of 24% (the O2 profile used is illustrated in Rukhadze et al., 2010). From 5:00 p.m. to 7:00 a.m., all chambers were ventilated with a constant flow of room air (to maintain normal levels of CO2 and humidity). An additional group of rats was first exposed to 35 days of CIH or sham treatment and then observed for 35 days under normal housing conditions before they were also subjected to ivgtt. Another group of rats was exposed to CIH or sham treatment and was additionally treated with losartan during the entire period of exposure. The drug was administered daily at 10:00 a.m. at a dose of 15 mg/kg, p.o. Rats were briefly immobilized in a transparent restraining cone with an opening for the mouth, ∼0.2 ml suspension of the drug was pipetted into the mouth, and the animal was released into its home cage after it was verified that the entire volume was ingested.
Measurements during and Following CIH/Sham Exposures
The animals were individually weighed at 5:00 p.m. every other day throughout the experiment. In a subset of animals exposed to CIH or sham treatment for 35 days, the amount of dry food consumed during successive 2-day intervals was measured for each cage and an average daily consumption per animal was calculated. After the last day of exposure to CIH or sham treatment, the rats were fasted overnight, anesthetized around 10:00 a.m. and subjected to the ivgtt. The heart, left ventricle, and both adrenal glands were extracted at the end of the acute experiment and weighed. The average basal levels of glucose and insulin were determined from up to three plasma samples collected prior to glucose bolus administration, and the basal c-peptide (the main insulin metabolite, not to be confused with “c-reactive protein”) and corticosterone were measured from one baseline sample each (see the sampling schedule below). Plasma glucose levels were determined using a colorimetric assay kit #510 (Sigma-Aldrich, Inc., Saint Louis, MO, USA). Plasma insulin was measured using the rat insulin ELISA kit #10-1137-99 (American Laboratory Products), c-peptide using kit #RCP 21-K (RIA Linco Research) and corticosterone using ELISA kit #AC-14F1 (Immunodiagnostic Systems).
Administration of the Intravenous Glucose-Tolerance Test
Rats were fasted overnight, pre-anesthetized with isoflurane (2–3%) and anesthetized with urethane (1 g kg−1, i.p., supplemented by 40 mg i.v. injections, as needed). A femoral artery and vein were cannulated for arterial blood pressure monitoring and fluid injections, respectively. Rectal temperature was measured and maintained at 37°C with a servo-controlled heating pad. For the test, a glucose bolus (400 mg/kg) was injected intravenously over 1 min. Sixteen blood samples were collected from the femoral artery, the first one right after cannulation (marked as negative 20 min on the graphs) and the remaining ones at the following times relative to the start of glucose injection (in min): −5, −2, 1, 2, 3, 5, 7, 9, 11, 13, 15, 17, 25, 40, and 70. The volumes were 0.1 ml for all samples except the first and the second (−5 min) that were 0.35 ml for the additional measurements of c-peptide and corticosterone and determination of the hematocrit. The total volume of blood drawn during ∼1.5 h was 2.1 ml. All blood samples were spun immediately after collection, aliquoted, and stored at −80°C.
Statistical Analysis
Statistical analysis was performed using SigmaStat v. 12 (Jandel, San Raphael, CA, USA). All data sets were first subjected to Shapiro–Wilk normality test. The variables that were normally distributed were then analyzed with two-way analysis of variance (ANOVA) with Holm–Sidak correction, with one factor being the treatment (CIH or sham) and the other the duration of exposure (7, 21, 35 days, or 35 days followed by 35 days of normal housing). ANOVA was followed by individual two-tailed Student’s t-tests of the effects of the treatment within each group or the effect of exposure duration between groups. The data sets that were not normally distributed were subjected to Mann–Whitney rank sum tests of differences between treatments and across exposure durations. Effects were regarded significant when p < 0.05. The variability of the means is characterized by the standard error (SE) throughout the report.
Results
Food Consumption and Body and Organ Weights during and Following Exposure to CIH
After the first 2 days of exposure to CIH, all animals had a steady increase of body weight during the exposures. However, the rate of body weight gain was significantly slower in the CIH than sham-treated rats. Within the groups exposed to CIH/sham treatment for 7, 21, or 35 days, two-way ANOVA revealed significant effects of both treatment (p < 0.001, F1,2,46 = 13.15) and duration of exposure (p < 0.001, F1,2,46 = 8.41), and post hoc comparisons within each exposure group indicated significantly lower daily body weight gains in the CIH rats (Table 1). The reduced body weight gain in CIH rats was not associated with reduced food consumption. During the period from day 20 to 35 of exposure, the daily dry food consumption per rat was 28 ± 1.1 g for the CIH rats and 28 ± 0.8 g for the sham-treated rats (this does not account for food spill into bedding or any additional consumption of the corn bedding itself, but there is no reason to assume that these would differ between CIH- and sham-treated rats). The same rats had during this period a daily body weight gain of 1.8 ± 0.2 and 3.4 ± 0.3 g/day, respectively (p < 0.004), and the body weight gain per gram of food consumed was 0.066 ± 0.008 and 0.120 ± 0.009 g, respectively (p < 0.002). Thus, the reduced rate of body weight gain in the CIH rats was related to a significantly higher metabolism and energy expenditure when compared to the sham-treated rats.
To assess the extent to which CIH exposure disrupted sleep, a total of 10 h of direct observation of awakenings occurring in relation to O2 cycling was conducted with group-housed rats on days 10–15 of exposure. Arousals were noted (scored) if any rat in the group of three opened the eyes or lifted the head during the hypoxic phase of the cycle. The observations revealed that CIH rats slept through 62% the hypoxic phases of the cycle (124 out of 200 cycles), whereas sham-treated rats had significantly more hypoxic cycles during which no signs of arousal were noted (79%, or 158 out of 200 cycles; Pearson’s χ2 = 13.9, p = 0.0002 for difference between the two proportions). Although the approach that we used overestimated the amount of sleep disruption because awakening of any one rat in the group was treated as an awakening of the entire group, these observations suggest that sleep was more fragmented in the CIH rats. On the other hand, it is clear that both groups were able to sleep through more than a half of the real and sham O2 nadirs.
Within each exposure group, the CIH rats had consistently lower weights of the heart and left ventricle (Table 1). The difference was significant in the 35-day exposure group (p < 0.004 for the heart and p < 0.0025 for the left ventricle), but disappeared in the group normally housed for an additional 35 days after 35-day exposure. The differences in the heart weight was not statistically significant when it was scaled by body weight, whereas the scaled by body weight left ventricular weight was still significantly lower in the CIH than sham-treated rats of the 35-day exposure group (p < 0.02). Thus, there was no evidence of heart hypertrophy in the CIH rats.
The adrenal gland weight did not differ between the CIH and sham-treated rats exposed to CIH/sham treatments for 7, 21, or 35 days. In the rats normally housed for 35 days after 35-day exposure, the adrenal glands were significantly larger in the sham-treated group than in the group earlier subjected to CIH (p < 0.03). This could represent a continuation of the trend also seen in the 35-day exposure group, a trend that could be a net result of a gradual adaptation to CIH and generally higher weights of all measured organs in the sham-treated rats. The same trend persisted when the adrenal gland weights were scaled by body weight, but the difference was not statistically significant. It is also of note that the rats subjected to sham treatment for 35 days with the concurrent daily administration of losartan had much smaller adrenal glands that those subjected for 35 days to sham treatment only (p < 0.015; Holm–Sidak-corrected comparison across all groups).
Blood Pressure, Heart Rate, Respiratory Rate, and Hematocrit after Different Periods of Exposure to CIH or Sham Treatment
The systolic arterial blood pressure measured under urethane anesthesia on the next day after termination of exposures was significantly higher in the CIH than sham-treated rats only in the group exposed to CIH for 7 days (Table 2). The rats receiving losartan generally had lower blood pressure than any other group (p < 0.04 vs. the 35-day CIH group without losartan, and p < 0.006 vs. the 35-day sham-treated group without losartan). The CIH rats of the losartan cohort also tended to have a higher systolic blood pressure than their sham-treated mates and had a significantly higher heart rate than the sham-treated animals (p < 0.04). Other than that, there were no differences in the arterial blood pressure or heart rate between the CIH and control rats (Table 2). In each exposure group, the respiratory rate was consistently lower in the CIH rats, although the difference was not statistically significant (Table 2).
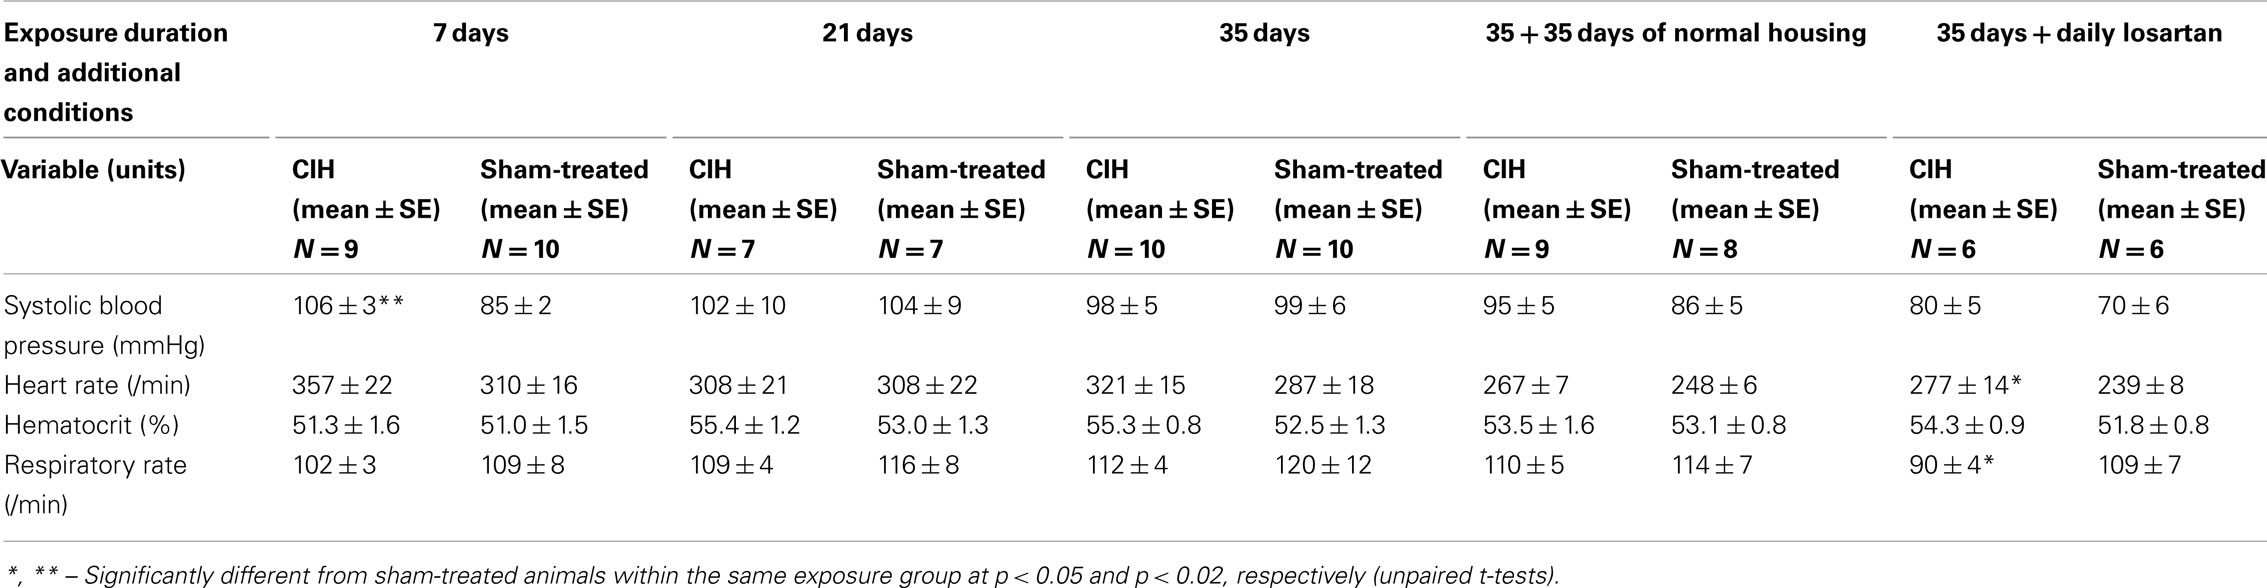
Table 2. Cardiorespiratory parameters in CIH and sham-treated rats.
The hematocrit was slightly higher in the CIH than sham-treated rats of each exposure group, but the difference was not significant in any group, or when exposure groups were combined in various configurations (Table 2).
Basal Levels of Insulin, C-Peptide, Glucose, Corticosterone, and Related Indices after CIH/Sham Exposures
The basal level of insulin measured under anesthesia at the beginning of the ivggt experiment tended to be lower in the CIH than sham-treated rats within each exposure group, including the groups housed in normal environment following 35 days of CIH or sham exposure. The differences between the CIH and sham-treated rats did not reach statistical significance for any one exposure period but two-way ANOVA applied to the 7, 21, and 35-day exposure groups revealed a significant effect of the treatment (p = 0.016, F1,2,45 = 6.3). Across the 7, 21, 35, and 35 + 35 days of normal housing groups, the effect of exposure duration on the basal insulin level (which included also the effects of age and body mass) was highly significant (p < 0.001, F1,3,52 = 12.18), with multiple individual differences also being significant (within CIH rats: 7 vs. 21 and 7 vs. 35 + 35 days; within sham rats: 7 vs. 21, 7 vs. 35, 7 vs. 35 + 35, and 35 vs. 35 + 35 days). The same trends and similar significance levels were revealed by two-way ANOVA for c-peptide (the main metabolite of insulin). Linear regression analysis also revealed that c-peptide levels were tightly correlated with insulin levels on a sample-by sample basis (p < 0.001, F45 = 26.7), which confirmed that any degradation of insulin during sample handling was negligible. Within the 35-day exposure group, c-peptide level approached a significantly lower level in the CIH rats (p = 0.055).
The basal plasma glucose levels tended to be higher in the CIH than sham-treated rats in all exposure groups, but the differences were not significant within any one exposure group or when the groups were combined in various combinations. As a result of the trend for decreased basal insulin levels and increased glucose levels in the CIH rats, the glucose-to-insulin ratio was significantly higher in the CIH than sham-treated rats of the 35-day exposure group (Table 3).
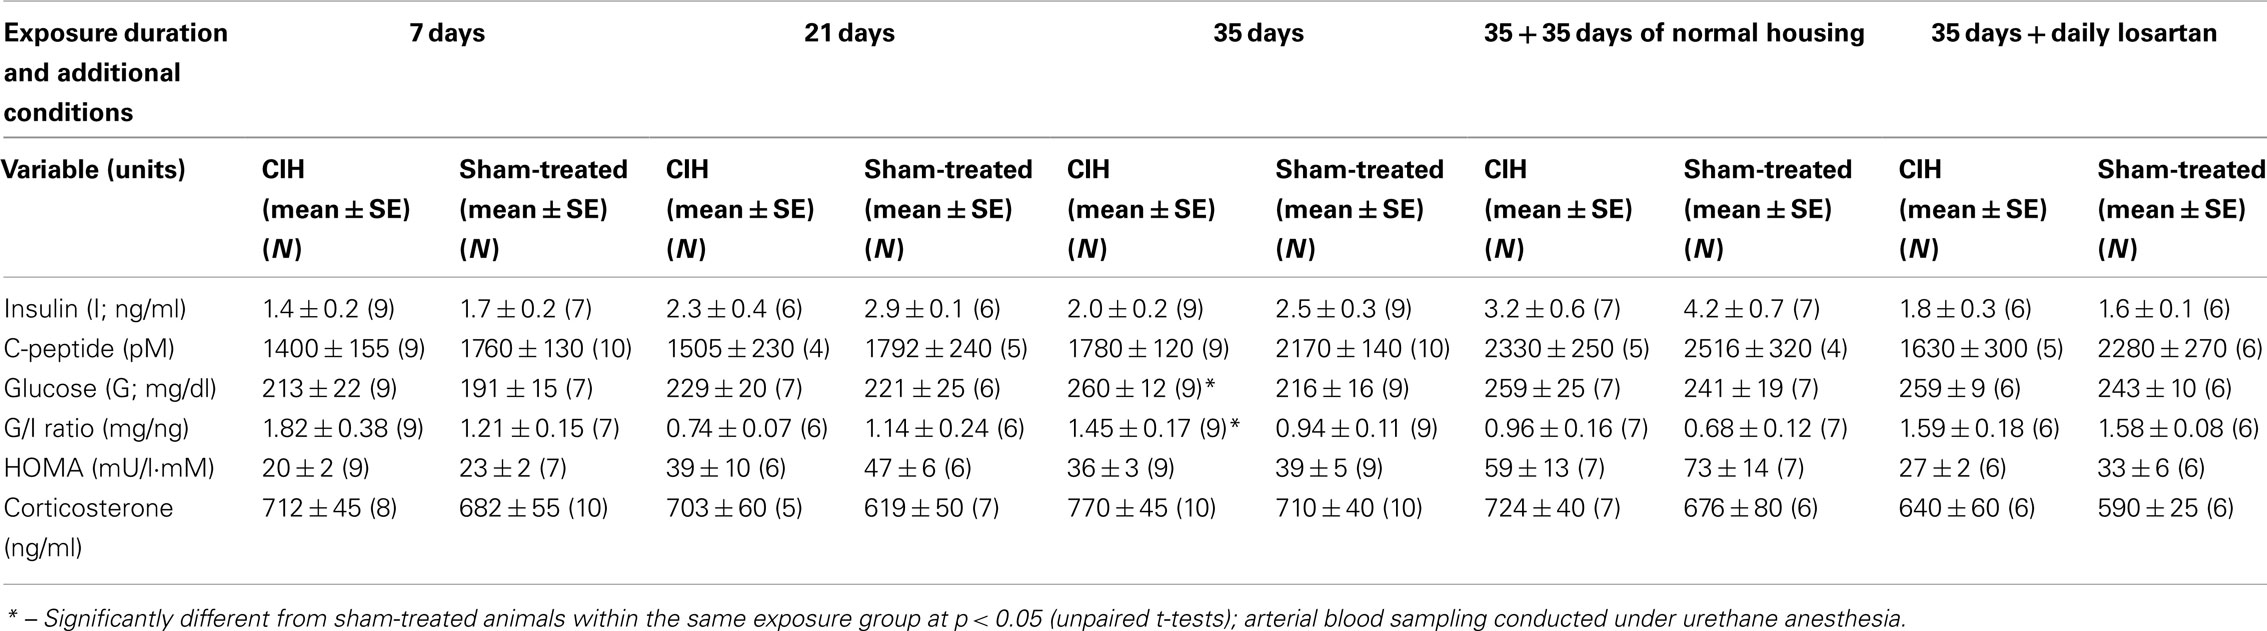
Table 3. Baseline insulin, glucose, and selected hormone levels in CIH and sham-treated rats.
The HOMA index (an index clinically used for assessment of the effectiveness of insulin action and calculated as the product of glucose in millimoles and insulin in milliunits per liter divided by 22) consistently tended to be lower in the CIH than sham-treated rats of each exposure group, but no significant differences were detected. As expected, the basal levels of insulin and HOMA index tended to gradually increase with age and body weight (Table 3).
In all exposure groups, corticosterone levels tended to be slightly higher in the CIH than in the corresponding sham-treated groups. However, the differences were not statistically significant within any one exposure period (Table 3), and two-way ANOVA did not reveal any significant effect of CIH vs. sham treatment across all exposure groups.
Gradual Development of Suppressed Glucose-Stimulated Insulin Release with the Duration of Exposure to CIH and Recovery after Return to Normal Housing
It has been shown that the time-course of the insulin response to glucose load is similar in anesthetized and unanesthetized rats (Latour and Lautt, 2002), and that an ivgtt study conducted under anesthesia can detect age-dependent reductions in glucose clearance (Natalucci et al., 2003). Based on those findings, we chose to conduct the ivgtt under anesthesia in an attempt to reduce the inter-subject variability of hormonal measures caused by behavioral factors. In retrospect, although we were able to detect a consistent and progressive reduction of glucose-stimulated insulin release with increasing durations of exposure to CIH, we found the inter-subject variability to be still considerable despite anesthesia. Figure 1 shows one data set for plasma glucose and insulin curves obtained from the ivgtt conducted under anesthesia with nine rats subjected to CIH for 35 days and the corresponding group of nine rats subjected to sham treatment. Despite substantial variability, the glucose clearance curves show an elevation of glucose levels in the CIH rats and the insulin curves point to both a general downward shift in the CIH rats and a clearly reduced second peak of insulin release (between 11 and 25 min after the glucose bolus injection at time 0).
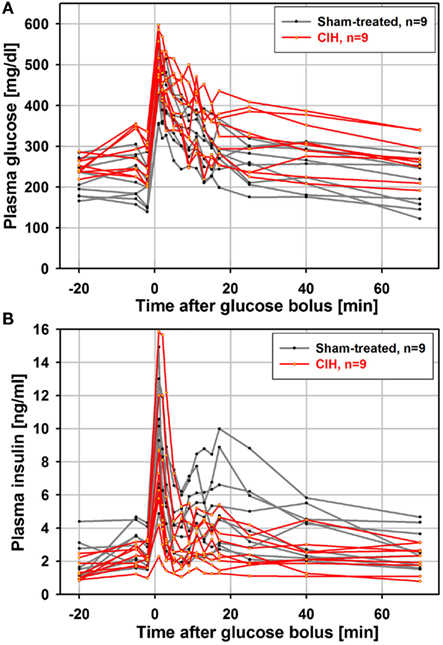
Figure 1. Individual glucose and insulin curves obtained from the ivgtt conducted under anesthesia with nine rats subjected to CIH and nine rats subjected to sham gas exchanges for 35 days. Glucose bolus (400 mg/kg) was injected at time zero. Note a clear elevation of glucose levels in CIH rats (A) and both a downward shift and reduced second peak of insulin release in CIH rats (between 11 and 25 min after glucose bolus injection) (B).
Figure 2 shows the average time-course of plasma glucose levels during the ivgtt obtained from animal groups subjected to CIH or sham treatment for different periods. The total numbers of animals from which complete ivgtt data were obtained are lower than the numbers of animals from which the general characteristics of each group are reported in Table 1 because the ivgtt test was either not fully successful or not all necessary glucose and insulin measurements were obtained from all animals. Ultimately, complete ivgtt data were obtained from eight CIH and seven sham rats of the 7-day exposure group, six CIH and six sham rats of the 21-day exposure group, nine CIH and nine sham rats of the 35-day exposure group, and seven CIH and seven sham rats of the 35-day exposure group that was subsequently housed under normal conditions for another 35 days before the ivgtt.
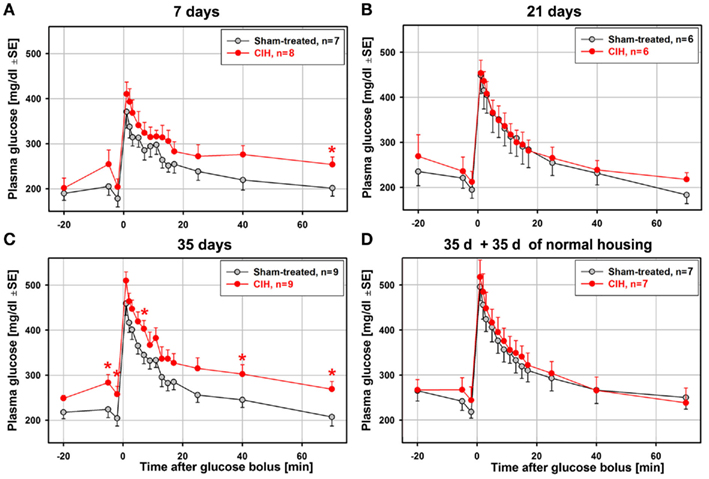
Figure 2. Average time-course of plasma glucose clearance during the ivgtt conducted following 7, 21, 35 days of exposure to CIH or sham treatment and in rats subjected to CIH/sham treatment for 35 days and then normally housed for another 35 days. Glucose clearance was delayed in the rats exposed to CIH for 7 days (A) and those subjected to CIH for 35 days (C), but not in the rats subjected to CIH for 21 days (B). The effect was mainly related to the elevation of baseline glucose levels in the CIH rats prior to glucose bolus injection (at time zero). In the rats subjected to CIH or sham treatment for 35 days and then housed normally for another 35 days, the glucose clearance curves did not differ between CIH and sham-exposed rats (D). *Indicates p < 0.05 relative to the corresponding sham-treated group at the same time point.
Glucose clearance was visibly delayed in the CIH compared to sham-treated rats of the 7-day group, but only the glucose levels measured at 70 min after glucose bolus injection were significantly different (Figure 2A). Elevation of the glucose level in the CIH rats of this group was due, in part, to a slight elevation of the baseline glucose levels in the CIH rats prior to the glucose bolus injection. In the 21-day group, no difference was detected (Figure 2B). In the 35-day group, the elevation of glucose levels in the CIH rats was significant at three different time points after glucose injection. As in the 7-day exposure group, this was, at least in part, secondary to the significantly higher baseline glucose level in the CIH animals (Figure 2C). In the rats housed in a normal environment for 35 days following 35-day exposures, the glucose curves were nearly identical in the CIH- and sham-treated rats (Figure 2D). Thus, the glucose clearance curves did not point to a major difference between CIH and sham-treated rats other than those that might have been related to different baseline plasma glucose levels.
In contrast to the relatively modest statistical significance of the effect of CIH on glucose clearance curves, the glucose-stimulated insulin release exhibited large differences between the CIH and sham rats that progressed with the duration of exposure. Figure 3 shows the average time-course of plasma insulin levels during ivgtt that correspond to the glucose curves shown in Figure 2. Whereas the baseline insulin levels differed little, the post-glucose injection insulin levels were significantly depressed in the CIH rats. The effect was significant at 4–9 different post-glucose time points in the 7-, 21-, and 35-day exposure groups (Figures 3A–C). In all these groups, the primary peak, at 1 min post-glucose bolus, was consistently lower (significant in the 21-day group), and the secondary peak was nearly abolished in CIH rats of all exposure groups. Remarkably, the glucose-stimulated insulin curves were nearly identical in the CIH and sham rats that were normally housed for 35 days after 35 days of exposure (Figure 3D). Thus, the depression of insulin release detected 1 day after the 7–35 days of CIH was entirely absent following 35 days of housing under normal conditions.
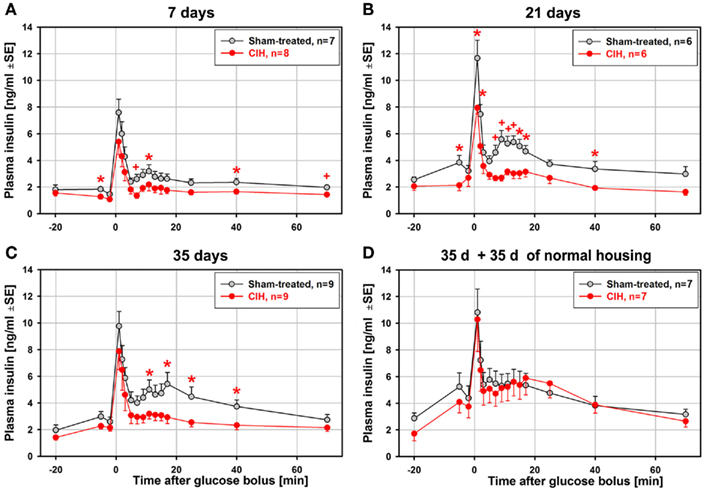
Figure 3. Average time-course of glucose-stimulated insulin release during the ivgtt conducted following 7, 21, 35 days of exposure to CIH or sham treatment and in rats subjected to CIH/sham treatment for 35 days and then normally housed for another 35 days. While there were only minor differences in the baseline insulin levels between the CIH and sham-treated rats, the differences between insulin levels during the second phase of insulin release (11–25 min after glucose bolus) were large and increased with the duration of CIH exposure (A–C). This was due to a profound suppression of the second insulin peak in the CIH rats of all groups while the second insulin peak in the sham-treated rats increased with the duration of exposure. In the rats subjected to CIH or sham treatment for 35 days and then housed normally for another 35 days, glucose-stimulated insulin release did not differ between CIH and sham-exposed rats, with both groups having a distinct second peak of insulin release (D). *, +Indicate p < 0.05 and p < 0.02, respectively, relative to the corresponding sham-treated group at the same time point. See text for further discussion.
To further examine the time-course of suppression of the secondary peak of glucose-stimulated insulin release during the ivgtt, we calculated the difference between the mean insulin levels during the period 11–25 min after the glucose bolus and the baseline insulin level (samples collected 2 and 5 min prior to glucose bolus). These results are shown in Figure 4. Whereas the sham-treated rats had a continuous trend for an increase of the mean insulin levels during the secondary peak with the duration of exposure (this includes age and body weight effects), the CIH rats had continuously and steadily suppressed the secondary insulin peaks across all periods of exposure. As a result, the difference between the CIH and sham-treated rats progressively increased and reached statistical significance after 35 days of exposure. The suppression of the secondary insulin peak was apparently relieved during the 35 day period when the rats earlier exposed to CIH for 35 days were returned to normal housing because the mean insulin level during the secondary peak of the response more than doubled in this group when compared with any of the groups tested 1 day after termination of CIH exposure lasting from 7 to 35 days.
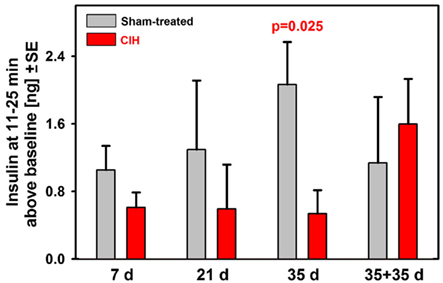
Figure 4. Baseline-adjusted mean insulin levels measured during the second peak of insulin response (11–25 min after glucose bolus) in rats exposed to CIH or sham treatment for 7, 21, or 35 days and in rats subjected to CIH/sham treatment for 35 days and then normally housed for another 35 days. The deficit of insulin release in CIH rats gradually increased with the duration of exposure due to profound and steady suppression of insulin release in CIH rats of all groups and gradually increasing insulin release in the corresponding groups of sham-treated rats. The difference reached statistical significance after 35 days of exposure. The rats subjected to CIH for 35 days and then normally housed for another 35 days did not have suppressed insulin release and did not differ from any of the sham-treated groups.
Glucose Clearance and Insulin Release in Rats Treated with Losartan during Exposure to CIH
To test whether suppressed insulin release and the associated impairment of glucose clearance during the ivgtt depend on renal mechanisms and increased levels of circulating catecholamines/angiotensin (Fletcher et al., 1999), we exposed another group of rats to CIH or sham treatment for 35 days while also administering losartan daily. In contrast to the 35-day exposure group not treated with losartan, both the glucose clearance and insulin release curves obtained from the rats treated with losartan were nearly identical between CIH and sham rats (Figure 5). Also unlike the rats exposed to CIH without losartan (Figure 3C), the CIH-exposed rats of the losartan group had a clearly identifiable secondary peak of insulin release (Figure 5B). Thus, the differential effect of CIH vs. sham treatment on glucose and insulin curves was entirely abolished by losartan.
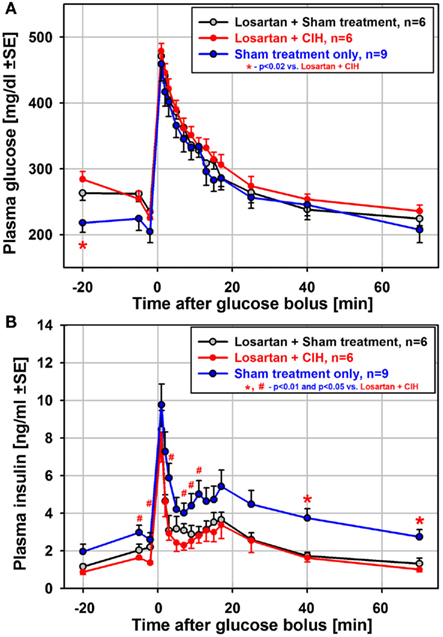
Figure 5. Mean glucose and insulin curves obtained from the ivgtt conducted under anesthesia with six rats subjected to CIH and six rats subjected to sham gas exchanges for 35 days with concurrent daily administration of the angiotensin type 1 receptor antagonist, losartan. Losartan treatment eliminated all differences between CIH and sham-treated rats that occurred following CIH exposures of the same or shorter durations without losartan. Losartan also shifted upward the baseline glucose level and shifted downward the baseline insulin level when compared to the rats sham-exposed for 35 days without losartan [blue lines in (A) and (B)]. Thus, insulin sensitivity was improved in losartan-treated animals. See text for further discussion.
Although the difference between CIH and sham-treated rats was absent in the losartan group, the ivgtt curves obtained from the losartan-treated rats were not identical to those from the sham-treated rats of the 35-day exposure group not treated with losartan. The losartan group had an elevated baseline glucose level (significant for the first sample during the ivgtt; see Figure 5A), and the insulin curves obtained from the losartan rats were shifted downward, including the baseline samples, compared with the sham-treated rats without losartan (Figure 5B). Thus, while there was no distinct suppression of glucose-stimulated insulin release in the CIH–losartan rats, the rats of the losartan group had an altered set-point for the regulation of glucose and insulin levels. They were able to more effectively clear excess glucose while maintaining lower baseline insulin levels and higher glucose levels than in the sham-treated rats that did not receive losartan. This points to improved insulin sensitivity in the losartan-treated rats. It is of note that the losartan rats tended to have lower body weights and lower HOMA indices than the rats of the 35-day exposure group without losartan (Tables 1 and 3), a result also consistent with improved insulin sensitivity. Furthermore, the lower adrenal gland weights and lower arterial blood pressure (Tables 1 and 2) suggest reduced catecholamine levels and lower sympathetic activity in the losartan rats.
Discussion
Our main findings are: (1) that glucose-stimulated insulin release is suppressed in rats exposed to CIH; (2) that the impairment progressively increases with the duration of exposure but does not persist after cessation of CIH; and (3) that a daily treatment with losartan entirely prevents the suppressant effect of CIH on counter-regulatory insulin response during the ivgtt. While our data point to a distinct inhibitory effect of CIH on stimulated insulin release and the contribution of angiotensin and/or catecholamines to this process, our data do not provide evidence for reduced insulin sensitivity in the CIH rats in which recurrent hypoxic episodes occur without other major factors and conditions typical of OSA in humans, such as severe sleep fragmentation, large intrathoracic pressure swings or concurrent obesity. It appears that CIH rats had relatively normal insulin sensitivity, as suggested by the trend toward lower HOMA indices and only minimally reduced glucose clearance after adjustment for the altered baseline glucose levels. However, the strongly impaired ability to release insulin in response to glucose load that we found in CIH rats represents a risk factor for ineffective glucose clearance at times of high-sugar intake. This deficiency alone may facilitate the occurrence of type 2 diabetes in OSA patients exposed to a high-sugar diet.
CIH Exposures Used in Our Study
Our CIH protocol was nominally similar to that used in several previous studies (e.g., Greenberg et al., 1999; Kraiczi et al., 1999; Li et al., 2003), but different chamber designs and controller settings are likely to yield different O2 profiles. Indeed, actual O2 profiles used in different studies are relatively rarely described; the O2 profile that we use has been previously illustrated (Rukhadze et al., 2010). It is of note that our O2 profile included an overshoot at the onset of the normoxic half-cycle, which may have helped restore oxygen saturation after each hypoxic half-cycle. Possibly due to this effect, our rats did not exhibit any signs typically associated with prolonged exposure to steady hypoxia, such as significantly increased hematocrit or heart hypertrophy.
Data from CIH studies in rodents suggest that, in addition to O2 nadirs, other parameters of exposure, such as the cycle length or exposure duration, produce qualitatively and quantitatively different outcomes. The results also vary with the genetic background of the animals (Fletcher et al., 1992, 1999; Kraiczi et al., 1999; Germack et al., 2002; Polotsky et al., 2003; Nair et al., 2011a), and likely depend on the interval between the last exposure and the time of testing. The outcomes from studies in which CIH exposures lasted about 30 days, suggest that severe CIH (O2 nadirs of 5% or less) leads to pulmonary and systemic hypertension, right ventricular hypertrophy and increased hematocrit (Fletcher et al., 1992, 1999; Lesske et al., 1997; Fagan, 2001; McGuire and Bradford, 2001; Kalaria et al., 2004; Campen et al., 2005; reviewed by Foster et al., 2007), as well as damage to selected groups of wake-active neurons (Veasey et al., 2004). However, blood pressure increases are relatively modest (often of the order of 10 mmHg) and the concomitant increases in circulating catecholamine levels are difficult to detect even when the hypoxic phase of the cycle is relatively severe and when measurements are conducted immediately after the exposure (Lesske et al., 1997; Fletcher et al., 1999; Campen et al., 2005). In healthy humans exposed to mild CIH for 14–28 days, arterial blood pressure measured after exposure was significantly increased, but the average magnitude of the increase was of the order of only 3–4 mmHg (Gilmartin et al., 2010; Tamisier et al., 2011), and a recent longitudinal study did not find a significant correlation between OSA and arterial hypertension after correction for age and body mass (Cano-Pumeranga et al., 2011). Some studies in rodents also reported less dramatic changes in baseline cardiovascular and cognitive parameters (Greenberg et al., 1999; Kraiczi et al., 1999; Reeves et al., 2003; Naghshin et al., 2009; Knight et al., 2011), but it is not clear whether the lesser magnitude of the effects was related to less severe hypoxia (nadirs of 6–10%) or other factors. It is also of note that numerous studies report a positive effect of CIH on endurance, resistance to ischemic injury, glucose disposal, and hypertension (Mohan et al., 2001; Cai et al., 2003; Chiu et al., 2004; Serebrovskaya et al., 2008; Lyamina et al., 2011; Tonini et al., 2011), but the CIH protocols used to achieve these beneficial effects often involve less frequent cycling and less severe hypoxia than those used in studies that aim to model the periodic O2 desaturations that occur in OSA patients.
Our CIH rats gained weight during the exposure, and did not have increased hematocrit levels or cardiac hypertrophy. There was, however, a trend toward an increased heart rate in the CIH rats and/or arterial blood pressure tended to be increased, consistent with increased catecholamine levels and/or sympathetic activity (Lesske et al., 1997; Iiyori et al., 2007; Zoccal et al., 2007; Gilmartin et al., 2010; Tamisier et al., 2011). The CIH animals appeared healthy throughout the period of exposure, and the levels of corticosterone were not different between CIH and sham-treated rats when measured under anesthesia 1 day after termination of exposure. Collectively, our measures and observations suggest that our CIH exposures were relatively moderate and not associated with major stress or sleep disruption (cf. Boss et al., 2005).
The slower rate of body weight gain in our CIH rats was likely caused by an increased metabolism, rather than reduced food consumption. The increased work of breathing required of CIH rats must have increased their metabolic rate and could contribute to their being consistently leaner than sham-treated animals. Consistent with this interpretation, we found that the daily amounts of food consumed were not significantly different between the CIH and sham-treated rats but were significantly higher in the CIH rats when scaled by the body weight. The additional respiratory effort required of CIH rats could have beneficial effects on their endurance and/or insulin sensitivity similar to that ascribed to daily exercise or hypoxic training (Bernardi, 2001; Henriksen, 2007). It is noteworthy that the HOMA index did not suggest reduced insulin sensitivity in CIH rats. The effect of CIH on the basal levels of glucose and insulin exhibited relatively weak statistical significance and could be secondary to the body weight differences between the CIH and sham-treated rats (Bagdade et al., 1967). On the other hand, the significantly increased baseline glucose-to-insulin ratio in the 35-day exposure group suggested an altered set-point for the regulation of the steady-state glucose level.
One caveat with our ivgtt study is that it was conducted under anesthesia because anesthesia elevates the baseline glucose and insulin levels compared with those in behaving animals (Netchiporouk et al., 2001). This could modify the time-course of cellular events that lead to insulin release following glucose injection. Nevertheless, our sham-treated and CIH rats were compared under the same experimental conditions; thus, any differences between the groups must have been related to the exposure to CIH. Furthermore, the major suppression of glucose-stimulated insulin release that we consistently observed in CIH-exposed rats was absent after a period of normal housing and in the losartan-treated rats. Thus, while the anesthetic might have modified the time-course and magnitude of glucose and insulin changes during the ivgtt, we were able to uncover a distinct impairment of insulin release that was directly related to the exposure to CIH.
Reduced Counter-Regulatory Response to Glucose Load in CIH Rats
When challenged with a glucose load, our CIH rats had a precipitously reduced second phase of insulin response, a reduction that was also significant after correction for the slightly lower baseline insulin levels. In humans, a reduced compensatory response to glucose load better distinguishes between potentially diabetic and non-diabetic individuals than the baseline glucose and insulin values (Bagdade et al., 1967). Thus, our findings from the ivgtt tests suggest that CIH altered the mechanisms of insulin release in a manner that would put the CIH rats at risk of prolonged hyperglycemia under conditions of elevated sugar intake.
Our results are different from those with CIH exposures of lean and leptin-deficient (obese) mice (Polotsky et al., 2003; Li et al., 2005). In those studies, following 5-day exposures, both the lean and obese mice had reduced fasting glucose levels, whereas insulin levels were increased in the obese but unchanged in the lean animals. Under the same conditions, both lean and obese mice exposed to either CIH or sham treatment had a significant decrease of body weight and reduced food intake. In addition, the lean mice exhibited signs of hyperlipidemia (Li et al., 2005), which was then found to also occur following 4-week exposures to severe (O2 nadir of 5%), but not moderate CIH (Li et al., 2007). After 5-day exposures, both normal and leptin-deficient mice had improved glucose clearance during an intraperitoneal glucose-tolerance test. Thus, they did not exhibit the insulin resistance found in lean mice acutely subjected to CIH for 9 h and then tested during the exposure (Iiyori et al., 2007). In contrast, substantially longer (12 weeks) exposures yielded outcomes that were more compatible with our study (Polotsky et al., 2003). Lean mice exposed to either CIH or sham treatment for 12 weeks had similar body weight gains and food consumption, and the fasting glucose levels tended to be higher in the CIH than control animals, but the glucose responsiveness of these mice was not tested. Thus, considering that lean and obese mice responded differently to glucose load after 5 days of exposure, the effect of long-term exposure of normal animals on glucoregulation could not be inferred from that study.
Mechanisms Underlying the CIH-Induced Suppression of Stimulated Insulin Release
The reduced insulin release in CIH rats could suggest a diminished availability of insulin, but experimental data do not support this. Both apoptosis and proliferation of pancreatic β-cells occur in rats and mice exposed to CIH, with the net effect being an increased pancreatic insulin reserve (Kubin et al., 2006; Yokoe et al., 2008; Xu et al., 2009). Thus, it is more plausible that rodents exposed to CIH had impaired insulin release, rather than reduced insulin availability. Since rodents exposed to CIH have increased sympathetic activation and increased levels of circulating catecholamines, it is likely that the reduced insulin release in CIH rats was caused by inhibition exerted by the sympathetic system at the pancreatic β-cell level. Although impaired insulin-dependent transport of glucose into skeletal muscles could contribute to the difference between CIH- and sham-treated rats in our study (further discussed below in the context of losartan effects), it is of note that stimulated insulin release was also suppressed in healthy humans acutely exposed to CIH (Louis and Punjabi, 2009). In our experiments, the second phase of stimulated insulin release was similarly suppressed after 7, 21, and 35 days of exposure. Accordingly, the progressive increase of insulin release associated with increasing body mass and age in sham rats was probably the main reason for the increasing with the period of exposure difference between the CIH and sham rats. Thus, at least in healthy humans and rodents, suppression of stimulated insulin release may be the first and most prominent effect of CIH. Indeed, impaired counter-regulatory response to glucose load is a major first step toward the development of type 2 diabetes (Weyer et al., 1999).
Chronic sustained hypoxia causes elevation of tyrosine hydroxylase expression and activity in selected brain regions (Pépin et al., 1996; Gozal et al., 2005). In contrast, following CIH, despite the evidence for increase sympathetic activation and increased circulating catecholamine/angiotensin II levels, brain tyrosine hydroxylase levels and activity are minimally affected (Li et al., 1996; Gozal et al., 2005). This suggests that CIH exerts its effects mainly on catecholaminergic output neurons of the sympathetic system. However, we recently found evidence for both structural and functional enhancements of noradrenergic transmission in the brainstem of CIH-exposed rats. Specifically, exposure to CIH resulted in sprouting of noradrenergic terminals in different sensory and motor regions within the lower brainstem (Rukhadze et al., 2010; Mody et al., 2011) and increased endogenous noradrenergic activation of cranial motoneurons (Stettner et al., 2012). Data also suggest that activity of dorsal medullary catecholaminergic neurons is increased 1 day after 7-day exposure to CIH (Knight et al., 2011). Thus, CIH may cause noradrenergic hyperactivity both centrally and peripherally that outlasts the period of exposure. Abolition of the detrimental effects of CIH on glucose-stimulated insulin release in the rats treated with losartan supports a role of catecholamines and angiotensin in this process, but it remains to be determined whether both central and peripheral neurohumoral controls of pancreatic β-cells are affected and for how long this change can persist.
Interaction of CIH and Sleep Restriction – Relevance to OSA
Different pathogenic conditions of OSA, such as CIH, sleep loss, sleep fragmentation, and large intrathoracic pressure swings, may exert distinct deleterious effects on cardiorespiratory and metabolic functions (Dimsdale et al., 1997; Lévy et al., 2008; Tasali and Ip, 2008). Among those, the effects of CIH and sleep disruptions may have additive effects because changes qualitatively similar to those in our study were observed in healthy young adults subjected to chronic sleep restriction (Spiegel et al., 1999). Specifically, the subjects had a reduced ability to clear glucose during ivgtt and their acute insulin response was reduced, while their baseline glucose and insulin levels were minimally changed. The authors suggested that the state induced by sleep loss represented an early stage of insulin resistance. In our CIH rats, sleep fragmentation may have occurred to a limited extent but, in contrast to OSA patients, our CIH rats slept through most of the hypoxic phases of the CIH cycle and their corticosterone level was not significantly elevated. Therefore, the similarity between our outcomes and those from a study with selective sleep restriction suggests that CIH and chronic sleep loss may both impede the response to glucose load, but it is not known to what extent the underlying mechanisms differ. It is of interest to note that, in mice, both CIH and sleep fragmentation cause similar cognitive deficits, with nicotinamide adenine dinucleotide phosphate (NADPH) oxidase playing a role in both effects (Nair et al., 2011a,b). In OSA patients, who are often obese, oxidative stress, elevated catecholamines/angiotensin and fatty acids, and sleep disruption are likely to act in concert to accelerate and/or exacerbate development of type 2 diabetes (Evans et al., 2003).
Effects of CIH in Rats Treated with Losartan
Daily losartan administration resulted in slower body weight gain, reduced adrenal gland weight, and lower arterial blood pressure in both sham- and CIH-treated rats. The insulin response to glucose load and glucose clearance rate were not different between the two groups, and the secondary peak of insulin release was not suppressed. However, insulin levels both before and during ivgtt were lower in the losartan-treated rats than in the rats not treated with losartan and subjected for 35 days to sham gas exchanges. This suggests that losartan improved insulin sensitivity, as it did in the obese Zucker rats (Henriksen et al., 2001). Importantly, angiotensin II antagonism can improve glucose disposal by modulating insulin receptor/insulin receptor substrate-1 signaling in skeletal muscles, with a convergent action on some of the same intracellular mechanisms that are also beneficially affected by exercise training (Henriksen, 2007). Thus, the effects of losartan on glucose transport in skeletal muscles and the enhanced work of breathing could act together to improve the outcomes in our losartan rats subjected to CIH. It is, however, of note that several trends present in the CIH rats of the other exposure groups, such as reduced body weight gain, reduced heart weight, increased systolic blood pressure, tachycardia, and reduced respiratory rate, were still present in the CIH rats treated with losartan. Thus, CIH exerts its effects through multiple mechanisms, of which only some can be directly related to actions mediated by type 1 angiotensin II receptors.
Conclusion
Normal rats exposed to CIH and then tested ∼20 h after the last exposure (to minimize any acute effects of the treatment) had a significantly and progressively reduced insulin response to glucose load. Extrapolation of these results to OSA patients leads to the conclusion that a combination of CIH caused by sleep-disordered breathing with a high-sugar diet may expose these patients to an increased risk of developing glucose intolerance and type 2 diabetes. Our finding that the detrimental effects of CIH on glucose-stimulated insulin release are reversible after the animals are returned to normal housing conditions is consistent with studies in OSA patients in which treatment with continuous positive airway pressure improved insulin responsiveness (Brooks et al., 1994; Harsch et al., 2004).
Conflict of Interest Statement
The authors declare that the research was conducted in the absence of any commercial or financial relationships that could be construed as a potential conflict of interest.
Acknowledgments
The authors thank Dr. Heather W. Collins and staff of Radioimmunoassay Core Facility of the Penn Diabetes Center for plasma hormone level determinations. The study was supported by the grants HL-074385 and NIDDK-19525 from the National Institutes of Health.
References
Bagdade, J. D., Bierman, E. L., and Porte, D. Jr. (1967). The significance of basal insulin levels in the evaluation of the insulin response to glucose in diabetic and nondiabetic subjects. J. Clin. Invest. 46, 1549–1557.
Boss, V., Sola, A., Wen, T.-C., and Decker, M. J. (2005). Mild intermittent hypoxia does not induce stress responses in the neonatal rat brain. Biol. Neonate 88, 313–320.
Brooks, B., Cistulli, P. A., Borkman, M., Ross, G., McGhee, S., Grunstein, R. R., Sullivan, C. E., and Yue, D. K. (1994). Obstructive sleep apnea in obese noninsulin-dependent diabetic patients: effect of continuous positive airway pressure treatment on insulin responsiveness. J. Clin. Endocrinol. Metab. 79, 1681–1685.
Cai, Z., Manalo, D. J., Wei, G., Rodriguez, E. R., Fox-Talbot, K., Lu, H., Zweier, J. L., and Semenza, G. L. (2003). Hearts from rodents exposed to intermittent hypoxia or erythropoietin are protected against ischemia-reperfusion injury. Circulation 108, 79–85.
Campen, M. J., Shimoda, L. A., and O’Donnell, C. P. (2005). Acute and chronic cardiovascular effects of intermittent hypoxia in C57BL/6J mice. J. Appl. Physiol. 99, 2028–2035.
Cano-Pumeranga, I., Durán-Cantolla, J., Aizpuru, F., Miranda-Serrano, E., Rubio, R., Martínez-Null, C., de Miguel, J., Egea, C., Cancelo, L., Álvarez, A., Fernández-Bolaños, M., and Barbé, F. (2011). Obstructive sleep apnea and systemic hypertension: longitudinal study in the general population: the Vitoria Sleep Cohort. Am. J. Respir. Crit. Care Med. 184, 1299–1304.
Carley, D. W., and Radulovacki, M. (eds). (2002). Sleep-(Related) Breathing Disorders. Experimental Models and Therapeutic Potential. New York: Dekker.
Chiu, L. L., Chou, S. W., Cho, Y. M., Ho, H. Y., Ivy, J. L., Hunt, D., Wang, P. S., and Kuo, C. H. (2004). Effect of prolonged intermittent hypoxia and exercise training on glucose tolerance and muscle GLUT4 protein expression in rats. J. Biomed. Sci. 11, 838–846.
Deibert, D. C., and DeFronzo, R. A. (1980). Epinephrine-induced insulin resistance in man. J. Clin. Invest. 65, 717–721.
Dimsdale, J. E., Coy, T., Ancoli-Israel, S., Mills, P., Clausen, J., and Ziegler, M. G. (1997). Sympathetic nervous system alterations in sleep apnea. The relative importance of respiratory disturbance, hypoxia, and sleep quality. Chest 11, 639–642.
Evans, J. L., Goldfine, I. D., Maddux, B. A., and Grodsky, G. M. (2003). Are oxidative stress-activated signaling pathways mediators of insulin resistance and βcell dysfunction? Diabetes 52, 1–8.
Fagan, K. A. (2001). Pulmonary hypertension in mice following intermittent hypoxia. J. Appl. Physiol. 90, 2502–2507.
Fenik, V., Branconi, J. L., Singletary, T., and Kubin, L. (2007). Chronic intermittent hypoxia (CIH)-induced reduction of glucose-stimulated insulin release is CIH duration-dependent and reversible. Am. J. Resp. Crit. Care Med. 175, abstr. :A755.
Fletcher, E. C., Bao, G., and Li, R. (1999). Renin activity and blood pressure in response to chronic episodic hypoxia. Hypertension 34, 309–314.
Fletcher, E. C., Lesske, J., Behm, R., Miller, C. III, Staus, H., and Unger, T. (1992). Carotid chemoreceptors, systemic blood pressure and chronic episodic hypoxia mimicking sleep apnea. J. Appl. Physiol. 72, 1978–1984.
Foster, G. E., Hanly, P. J., Ahmed, S. B., Beaudin, A. E., Pialoux, V., and Poulin, M. J. (2010). Intermittent hypoxia increases arterial blood pressure in humans through a renin-angiotensin system-dependent mechanism. Hypertension 56, 369–377.
Foster, G. E., Poulin, M. J., and Hanly, P. J. (2007). Intermittent hypoxia and vascular function: implications for obstructive sleep apnoea. Exp. Physiol. 92, 51–65.
Germack, R., Leon-Velarde, F., De La Valdes, B. R., Farias, J., Soto, G., and Richalet, J. P. (2002). Effect of intermittent hypoxia on cardiovascular function, adrenoceptors and muscarinic receptors in Wistar rats. Exp. Physiol. 87, 453–460.
Gilmartin, G. S., Lynch, M., Tamisier, R., and Weiss, J. W. (2010). Chronic intermittent hypoxia in humans during 28 nights results in blood pressure elevation and increased muscle sympathetic nerve activity. Am. J. Physiol. 299, H925–H931.
Gozal, E., Shah, Z. A., Pequignot, J. M., Pequignot, J., Sachleben, L. R., Czyżyk-Krzeska, M. F., Li, R. C., Guo, S. Z., and Gozal, D. (2005). Tyrosine hydroxylase expression and activity in the rat brain: differential regulation after long-term intermittent or sustained hypoxia. J. Appl. Physiol. 99, 642–649.
Greenberg, H. E., Sica, A. L., Batson, D., and Scharf, S. M. (1999). Chronic-intermittent hypoxia increases sympathetic responsiveness to hypoxia and hypercapnia. J. Appl. Physiol. 86, 298–305.
Harsch, I. A., Schahin, S. P., Bruckner, K., Radespiel-Troger, M., Fuchs, F. S., Hahn, E. G., Konturek, P. C., Lohmann, T., and Ficker, J. H. (2004). The effect of continuous positive airway pressure treatment on insulin sensitivity in patients with obstructive sleep apnoea syndrome and type 2 diabetes. Respiration 71, 252–259.
Henriksen, E. J. (2007). Improvement of insulin sensitivity by antagonism of the renin-angiotensin system. Am. J. Physiol. 293, R974–R980.
Henriksen, E. J., Jacob, S., Kinnick, T. R., Teachey, M. K., and Krekler, M. (2001). Selective angiotensin II receptor antagonism reduces insulin resistance in obese Zucker rats. Hypertension 38, 884–890.
Iiyori, N., Alonso, L. C., Li, J., Sanders, M. H., Garcia-Ocana, A., O’Doherty, R. M., Polotsky, V. Y., and O’Donnell, C. P. (2007). Intermittent hypoxia causes insulin resistance in lean mice independent of autonomic activity. Am. J. Resp. Crit. Care. Med. 175, 851–857.
Ip, M. S., Lam, B., Ng, M. M., Lam, W. K., Tsang, K. W., and Lam, K. S. (2002). Obstructive sleep apnea is independently associated with insulin resistance. Am. J. Resp. Crit. Care. Med. 165, 670–676.
Kalaria, R. N., Spoors, L., Laude, E. A., Emery, C. J., Thwaites-Bee, D., Fairlie, J., Oakley, A. E., Barer, D. H., and Barer, G. R. (2004). Hypoxia of sleep apnoea: cardiopulmonary and cerebral changes after intermittent hypoxia in rats. Respir. Physiol. Neurobiol. 140, 53–62.
Knight, W. D., Little, J. T., Carreno, F. R., Toney, G. M., Mifflin, S. W., and Cunningham, J. T. (2011). Chronic intermittent hypoxia increases blood pressure and expression of FosB/DeltaFosB in central autonomic regions. Am. J. Physiol. 301, R131–R139.
Kraiczi, H., Magga, J., Sun, X. Y., Ruskoaho, H., Zhao, X., and Hedner, J. (1999). Hypoxic pressor response, cardiac size, and natriuretic peptides are modified by long-term intermittent hypoxia. J. Appl. Physiol. 87, 2025–2031.
Kubin, L., Fenik, V. B., and Singletary, T. (2008). Effect of losartan on insulin response to glucose load in rats subjected to chronic intermittent hypoxia (CIH). Am. J. Resp. Crit. Care Med. 177, abstr. :A269.
Kubin, L., Lee, J., Swan, J. L., and Fenik, V. B. (2006). Pancreatic islets of rats exposed to chronic intermittent hypoxia (CIH) have increased levels of Munc-18 and insulin. Proc. Am. Thor. Soc. 3, abstr. :A222.
Latour, M. G., and Lautt, W. W. (2002). Insulin sensitivity regulated by feeding in the conscious unrestrained rat. Can. J. Physiol. Pharmacol. 80, 8–12.
Lesske, J., Fletcher, E. C., Bao, G., and Unger, T. (1997). Hypertension caused by chronic intermittent hypoxia – influence of chemoreceptors and sympathetic nervous system. J. Hypertens. 12, 1593–1603.
Lévy, P., Pépin, J. L., Arnaud, C., Tamisier, R., Borel, J. C., Dematteis, M., Godin-Ribuot, D., and Ribuot, C. (2008). Intermittent hypoxia and sleep-disordered breathing: current concepts and perspectives. Eur. Respir. J. 32, 1082–1095.
Li, J., Savransky, V., Nanayakkara, A., Smith, P. L., O’Donnell, C. P., and Polotsky, V. Y. (2007). Hyperlipidemia and lipid peroxidation are dependent on the severity of chronic intermittent hypoxia. J. Appl. Physiol. 102, 557–563.
Li, J., Thorne, L. N., Punjabi, N. M., Sun, C.-K., Schwarz, A. L., Smith, P. L., Marino, R. L., Rodriguez, A., Hubbard, W. C., O’Donnell, C. P., and Polotsky, V. Y. (2005). Intermittent hypoxia induces hyperlipidemia in lean mice. Circ. Res. 97, 698–706.
Li, R., Bao, G., El-Mallakh, R. S., and Fletcher, E. C. (1996). Effects of chronic episodic hypoxia on monoamine metabolism and motor activity. Physiol. Behav. 60, 1071–1076.
Li, R. C., Row, B. W., Gozal, E., Kheirandish, L., Fan, Q., Brittian, K. R., Guo, S. Z., Sachleben, L. R. Jr., and Gozal, D. (2003). Cyclooxygenase 2 and intermittent hypoxia-induced spatial deficits in the rat. Am. J. Resp. Crit. Care Med. 168, 469–475.
Louis, M., and Punjabi, N. M. (2009). Effects of acute intermittent hypoxia on glucose metabolism in awake healthy volunteers. J. Appl. Physiol. 106, 1538–1544.
Lyamina, N. P., Lyamina, S. V., Senchiknin, V. N., Mallet, R. T., Downey, H. F., and Manukhina, E. B. (2011). Normobaric hypoxia conditioning reduces blood pressure and normalizes nitric oxide synthesis in patients with arterial hypertension. J. Hypertens. 29, 2265–2272.
Marcus, N. J., Li, Y. L., Bird, C. E., Schultz, H. D., and Morgan, B. J. (2010). Chronic intermittent hypoxia augments chemoreflex control of sympathetic activity: role of the angiotensin II type 1 receptor. Respir. Physiol. Neurobiol. 171, 36–45.
McGuire, M., and Bradford, A. (2001). Chronic intermittent hypercapnic hypoxia increases pulmonary arterial pressure and haematocrit in rats. Eur. Respir. J. 18, 279–285.
Mody, P., Rukhadze, I., and Kubin, L. (2011). Rats subjected to chronic-intermittent hypoxia have increased density of noradrenergic terminals in the trigeminal sensory and motor nuclei. Neurosci. Lett. 505, 176–179.
Mohan, R. M., Golding, S., and Paterson, D. J. (2001). Intermittent hypoxia improves atrial tolerance to subsequent anoxia and reduces stress protein expression. Acta Physiol. Scand. 172, 89–95.
Naghshin, J., McGaffin, K. R., Witham, W. G., Mathier, M. A., Romano, L. C., Smith, S. H., Janczewski, A. M., Kirk, J. A., Shroff, S. G., and O’Donnell, C. P. (2009). Chronic intermittent hypoxia increases left ventricular contractility in C57BL/6J mice. J. Appl. Physiol. 107, 787–793.
Nair, D., Dayyat, E. A., Zhang, S. X., Wang, Y., and Gozal, D. (2011a). Intermittent hypoxia-induced cognitive deficits are mediated by NADPH oxidase activity in a murine model of sleep apnea. PLoS ONE 6, e19847. doi:10.1371/journal.pone.0019847
Nair, D., Zhang, S. X. L., Ramesh, V., Hakim, F., Kaushal, N., Wang, Y., and Gozal, D. (2011b). Sleep fragmentation induces cognitive deficits via nicotinamide adenine dinucleotide phosphate oxidase–dependent pathways in mouse. Am. J. Respir. Crit. Care Med. 184, 1305–1312.
Natalucci, S., Ruggeri, P., Cogo, C. E., Picchio, V., Brunori, A., and Burattini, R. (2003). Age-related analysis of glucose metabolism in spontaneously hypertensive and normotensive rats. Exp. Physiol. 88, 399–404.
Netchiporouk, L., Shram, N., Salvert, D., and Cespuglio, R. (2001). Brain extracellular glucose assessed by voltametry throughout the rat sleep-wake cycle. Eur. J. Neurosci. 13, 1429–1434.
Neubauer, J. A. (2001). Invited review: physiological and pathophysiological responses to intermittent hypoxia. J. Appl. Physiol. 90, 1593–1599.
Newman, A. B., Nieto, F. J., Guidry, U., Lind, B. K., Redline, S., Pickering, T. G., Quan, S. F., and Sleep Heart Health Study Research Group. (2001). Relation of sleep-disordered breathing to cardiovascular disease risk factors: the Sleep Heart Health Study. Am. J. Epidemiol. 154, 50–59.
Ogihara, T., Asano, T., Ando, K., Chiba, Y., Sakoda, H., Anai, M., Shojima, N., Ono, H., Onishi, Y., Fujishiro, M., Katagiri, H., Fukushima, Y., Kikuchi, M., Noguchi, N., Aburatani, H., Komuro, I., and Fujita, T. (2002). Angiotensin II-induced insulin resistance is associated with enhanced insulin signaling. Hypertension 40, 872–879.
Pépin, J. L., Lévy, P., Garcin, A., Feuerstein, C., and Savasta, M. (1996). Effects of long-term hypoxia on tyrosine hydroxylase protein content in catecholaminergic rat brainstem areas: a quantitative autoradiographic study. Brain Res. 733, 1–8.
Peppard, P. E., Young, T., Palta, M., and Skatrud, J. (2000). Prospective study of the association between sleep-disordered breathing and hypertension. N. Engl. J. Med. 342, 1378–1384.
Polotsky, V. Y., Li, J., Punjabi, N. M., Rubin, A. E., Smith, P. L., Schwartz, A. R., and O’Donnell, C. P. (2003). Intermittent hypoxia increases insulin resistance in genetically obese mice. J. Physiol. 552, 253–264.
Prabhakar, N. R., and Kumar, G. K. (2004). Oxidative stress in the systemic and cellular responses to intermittent hypoxia. J. Biol. Chem. 385, 217–221.
Punjabi, N. M., and Polotsky, V. Y. (2005). Disorders of glucose metabolism in sleep apnea. J. Appl. Physiol. 99, 1998–2007.
Punjabi, N. M., Sorkin, J. D., Katzel, L. I., Goldberg, A. P., Schwartz, A. R., and Smith, P. L. (2002). Sleep-disordered breathing and insulin resistance in middle-aged and overweight men. Am. J. Respir. Crit. Care. Med. 165, 677–682.
Reeves, S. R., Gozal, E., Guo, S. Z., Sachleben, L. R. Jr., Brittian, K. R., Lipton, A. J., and Gozal, D. (2003). Effect of long-term intermittent and sustained hypoxia on hypoxic ventilatory and metabolic responses in the adult rat. J. Appl. Physiol. 95, 1767–1774.
Rukhadze, I., Fenik, V. B., Benincasa, K. E., Price, A., and Kubin, L. (2010). Chronic-intermittent hypoxia alters density of aminergic terminals and receptors in the hypoglossal motor nucleus. Am. J. Respir. Crit. Care Med. 182, 1321–1329.
Serebrovskaya, T. V., Manukhina, E. B., Smith, M. L., Downey, H. F., and Mallet, R. T. (2008). Intermittent hypoxia: cause of or therapy for systemic hypertension? Exp. Biol. Med. 233, 627–650.
Spiegel, K., Leproult, R., and Van Cauter, E. (1999). Impact of sleep debt on metabolic and endocrine function. Lancet 354, 1435–1439.
Stettner, G. M., Fenik, V. B., and Kubin, L. (2012). Effect of chronic-intermittent hypoxia on noradrenergic activation of hypoglossal motoneurons. J. Appl. Physiol. 112, 305–312.
Tamisier, R., Pépin, J. L., Remy, J., Baguet, J. P., Taylor, J. A., Weiss, J. W., and Lévy, P. (2011). 14 nights of intermittent hypoxia elevate daytime blood pressure and sympathetic activity in healthy humans. Eur. Respir. J. 37, 119–128.
Tasali, E., and Ip, M. S. (2008). Obstructive sleep apnea and metabolic syndrome: alterations in glucose metabolism and inflammation. Proc. Am. Thorac. Soc. 5, 207–217.
Tatsumi, K., Kasahara, Y., Kurosu, K., Tanabe, N., Takiguchi, Y., and Kuriyama, T. (2005). Sleep oxygen desaturation and circulating leptin in obstructive sleep apnea-hypopnea syndrome. Chest 127, 716–721.
Tonini, J., Michallet, A. S., Flore, P., Nespoulet, H., Pépin, J. L., Wuyam, B., Lévy, P., and Tamisier, R. (2011). Effect of chronic intermittent hypoxia on exercise adaptations in healthy subjects. Respir. Physiol. Neurobiol. 179, 287–293.
Veasey, S. C., Davis, C. W., Fenik, P., Zhan, G., Hsu, Y. J., Pratico, D., and Gow, A. (2004). Long-term intermittent hypoxia in mice: protracted hypersomnolence with oxidative injury to sleep-wake brain regions. Sleep 27, 194–201.
Vicini, P., Avogaro, A., Spilker, M. E., Gallo, A., and Cobelli, C. (2002). Epinephrine effects on insulin-glucose dynamics: the labeled IVGTT two-compartment minimal model approach. Am. J. Physiol. 283, E78–E84.
Weyer, C., Bogardus, C., Mott, D. M., and Pratley, R. E. (1999). The natural history of insulin secretory dysfunction and insulin resistance in the pathogenesis of type 2 diabetes mellitus. J. Clin. Invest. 104, 787–794.
Xu, J., Long, Y. S., Gozal, D., and Epstein, P. N. (2009). Beta-cell death and proliferation after intermittent hypoxia: role of oxidative stress. Free Radic. Biol. Med. 46, 783–790.
Yokoe, T., Alonso, L. C., Romano, L. C., Rosa, T. C., O’Doherty, R. M., Garcia-Ocana, A., Minoguchi, K., and O’Donnell, C. P. (2008). Intermittent hypoxia reverses the diurnal glucose rhythm and causes pancreatic beta-cell replication in mice. J. Physiol. 586, 899–911.
Keywords: angiotensin II, blood pressure, diabetes, intravenous glucose-tolerance test, insulin, norepinephrine, obstructive sleep apnea, sympathetic system
Citation: Fenik VB, Singletary T, Branconi JL, Davies RO and Kubin L (2012) Glucoregulatory consequences and cardiorespiratory parameters in rats exposed to chronic–intermittent hypoxia: effects of the duration of exposure and losartan. Front. Neur. 3:51. doi: 10.3389/fneur.2012.00051
Received: 15 December 2011; Paper pending published: 03 February 2012;
Accepted: 20 March 2012; Published online: 09 April 2012.
Edited by:
Pierre-Charles Neuzeret, Lyon Neuroscience Research Center, FranceReviewed by:
Ramesh Vijay, University of Chicago Medical Center, USAIrma Gvilia, Ilia State University, USA
Copyright: © 2012 Fenik, Singletary, Branconi, Davies and Kubin. This is an open-access article distributed under the terms of the Creative Commons Attribution Non Commercial License, which permits non-commercial use, distribution, and reproduction in other forums, provided the original authors and source are credited.
*Correspondence: Leszek Kubin, Department of Animal Biology 209E/VET, School of Veterinary Medicine, University of Pennsylvania, 3800 Spruce Street, Philadelphia, PA 19104-6046, USA. e-mail: lkubin@vet.upenn.edu