
- 1 Neuroimaging, Max Planck Institute of Psychiatry, Munich, Germany
- 2 Centro Atómico Bariloche, Instituto Balseiro, CONICET, Bariloche, Argentina
Frontal and parietal regions are associated with some of the most complex cognitive functions, and several frontoparietal resting-state networks can be observed in wakefulness. We used functional magnetic resonance imaging data acquired in polysomnographically validated wakefulness, light sleep, and slow-wave sleep to examine the hierarchical structure of a low-frequency functional brain network, and to examine whether frontoparietal connectivity would disintegrate in sleep. Whole-brain analyses with hierarchical cluster analysis on predefined atlases were performed, as well as regression of inferior parietal lobules (IPL) seeds against all voxels in the brain, and an evaluation of the integrity of voxel time-courses in subcortical regions-of-interest. We observed that frontoparietal functional connectivity disintegrated in sleep stage 1 and was absent in deeper sleep stages. Slow-wave sleep was characterized by strong hierarchical clustering of local submodules. Frontoparietal connectivity between IPL and superior medial and right frontal gyrus was lower in sleep stages than in wakefulness. Moreover, thalamus voxels showed maintained integrity in sleep stage 1, making intrathalamic desynchronization an unlikely source of reduced thalamocortical connectivity in this sleep stage. Our data suggest a transition from a globally integrated functional brain network in wakefulness to a disintegrated network consisting of local submodules in slow-wave sleep, in which frontoparietal inter-modular nodes may play a role, possibly in combination with the thalamus.
Introduction
Ultraslow fluctuations (<0.1 Hz) of the blood oxygen level dependent (BOLD) signal measured by functional magnetic resonance imaging (fMRI) have spatial correlations in functionally related brain regions (Fox and Raichle, 2007). These functionally comprehensive networks of regions are consistently observed throughout multiple time-series analyses, such as correlation against the time-course of a particular seed region (Biswal et al., 1995; Fox et al., 2005; Fox and Raichle, 2007) or spatiotemporal independent component analysis (ICA; Beckmann et al., 2005; Damoiseaux et al., 2006). Although these networks are typically analyzed in so-called “resting-state fMRI” without subject’s engagement in a particular task, their neural circuitry matches fMRI-activations in specific sensory, motor, and cognitive tasks (Fox and Raichle, 2007).
Resting-state networks can therefore be separated into sensory networks such as sensorimotor, auditory, and visual networks and into more “cognitive” networks such as frontoparietal networks, attention networks, and the “default mode network” (DMN; Fox et al., 2005; Damoiseaux et al., 2006; Fox and Raichle, 2007; Larson-Prior et al., 2009). The DMN, consisting of anterior and posterior regions on the cingulum tract and bilateral inferior parietal lobules (IPL)/angular gyrus, has received most scientific attention because of its task-negative activity pattern and because of its proposed involvement in episodic memory retrieval (Buckner et al., 2008), imagination of future outcomes (Andrews-Hanna et al., 2010), and internal versus external awareness (Boly et al., 2008), and its possible role as a marker for psychiatric (Greicius et al., 2007) and neurological disorders (Greicius et al., 2004).
Previous studies on simultaneous electroencephalography (EEG)/fMRI acquired in sleep have reported that, in general, functional connectivity is maintained in light sleep (Horovitz et al., 2008; Larson-Prior et al., 2009; Sämann et al., 2011). DMN connectivity is largely maintained in light sleep (Horovitz et al., 2008; Larson-Prior et al., 2009; Koike et al., 2011; Sämann et al., 2011), with some alterations in posterior nodes and the hippocampal complex (Andrade et al., 2011; Sämann et al., 2011). A subsequent breakdown of anterior–posterior connectivity in the DMN has been noted in slow-wave sleep (Horovitz et al., 2009; Sämann et al., 2011), with an additional increase in connection strength within the posterior nodes in slow-wave sleep (Horovitz et al., 2009). Larson-Prior et al. (2009) reported no significant changes in functional connectivity in various sensory and cognitive resting networks from wakefulness to light sleep, whereas an increase in functional connectivity was observed in the dorsal attention network. Horovitz et al. (2008) found an increase in BOLD signal fluctuations in the visual and auditory cortices and the precuneus, while an increase of activity in the left precuneus and bilateral IPL has been observed in early sleep stage 1 specifically (Picchioni et al., 2008). These results are largely in line with EEG studies, which reported increased neocortical connectivity (EEG synchronization) in specific frequency bands during sleep (Ferri et al., 2007, 2008; Dimitriadis et al., 2009).
The network specificity of these results calls for an approach that allows examination of brain regions from multiple networks. In a whole-brain approach, time-courses are extracted from anatomically predefined seeds or from seeds obtained from previous functional connectivity studies. Evaluation of the temporal coherence results in covariance matrices that can be treated as a large-scale functional brain network consisting of nodes and (weighted or binarized) edges. The changes in network connections across stages will be helpful to understand the brain’s functional network throughout different states of vigilance and consciousness. Particularly interesting are changes in the connection strength and the topology of this network, such as its “small-worldness” and modular organization. A small-world topology describes a network characterized by high local clustering of nodes (“cliqueness”) while retaining short characteristic path length between nodes (Watts and Strogat, 1998), allowing efficient information processing at low wiring/maintenance costs (Bullmore and Sporns, 2009). Graph theory analysis has indeed revealed a “small-world” organization of large-scale anatomical and functional brain networks in wakefulness (Achard et al., 2006; Hagmann et al., 2008; Bullmore and Sporns, 2009).
We have recently reported that both general connectivity strength and small-worldness of a large-scale functional brain network changes throughout human non-rapid eye movement (NREM) sleep (Spoormaker et al., 2010). Connectivity strength was highest in light sleep stages, lowest in slow-wave sleep, with wakefulness having intermediate values. A small-world topology as observed in wakefulness moved toward randomness in light sleep stages 1 and 2, manifest in strongly reduced local clustering ratios. In contrast, slow-wave sleep was characterized by an increase in local clustering, which in combination with a reduction in long distance (>75 mm) functional connectivity reflected a move toward a network with less global integration (Spoormaker et al., 2010). The increase of global connection strength in light sleep has also been observed in a recent whole-brain analysis (Larson-Prior et al., 2011), in which a disintegration of the global network was already noted in sleep stage 2. Moreover, shifts in network community structure were observed in stage 1 and stage 2 sleep (Larson-Prior et al., 2011).
We have previously observed robust changes in functional connectivity in higher-order association cortices (Spoormaker et al., 2010), which is critical as these areas are typically involved in inter-modular whole-brain integration rather than intra-modular processing. Interestingly, such well connected, inter-modular nodes can show up as one separate cluster in a hierarchical cluster analysis (Prignano and Diaz-Guilera, 2012), see Figure 1A. Previous studies employing hierarchical clustering analysis on human functional brain networks have revealed a robust hierarchical organization in limbic, subcortical and several neocortical clusters that have a functional and local proximity (Salvador et al., 2005; Ferrarini et al., 2009). In a hierarchical clustering of wakefulness, we observed three (out of 11) clusters with long-range (medial and lateral) frontoparietal connectivity patterns (Gleiser and Spoormaker, 2010). These frontoparietal regions are associated with some of the most complex cognitive functions in humans (Corbetta and Shulman, 2002). Moreover, diffusion-tensor imaging has shown that several prefrontal and parietal regions, together with subcortical regions including the thalamus, form a club of hub nodes that are densely connected with each other (van den Heuvel and Sporns, 2011), a so-called rich-club organization. We have already observed removal of the thalamus from the whole-brain network at sleep onset (Spoormaker et al., 2010), and for this analysis, we examined whether inter-modular (frontoparietal) connectivity would disintegrate in sleep (see Figure 1B). Furthermore, we aimed to examine the possibility that reduced thalamocortical connectivity at sleep onset (Spoormaker et al., 2010) was due to decreased integrity in the thalamus signal.
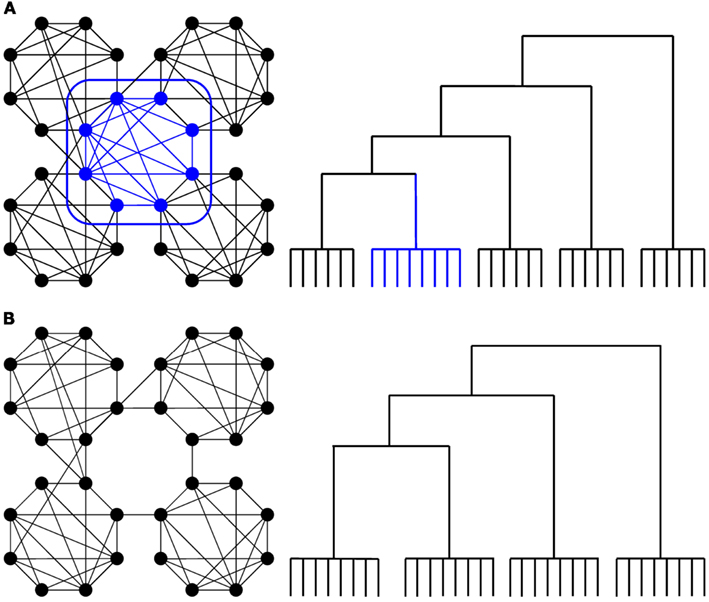
Figure 1. (A) Schematic depiction of nodes with inter-modular connections (in blue), based on an example from (Zamora-López et al., 2010), which can show up as a separate cluster in a hierarchical cluster analysis (Prignano and Diaz-Guilera, 2012, see Figure 7 at http://arxiv.org/abs/1102.5294) as depicted in an example provided in the right panel. (B) Our expectation was that inter-modular (frontoparietal) connectivity would disintegrate in sleep.
Materials and Methods
EEG/fMRI Data Recording and Preprocessing
Our data recording and preprocessing steps have been described in detail elsewhere (Spoormaker et al., 2010) and will only be recapitulated briefly. We measured 40 fMRI runs of 26.7 min in the late evening in 25 young healthy subjects (13 females). Polysomnographic recordings were performed using an MR-compatible EEG system placed according to the international 10/20 electrode system with 19 EEG channels referenced against FCz, an electrooculogram, submental electromyogram, and an electrocardiogram (sampling rate 5 kHz; EasyCAP modified for sleep, Hersching, Germany; VisionRecorder Version 1.03, BrainProducts, Gilching, Germany). fMRI was carried out at 1.5 Tesla (Signa LX, GE, Milwaukee, USA) using an eight-channel head coil and a total of 800 functional whole-brain images were acquired per run (EPI; repetition time 2000 ms; echo time 40 ms; flip angle 90°; 64 × 64 matrix, in-plane resolution 3.4 mm × 3.4 mm; 25 slices; slice thickness 3 mm; gap 1 mm; oriented along AC–PC). From these 40 runs, 92 epochs of 5 min were identified that contained the continued presence of one sleep stage (at least 85% of the epoch should contain one particular stage), resulting in 27 wakefulness, 24 sleep stage 1, 24 sleep stage 2 and 18 slow-wave sleep epochs. One sleep stage 1 epoch was discarded due to technical problems. Nuisance variables such as signal fluctuations in the white matter and cerebrospinal fluid and six movement vectors and their first-order derivatives were entered as regressors in first level analyses. The residual images of these first level analyses were subsequently used for time-course extraction according to the automated anatomic labeling atlas (Tzourio-Mazoyer et al., 2002). Time-courses underwent a maximum overlap discrete wavelet transform resulting in multiple levels; our main focus will lie on the frequency-band 0.03–0.07 Hz (Achard et al., 2006; Spoormaker et al., 2010). Correlations matrices were thresholded from 25 to 50% connection probability to obtain binarized graphs that allowed between-stage comparisons with equal amounts of edges.
Hierarchical Cluster and Modularity Analysis
The correlation matrices were averaged per stage and used in the hierarchical cluster analysis that consisted of Ward’s method (Ward, 1963), which employs an analysis of variance approach to hierarchical clustering and appears useful to detect hierarchy in functional brain networks (Gleiser and Spoormaker, 2010). To evaluate modularity structure quantitatively as well, the optimal modularity coefficient Q was computed at epoch-wise matrices through an algorithm by Newman (2006) as implemented in the Brain Connectivity Toolbox (Rubinov and Sporns, 2010). These values were subsequently tested on the effect of sleep stage in a linear mixed models analysis of variance that controlled for individual nestedness in the data (e.g. one subject could have an epoch in wakefulness and sleep stage 2), as implemented in SPSS version 16.0. A significance level of p < 0.05 was used for this analysis.
Frontoparietal Connectivity
To quantitatively examine whether frontoparietal networks would become less well integrated in sleep, we performed seed analyses in SPM81. We used two IPL seeds defined as “frontoparietal” seeds in a large-scale functional connectivity study (Dosenbach et al., 2010). Our seeds had a 6 mm radius and included the left IPL at [−48 −47 49] and the right IPL at [44 −52 47] in MNI-space. Time-courses were extracted from the same residual images as described previously, with the one main difference that these residual images were first low-pass filtered (<0.1 Hz) in FSL 3.22. These time-courses were subsequently used in an additional first level analysis to test which voxels showed similar time-courses; the resulting statistical maps were tested in a full factorial model with sleep stage as factor. To examine the specificity of these results regarding the changes in cortical connectivity, we further examined two control seeds throughout wakefulness and sleep. The seeds were chosen from the same functional connectivity study (Dosenbach et al., 2010), in close proximity to the seeds used by Larson-Prior et al. (2009), comprising the left calcarine gyrus at [−5 −80 9] and right calcarine gyrus at [13 −91 2] for the medial visual network.
To control for nestedness in the main findings due to subjects having epochs in various sleep stages as described in the previous section, we re-ran the analyses with linear mixed models as implemented in SPSS 16.0, correcting for the variable subject ID (Spoormaker et al., 2010; Andrade et al., 2011). If a cluster was significant in the wakefulness > sleep contrast, we extracted the first eigenvariate of the contrast estimate values from the first level contrasts centered around the peak voxel (with a radius of 6 mm).
Differential statistical maps (e.g. wakefulness > sleep stages) were sampled at a threshold of p < 0.001 and a cluster based (whole-brain) multiple test correction procedure was employed, with significance defined as cluster p-values <0.05 after correction for family-wise error under consideration of non-stationary smoothness (Hayasaka et al., 2004). All statistical parametric maps are shown in neurological convention.
Cross-Validation with Other Atlases
In a simulation study, Smith et al. (2011) noted that the use of functionally inaccurate regions-of-interest (ROIs including multiple signals) impaired network estimation, which lead the authors to the conclusion that network results from structural atlases should be regarded with great caution for network estimation. A conceptual issue is that structural atlases typically consist of regions much smaller than low dimensional ICA-derived resting-state networks, limiting the effect of source combination at the coarsest level. Moreover, between-stage connectivity differences may be less affected than within stage connectivity patterns. We therefore examined whether we would observe the effects reported in our previous AAL-based analysis with other atlases. We chose the Harvard–Oxford atlas (see text footnote 2) and the atlas by Dosenbach et al. (2010) described above (equally sized, non-overlapping regions) that has a low probability of mixing signals due to small node sizes (6 mm radius). We specifically tested whether the effect of sleep would be the same for general connectivity, shortest path length, and clustering for a range of thresholds.
Voxelwise Time-Course Analyses
To evaluate whether thalamus voxels lost their integrity in the descent from wakefulness to light sleep stage 1, we extracted time-courses of thalamic voxels from data that had been temporally low-pass filtered (see section “Frontoparietal Connectivity”). We examined the variance explained of the first principal component of the voxelwise time-courses of the left and right thalamus in a subset of subjects that had both wakefulness and sleep stage 1 epochs (N = 10). We also included the left and right putamen as control regions of similar voxel size (between 1000 and 1100 voxels), and re-run the analysis for the second principal component. Paired t-tests were performed to examine the significance of the stage differences.
Results
Hierarchy and Modularity in Sleep
The qualitative hierarchical cluster analysis revealed that three frontoparietal clusters were present in wakefulness (S0), only one in sleep stage 1 (S1), and none in deeper sleep stages (see Figure 2; Figure S1 in Supplementary Material). Sleep stage 1 was further characterized by an exclusion of the bilateral thalamus from the subcortical cluster. Slow-wave sleep was characterized by a high local clustering, wakefulness by a few long-range clusters, whereas sleep stages 1 and 2 had a more random appearing hierarchical cluster organization. Note that in slow-wave sleep, prefrontal, and parietal regions formed multiple clusters. Our quantitative modularity analysis revealed a significant effect of sleep on the modularity coefficient Q, F(3,85) = 8.64, p < 0.001. Post hoc tests revealed that values in light sleep were lower than in slow-wave sleep, all p < 0.001, and in wakefulness, all p < 0.05, and that values in wakefulness were lower than in slow-wave sleep, p < 0.05.
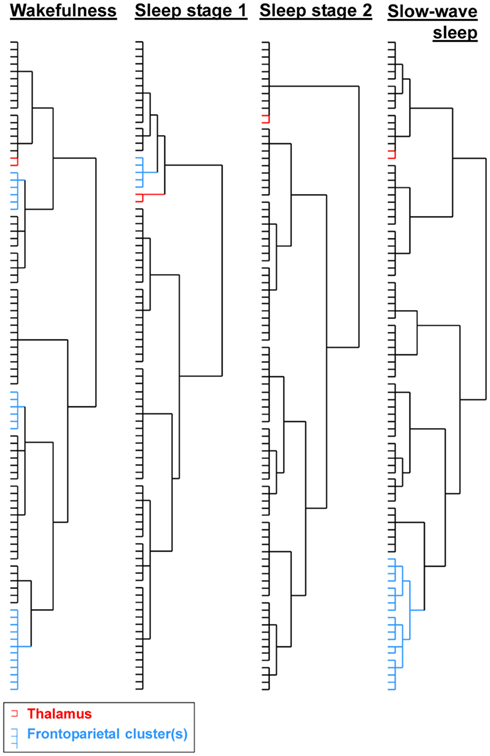
Figure 2. Results of the hierarchical cluster analyses on the averaged correlation matrices per sleep stage. Clusters containing bilateral frontoparietal regions were only observed in wakefulness, whereas sleep stage 1 still contained one cluster involving prefrontal regions and one parietal region. The bilateral thalamus was removed from the subcortical cluster and formed a separate cluster in sleep stage 1; slow-wave sleep was characterized by a high hierarchical clustering. See Figure S1 in Supplementary Material for full dendograms with region names.
Frontoparietal Connectivity in Sleep
We observed a frontoparietal network with the seeds in the IPLs in wakefulness (Table 1; Figure 3). Results are reported for the seed in the left IPL; results were comparable for the seed in the right IPL.
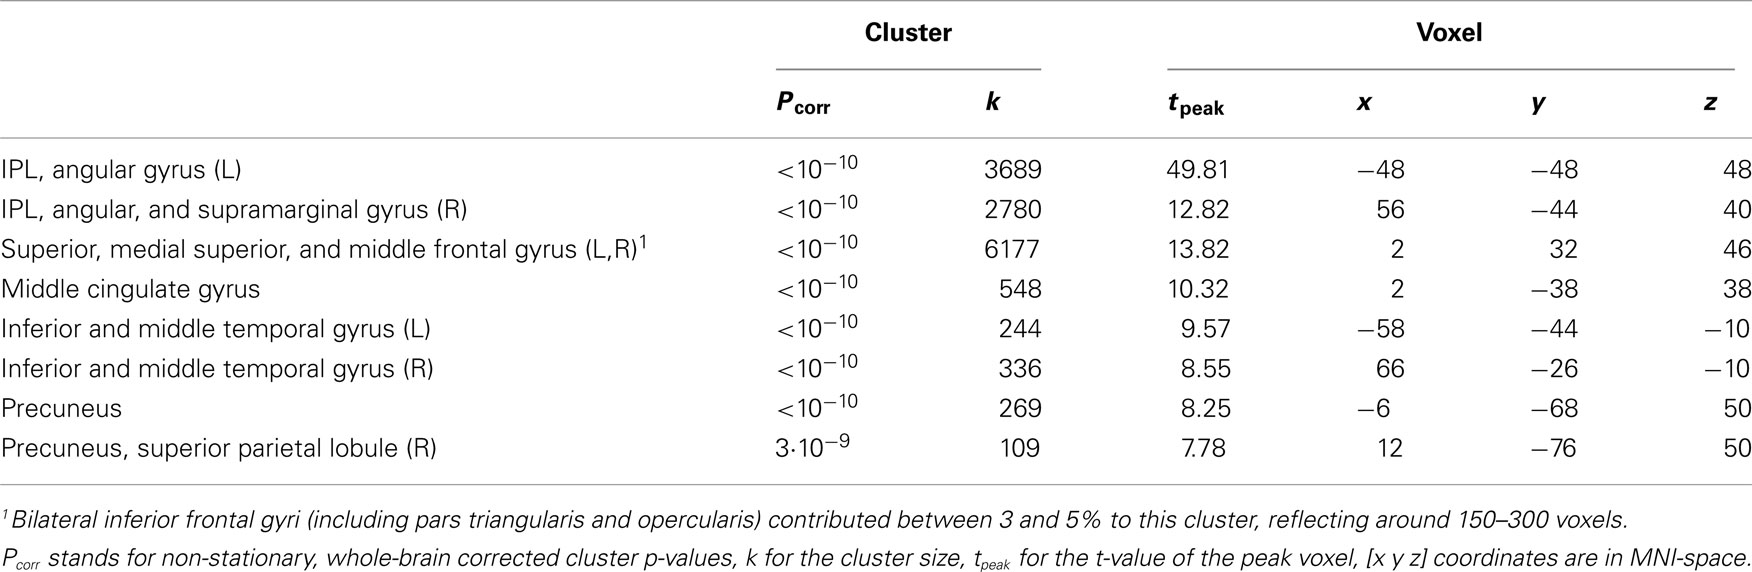
Table 1. Regions activated in the positive contrast in wakefulness of the time-course of the left inferior parietal lobule (IPL) thresholded at pFWE < 0.001, k > 50.
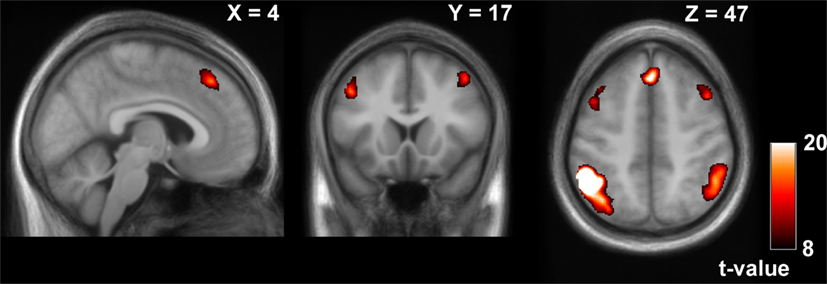
Figure 3. Positive contrast of the time-course of the left inferior parietal lobule (IPL) in wakefulness (thresholded at pFWE < 0.0001, k > 50), reflecting frontoparietal network connectivity.
The differential contrast S0 > S1/S2/SW (contrast weights +3 −1 −1 −1) revealed significant clusters in the bilateral medial superior frontal gyrus and in the left caudate, pcorr < 0.05. Clusters in dorsolateral prefrontal regions were noted but did not have whole-brain corrected significance for the left IPL seed (see Table 2; Figure 4A). The analysis with the seed in the right IPL revealed the same clusters in the bilateral medial superior frontal gyrus and in the right middle frontal gyrus, both with whole-brain corrected significance (pcorr = 0.013 and 0.007, see Table 2; Figure 4B).
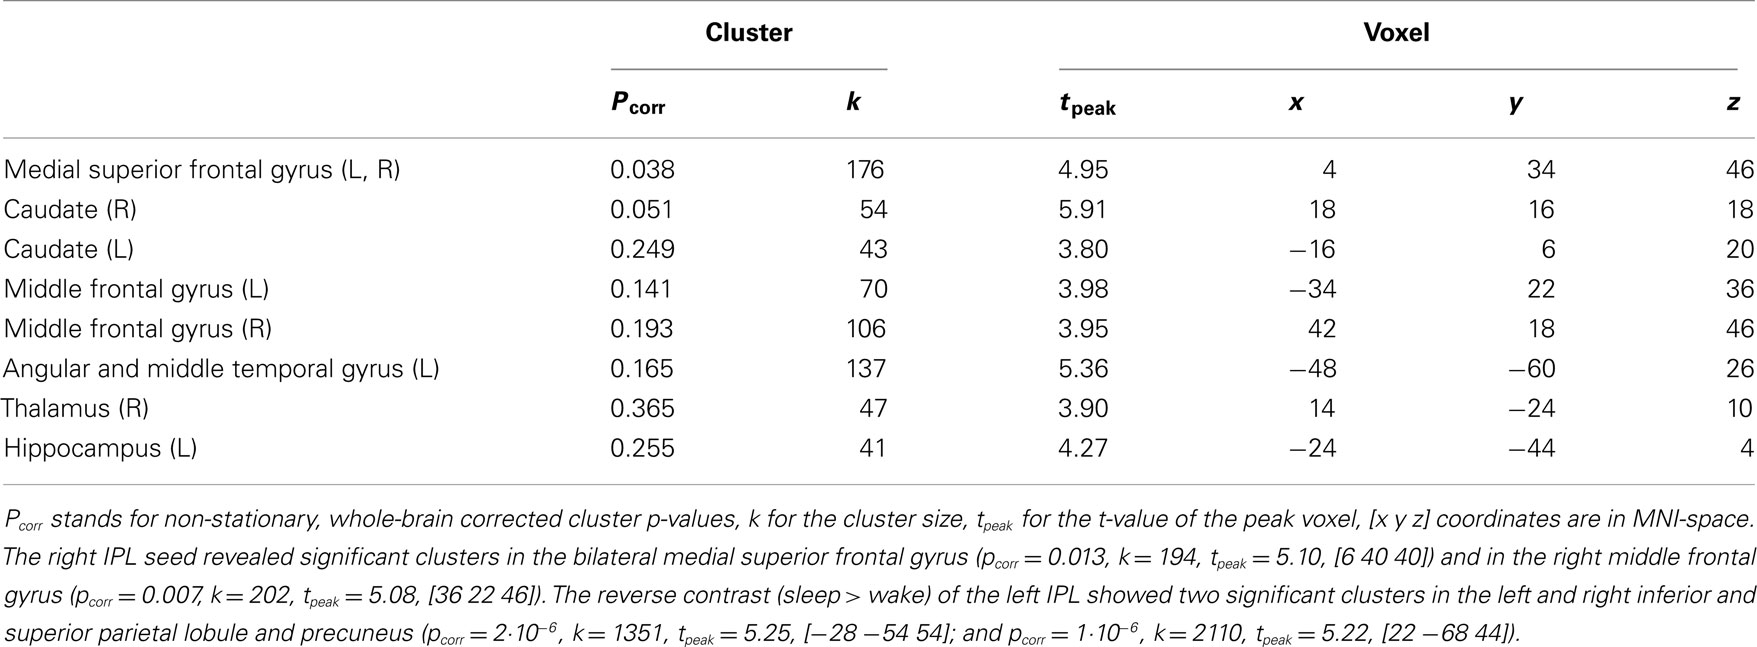
Table 2. Regions activated in the differential contrast of wakefulness larger than sleep stages (S0 > S1/S2/SW) of the time-course of the left inferior parietal lobule (IPL) thresholded at p < 0.001, k > 40.
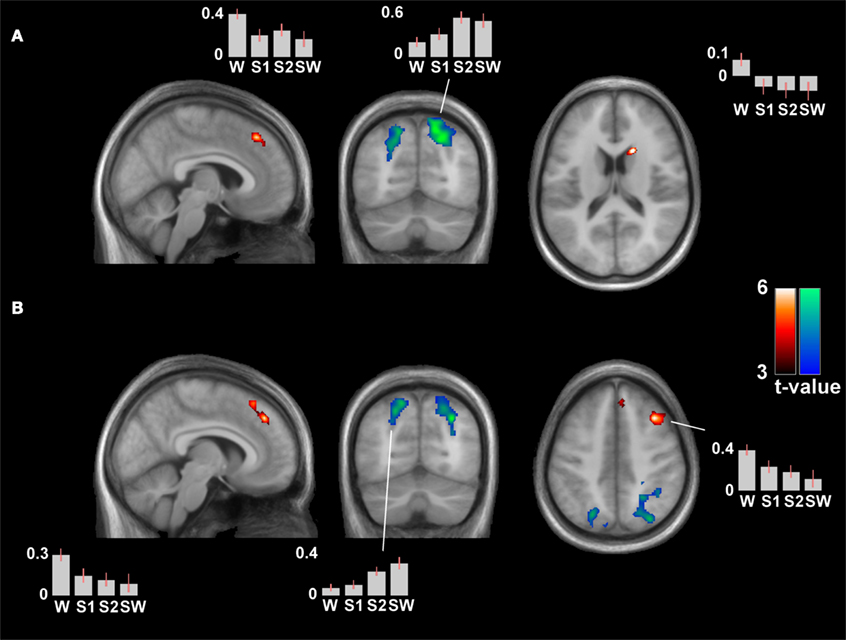
Figure 4. Differential contrasts (wakefulness versus sleep) of the connectivity patterns of the time-course of the left (A) and right inferior parietal lobule (B). Wakefulness > sleep is represented by hot colors, the reverse contrast by cool colors. Depicted clusters have whole-brain corrected significance: the superior medial frontal gyrus and right caudate in (A), and the superior medial frontal gyrus and right middle frontal gyrus in (B). The right middle frontal gyrus was also noted in (A) at an uncorrected threshold (pcorr = 0.141). There was a generally increased (local) connectivity with neighboring parietal clusters in sleep. Contrast estimates are provided of peak voxels of significant clusters (for coordinates, see Table 2). MNI coordinates of slices in (A) [x y z] = [5 −67 17], and in (B) [7 −68 45].
Contrast estimates revealed most pronounced differences between wakefulness and sleep stages, rather than among sleep stages (see Figure 4). Linear mixed models to control for nestedness showed significant main effects of sleep on contrast estimates in the bilateral medial superior frontal gyrus, F(3,84.3) = 8.91, p < 0.001, and the right caudate, F(3,85.9) = 9.55, p < 0.001, for the left IPL seed analysis, and in the bilateral medial superior frontal gyrus, F(3,83.3) = 6.55, p < 0.001, and right middle frontal gyrus, F(3,85.3) = 10.17, p < 0.001, for the right IPL seed analysis. All post hoc tests showed S0 > S1/S2/SW at p < 0.005, and only the right middle frontal gyrus had a nominal significant difference between two sleep stages (S1 > SW, see Figure 4 for contrast estimates).
Control Network Analyses: Global Connectivity in Wakefulness, Local Connectivity in Sleep
The connectivity analysis of the left calcarine gyrus seed revealed significant differences in the contrast wakefulness > sleep stages in the bilateral thalamus (pcorr = 1·10−4, k = 508), left pallidum (pcorr = 0.031, k = 79) and right hippocampus and parahippocampal gyrus (pcorr = 0.003, k = 183), see Figure 5. These results were mirrored in the same contrast of the connectivity analysis of the right calcarine gyrus seed, with significant differences in the in the bilateral thalamus (pcorr = 0.005, k = 228), right pallidum and caudate (pcorr = 0.038, k = 53), and left hippocampus (pcorr = 0.083, k = 60).
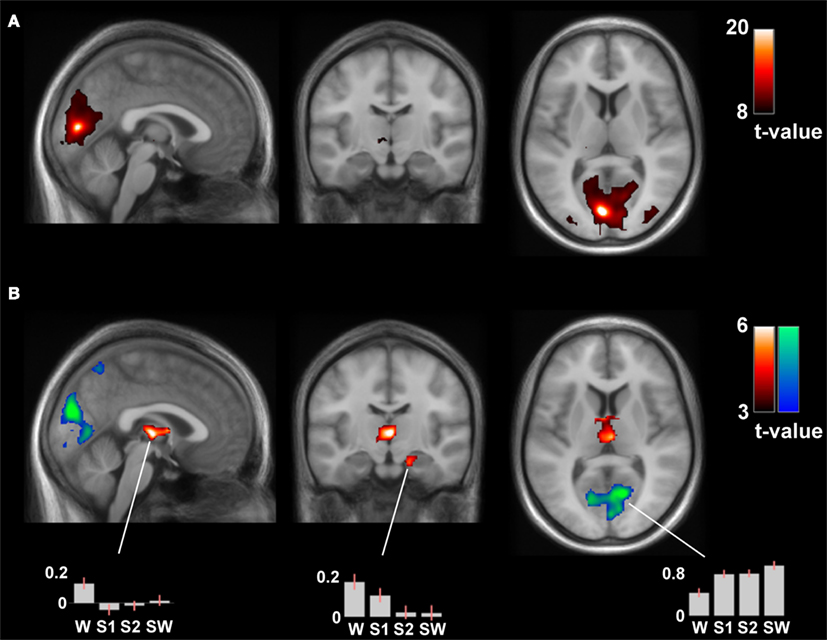
Figure 5. (A) Positive contrast of the time-course of the left calcarine gyrus in wakefulness (thresholded at pFWE < 0.0001, k > 50), reflecting medial visual network connectivity. (B) The differential contrast (wakefulness > sleep) of the connectivity analysis of the left calcarine gyrus seed revealed significant differences in the bilateral thalamus, left pallidum, and right hippocampus and parahippocampal gyrus (hot colors). The reverse contrast (sleep > wakefulness) revealed increased local connectivity patterns (cool colors). These results were mirrored in the connectivity analysis of the right calcarine gyrus seed. MNI coordinates of slices: [x y z] = [−1 −15 8].
The reverse contrast (sleep stages > wakefulness) only revealed increased local connectivity patterns. There was increased connectivity of the left calcarine gyrus seed with significant clusters in the bilateral cuneus, lingual, and calcarine gyrus (pcorr = 7·10−7, k = 3505) and the bilateral precuneus (pcorr = 0.018, k = 232) in sleep, see Figure 5. This closely matched the results from the right calcarine gyrus seed, significant clusters in the bilateral cuneus, lingual, and calcarine gyrus (pcorr = 6·10−7, k = 3168) and the left precuneus (pcorr = 0.002, k = 413) in sleep. Interestingly, also the left IPL seed showed increased local connectivity in sleep stages compared to wakefulness, with significant clusters in the left inferior and superior parietal lobule, precuneus, middle, and superior occipital gyrus (pcorr = 2·10−6, k = 1351) and in the right inferior and superior parietal lobule, precuneus, superior occipital, and postcentral gyrus (pcorr = 1·10−6, k = 2110). These two clusters were also observed with the contralateral IPL seed (pcorr < 7·10−5, k > 700).
Atlas Cross-Validation
In line with our previous reports on the AAL-atlas, the effect of sleep on general connectivity was significant for the other atlases: F(3,88) = 4.08 for the Harvard–Oxford atlas, F(3,88) = 4.11 for the Dosenbach atlas, all p < 0.01 and with post hoc tests revealing higher values in light sleep stages 1 and 2 than in wakefulness and slow-wave sleep (p < 0.05). Also in line with our previous report is that we did not observe any effect of sleep on shortest path length with any atlas, all F(3,88) < 0.35, all p > 0.50, but that we did observe a trend-wise effect of sleep on clustering, F(3,88) = 2.30, p = 0.083, for the Harvard–Oxford atlas, and a significant effect of sleep on clustering, F(3,88) = 3.28, p = 0.025, for the Dosenbach atlas, with post hoc tests revealing highest values in slow-wave sleep (p < 0.05).
Integrity of Thalamus Voxels
We did not observe a decrease in the variance explained by the first principal component in any of the regions (left and right thalamus and putamen) in sleep stage 1 compared to wakefulness, but instead we observed a trend for an increase of the variance explained from 24.5 (±8.7) to 32.4 (±8.1)%, t(9) = 1.92, p = 0.087, for the left thalamus. This increase appeared due to one outlier that showed a 30% increase in variance explained by the first principal component, versus [−10; 18%] for the other subjects. Without this subject, the difference diminished, t(8) = 1.48, p = 0.176 (see Table 3). There were no differences for the right thalamus with this subject included or excluded, t(9) = 1.4, p = 0.193, and t(8) = 0.89, p = 0.400. Similar weak increases (Cohen’s d between 0.33 and 0.50) were observed for the putamen (see Table 3). No differences were observed for the second principal component, explaining between 12 and 15% of the variance, all t < 1.25, all p > 0.250.
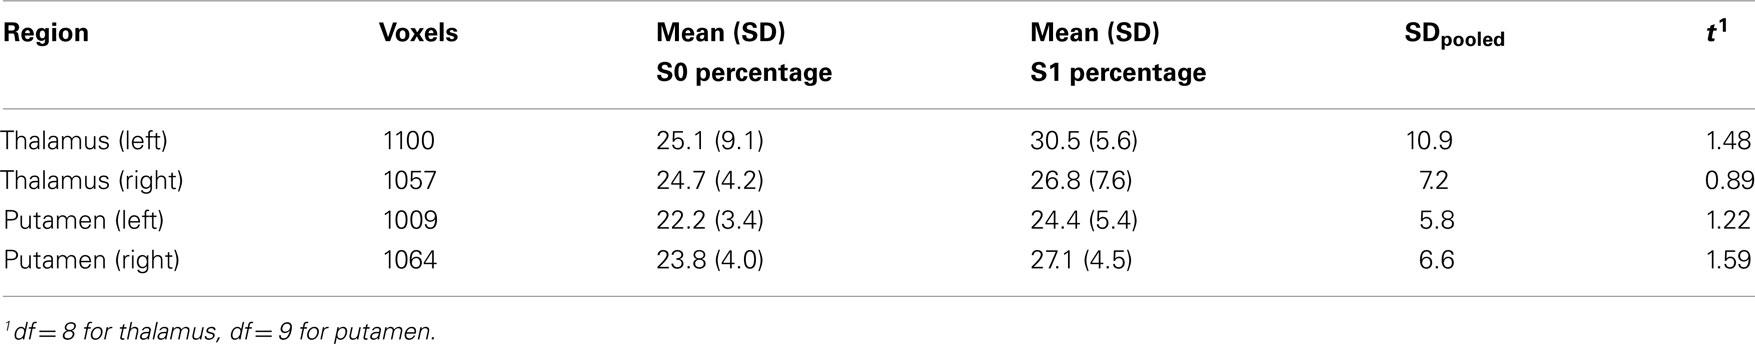
Table 3. Percentage variance explained by the first principal component of the voxelwise time-courses of a particular subcortical region in wakefulness and light sleep stage 1.
Discussion
Our hierarchical cluster analysis illustrated that frontoparietal clusters could be detected in wakefulness but not in deeper NREM sleep stages. This was quantitatively verified with an analysis in which we correlated the time-course of the left and right IPL to all voxels in the brain and observed reduced connectivity in all sleep stages compared to wakefulness in medial superior frontal gyrus and the dorsolateral prefrontal cortex. These frontoparietal clusters are part of a densely inter-connected club of hubs (van den Heuvel and Sporns, 2011) and support some of the most complex cognitive functions (Corbetta and Shulman, 2002), and their disintegration started already in sleep stage 1, with just one of the original frontoparietal clusters being partially present. This reduced frontoparietal connectivity contrasts with the general increase in functional connectivity observed in light sleep stages (Spoormaker et al., 2010; Larson-Prior et al., 2011) and the increase we observe in local connectivity within frontoparietal and visual networks. Although a breakdown of connectivity between medial prefrontal cortex and precuneus/posterior cingulate has been observed in slow-wave sleep (Horovitz et al., 2009; Sämann et al., 2011), changes in connectivity of these DMN regions in light sleep have not consistently been reported, with some EEG/fMRI studies finding no differences in light sleep (Horovitz et al., 2008; Larson-Prior et al., 2009) and another finding strong connectivity differences already at sleep onset (Sämann et al., 2011). Differences in methodological approaches (e.g. employing seed-based analyses or ICA) may be relevant here, as well as power issues due to relatively small samples in the former studies. We now report reduced (lateral) frontoparietal connectivity in light sleep, which in combination with reduced thalamocortical connectivity may be a relevant characteristic of the brain at sleep onset.
The reduction in connectivity of the thalamus (Spoormaker et al., 2010) was manifest in our cluster analysis by the removal of the bilateral thalamus from the subcortical cluster (resulting in one separate cluster for the bilateral thalamus). Reduction of thalamus connectivity was not simply due to a loss of integrity in the thalamus voxels, as there was no significant difference in the variance explained by the first (or second) principal component. Instead, the integrity in thalamus and putamen appeared to increase somewhat, albeit not significantly (Cohen’s d < 0.50). This is in accordance with the reported finding that correlations between thalamus seeds are maintained (or increase) in sleep (Larson-Prior et al., 2011), in contrast to connectivity between thalamus and other regions. Whether reduced frontoparietal and thalamocortical connectivity are related remains an open question, but may be likely due to the relay function of the thalamus in cortico-cortical connectivity (Steriade, 2004). Moreover, a relationship between both phenomena is indicated by the reduced connectivity of the IPL with other subcortical structures such as the caudate in sleep, which typically fluctuates with the thalamus in one subcortical network (Damoiseaux et al., 2006). This appears further in line with reduced frontoparietal – thalamus connectivity in propofol-induced anesthesia (Boveroux et al., 2010). Note that we observed reduced IPL – thalamus connectivity in sleep compared to wakefulness, but this did not survive whole-brain multiple test correction. The decrease of thalamocortical connectivity in sleep was much more robust for the medial visual network, which indicates that thalamocortical connectivity changes in sleep may rather represent a disconnect between thalamus and primary sensory networks.
Slow-wave sleep showed a strong hierarchical clustering with a larger amount of local clusters, which was quantitatively supported by highest optimal modularity values in this sleep stage. Values were lowest for light sleep stages, with intermediate values for wakefulness, which can be expected given the apparent randomization occurring in light sleep stages (Spoormaker et al., 2010). The locally organized hierarchical structure in slow-wave sleep is indicative of a network optimal for processing information in segregated modules, and provides a context for previous reports on a reduction in anterior–posterior DMN coupling in slow-wave sleep (Horovitz et al., 2009; Sämann et al., 2011) together with a preserved or increased in posterior node connectivity (Horovitz et al., 2009; Koike et al., 2011; Sämann et al., 2011). Note that brief bursts of increased connectivity can still occur during specific sleep events such as spindles (Andrade et al., 2011), even though intracranial unit firing and EEG measurements have revealed that most spindles are of a local nature (Nir et al., 2011).
Many questions regarding the neural origin of fMRI BOLD signal fluctuations remain to be answered. The BOLD signal itself is a blurred and delayed hemodynamic response to neural events, which can cause broadband neural activity to become more pronounced in ultraslow frequencies in the BOLD signal (Niazy et al., 2011). Moreover, several sleep events such as spindles and K-complexes have an occurrence frequency in the range of ultraslow fluctuations (e.g., occurring less than every 10 s), which may boost fMRI connectivity in light sleep stage 2. At the same time, ultraslow fluctuations have been detected by intracranial EEG (Nir et al., 2008) and the correlation between fMRI BOLD signal fluctuations and neural intracranial (ultraslow) EEG fluctuations was moderate to high and remained constant throughout sleep and wakefulness (He et al., 2008). Moreover, fMRI BOLD fluctuations in wakefulness were correlated to gamma coherence (>40 Hz) in wakefulness and REM sleep but not in slow-wave sleep (He et al., 2008), which may be a consequence of the decreased gamma coherence in the latter stage (Achermann and Borbély, 1998; Gross and Gotman, 1999).
Intracranial EEG measurements in epilepsy patients have revealed that in sleep stage 1 is thalamus deactivation precedes cortical deactivation up to several minutes (Magnin et al., 2010), and fMRI data also show reduced thalamic activity in sleep stage 1 (Kaufmann et al., 2006). This is reflected in fMRI connectivity patterns through reduced thalamocortical connectivity (Spoormaker et al., 2010) and the occurrence of the bilateral thalamus as one separate hierarchical cluster in sleep stage 1. Although an increase in cortical activity is not observed in light sleep relative to wakefulness (Kaufmann et al., 2006), cortical fMRI connectivity increases in light sleep (Spoormaker et al., 2010), which is in line with increased interhemispheric cortical coherence in ultraslow fluctuations in light sleep stage 2 as observed with intracranial EEG measurements (Nir et al., 2008).
We previously reported reduced fMRI connectivity in slow-wave sleep (Spoormaker et al., 2010), and here we observe reduced long distance (frontoparietal) connectivity and locally organized clusters. This is in line with data from a study employing transcranial magnetic stimulation during wakefulness and slow-wave sleep, with global activation patterns in the former and local activation patterns in the latter stage (Massimini et al., 2005). Moreover, these findings corroborate intracranial EEG and single- and multi-unit recordings, which demonstrated that the majority of slow-waves have a local spatial pattern and occur out of phase in different brain regions (Nir et al., 2011). Such whole-brain network disintegration and out of phase activity can even lead to slow-wave activity in one region and wake-like high-frequency activity patterns in another region simultaneously (Nobili et al., 2011), translating findings on local sleep in awake rodents (Vyazovskiy et al., 2011). Such translational issues show the relevance of EEG/fMRI findings of sleep, as these non-invasive deep-brain measurements can be recorded in healthy subject and psychiatric patients.
Cabral et al. (2011) have recently shown in silico that independent neural populations, each of which locally oscillating in the gamma frequency range, behave as weakly coupled oscillators producing global slow neural activity fluctuations in a manner as experimentally observed in the human brain. To do so, individual nodes need to be inter-connected and integrated into an anatomically meaningful cerebral network with realistic axonal conduction speed. Then, functional connectivity according to the experimental BOLD signal was realistically simulated, with subsets of nodes synchronizing without complete global network synchronization (Cabral et al., 2011). It is possible that sleep reflects a move in parameter space by a break down of gamma coherence, resulting less global synchrony in slow-wave sleep, with sets of frontoparietal and subcortical hubs playing a critical role in this process.
Although the AAL and similar predefined anatomical atlases are suboptimal in detecting connectivity patterns in wakefulness (Power et al., 2011), we find comparable effects of sleep on general graph theoretical measures across multiple atlases, including one atlas based on functional connectivity patterns in wakefulness (Dosenbach et al., 2010). This is probably because the analysis of fMRI connectivity patterns in sleep focuses on between-stage contrasts instead of within stage descriptions. This means that although suboptimal node placement (Power et al., 2011) or mixing of signals (Smith et al., 2011) affect the accuracy of within stage connectivity patterns, a between-stage contrast may be affected less as stationary estimation errors are minimized by subtraction. Moreover, a functional atlas that accurately reflects connectivity patterns in wakefulness does not necessarily reflect connectivity patterns in sleep, and the use of a single functional atlas would therefore result in suboptimal node placement in sleep stages. Alternatively, the derivation of one functional atlas per stage would impair between-stage comparability, and creating one functional atlas across stages would force the analysis to focus on overlapping instead of differential connectivity patterns, which indicates that using multiple predefined atlases can be helpful for between-stage comparisons in sleep or anesthesia.
In short, reduction of frontoparietal connectivity and changes in the hierarchical structure of functional brain networks throughout sleep may be important markers of the brain’s connectivity in a specific sleep stage. Understanding the specifics of network reorganization throughout human sleep may be essential to our understanding of brain plasticity processes taking place in sleep.
Conflict of Interest Statement
The authors declare that the research was conducted in the absence of any commercial or financial relationships that could be construed as a potential conflict of interest.
Supplementary Material
The Supplementary Material for this article can be found online at http://www.frontiersin.org/Sleep_and_Chronobiology/10.3389/fneur.2012.00080/abstract
Footnotes
References
Achard, S., Salvador, R., Whitcher, B., Suckling, J., and Bullmore, E. (2006). A resilient, low-frequency, small-world human brain functional network with highly connected association cortical hubs. J. Neurosci. 26, 63–72.
Achermann, P., and Borbély, A. A. (1998). Coherence analysis of the human sleep electroencephalogram. Neuroscience 85, 1195–1208.
Andrade, K. C., Spoormaker, V. I., Dresler, M., Wehrle, R., Holsboer, F., Sämann, P. G., and Czisch, M. (2011). Sleep spindles and hippocampal functional connectivity in human NREM sleep. J. Neurosci. 31, 10331–10339.
Andrews-Hanna, J. R., Reidler, J. S., Huang, C., and Buckner, R. L. (2010). Evidence for the default network’s role in spontaneous cognition. J. Neurophysiol. 104, 322–335.
Beckmann, C. F., DeLuca, M., Devlin, J. T., and Smith, S. M. (2005). Investigations into resting-state connectivity using independent component analysis. Philos. Trans. R. Soc. Lond. B Biol. Sci. 360, 1001–1013.
Biswal, B., Yetkin, F. Z., Haughton, V. M., and Hyde, J. S. (1995). Functional connectivity in the motor cortex of resting human brain using echo-planar MRI. Magn. Reson. Med. 34, 537–541.
Boly, M., Phillips, C., Tshibanda, L., Vanhaudenhuyse, A., Schabus, M., Dang-Vu, T. T., Moonen, G., Hustinx, R., Maquet, P., and Laureys, S. (2008). Intrinsic brain activity in altered states of consciousness, how conscious is the default mode of brain function? Ann. N. Y. Acad. Sci. 1129, 119–129.
Boveroux, P., Vanhaudenhuyse, A., Bruno, M. A., Noirhomme, Q., Lauwick, S., Luxen, A., Degueldre, C., Plenevaux, A., Schnakers, C., Phillips, C., Brichant, J. F., Bonhomme, V., Maquet, P., Greicius, M. D., Laureys, S., and Boly, M. (2010). Breakdown of within- and between-network resting state functional magnetic resonance imaging connectivity during propofol-induced loss of consciousness. Anesthesiology 113, 1038–1053.
Buckner, R. L., Andrews-Hanna, J. R., and Schacter, D. L. (2008). The brain’s default network, anatomy, function, and relevance to disease. Ann. N. Y. Acad. Sci. 1124, 1–38.
Bullmore, E., and Sporns, O. (2009). Complex brain networks, graph theoretical analysis of structural and functional systems. Nat. Rev. Neurosci. 10, 186–198.
Cabral, J., Hugues, E., Sporns, O., and Deco, G. (2011). Role of local network oscillations in resting-state functional connectivity. Neuroimage 57, 130–139.
Corbetta, M., and Shulman, G. L. (2002). Control of goal-directed and stimulus-driven attention in the brain. Nat. Rev. Neurosci. 3, 201–215.
Damoiseaux, J. S., Rombouts, S. A. R. B., Barkhof, F., Scheltens, P., Stam, C. J., Smith, S. M., and Beckmann, C. F. (2006). Consistent resting-state networks across healthy subjects. Proc. Natl. Acad. Sci. U.S.A. 103, 13848–13853.
Dimitriadis, S. I., Laskaris, N. A., Del Rio-Portilla, Y., and Koudounis, G. (2009). Characterizing dynamic functional connectivity across sleep stages from EEG. Brain Topogr. 22, 119–133.
Dosenbach, N. U., Nardos, B., Cohen, A. L., Fair, D. A., Power, J. D., Church, J. A., Nelson, S. M., Wig, G. S., Vogel, A. C., Lessov-Schlaggar, C. N., Barnes, K. A., Dubis, J. W., Feczko, E., Coalson, R. S., Pruett, J. R. J., Barch, D. M., Petersen, S. E., and Schlaggar, B. L. (2010). Prediction of individual brain maturity using fMRI. Science 329, 1358–1361.
Ferrarini, L., Veer, I. M., Baerends, E., van Tol, M. J., Renken, R. J., van der Wee, N. J., Veltman, D. J., Aleman, A., Zitman, F. G., Penninx, B. W., van Buchem, M. A., Reiber, J. H., Rombouts, S. A., and Milles, J. (2009). Hierarchical functional modularity in the resting-state human brain. Hum. Brain Mapp. 30, 2220–2231.
Ferri, R., Rundo, F., Bruni, O., Terzano, M. G., and Stam, C. J. (2007). Small-world network organization of functional connectivity of EEG slow-wave activity during sleep. Clin. Neurophysiol. 118, 449–456.
Ferri, R., Rundo, F., Bruni, O., Terzano, M. G., and Stam, C. J. (2008). The functional connectivity of different EEG bands moves towards small-world network organization during sleep. Clin. Neurophysiol. 119, 2026–2036.
Fox, M. D., and Raichle, M. E. (2007). Spontaneous fluctuations in brain activity observed with functional magnetic resonance imaging. Nat. Rev. Neurosci. 8, 700–711.
Fox, M. D., Snyder, A. Z., Vincent, J. L., Corbetta, M., Van Essen, D. C., and Raichle, M. E. (2005). The human brain is intrinsically organized into dynamic, anticorrelated functional networks. Proc. Natl. Acad. Sci. U.S.A. 102, 9673–9678.
Gleiser, P. M., and Spoormaker, V. I. (2010). Modelling hierarchical structure in functional brain networks. Philos. Transact. A Math. Phys. Eng. Sci. 368, 5633–5544.
Greicius, M. D., Flores, B. H., Menon, V., Glover, G. H., Solvason, H. B., Kenna, H., Reiss, A. L., and Schatzberg, A. F. (2007). Resting-state functional connectivity in major depression, abnormally increased contributions from subgenual cingulate cortex and thalamus. Biol. Psychiatry 62, 429–437.
Greicius, M. D., Srivastava, G., Reiss, A. L., and Menon, V. (2004). Default-mode network activity distinguishes Alzheimer’s disease from healthy aging: evidence from functional MRI. Proc. Natl. Acad. Sci. U.S.A. 101, 4637–4642.
Gross, D. W., and Gotman, J. (1999). Correlation of high-frequency oscillations with the sleep-wake cycle and cognitive activity in humans. Neuroscience 94, 1005–1018.
Hagmann, P., Cammoun, L., Gigandet, X., Meuli, R., Honey, C. J., Wedeen, V. J., and Sporns, O. (2008). Mapping the structural core of human cerebral cortex. PLoS Biol. 6, e159. doi:10.1371/journal.pbio.0060159
Hayasaka, S., Phan, K. L., Liberzon, I., Worsley, K. J., and Nichols, T. E. (2004). Nonstationary cluster-size inference with random field and permutation methods. Neuroimage 22, 676–687.
He, B. J., Snyder, A. Z., Zempel, J. M., Smyth, M. D., and Raichle, M. E. (2008). Electrophysiological correlates of the brain’s intrinsic large-scale functional architecture. Proc. Natl. Acad. Sci. U.S.A. 105, 16039–16044.
Horovitz, S. G., Braun, A. R., Carr, W. S., Picchioni, D., Balkin, T. J., Fukunaga, M., and Duyn, J. H. (2009). Decoupling of the brain’s default mode network during deep sleep. Proc. Natl. Acad. Sci. U.S.A. 106, 11376–11381.
Horovitz, S. G., Fukunaga, M., de Zwart, J. A., van Gelderen, P., Fulton, S. C., Balkin, T. J., and Duyn, J. H. (2008). Low frequency BOLD fluctuations during resting wakefulness and light sleep: a simultaneous EEG-fMRI study. Hum. Brain Mapp. 29, 671–682.
Kaufmann, C., Wehrle, R., Wetter, T. C., Holsboer, F., Auer, D. P., Pollmächer, T., and Czisch, M. (2006). Brain activation and hypothalamic functional connectivity during human non-rapid eye movement sleep: an EEG/fMRI study. Brain 129, 655–667.
Koike, T., Kan, S., Misaki, M., and Miyauchi, S. (2011). Connectivity pattern changes in default-mode network with deep non-REM and REM sleep. Neurosci. Res. 69, 322–330.
Larson-Prior, L. J., Power, J. D., Vincent, J. L., Nolan, T. S., Coalson, R. S., Zempel, J., Snyder, A. Z., Schlaggar, B. L., Raichle, M. E., and Petersen, S. E. (2011). Modulation of the brain’s functional network architecture in the transition from wake to sleep. Prog. Brain Res. 193, 277–294.
Larson-Prior, L. J., Zempel, J. M., Nolan, T. S., Prior, F. W., Snyder, A. Z., and Raichle, M. E. (2009). Cortical network functional connectivity in the descent to sleep. Proc. Natl. Acad. Sci. U.S.A. 106, 4489–4494.
Magnin, M., Rey, M., Bastuji, H., Guillemant, P., Mauguiere, F., and Garcia-Larrea, L. (2010). Thalamic deactivation at sleep onset precedes that of the cerebral cortex in humans. Proc. Natl. Acad. Sci. U.S.A. 107, 3829–3833.
Massimini, M., Ferrarelli, F., Huber, R., Esser, S. K., Singh, H., and Tononi, G. (2005). Breakdown of cortical effective connectivity during sleep. Science 309, 2228–2232.
Newman, M. E. (2006). Modularity and community structure in networks. Proc. Natl. Acad. Sci. U.S.A. 103, 8577–8582.
Niazy, R. K., Xie, J., Miller, K., Beckmann, C. F., and Smith, S. M. (2011). Spectral characteristics of resting state networks. Prog. Brain Res. 193, 259–276.
Nir, Y., Mukamel, R., Dinstein, I., Privman, E., Harel, M., Fisch, L., Gelbard-Sagiv, H., Kipervasser, S., Andelman, F., Neufeld, M. Y., Kramer, U., Arieli, A., Fried, I., and Malach, R. (2008). Interhemispheric correlations of slow spontaneous neuronal fluctuations revealed in human sensory cortex. Nat. Neurosci. 11, 1100–1108.
Nir, Y., Staba, R. J., Andrillon, T., Vyazovskiy, V. V., Cirelli, C., Fried, I., and Tononi, G. (2011). Regional slow waves and spindles in human sleep. Neuron 70, 153–169.
Nobili, L., Ferrara, M., Moroni, F., De Gennaro, L., Russo, G. L., Campus, C., Cardinale, F., and De Carli, F. (2011). Dissociated wake-like and sleep-like electro-cortical activity during sleep. Neuroimage 58, 612–619.
Picchioni, D., Fukunaga, M., Carr, W. S., Braun, A. R., Balkin, T. J., Duyn, J. H., and Horovitz, S. G. (2008). fMRI differences between early and late stage-1 sleep. Neurosci. Lett. 441, 81–85.
Prignano, L., and Diaz-Guilera, A. (2012). Extracting topological features from dynamical measures in networks of Kuramoto oscillators. Phys. Rev. E 85, 036112.
Power, J. D., Cohen, A. L., Nelson, S. M., Wig, G. S., Barnes, K. A., Church, J. A., Vogel, A. C., Laumann, T. O., Miezin, F. M., Schlaggar, B. L., and Petersen, S. E. (2011). Functional network organization of the human brain. Neuron 72, 665–678.
Rubinov, M., and Sporns, O. (2010). Complex network measures of brain connectivity: uses and interpretations. Neuroimage 52, 1059–1069.
Salvador, R., Suckling, J., Coleman, M. R., Pickard, J. D., Menon, D., and Bullmore, E. (2005). Neurophysiological architecture of functional magnetic resonance images of human brain. Cereb. Cortex 15, 1332–1342.
Sämann, P. G., Wehrle, R., Hoehn, D., Spoormaker, V. I., Peters, H., Tully, C., Holsboer, F., and Czisch, M. (2011). Development of the brain’s default mode network from wakefulness to slow wave sleep. Cereb. Cortex 21, 2082–2093.
Smith, S. M., Miller, K. L., Salimi-Khorshidi, G., Webster, M., Beckmann, C. F., Nichols, T. E., Ramsey, J. D., and Woolrich, M. W. (2011). Network modelling methods for FMRI. Neuroimage 54, 875–891.
Spoormaker, V. I., Schröter, M. S., Gleiser, P. M., Andrade, K. C., Dresler, M., Wehrle, R., Sämann, P. G., and Czisch, M. (2010). Development of a large-scale functional brain network during human non-rapid eye movement sleep. J. Neurosci. 30, 11379–11387.
Steriade, M. (2004). Acetylcholine systems and rhythmic activities during the waking – sleep cycle. Prog. Brain Res. 145, 179–196.
Tzourio-Mazoyer, N., Landeau, B., Papathanassiou, D., Crivello, F., Etard, O., Delcroix, N., Mazoyer, B., and Joliot, M. (2002). Automated anatomical labeling of activations in SPM using a macroscopic anatomical parcellation of the MNI MRI single-subject brain. Neuroimage 15, 273–289.
van den Heuvel, M. P., and Sporns, O. (2011). Rich-club organization of the human connectome. J. Neurosci. 31, 15775–15786.
Vyazovskiy, V. V., Olcese, U., Hanlon, E. C., Nir, Y., Cirelli, C., and Tononi, G. (2011). Local sleep in awake rats. Nature 472, 443–447.
Ward, J. H. (1963). Hierarchical grouping to optimize an objective function. J. Am. Stat. Assoc. 58, 236–244.
Watts, D. J., and Strogat, S. H. (1998). Collective dynamics of “small-world” networks. Nature 393, 440–442.
Keywords: fMRI, sleep, hierarchy, clustering, frontoparietal, network
Citation: Spoormaker VI, Gleiser PM and Czisch M (2012) Frontoparietal connectivity and hierarchical structure of the brain’s functional network during sleep. Front. Neur. 3:80. doi: 10.3389/fneur.2012.00080
Received: 08 November 2011; Paper pending published: 15 December 2011;
Accepted: 24 April 2012; Published online: 17 May 2012.
Edited by:
Linda J. Larson-Prior, Washington University School of Medicine in St. Louis, USAReviewed by:
Marcello Massimini, University of Milan, ItalyPeter Halasz, Hungarian Sleep Society, Hungary
Copyright: © 2012 Spoormaker, Gleiser and Czisch. This is an open-access article distributed under the terms of the Creative Commons Attribution Non Commercial License, which permits non-commercial use, distribution, and reproduction in other forums, provided the original authors and source are credited.
*Correspondence: Victor I. Spoormaker, Neuroimaging, Max Planck Institute of Psychiatry, Kraepelinstr. 2-10, 80804 Munich, Germany. e-mail: spoormaker@mpipsykl.mpg.de.