 Pradeep Reddy Raamana1*
 Wei Wen2,3Nicole A. Kochan2,3
 Henry Brodaty2,4
 Perminder S. Sachdev2,3
 Lei Wang5†
 Mirza Faisal Beg1†
- 1School of Engineering Science, Simon Fraser University, Burnaby, BC, Canada
- 2Centre for Healthy Brain Ageing, School of Psychiatry, UNSW Medicine, University of New South Wales, Sydney, NSW, Australia
- 3Neuropsychiatric Institute, Prince of Wales Hospital, Randwick, NSW, Australia
- 4Dementia Collaborative Research Centre, School of Psychiatry, UNSW Medicine, University of New South Wales, Sydney, NSW, Australia
- 5Feinberg School of Medicine, Northwestern University, Chicago, IL, USA
Background: Amnestic mild cognitive impairment (aMCI) is considered to be the transitional stage between healthy aging and Alzheimer’s disease (AD). Moreover, aMCI individuals with additional impairment in one or more non-memory cognitive domains are at higher risk of conversion to AD. Hence accurate identification of the sub-types of aMCI would enable earlier detection of individuals progressing to AD.
Methods: We examine the group differences in cortical thickness between single-domain and multiple-domain sub-types of aMCI, and as well as with respect to age-matched controls in a well-balanced cohort from the Sydney Memory and Aging Study. In addition, the diagnostic value of cortical thickness in the sub-classification of aMCI as well as from normal controls using support vector machine (SVM) classifier is evaluated, using a novel cross-validation technique that can handle class-imbalance.
Results: This study revealed an increased, as well as a wider spread, of cortical thinning in multiple-domain aMCI compared to single-domain aMCI. The best performances of the classifier for the pairs (1) single-domain aMCI and normal controls, (2) multiple-domain aMCI and normal controls, and (3) single and multiple-domain aMCI were AUC = 0.52, 0.66, and 0.54, respectively. The accuracy of the classifier for the three pairs was just over 50% exhibiting low specificity (44–60%) and similar sensitivity (53–68%).
Conclusion: Analysis of group differences added evidence to the hypothesis that multiple-domain aMCI is a later stage of AD compared to single-domain aMCI. The classification results show that discrimination among single, multiple-domain sub-types of aMCI and normal controls is limited using baseline cortical thickness measures.
1. Introduction
There is an increased focus on developing computer-assisted tools for identifying individuals at high risk of developing Alzheimer’s disease (AD). Recent reports suggest that the amyloid pathology begins at least 20 years before any clinical symptoms appear (1–3), which highlights the importance of preclinical detection. Epidemiologic studies from across the globe have reported the annual progression rates of clinically diagnosed mild cognitive impairment (MCI) to dementia to be in the 15–25% range (4). There is also an interest in identifying sub-types of MCI, and whether these relate to specific dementia diagnoses and differential rates of conversion to dementia (5). Moreover, an association between prior subtype of MCI and subsequent progression to a particular dementia is also reported (5). The development of automated techniques for the accurate classification of MCI sub-types, hence, has important prognostic applications.
Amnestic subtype of MCI (aMCI) is found to have highest conversion rate to AD as compared to other dementias (5). There are two sub-types of aMCI based on the number of domains impaired: single-domain (sd-aMCI) and multiple-domain (md-aMCI) sub-types. There is evidence to suggest that md-aMCI is the most likely subtype to progress to AD (6) and to dementia (7, 8). Structural MRI (sMRI) is a non-invasive and economical way to capture comprehensive picture of atrophy in the brain in terms of subcortical volumetry as well as cortical thickness features. Hence it would be of value to assess the ability of structural biomarkers such as cortical thickness in accurately identifying the sub-types of aMCI.
Research in this field has so far focused on studying group differences alone, i.e., regional differences in gray matter loss or cortical thickness in pair-wise fashion. Initial attempts to study the group differences among normal controls (NC), sd-aMCI, and md-aMCI were based on voxel-based morphometry (9–11), with few studies analyzing cortical thickness (12, 13). These studies suggest that moderate differences exist. However, the sample sizes examined have been small [except for Ref. (10)] and unbalanced (9, 10, 12). In a study, where the goal is to identify which patients are at increased risk of conversion to dementia, it is important that aMCI (both single and multiple-domain sub-types) is not underrepresented. Furthermore, it is important to evaluate the diagnostic utility of these measures, which no study has previously assessed based on MRI measures (9–13). In this study, we present the first thorough assessment of classification power in cortical thickness features in identifying the sub-types of aMCI, in a well-balanced cohort.
2. Materials and Methods
2.1. Participants
The study sample was part of the Sydney Memory and Aging Study (MAS) program, which comprises community-dwelling, non-demented individuals recruited randomly through electoral roll from two electorates of East Sydney, Australia. Please refer to Ref. (7, 14) for complete details about this study. To be eligible, participants needed to be aged between 70 and 90 years old, sufficiently fluent in English to complete the psychometric assessment and were able to consent to participate. Participants were excluded if they had a previous diagnosis of dementia, psychotic symptoms or a diagnosis of schizophrenia or bipolar disorder, multiple sclerosis, motor neuron disease, developmental disability, progressive malignancy (active cancer or receiving treatment for cancer, other than prostate non-metastasized, and skin cancer), or if they had medical or psychological conditions that may have prevented them from completing assessments. Participants were excluded if they had a Mini mental Statement Examination [MMSE; (15, 16)] score of <24 adjusted for age, education, and non-English speaking background at study entry, or if they received a diagnosis of dementia after comprehensive assessment. The study was approved by the Ethics Committee of the University of New South Wales. The demographics for the current study sample are listed in Table 1.
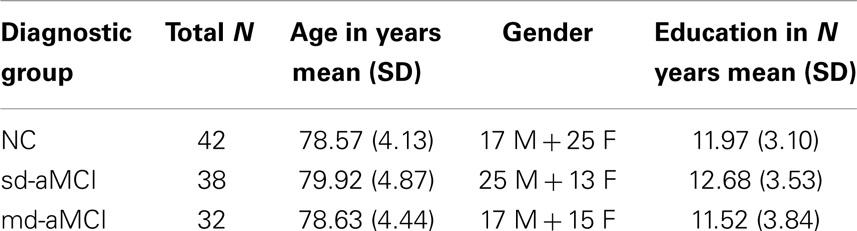
Table 1. Demographics of aMCI and normal subjects in this study.
2.2. MAS Subsample and Cognitive Assessments
Demographic characteristics of normal and MCI participants selected for this study from the larger MAS cohort are presented in Table 1. Participants received a comprehensive neuropsychological assessment examining the cognitive domains of memory, language, attention/processing speed, visuospatial function, and executive functions (see Table 2 for listing of test measures). Participants were classified as having MCI according to the latest international consensus diagnostic criteria and if all of the following criteria were met – a cognitive complaint from the participant or a knowledgeable informant, cognitive impairment on objective testing, they were not demented, and normal function or minimal impairment in instrumental activities of daily living. Cognitive impairment was defined as a test performance of 1.5 standard deviations (SDs) or more below published normative values (demographically adjusted where possible – Table 2). Participants were considered impaired in a domain if at least one measure in the domain was impaired. In this study, only amnestic type of MCI is included. If the impairment was restricted to the memory domain, it was classified as single-domain amnestic MCI (sd-aMCI). If an additional cognitive domain was impaired, it was classified as multiple-domain amnestic MCI (md-aMCI).
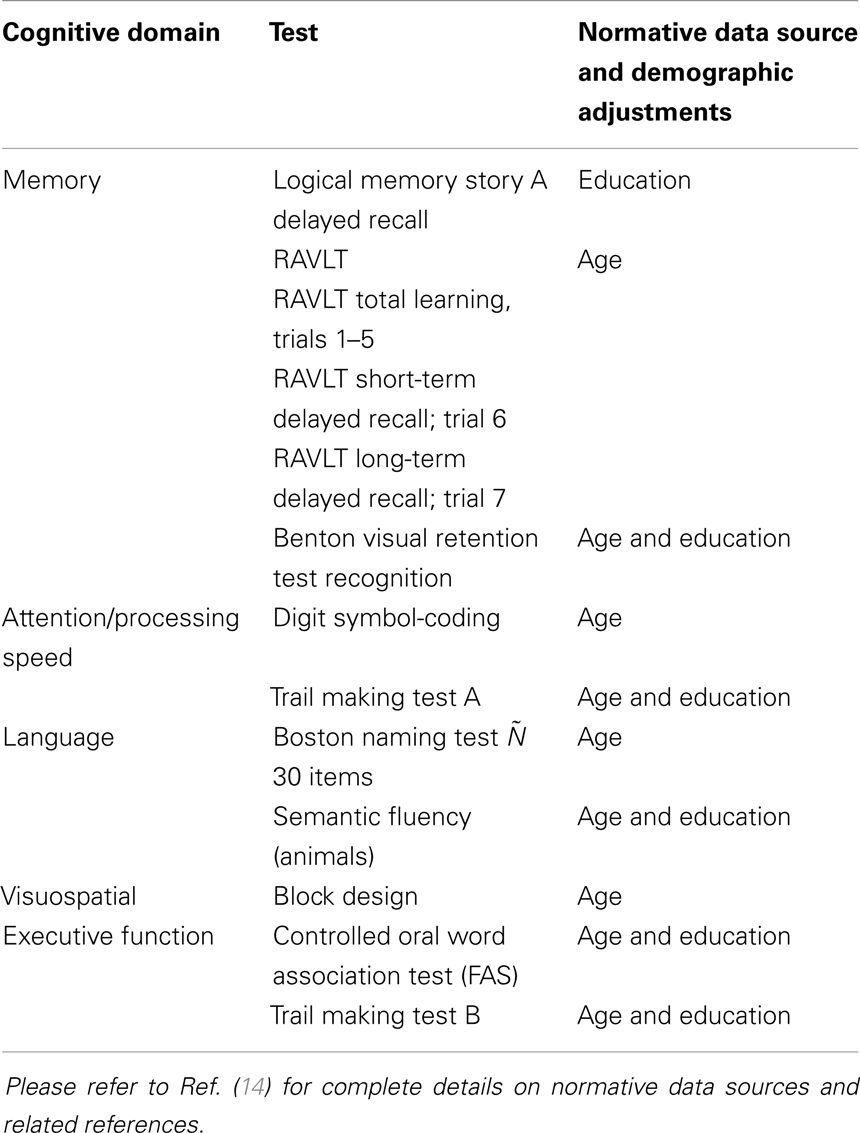
Table 2. Neuropsychological tests used for MCI classifications.
Participants from non-English speaking background were excluded from the MCI groups because of the questionable validity of applying standard normative data to establish cognitive impairment in non-native English speakers (17). Of the total remaining subjects with MR imaging, subjects whose cortical parcelation did not meet our quality control, either owing to their failure in either Freesurfer cortical parcelation or estimation of cortical thickness from our Laplacian streamlines method, have been excluded. Our quality control consisted of checking for permanent failure in Freesurfer automatic parcelation, visually examining for presence of holes or handles in the pial or white surfaces (left or right hemisphere), or when the cortical surfaces have gross errors in following the structural boundaries. Further, even with acceptable Freesurfer parcelation, some subjects were excluded if our thickness computation method based on Laplacian streamlines fails to estimate thickness in either left or the right hemisphere. Within the quality controlled subset, a random subset of controls that matched in age and size with aMCI have been selected. The final selection consisted of 38 sd-aMCI, 32 md-aMCI, and 42 age-matched NC, for which the cognitive assessments are presented in Figure 1.
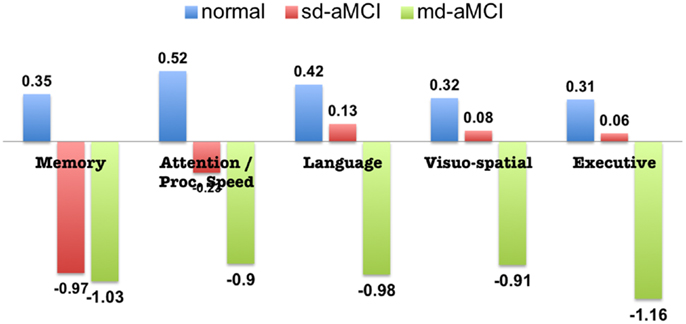
Figure 1. Neuropsychological assessment of aMCI and normal subjects included in this study (standardized scores, mean).
2.3. Image Acquisition
The participants were scanned using a 3-T Intera Quasar scanner initially, followed by a 3-T Achieva Quasar Dual scanner, both manufactured by Philips Medical Systems, Best, The Netherlands. There was no alteration in acquisition parameters for T1-weighted sequences for both the scanners: TR = 6.39 ms, TE = 2.9 ms, flip angle = 8°, matrix size = 256 × 256, FOV = 256 × 256 × 190, and slice thickness = 1 mm with no gap between; yielding 1 × 1 × 1 mm3 isotropic voxels. The use of different scanners was due to reasons beyond investigator’s control and any systematic bias arising from the scanner change is unlikely given that participant recruitment was random. In fact, there were no significant differences in cortical features found between the two scanners in the Sydney MAS cohort (18). Even though there were some cohort differences across the two scanners (at age scan: scanner 1 = 77.9, scanner 2 = 79.0, p = 0.003; years of education: scanner 1 = 11.4, scanner 2 = 12.2, p = 0.013; male/female ratio: scanner 1 = 125/160, scanner 2 = 120/137, p = ns; the final selection of subjects in Section 2.2 are part of this larger cohort), previous studies have suggested that when vendor, field strength, and acquisition parameters remained unchanged, data collected during scanner upgrades could be pooled (19).
2.4. Thickness Measurement and Processing
Initial cortical reconstruction and volumetric segmentation of the whole brain were performed with the Freesurfer image analysis suite (20) to obtain Pial and WM/GM surfaces. The resulting cortical parcelations were quality controlled whenever possible (they were excluded otherwise). On the volume lying between these surfaces, a discrete approximation of Laplace’s equation was solved (21, 22) using the tools developed by our group. Streamlines of this harmonic function define corresponding points on the surfaces, and the Euclidean distance between these points defines the cortical thickness.
This results in thickness measurements at every vertex on the pial surface. In order to perform group-analysis, the surface of each subject in the study has been registered to the surface of a common atlas (derived from averaging over 80 healthy subjects) using the tools from Ref. (20) – see Appendix for further details. The atlas contained 327684 vertices in the whole brain. This establishes vertex-wise correspondence and enables group-wise analysis into the differences. Finally, cortical thickness was smoothed with a 10-mm full width at half height Gaussian kernel to improve the signal-to-noise ratio and statistical power for subsequent analysis (23).
2.5. Hippocampal Features
As this study focuses on amnestic type of MCI, hippocampal features are relevant. Hence preliminary experiments on classifying the sub-types using hippocampal volumes and shape features have been performed as well (24, 25).
2.6. Classification Using Thickness Features
We performed three pair-wise tests for comparison using SurfStat (26) and identified a set of regions, which are significantly different (p < 0.05) between each pair. The results from this group difference analysis are presented in Section 3.1. This is followed by an evaluation of accuracy of cortical thickness features in a binary classification test. The classification system consisted of intrinsic dimensionality reduction by subdividing the brain into small partitions, followed by a ranking based feature selection method and support vector machine (SVM) as classifier (27).
The dimension reduction method subdivides the cortex by partitioning each Freesurfer label (such as posterior cingulate cortex) into 10 smaller patches using the spatial clustering of vertices using k-means method. This results in 680 patches for the 34 cortical labels in both the hemispheres. Mean thickness value in each patch represents the feature for that partition, providing a total of 680 thickness features for each brain.
To avoid the curse of dimensionality, T-statistic based feature selection (top K features) has been performed prior to feeding the SVM classifier. For each pair, K is determined by the total number of samples in the corresponding binary test so as to avoid the curse of dimensionality, which is Kmax = N/10 (28). This would give Kmax = 8, 7, and 7 for the three pairs NC vs. sd-aMCI, NC vs. md-aMCI, and sd-aMCI vs. md-aMCI, respectively.
During the training phase, the parameters of the SVM classifier are tuned using grid search in the following ranges: penalty constant C = 10m, m = −1 to 5 and the kernel width gamma g = 2n, n = −5 to 4. For all the parameter combinations mentioned, the classifier is trained on a stratified training set (50% of the smallest class) and the prediction power has been evaluated on the remaining test set, and in each pair-wise classification experiment. This method is repeated 250 times, each time creating random training/test sets, in order to avoid the bias that can arise from a single training/test sets. The mean performance metrics, and their SDs, are noted. Please refer to Ref. (29) for a detailed discussion of classification method.
3. Results
Analysis of group differences is presented first in Section 3.1. This descriptive analysis also serves to provide regional information on significant differences among NC, sd-aMCI, and md-aMCI groups. This is followed by the evaluation of prediction power for cortical thickness using statistical learning techniques in Section 2.6.
3.1. Group Differences
Using SurfStat (26), the differences among NC, sd-aMCI, and md-aMCI are analyzed in a pair-wise fashion and the set of vertices that are significantly different [p < 0.05 after correcting for multiple-comparisons using random field theory (30)] between the two groups are presented in the maps of T-statistic and p-value.
3.1.1. NC vs. sd-aMCI
The group differences between NC and sd-aMCI as measured by T-statistic are visualized in Figure 2A. Here, we can see that it is bright red (T-stat > 4) around central sulcus, meaning sd-aMCI is much thinner than NC. In fact this is the only area that survived the multiple-comparison test as visualized in Figure 2B.
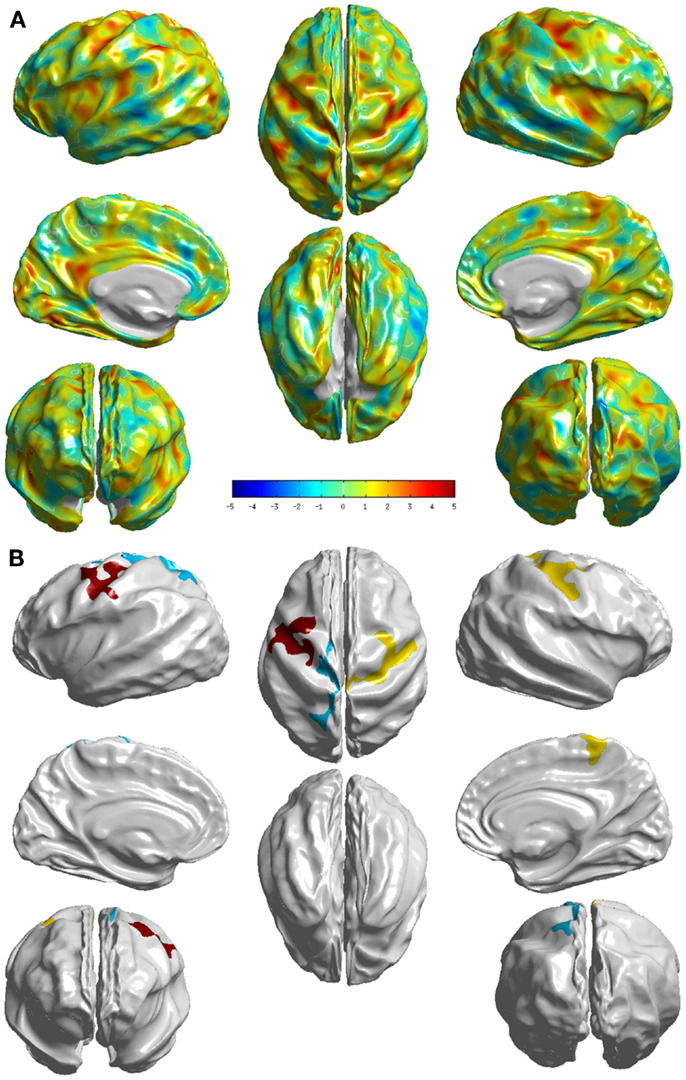
Figure 2. Visualization of the differences between the two groups NC and sd-aMCI. (A) T-statistic values displayed at each vertex (B) the set of clusters, which survived the multiple-comparisons test (cluster-wise significance), each colored differently. We can see that significant differences exist, although in few localized cortical areas.
3.1.2. NC vs. md-aMCI
The group differences between NC and md-aMCI as measured by T-statistic are visualized in Figure 3A. It is immediately clear that the differences are much more widespread and thinning in md-aMCI is higher. In fact the areas (as listed in Table A2 in the Appendix) that survived the multiple-comparison test are throughout the brain as shown in Figure 3B. These are mostly complementary to the differences exhibited in NC vs. sd-aMCI, except for a slight overlap in the central sulcus.
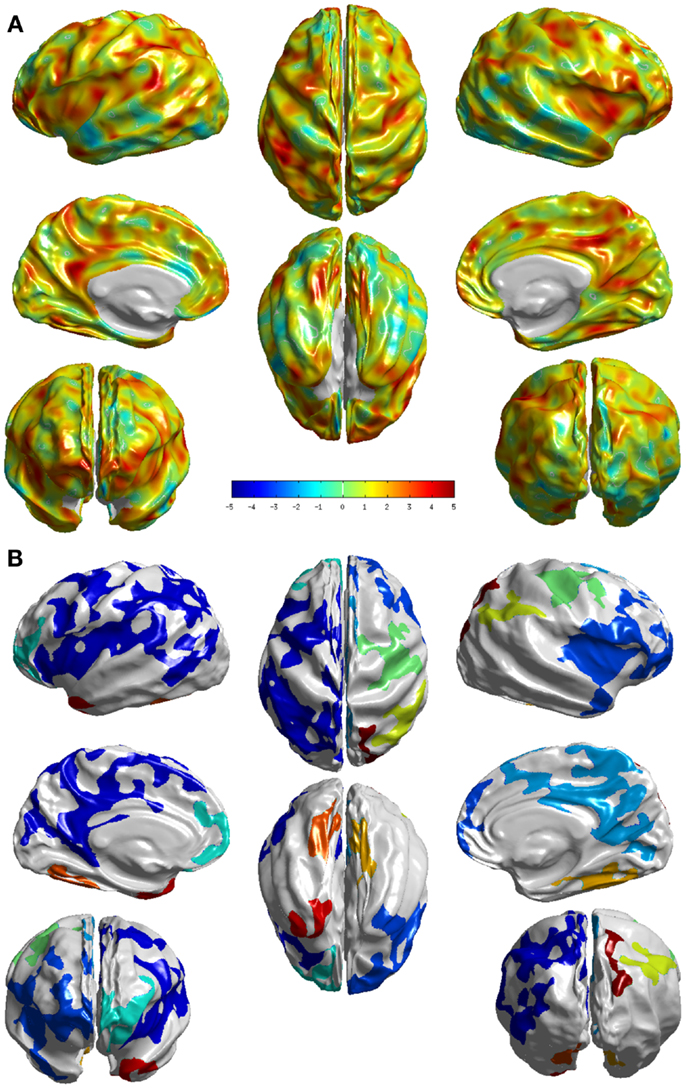
Figure 3. Visualization of the differences between the two groups NC and md-aMCI. (A) T-statistic values displayed at each vertex (B) the set of clusters, which survived the multiple-comparisons test (cluster-wise significance), each colored differently. We can see that they exhibit significant differences, in many cortical areas compared to the differences noticed between NC and sd-aMCI as shown in Figure 2B.
3.1.3. sd-aMCI vs. md-aMCI
The group differences between sd-aMCI and md-aMCI as measured by T-statistic are visualized in Figure 4A. It can be observed that there are only few areas (as listed in Table A2 in the Appendix), which exhibit strong group differences, which can be visualized in Figure 4B (areas that survived the multiple-comparison test with p < 0.05). The significant differences are localized mostly in the frontal and occipital lobes.
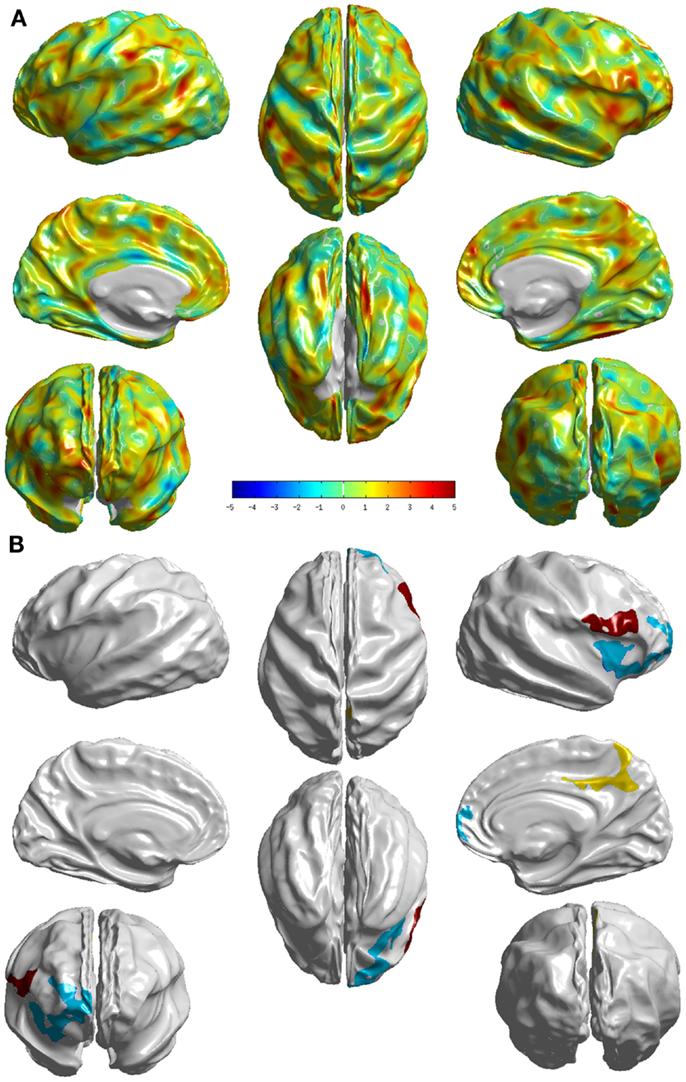
Figure 4. Visualization of the differences between the two groups sd- and md-aMCI. (A) T-statistic values displayed at each vertex (B) the set of clusters, which survived the multiple-comparisons test (cluster-wise significance), each colored differently. These visualizations display areas where md-aMCI is causing significantly differences as compared to sd-aMCI.
3.2. Classification Using Hippocampal Features
The classification experiments using support vector machines with hippocampal features (both left and right) revealed that hippocampal volume or shape lack any discrimination power. This is expected given that both the aMCI sub-types affect hippocampus in a similar way resulting in large overlap (see Table 3). This is consistent with findings reported in the study (24), which is based on aMCI subjects from the same MAS cohort combining both the sub-types into one group (in contrast with our study trying to discriminate the sub-types). That study assessed the power of subcortical volumetry and fractional anisotropy measures individually and in combination, to find that volumes alone didn’t have any classification power.
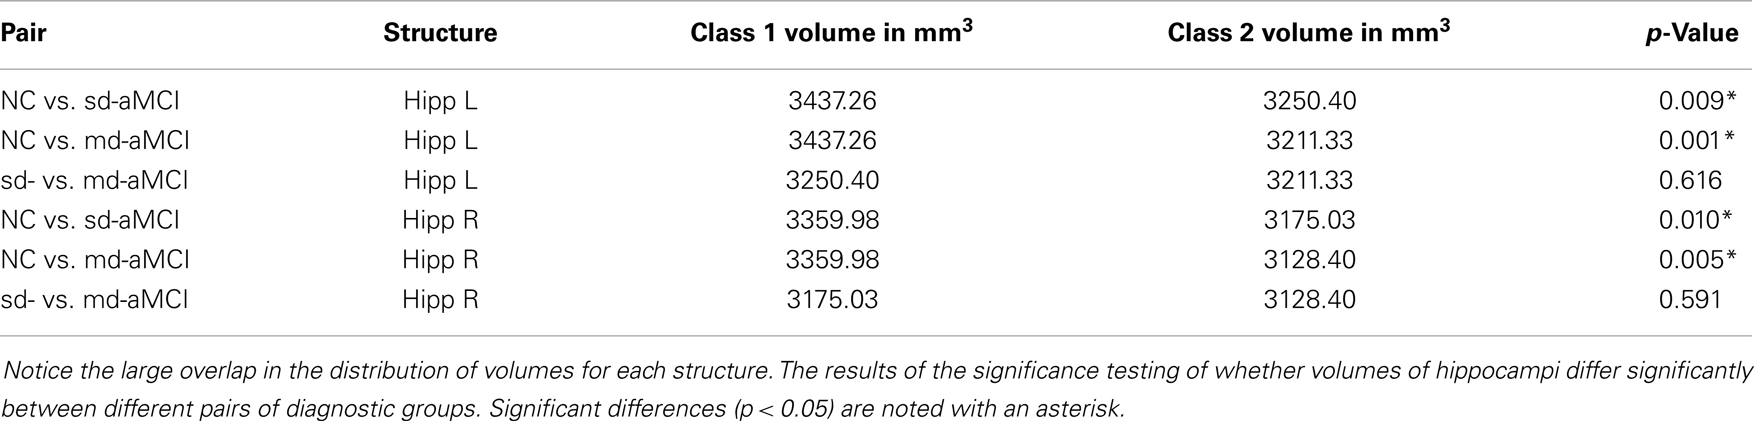
Table 3. Volumes of hippocampi (in mm3) of the aMCI sub-types and normal controls used in this study.
3.3. Classification Using Thickness Features
The results for the best performance for each pair, as ranked by AUC over all the parameter sets, are shown in Table 4. The average ROCs are visualized in Figure 5, which are constructed by the vertical averaging method as described in Ref. (31), by averaging the 250 ROCs obtained from the 250 repetitions.
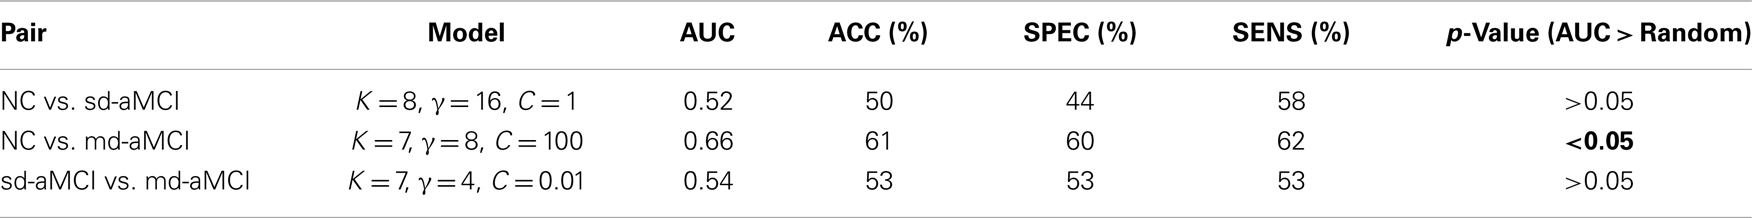
Table 4. Comparison of the best classification performance of the classifier for each pair, and whether that performance is significantly better than random.
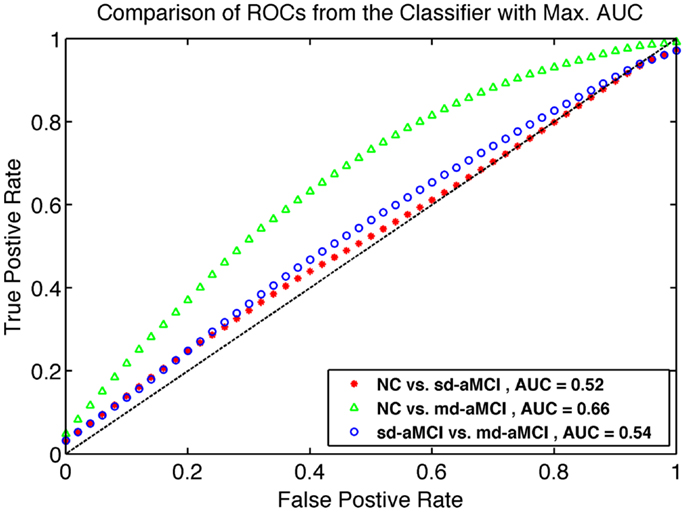
Figure 5. Comparison of ROC curves for the best classifier found from grid search as described in Section 2.6. The model from which ROC is generated are listed in Table 4.
To demonstrate that performance of the mean thickness (MT) features is significantly better than chance, additional experiments testing the statistical significance of the improvement in classification performance have been performed. The significance test is conducted using ROC comparison methods described in Ref. (32). The repeated cross-validation method employed in this study [known as RHsT, (29)] provides us with 250 estimates of AUC for each repetition of a cross-validation experiment. The distribution of these AUC samples for MT features are used to estimate whether it is significantly better than a random classifier (AUC of 0.5), using a non-parametric Wilcoxon rank-sum test. The result of this test is indicated in the last column of Table 4.
4. Discussion
We examined the group differences in cortical thickness between the two sub-types of aMCI and age-matched normal controls. Using surface-based analysis, the regions with significant differences were visualized and we have analyzed how they differed from the other pairs. We then presented an assessment of the power of cortical thickness in accurately classifying the sub-types of aMCI.
In comparison with NC, sd-aMCI presented significant differences in post central and precentral regions in both left and right hemispheres (see Figure 2). These regions are relatively robust in AD, and do not show pathology in the early stages. It might be possible that this is a reflection of a more generalized atrophy in the parietal and/or frontal lobes. The differences appear to cover slightly larger areas in the right hemisphere. It is interesting to note that the significant differences exist only around central sulcus and not medial temporal lobe. As the only domain of impairment in sd-aMCI is memory, we expected to see differences in the medial temporal lobe. This result is not consistent with previous findings in Ref. (9, 10, 12, 13), which reported differences in the medial temporal lobe.
In the comparison between md-aMCI and NC, the significant differences were found in the left temporal pole, left frontal pole, left superior parietal lobe, left inferior parietal lobe, left paracentral lobule, left precuneus, left posterior cingulate, left fusiform gyrus, left gyrus rectus, left superior frontal gyrus, right supramarginal gyrus, right cuneus, right temporal pole, and right lateral occipitotemporal gyrus (see Figure 3). As expected, the differences in md-aMCI (relative to NC) are much more widespread than sd-aMCI and cover a large set of regions in md-aMCI, adding evidence to the hypothesis that md-aMCI is a later stage of AD compared to sd-aMCI. Such spreading of atrophy into frontal lobe and posterior cingulate is similar to that seen in AD patients and is consistent with previous reports (10). The thinning in md-aMCI (relative to NC) covers regions functionally associated with visual perception (precuneus, cuneus, lateral occipitotemporal gyrus, and fusiform gyrus), spatial ability (parietal lobe and precuneus), language (inferior parietal, supra marginal, and frontal pole), behavioral regulation (superior frontal gyrus and frontal pole), executive function (precuneus), and motor skills (paracentral lobe). Some regions (fusiform gyrus and temporal pole) are in agreement with those reported in Ref. (9, 12), although additional differences were observed.
Relative to sd-aMCI, md-aMCI presented significantly more thinning in the right insula, right middle frontal gyrus, right precuneus, right posterior cingulate cortex, right superior frontal gyrus, right gyrus rectus, right superior frontal gyrus, and right inferior frontal gyrus (see Figure 4). This is expected as the sd-aMCI patients exhibit impairment in memory domain only and md-aMCI patients exhibit impairment in additional domains. The regions found to be significantly different are located mostly in the frontal and occipital lobes and are functionally associated with personality, behavior (frontal gyrus), attention (posterior cingulate), emotion (insula), executive, and visuospatial skills (precuneus). The differences found in posterior cingulate, temporal and frontal regions are consistent with those reported in Ref. (9, 13) and those found in precuneus are consistent with the experiments in Ref. (12). However, we find many additional differences compared to Ref. (12, 13). In our study, the differences noticed in md-aMCI relative to sd-aMCI are predominantly in the right hemisphere (see Figure 4B). Such hemispheric asymmetry to the right is consistent with Ref. (13). However, our findings are in disagreement with Ref. (12), where a left predominant atrophy is reported.
The disagreement in the set of regions found to be significantly different among the three studies may be attributed to the use of different cohorts for each study and substantial heterogeneity in the MCI construct, as well as class-imbalance in cohorts. Our cohort consists of community-dwelling residents in Sydney, Australia, whereas the cohort used in Ref. (12) comes from South Korea and the study presented in Ref. (13) is part of Alzheimer’s Disease Neuro-imaging Initiative, which sources patients from various sites in the United States. It is to be noted also that the sample sizes are unbalanced across domain types in Ref. (12), which can be another reason for detecting relatively smaller number of differences.
Analysis of the group differences and characterizing the patterns of differences is useful. Confirming the presence of differences across groups and comparing them with other studies improves our understanding of these classes. But this knowledge as such is insufficient to build an imaging biomarker that could accurately identify the different groups. Often the differences found aren’t strong enough to serve as a reliable biomarker for prediction. In this study, the classification power of cortical thickness has been assessed in accurately identifying the two sub-types of aMCI and normal controls. We performed the comparisons in a multiple pair-wise fashion using SVM as described in Section 2.6.
Looking at the best performance of the classifier for each pair, optimized via model selection and as compared in Table 4, we observe that classification performance is rather moderate. In fact, the classifier’s performance achieved significance over chance only in NC vs. md-aMCI experiment, and it was not significant in NC vs. sd-aMCI and sd-aMCI vs. md-aMCI. This is expected, as the differences among the groups are moderate at best (also see Figure 6).
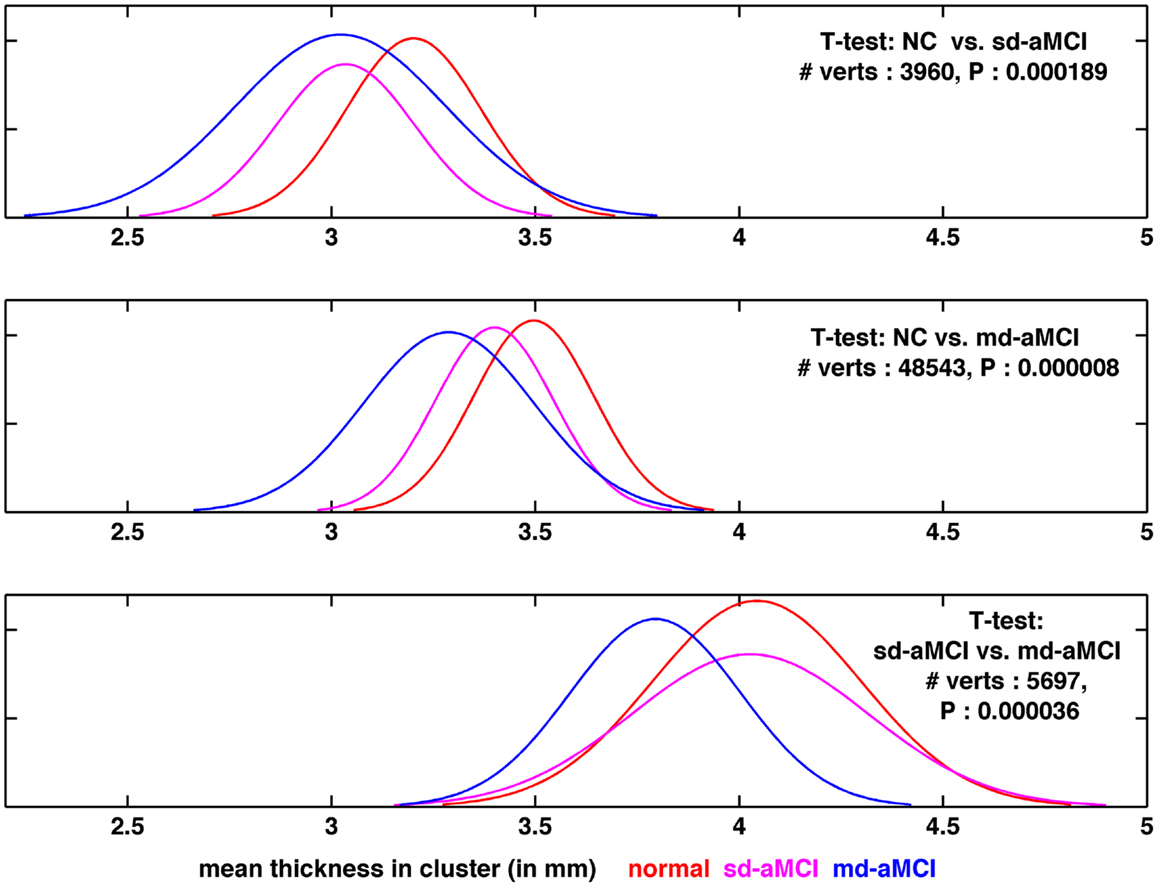
Figure 6. Visualization of the distribution of thickness in the region found to be the most significantly different for each pair-wise comparison, as visualized in Figures 2B, 3B, and 4B, respectively from top to bottom.
We have also performed experiments in classifying the 3 groups directly in a 3-class setting with several multi-class classifiers including Decision Trees (J48) as well as multi-class SVMs. This is the first study to attempt the sub-classification of MCI, using either binary classifiers or multi-class classifiers. The best performance of the 3-class classifiers was AUC ≈ 0.6. This moderate performance is not unexpected given that the best performance of classifiers in the binary classification experiments (Table 4) is only moderate.
To gain further insight into the results, the distribution of thickness in the area found to be the most significantly different (lowest p-value), among those areas, which are significantly different between a given pair, has been visualized. For comparison purposes, we plotted the distribution for the remaining group as well. The comparison of thickness distribution for the three pair-wise tests is shown in Figure 6.
In the top plot of Figure 6, the histograms of mean thickness for all subjects in the most significantly different area for differences between NC (in red) and sd-aMCI (magenta) are compared. A smooth Gaussian is fitted for each histogram for ease of visualization. It is easy to see that the means of NC and sd-aMCI are separated, but there still exists a large overlap between them. The differences are enough to survive the multiple-comparison test as a cluster (Figure 2B), but not well separated. Moreover, if we compare these two groups with md-aMCI, md-aMCI completely overlaps with sd-aMCI. Very similar trends can be observed in other visualizations as well in the middle and bottom rows in Figure 6, i.e., the two groups under comparison, e.g., sd-aMCI and md-aMCI in the bottom row exhibit a small separation of means (magenta and blue curves), but still have a large overlap in the distribution. Moreover, the third group (NC) almost coincides with the group closest to it in disease severity level (in this case sd-aMCI).
Such large overlap in the thickness distribution, we believe, is the primary reason for moderate classification performance. This is expected as the differences, as seen in cortical thickness extracted from structural MRI scans, among the three groups at such an early stage of impairment are subtle at best. In addition, it is to be noted that the diagnosis of MCI is not very stable yet, e.g., high rates of reversion to normal are reported in Ref. (33, 34) and significant percentage of subjects convert to other sub-types (34). This can be another reason for moderate classification performance.
It is to be noted that one of the limitations in this study is the lack of histopathological confirmation for the clinical diagnoses employed in this study. Another limitation is the scanner upgrade midway, which is not modeled into our analysis. Even though there were minor cohort differences across the two scanners in some of demographic parameters, previous studies have suggested that when vendor, field strength, and acquisition parameters remained unchanged, data collected during scanner upgrades could be pooled (19). Another study (35) concluded that scanner upgrade did not increase the measurement variability nor introduce bias and that applying smoothing filters (which we have done with 10 mm FWHM Gaussian kernel) on the raw thickness maps can substantially reduce that thickness measurement variability. Further, the number of subjects in each diagnostic group belonging to the two scanners are: CN (scanner 1: 20 and scanner 2: 22), sd-aMCI (18/20), and md-aMCI (15/17). This shows a fairly even distribution across the two scanners, indicating that the chances of significant bias toward one scanner are greatly reduced. However, for the sake of completeness, we have performed additional experiments to investigate if there is any effect of scanner upgrade on the classification results. To this regard, we have regressed out the scanner upgrade factor from the cortical thickness features, and used the residuals to form the new set of features for classification. We repeat the classification procedure as detailed in Section 2.6, and the results (AUC of 0.52, 0.67, and 0.55 in the three pair-wise experiments, respectively) did not differ from the previous results presented in Table 4.
In conclusion, this study contributes to the important discussion of prognosis of MCI sub-types and in particular in assessing the classificatory power of sMRI features in distinguishing the sub-types of MCI. Our analysis revealed a wider spread of cortical thinning in md-aMCI (relative to NC) compared to sd-aMCI, adding evidence to the hypothesis that md-aMCI is a later stage of AD compared to sd-aMCI. Classification results from our study show that baseline cortical thickness alone does not have sufficient discriminability to differentiate normal controls, sd-aMCI, and md-aMCI from each other. However, it is currently not known whether longitudinal rates of change in thickness offer discrimination between sd-aMCI and md-aMCI, which would be worth investigating. We speculate that longitudinal features might improve the prediction accuracy of which patients are at risk of developing dementia. Fusion of subcortical features, white matter lesion features, as well as complementary features from other modalities such as FDG-PET or PiB-PET (which directly measures the presence of pathological features, if present) may substantially improve the ability in accurately identifying sub-types of aMCI.
Conflict of Interest Statement
The authors declare that the research was conducted in the absence of any commercial or financial relationships that could be construed as a potential conflict of interest.
Acknowledgments
We gratefully acknowledge funding support from Alzheimer Society Canada for both Pradeep Reddy Raamana and Mirza Faisal Beg. The authors thank all participants and their supporters in the Sydney Memory and Ageing Study (MAS), and the MAS research team. This study was supported by a National Health and Medical Research Council of Australia Program Grant (no. 350833) and Capacity Building Grant (no. 568940).
References
1. Braak H, Del Tredici K. The pathological process underlying Alzheimer’s disease in individuals under thirty. Acta Neuropathol (2011) 121(2):171–81. doi: 10.1007/s00401-010-0789-4
2. Amieva H, Le Goff M, Millet X, Orgogozo JM, Pérès K, Barberger Gateau P, et al. Prodromal Alzheimer’s disease: successive emergence of the clinical symptoms. Ann Neurol (2008) 64(5):492–8. doi:10.1002/ana.21509
3. Braak H, Braak E. Neuropathological stageing of Alzheimer-related changes. Acta Neuropathol (1991) 82(4):239–59. doi:10.1007/BF00308809
4. Petersen RC. Early diagnosis of Alzheimer’s disease: is MCI too late? Curr Alzheimer Res (2009) 6(4):324. doi:10.2174/156720509788929237
5. Yaffe K, Petersen RC, Lindquist K, Kramer J, Miller B. Subtype of mild cognitive impairment and progression to dementia and death. Dement Geriatr Cogn Disord (2006) 22(4):312–9. doi:10.1159/000095427
6. Bäckman L, Jones S, Berger A-K, Laukka EJ, Small BJ. Multiple cognitive deficits during the transition to Alzheimer’s disease. J Intern Med (2004) 256(3):195–204. doi:10.1111/j.1365-2796.2004.01386.x
7. Brodaty H, Heffernan M, Kochan NA, Draper B, Trollor JN, Reppermund S, et al. Mild cognitive impairment in a community sample: the Sydney Memory and Ageing Study. Alzheimers Dement (2013) 9(3):310.e–7.e. doi:10.1016/j.jalz.2011.11.010
8. Alexopoulos P, Grimmer T, Perneczky R, Domes G, Kurz A. Progression to dementia in clinical subtypes of mild cognitive impairment. Dement Geriatr Cogn Disord (2006) 22(1):27–34. doi:10.1159/000093101
9. Bell-McGinty S, Lopez OL, Meltzer CC, Scanlon JM, Whyte EM, Dekosky ST, et al. Differential cortical atrophy in subgroups of mild cognitive impairment. Arch Neurol (2005) 62(9):1393–7. doi:10.1001/archneur.62.9.1393
10. Whitwell J, Petersen R, Negash S. Patterns of atrophy differ among specific subtypes of mild cognitive impairment. Arch Neurol (2007) 64(8):1130–8. doi:10.1001/archneur.64.8.1130
11. Brambati SM, Belleville S, Kergoat M-J, Chayer C, Gauthier S, Joubert S. Single- and multiple-domain amnestic mild cognitive impairment: two sides of the same coin? Dement Geriatr Cogn Disord (2009) 28(6):541–9. doi:10.1159/000255240
12. Seo S, Im K, Lee J, Kim Y, Kim S, Kim S, et al. Cortical thickness in single-versus multiple-domain amnestic mild cognitive impairment. Neuroimage (2007) 36(2):289–97. doi:10.1016/j.neuroimage.2007.02.042
13. Fennema-Notestine C, Hagler DJ, McEvoy LK, Fleisher AS, Wu EH, Karow DS, et al. Structural MRI biomarkers for preclinical and mild Alzheimer’s disease. Hum Brain Mapp (2009) 30(10):3238–53. doi:10.1002/hbm.20744
14. Sachdev PS, Brodaty H, Reppermund S, Kochan NA, Trollor JN, Draper B, et al. The Sydney Memory and Ageing Study (MAS): methodology and baseline medical and neuropsychiatric characteristics of an elderly epidemiological non-demented cohort of Australians aged 70-90 years. Int Psychogeriatr (2010) 22(08):1248–64. doi:10.1017/S1041610210001067
15. Folstein M, Folstein S, McHugh P. Mini-mental state: a practical method for grading the cognitive state of patients for the clinician. J Psychiatr Res (1975) 12(3):189–98. doi:10.1016/0022-3956(75)90026-6
16. Anderson TM, Sachdev PS, Brodaty H, Trollor JN, Andrews G. Effects of sociodemographic and health variables on Mini-Mental State Exam scores in older Australians. Am J Geriatr Psychiatry (2007) 15(6):467–76. doi:10.1097/JGP.0b013e3180547053
17. Kochan N, Slavin M, Brodaty H, Crawford J, Trollor J, Draper B, et al. Effect of different impairment criteria on prevalence of “objective” mild cognitive impairment in a community sample. Am J Geriatr Psychiatry (2010) 18(8):711. doi:10.1097/JGP.0b013e3181d6b6a9
18. Liu T, Wen W, Zhu W, Trollor J, Reppermund S, Crawford J, et al. The effects of age and sex on cortical sulci in the elderly. Neuroimage (2010) 51(1):19–27. doi:10.1016/j.neuroimage.2010.02.016
19. Stonnington CM, Tan G, Klöppel S, Chu C, Draganski B, Jack CR Jr, et al. Interpreting scan data acquired from multiple scanners: a study with Alzheimer’s disease. Neuroimage (2008) 39(3):1180–5. doi:10.1016/j.neuroimage.2007.09.066
20. Fischl B, Salat DH, Busa E, Albert M, Dieterich M, Haselgrove C, et al. Whole brain segmentation: automated labeling of neuroanatomical structures in the human brain. Neuron (2002) 33(3):341–355. doi:10.1016/S0896-6273(02)00569-X
21. Gibson E, Wang L, Beg MF. Cortical thickness measurement using Eulerian PDEs and surface-based global topological information. Organization for Human Brain Mapping, 15th Annual Meeting. San Francisco, CA (2009).
22. Yezzi AJ, Prince JL. An Eulerian PDE approach for computing tissue thickness. IEEE Trans Med Imaging (2003) 22:10. doi:10.1109/TMI.2003.817775
23. Lerch JP, Evans AC. Cortical thickness analysis examined through power analysis and a population simulation. Neuroimage (2005) 24(1):163–73. doi:10.1016/j.neuroimage.2004.07.045
24. Cui Y, Wen W, Lipnicki D, Beg M, Jin J, Luo S, et al. Automated detection of amnestic mild cognitive impairment in community-dwelling elderly adults: a combined spatial atrophy and white matter alteration approach. Neuroimage (2011) 59(2):1209–17. doi:10.1016/j.neuroimage.2011.08.013
25. Beg MF, Raamana PR, Barbieri S, Wang L. Comparison of four shape features for detecting hippocampal shape changes in early Alzheimer’s. Stat Methods Med Res (2013) 22(4):439–62. doi:10.1177/0962280212448975
26. Chung MK, Worsley KJ, Nacewicz BM, Dalton KM, Davidson RJ. General multivariate linear modeling of surface shapes using surfstat. Neuroimage (2010) 53(2):491–505. doi:10.1016/j.neuroimage.2010.06.032
27. Franc V, Hlavác V. Statistical Pattern Recognition Toolbox for Matlab. Research Report CTU-CMP-2004-08. Prague: Czech Technical University (2004).
28. Fitzpatrick M, Sonka M. Handbook of Medical Imaging, Volume 2: Medical Image Processing & Analysis (PM80). Bellingham, WA: SPIE-International Society for Optical Engineering (2000).
29. Raamana PR, Wang L, Beg MF. Thickness network (thicknet) features for the detection of prodromal ad. Proceedings of MICCAI Machine Learning in Medical Imaging Workshop. Springer-Verlag (2013). p. 115–23.
30. Worsley KJ, Taylor JE, Tomaiuolo F, Lerch J. Unified univariate and multivariate random field theory. Neuroimage (2004) 23(1):189. doi:10.1016/j.neuroimage.2004.07.026
31. Fawcett T. An introduction to ROC analysis. Pattern Recognit Lett (2006) 27(8):861–74. doi:10.1016/j.patrec.2005.10.010
32. Witten IH, Frank E. Data Mining: Practical Machine Learning Tools and Techniques. San Francisco, CA: Morgan Kaufmann (2005).
33. Busse A, Hensel A, Guhne U, Angermeyer MC, Riedel-Heller SG. Mild cognitive impairment: long-term course of four clinical subtypes. Neurology (2006) 67(12):2176–85. doi:10.1212/01.wnl.0000249117.23318.e1
34. Han JW, Kim TH, Lee SB, Park JH, Lee JJ, Huh Y. Predictive validity and diagnostic stability of mild cognitive impairment subtypes. Alzheimers Dement (2012) 8(6):553–9. doi:10.1016/j.jalz.2011.08.007
35. Han X, Jovicich J, Salat D, van der Kouwe A, Quinn B, Czanner S, et al. Reliability of MRI-derived measurements of human cerebral cortical thickness: the effects of field strength, scanner upgrade and manufacturer. Neuroimage (2006) 32(1):180–94. doi:10.1016/j.neuroimage.2006.02.051
Appendix
Estimation of the Common Atlas
After the extraction of cortical thickness from each subject, the surface of each subject has been registered to that of a common atlas. This atlas is derived from averaging 80 healthy controls using tools from Freesurfer. With the help of Talairach transform computed for each subject, Talairach (MNI305) coordinates for each vertex are computed. These coordinates (from the 80 subjects) are averaged after mapping them to the common surface (which overlays well on the average MNI305 volume). Below, the list of all subjects that were part of this averaging are presented in Table A1.
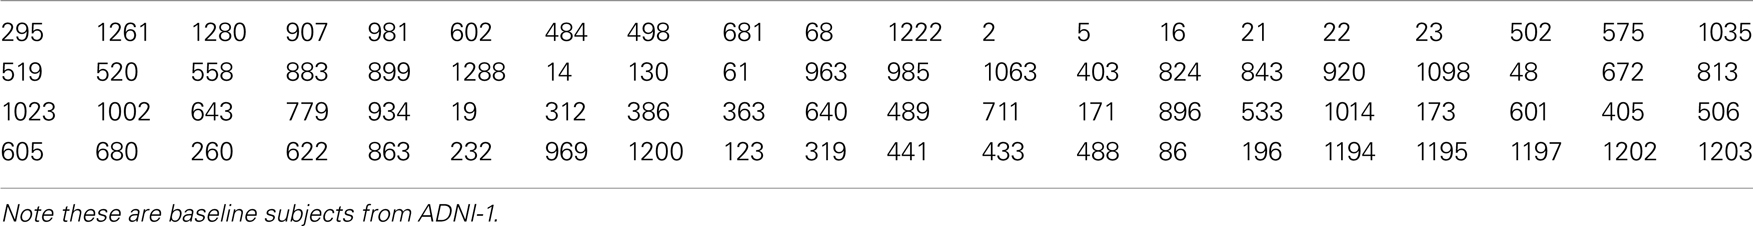
Table A1. List of IDs of the subjects used for the estimation of average atlas.
Comparison of Significantly Differing Regions Across the Experiments
A comprehensive comparison of the list of brain regions, which exhibited significant group differences in the three pair-wise comparisons are presented in Table A2.
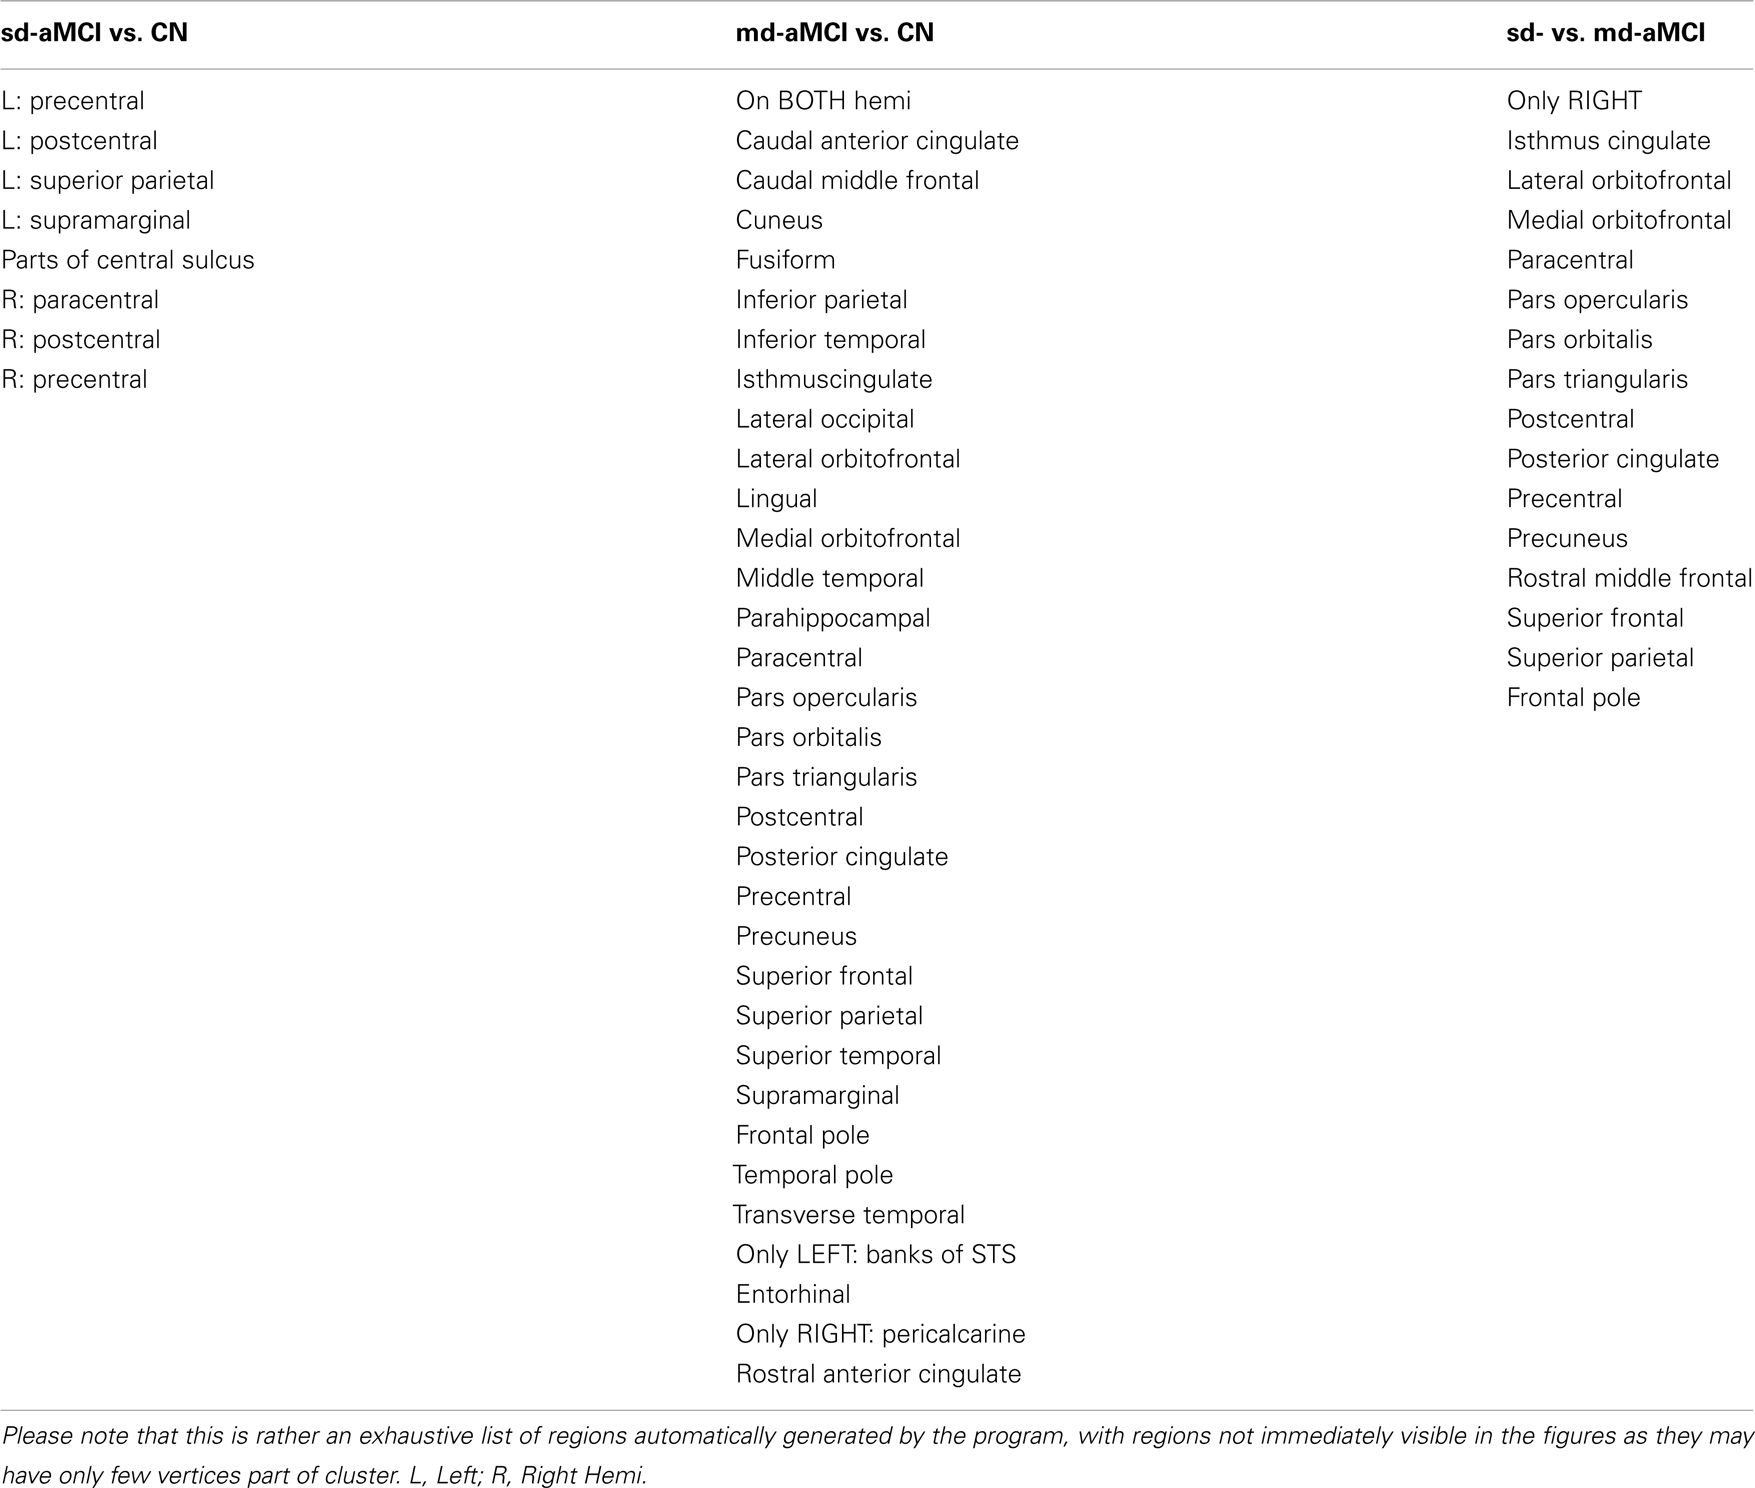
Table A2. Comparison of the cortical locations in the brain found to be significantly different between the three different pairs from the current study.
Keywords: amnestic, mild cognitive impairment, subtype, cortical thickness, classification, early detection, Alzheimer
Citation: Raamana PR, Wen W, Kochan NA, Brodaty H, Sachdev PS, Wang L and Beg MF (2014) The sub-classification of amnestic mild cognitive impairment using MRI-based cortical thickness measures. Front. Neurol. 5:76. doi: 10.3389/fneur.2014.00076
Received: 14 February 2014; Accepted: 02 May 2014;
Published online: 21 May 2014.
Edited by:
Iliya Lefterov, University of Pittsburgh, USAReviewed by:
Ann Cohen, University of Pittsburgh School of Medicine, USAKinga Szigeti, University at Buffalo, USA
Copyright: © 2014 Raamana, Wen, Kochan, Brodaty, Sachdev, Wang and Beg. This is an open-access article distributed under the terms of the Creative Commons Attribution License (CC BY). The use, distribution or reproduction in other forums is permitted, provided the original author(s) or licensor are credited and that the original publication in this journal is cited, in accordance with accepted academic practice. No use, distribution or reproduction is permitted which does not comply with these terms.
*Correspondence: Pradeep Reddy Raamana, School of Engineering Science, Simon Fraser University, Burnaby, BC V5A 1S6, Canada e-mail: pkr1@sfu.ca
†Lei Wang and Mirza Faisal Beg have contributed equally to this work.