 Eric P. Thelin
 David W. Nelson
 Per Hamid Ghatan3
 Bo-Michael Bellander
- 1Section for Neurosurgery, Department of Clinical Neuroscience, Karolinska Institutet, Karolinska University Hospital Solna, Stockholm, Sweden
- 2Section of Anesthesiology and Intensive Care, Department of Physiology and Pharmacology, Karolinska Institutet, Stockholm, Sweden
- 3Department of Clinical Neuroscience, Karolinska Institutet, Stockholm, Sweden
Background: Neuro-intensive care following traumatic brain injury (TBI) is focused on preventing secondary insults that may lead to irreversible brain damage. Microdialysis (MD) is used to detect deranged cerebral metabolism. The clinical usefulness of the MD is dependent on the regional localization of the MD catheter. The aim of this study was to analyze a new method of continuous cerebrospinal fluid (CSF) monitoring using the MD technique. The method was validated using conventional laboratory analysis of CSF samples. MD-CSF and regional MD-Brain samples were correlated to patient outcome.
Materials and Methods: A total of 14 patients suffering from severe TBI were analyzed. They were monitored using (1) a MD catheter (CMA64-iView, n = 7448 MD samples) located in a CSF-pump connected to the ventricular drain and (2) an intraparenchymal MD catheter (CMA70, n = 8358 MD samples). CSF-lactate and CSF-glucose levels were monitored and were compared to MD-CSF samples. MD-CSF and MD-Brain parameters were correlated to favorable (Glasgow Outcome Score extended, GOSe 6–8) and unfavorable (GOSe 1–5) outcome.
Results: Levels of glucose and lactate acquired with the CSF-MD technique could be correlated to conventional levels. The median MD recovery using the CMA64 catheter in CSF was 0.98 and 0.97 for glucose and lactate, respectively. Median MD-CSF (CMA 64) lactate (p = 0.0057) and pyruvate (p = 0.0011) levels were significantly lower in the favorable outcome group compared to the unfavorable group. No significant difference in outcome was found using the lactate:pyruvate ratio (LPR), or any of the regional MD-Brain monitoring in our analyzed cohort.
Conclusion: This new technique of global MD-CSF monitoring correlates with conventional CSF levels of glucose and lactate, and the MD recovery is higher than previously described. Increase in lactate and pyruvate, without any effect on the LPR, correlates to unfavorable outcome, perhaps related to the presence of erythrocytes in the CSF.
Introduction
Traumatic brain injury (TBI) is a common cause of death and disability, increasing globally, with subsequent rising costs for society (1). The neuro-intensive care following TBI is focused on monitoring and preventing harmful secondary insults that may lead to irreversible brain damage (2, 3). The microdialysis (MD) technique is used to analyze focal brain biochemistry in patients suffering from TBI, examining concentrations of pyruvate, glucose, glycerol, and lactate in the extracellular fluid (ECF) (4). Glucose, being the main substrate for brain energy metabolism, will through glycolysis become pyruvate, which in normoxic conditions enters the mitochondria and becomes part of the citrate cycle. During hypoxic conditions, energy production will decrease while lactate levels, and the lactate:pyruvate ratio (LPR), will increase as a sign of tissue ischemia (5). In contrast, if pyruvate levels remain normal and lactate levels increase, ongoing mitochondrial dysfunction has been suggested (6). Glycerol, abundant in cell membrane, might be released and increase in the ECF as a sign of ongoing cell death (7).
Despite a consensus report on the clinical use of MD for TBI patients (8), the translation of the technique from research to bedside has been slow (9). An obstacle with the MD technique is the catheter placement. In order to optimize the monitoring capabilities, the catheter has been suggested to be best placed in the border zone of injuries, monitoring focal tissue at risk (8, 10–12). However, the results yielded by different catheter placements, and their correlation to outcome, have been questioned (13), and a pericontusional area is not readily detectable in diffuse TBI. Even if pericontusional tissue is monitored with MD, monitoring has been shown to present very heterogeneous metabolic results, proving accurate focal monitoring difficult (14). In contrast, a different approach to monitor potential variations has also been advocated, where the catheter is placed in non-pericontusional, non-affected brain tissue in order to detect more global metabolic changes (15).
The ECF and the cerebrospinal fluid (CSF) have been shown to demonstrate comparable pharmacokinetics and concentrations of administered drugs (16, 17). Also, data suggest that there is a flow of proteins between the ECF and CSF (18). Hence, analyzing the CSF could reflect changes in the ECF. Studies on the flow of metabolites, such as glucose, lactate, pyruvate, and glycerol between ECF and CSF are however limited. In contrast to proteins, their movements are often facilitated by their small size yet regulated by transporter proteins commonly following the concentration gradient between different compartments.
A MD-sampling of CSF is motivated to avoid infectious complications. About 10% of neurosurgical cases suffer from some kind of surgical-related infection, with about 4% risk of developing bacterial meningitis (BM) (19). Decreased CSF-glucose and increased CSF-lactate levels are since long recognized changes in BM (20), but also important predictors for developing a clinical BM following neurosurgical procedures (21). This study presents a CSF monitoring method using the MD technique. One of the major benefits of the current monitoring setup is that it is in a closed system, lowering the risks of infection and other mechanical complications.
Aims
The aim was to validate a method of global MD monitoring by using a MD catheter placed in CSF. As a secondary aim, conventional CSF samples were used to calculate the recovery of the MD catheter and to correlate MD-CSF and MD-Brain parameters to patient outcome.
Materials and Methods
Inclusion Criteria
Fourteen patients suffering from severe TBI were included between January 1, 2010 and December 31, 2012. The slow inclusion rate was due to the intermittent availability of the first author and did not represent a patient-selection process. The patients were monitored with an intracerebral 20 kDa MD catheter (MD-Brain). An additional 20 kDa MD catheter (CMA 64 IView, CMA Microdialysis AB, Solna, Sweden) was placed in the CSF through a LiquoGuard® pump system (Möller-Medical, Fulda, Germany) (MD-CSF). The study was approved by the local ethics committee in Stockholm County (application #2009/1112-31).
Treatment
All patients suffered from severe TBI (GCS 3–8 at admission) and were intubated, mechanically ventilated, and sedated with morphine, midazolam, or propofol. If mass lesions were present, they were evacuated as deemed appropriate. Intracranial pressure (ICP) was measured using an extra ventricular drain (EVD) (Medtronic, USA). The transducer for the EVD was placed at the level of the foramen of Monroe. Patients’ heads were elevated to a 30° angle. If traumatic subarachnoid hemorrhage was substantial, transcranial doppler was performed and Nimodipine treatment given. Initially, clear fluids were provided and within 24 h after trauma, naso-gastric tubing was generally used to constantly feed the patient.
A LiquoGuard® (Möller-Medical, Fulda, Germany) system was used (22, 23) to slowly evacuate CSF. The draining velocity of CSF was set to 2 mL/h. The LiquoGuard® simultaneously measures ICP by monitoring CSF pressure pulsation with the sensor placed at the same height as the EVD transducer (23), making it possible to measure ICP and drain CSF at the same time.
Conventional CSF sampling was performed twice a week as a routine management in patients with EVD to screen for potential infection, or more often if deemed clinically motivated, analyzing CSF-cells (manually counted using microscopy techniques), CSF-lactate, CSF-glucose, CSF-albumin (UniCel DxC 800, Beckman Coulter Inc., Brea, CA, USA), and performing CSF cultures at the Department of Laboratory Medicine, Karolinska University Hospital.
Admission and Biomarker Parameters
Glasgow Coma Scale (24) and pupil responsiveness (0), unilateral unresponsiveness (1), or bilateral unresponsiveness (2) were acquired at the admission to the hospital. Injury severity score (ISS) (25) and abbreviated injury score (AIS) were assessed (26). Two biomarkers of brain injury, S100B (27) and neuron-specific enolase (NSE) (28), were analyzed. Serum S100B was sampled every 12 h and peak serum levels of S100B 12–36 h after trauma were acquired as clinical routine (29), using an electrochemiluminescence assay (Elecsys System®, Roche Diagnostics, Basel, Switzerland). Peak serum levels of NSE were analyzed using an immunoradiometric assays (LIAISON®, DiaSorin, Italy) (30).
Neuroradiology
Intracranial lesions at admission were noted and graded according to Marshall CT-score (31), Rotterdam CT-Score (32), and Stockholm CT-Score (33). The patients were assessed regarding catheter placement according to a previous definition (13, 34); pericontusional location (within 2 cm of a mass lesion, contusion, or hematoma border) or ipsilateral (further away than 2 cm of any lesion, yet in the affected hemisphere), as seen on the postoperative CT scan.
Outcome
A physician, board certified in neuro-rehabilitation, examined the patients 6 months after trauma assessing extended Glasgow Outcome Score (GOSe) (35). GOSe is graded in eight levels where GOSe 1 = death and GOSe 8 = upper good recovery. GOSe have been previously dichotomized into unfavorable (GOSe 1–4) vs favorable (GOSe 5–8) outcome (36), and GOSe 1–6 vs GOSe 7–8 (15). In the current study, outcome was dichotomized as unfavorable (GOSe 1–5) and favorable (GOSe 6–8), as this also correlated in our study with conventional Glasgow Outcome Score (GOS) dichotomized into unfavorable (GOS 1–3) and favorable (GOS 4–5) outcome.
Microdialysis
A 20 kDa cutoff cerebral MD catheter (CMA 70, 10 mm membrane, μ-dialysis AB, Stockholm, Sweden) was inserted into the brain parenchyma, adjacent to the ventricular drain in the affected hemisphere in a diffuse brain injury or when further craniotomy was not performed, or next to the lesion in a focal brain injury, during the initial neurosurgery at admission. Post-surgery at the NICU, the MD catheter was connected to a MD pump (CMA 106, μ-dialysis AB, Stockholm, Sweden) where a commercially available perfusion fluid (“Perfusion Fluid CNS”, μ-dialysis AB, Stockholm, Sweden), pumped at 0.3 μL/min, was used as carrier for all MD metabolites. Another 20 kDa cut off catheter (CMA 64 iView, 10 mm membrane, μ-dialysis AB, Stockholm, Sweden), with a CMA 106 MD pump, was placed inside a four-way stopcock (Multiflo 3, BD Connecta, Franklin Lakes, NJ, USA) (Figure 1), connected to the LiquoGuard® CSF-pump, located in the draining CSF at all times. Membrane length and dialysis perfusion flow rate are factors known to affect recovery and were thus standardized for all catheters used (37). The CMA64 catheter has, when placed in a peripheral vein, shown an adequate congruence (80% MD recovery) between CMA64 MD-glucose and plasma glucose levels (38, 39).
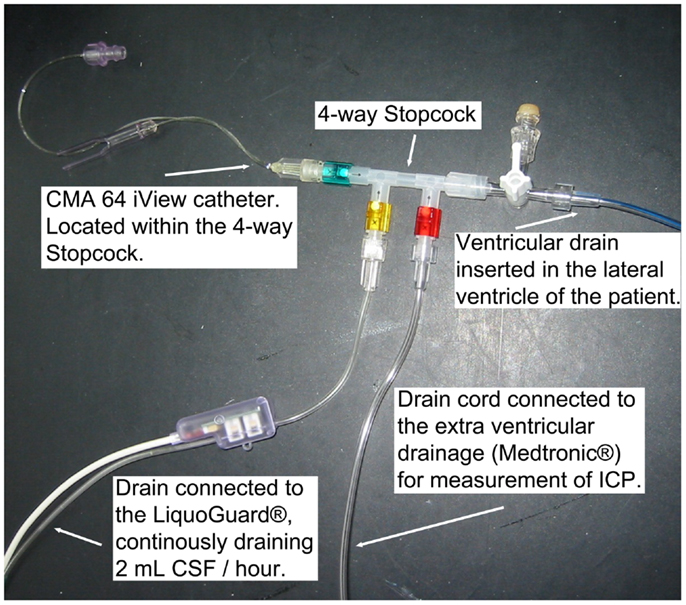
Figure 1. The monitoring setup, illustrating the CMA 64 MD catheter in a closed system of flowing CSF.
The MD pumps acquired samples were stored in microvials (holding 200 μL). The microvials were analyzed simultaneously every hour with a CMA 600 enzyme photometric analyzer (μ-dialysis AB, Stockholm, Sweden). The CMA 70 catheter has been shown to have a 65–72% substance recovery from the ECF (40). Withdrawal of MD monitoring was performed if the patient became conscious or the catheter was accidentally removed or malfunctioned in any other way.
Median data, and interquartile range, of all MD parameters (glycerol data not normally distributed) were used in the analysis, as in previous studies (11, 15).
The latest MD-CSF sample acquired was compared to the conventional CSF sample that was drawn, as not to affect the local concentrations in the flowing CSF measured by MD-CSF. Recovery was assessed by calculating the MD/CSF ratio for glucose, as well as lactate, for each CSF sample obtained and compared to the closest acquired MD-sample.
Statistical Analysis
The statistical program R (R Foundation for Statistical Computing, Vienna, Austria; http://www.R-project.org) was used. The “rms”-package in R was used to perform univariate logistic regression analyses, analyzing the correlations between differences of CSF and MD-CSF glucose and MD-CSF lactate, as well as for outcome predictions. As a consequence of the limited sample size, a Bonferroni correction (×9) was used to decrease the rate of a potential false positive result (41). Bland–Altman plots were used to visualize congruence between conventional CSF samples and MD-CSF samples (42), adjusted for repeated measures (43). A Mann–Whitney U Test was used to assess association between median MD parameters and favorable and unfavorable outcome. Trend curves displaying the different MD metabolites were illustrated with linear plots built in Graph Pad Prism 6.0 (GraphPad Software Inc., 2014).
Results
Epidemiological Data
The admission characteristics of the 14 patients included are described in Table 1. A total of six patients had a favorable outcome (GOSe 6–8), while eight had an unfavorable outcome (GOSe 1–5), among them, two patients died. Catheter placement was predominantly non-pericontusional (n = 9).
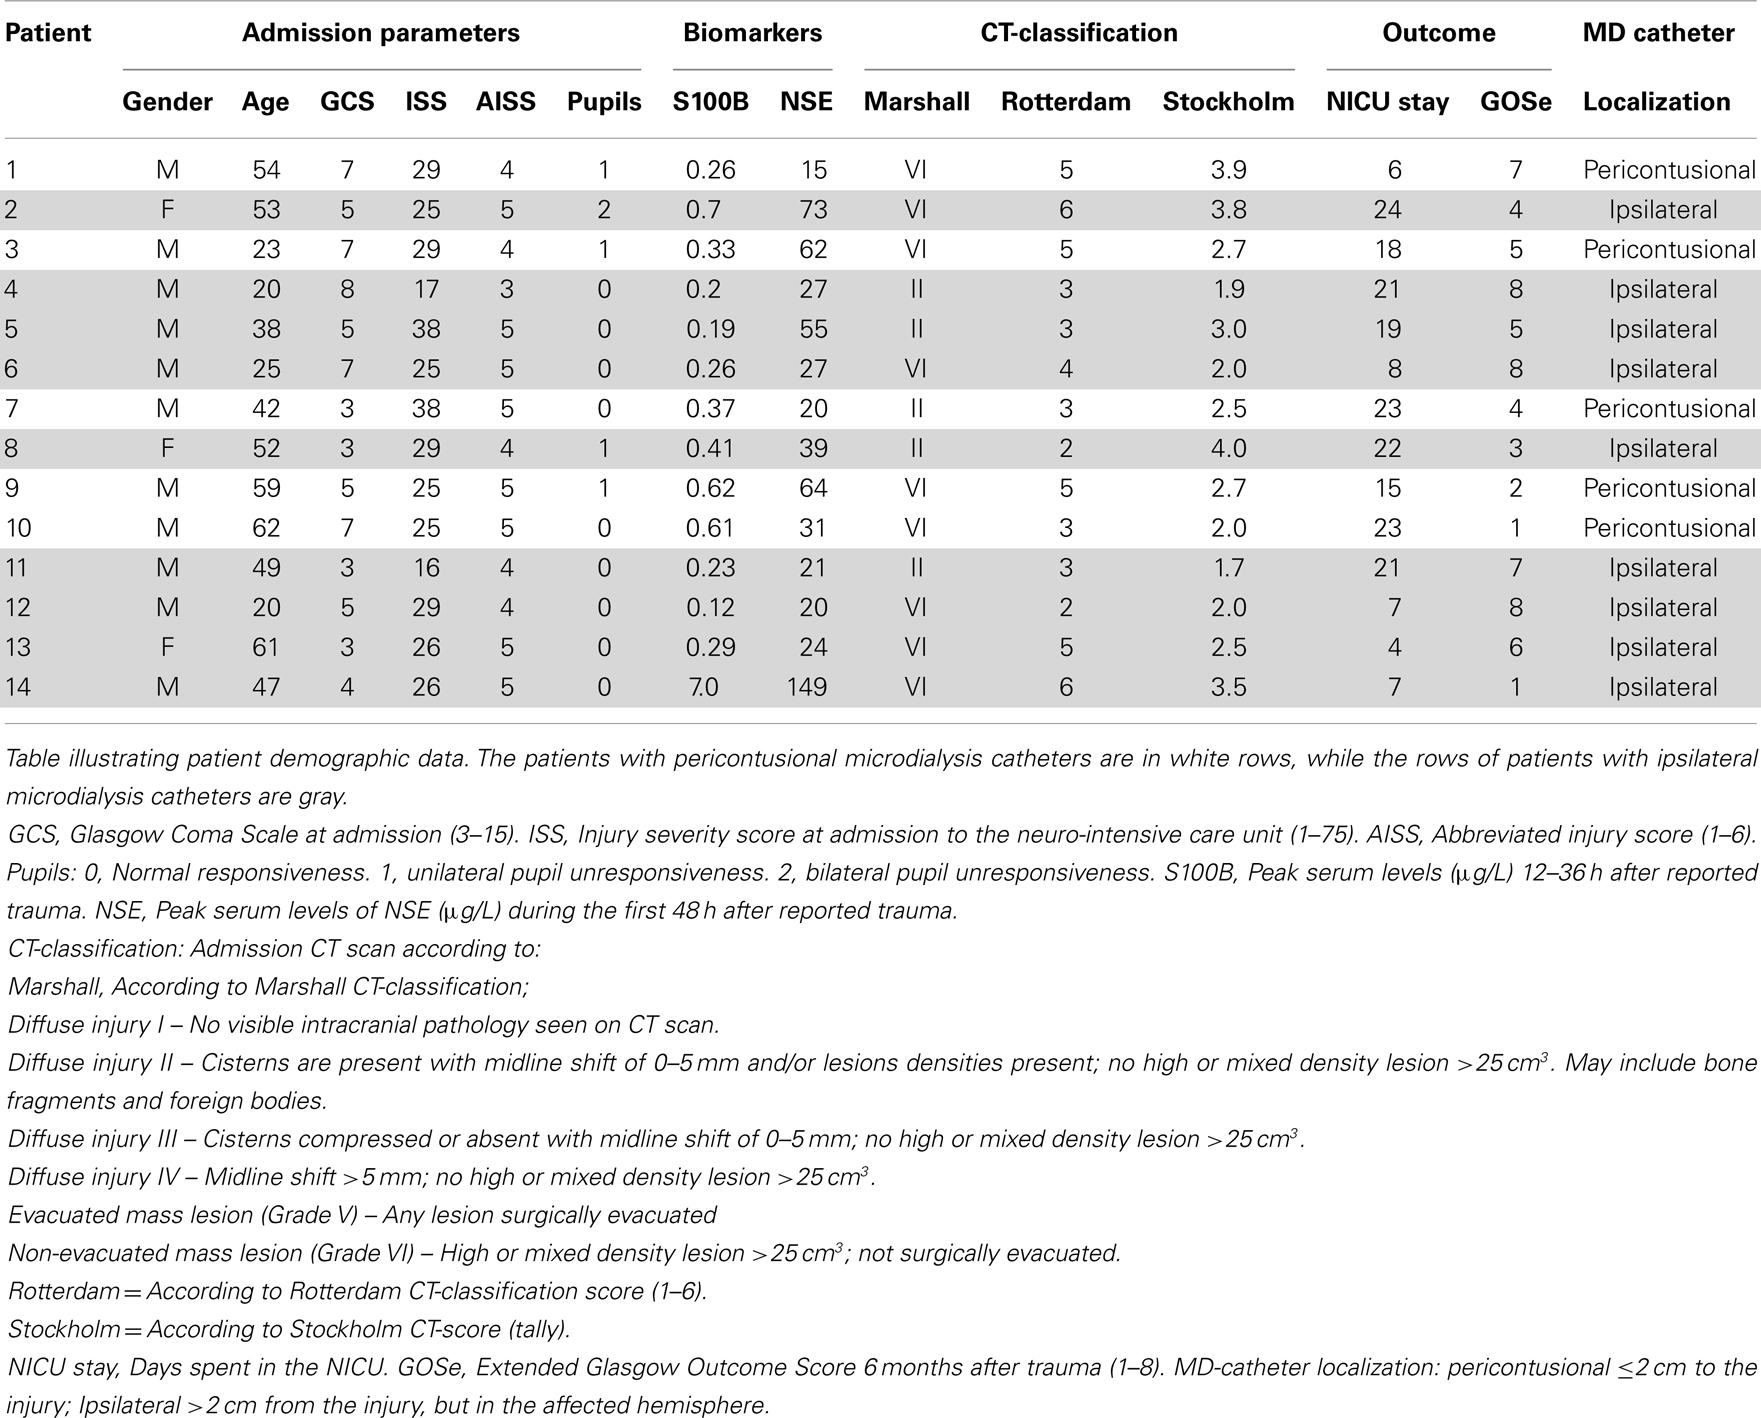
Table 1. Demographics.
Table 2 shows all the acquired MD data as median levels (and 1st–3rd quartiles). The number of MD samples acquired for each patient varied between n = 30 and n = 265 per patient, depending on NICU stay and sample type. Thus, Table 2 also provides the duration of MD monitoring in hours from admission, 1 day up to about 11 days. Table 3 illustrates the conventional CSF samples and the different parameters analyzed.
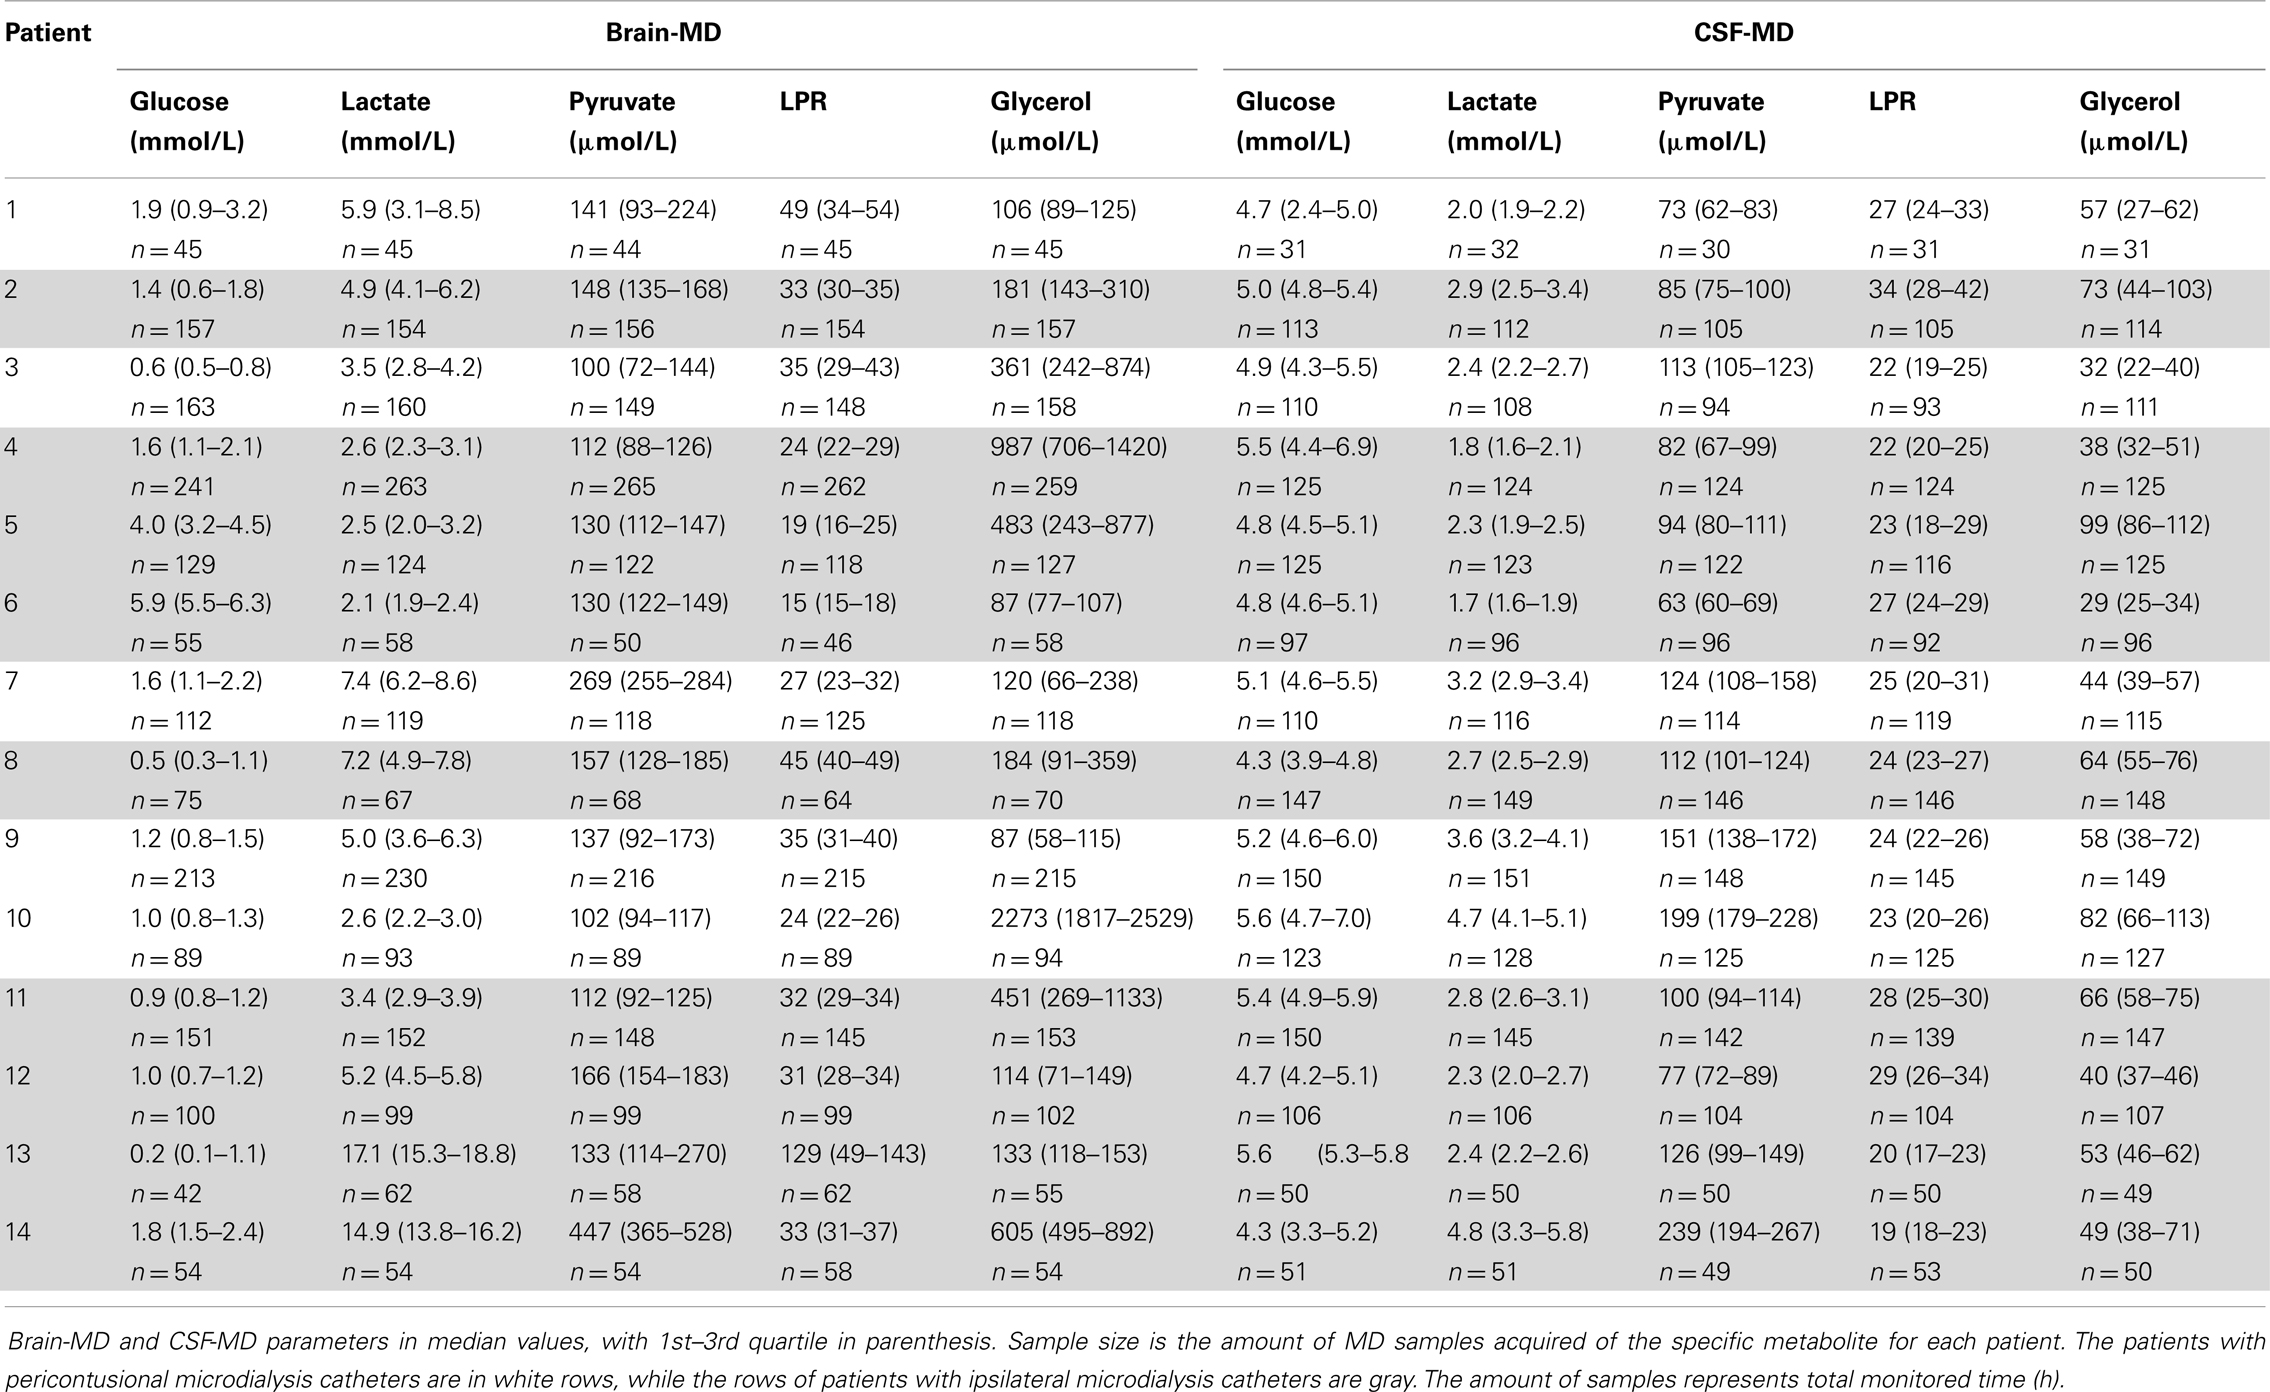
Table 2. Microdialysis parameters.
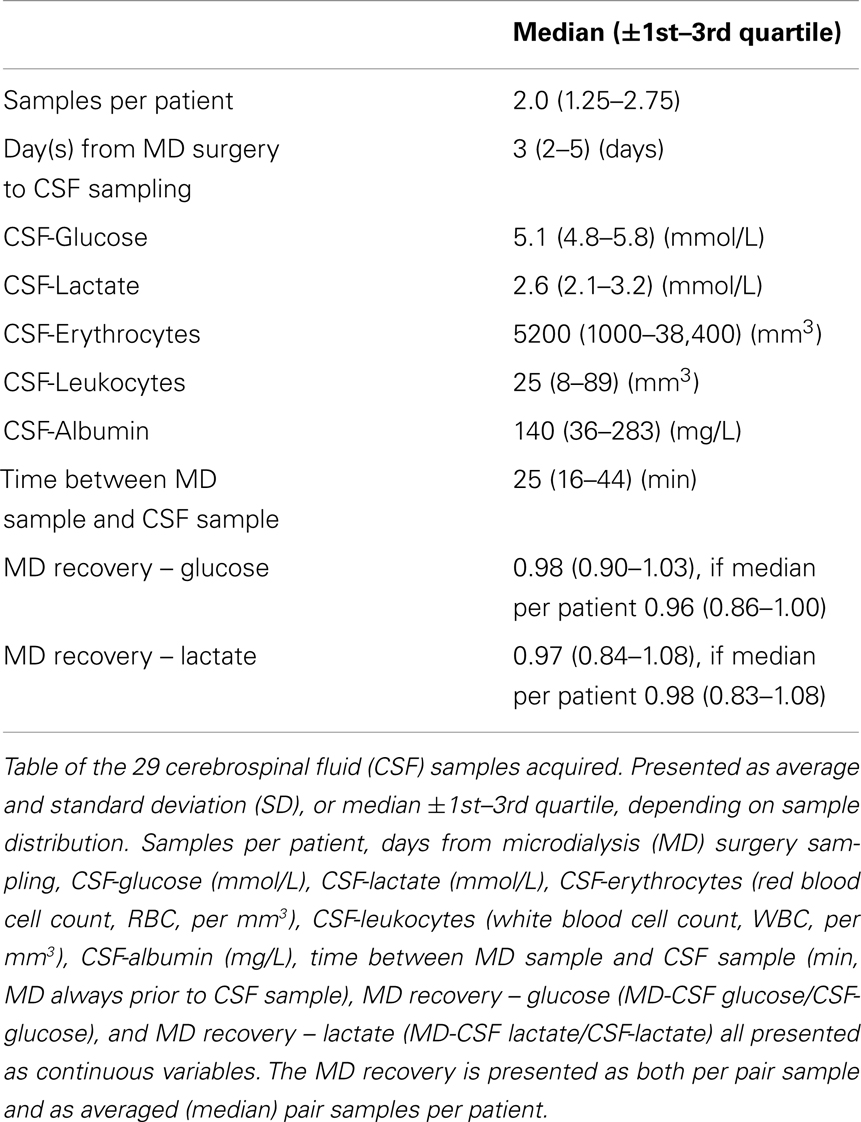
Table 3. CSF samples.
Correlation between CSF and MD-CSF Samples
The concordance of the two methods is illustrated using a Bland–Altman plot (Figures 2A,B), adapted for repeated measures, where the variance for glucose and lactate are 0.51 and 0.13, respectively.
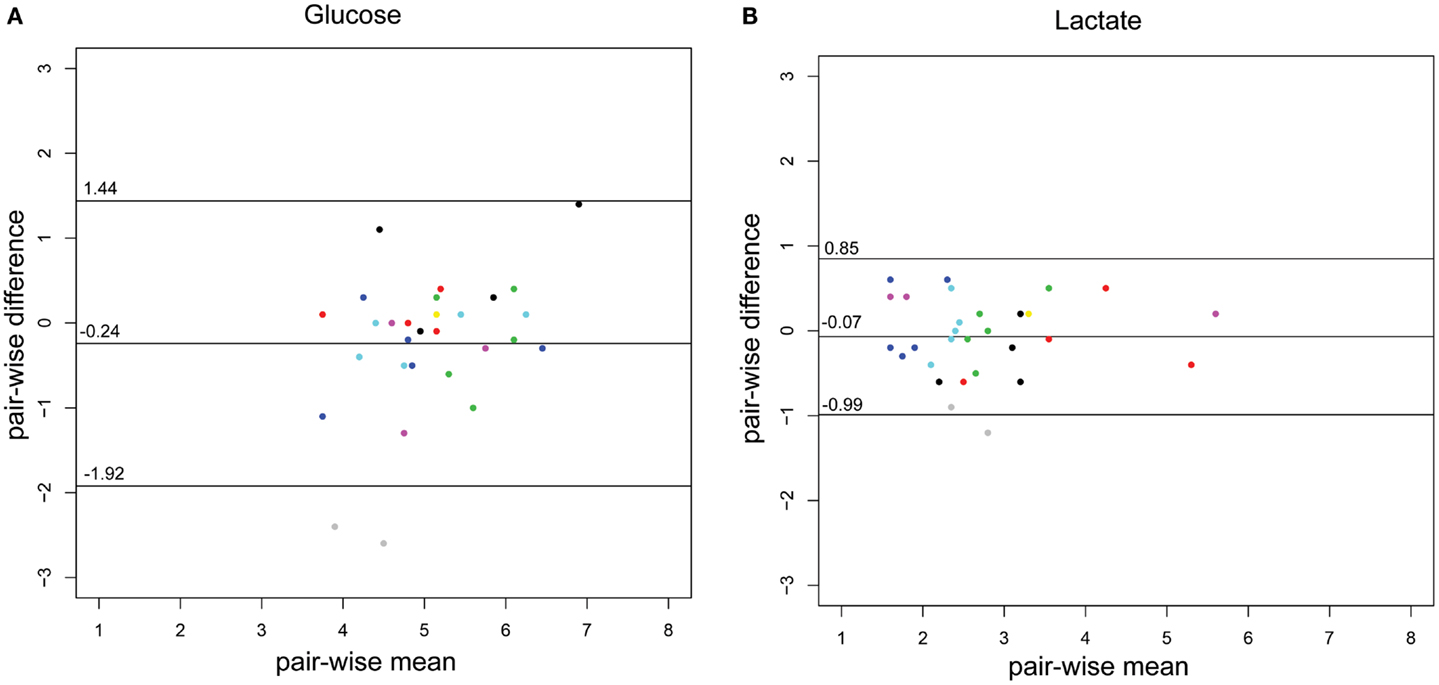
Figure 2. Bland–Altman plots of the CSF-glucose and CSF-lactate samples (n = 29) corresponding with MD-CSF glucose (A) and MD-CSF lactate (B). The points are plotted with the difference between two observations (pair-wise difference) on the y-axis, and the mean of the two observations (mean-wise difference) on the x-axis. The confidence limits and the mean are plotted as black lines. The variance for glucose and lactate are 0.51 and 0.13, respectively. Every patient (n = 14) is represented by a unique color. Two points lay outside the confidence limits in (A) (glucose) while one point is outside the confidence limits in (B) (lactate).
As is illustrated in Table 3, the median MD recovery (the pair-wise CSF-MD sample divided by CSF sample) of glucose and lactate was 0.98 (interquartile range: 0.90–1.03) and 0.97 (0.84–1.08) (if averaged per patient, 0.96 and 0.98), respectively. The difference between MD-CSF samples and CSF samples were not significantly related to by CSF-erythrocytes, CSF-leukocytes, CSF-albumin, or the time from insertion of the catheter to sampling (Table 4). CSF-lactate levels correlated significantly to CSF-erythrocyte levels (p = 0.0035, r2 = 0.255). None of the patients developed positive CSF cultures during their NICU stay.
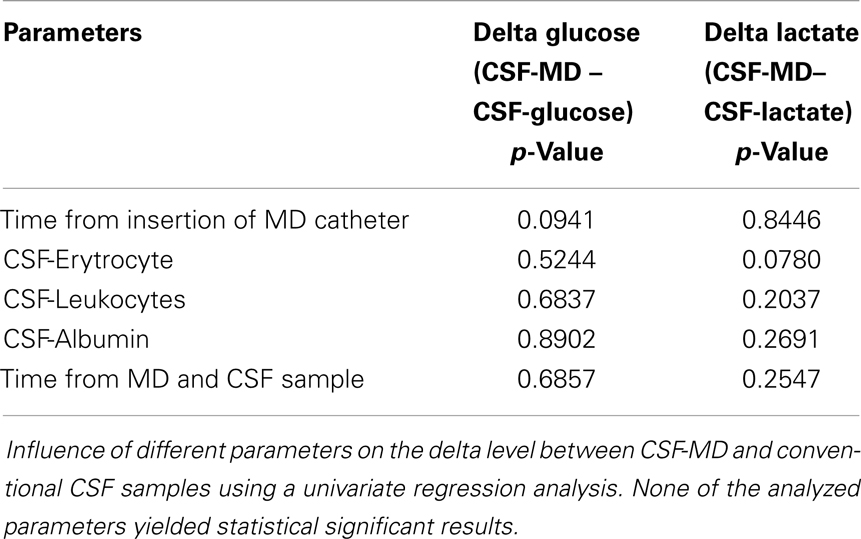
Table 4. Influence of different parameters on the difference (Δ, delta) between glucose and lactate in CSF-MD and CSF, respectively.
Correlation between MD Parameters and Outcome
Both MD-CSF lactate (p = 0.0167) and pyruvate (p = 0.0293) levels were significantly lower in the favorable outcome (GOSe 6–8) group compared to the unfavorable group (GOSe 1–5) (Figures 3A,B). The regional MD-Brain did not show any significant difference in outcome (Table 5).
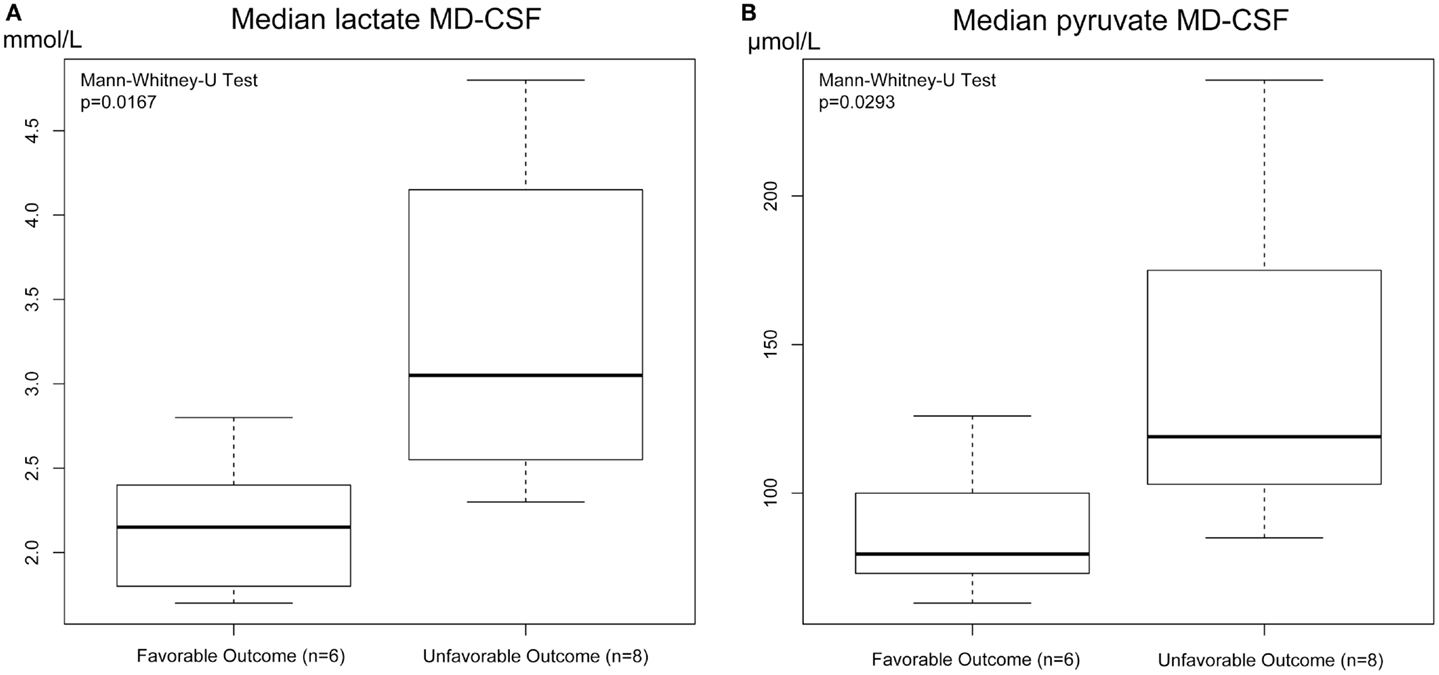
Figure 3. Box plot of median MD-CSF lactate (A) and MD-CSF pyruvate (B) levels presented in relation to outcome (GOSe 1–5 vs 6–8). MD-CSF lactate levels and MD-CSF pyruvate levels are significantly higher in patients with unfavorable outcome (p = 0.0167 and p = 0.0293, respectively, Mann–Whitney U Test.
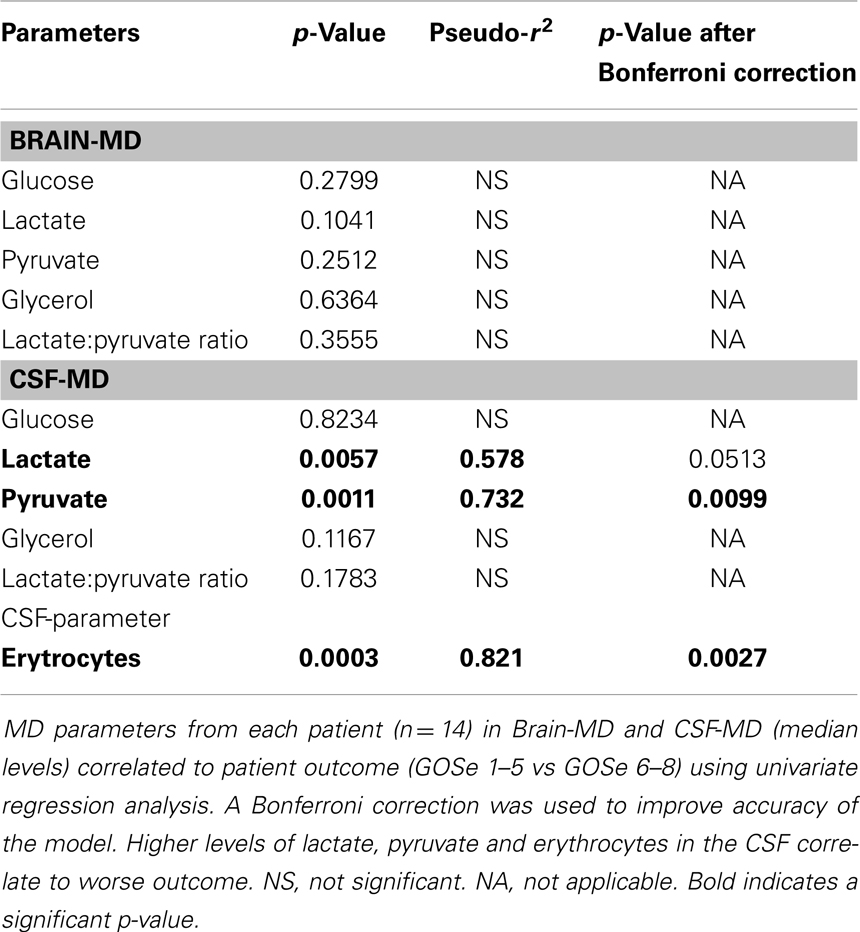
Table 5. Parameters and univariate correlation to patient outcome.
MD-CSF and MD-Brain Monitoring of Patients
The levels of MD-CSF and MD-Brain in the first 150 h after insertion are displayed in Figures 4A–E. Glucose is higher in the MD-CSF compared to MD-Brain, while the opposite applies for lactate, pyruvate, LPR, and glycerol that are generally higher in MD-Brain compared to MD-CSF. Figures 5A,B illustrates, what is also seen in Figures 3A,B, that patients with favorable outcome have lower levels of lactate and pyruvate in MD-CSF compared to patients with unfavorable outcome (Figures 5A,B).
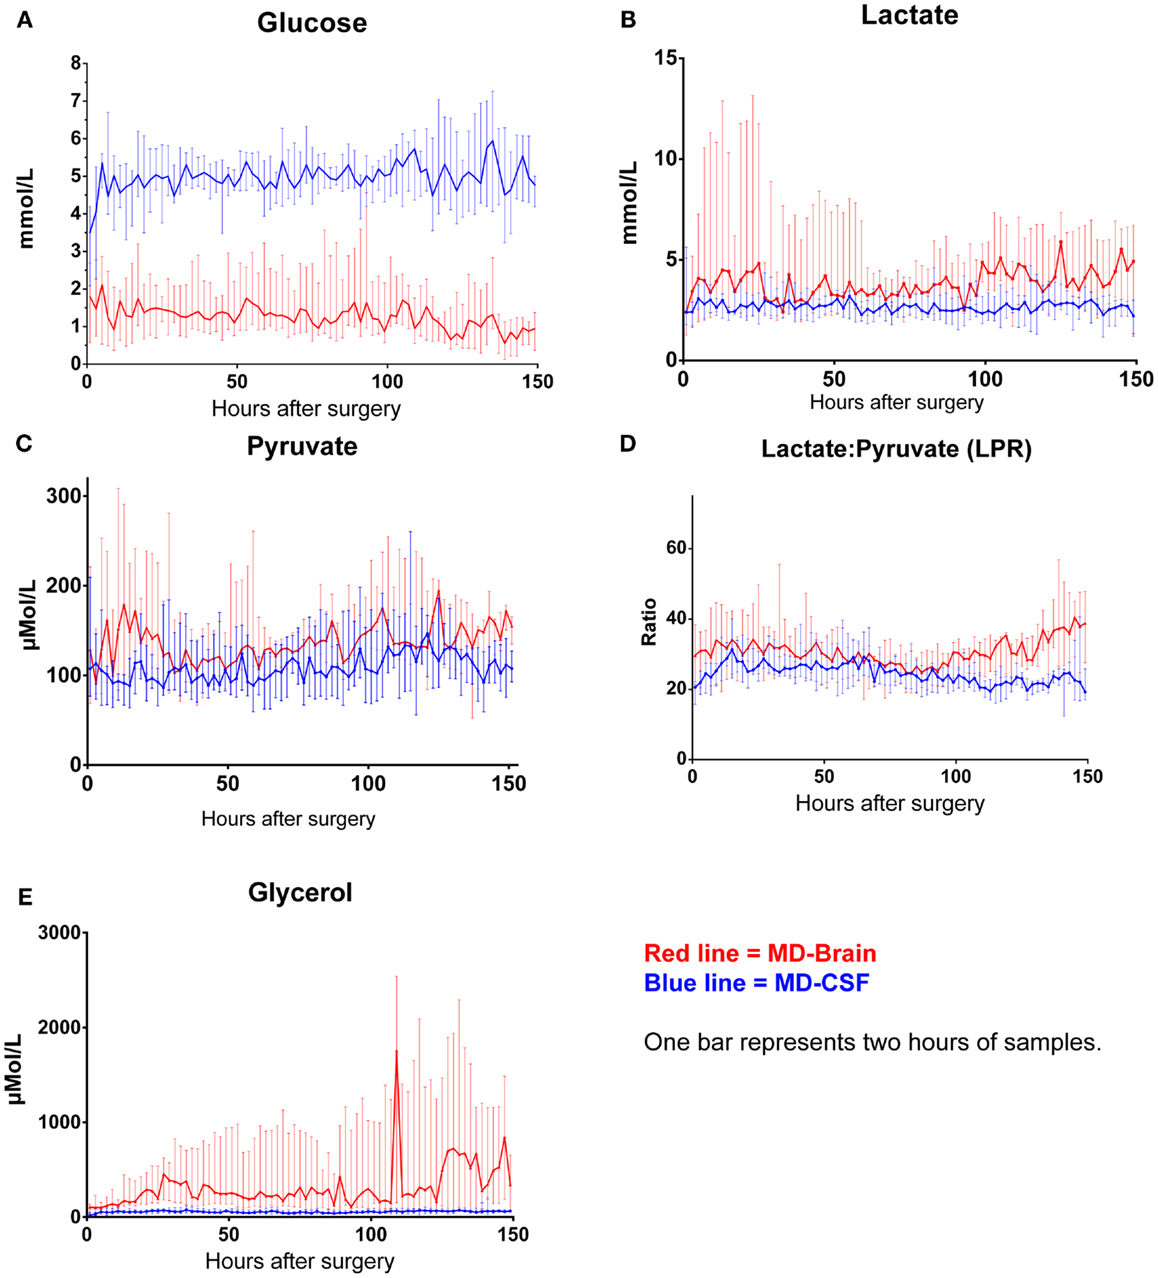
Figure 4. Median (± 1st–3rd quartile) CSF-MD and Brain-MD glucose (A), lactate (B), pyruvate (C), LPR (D), and glycerol (E) levels for all patients (n = 14).
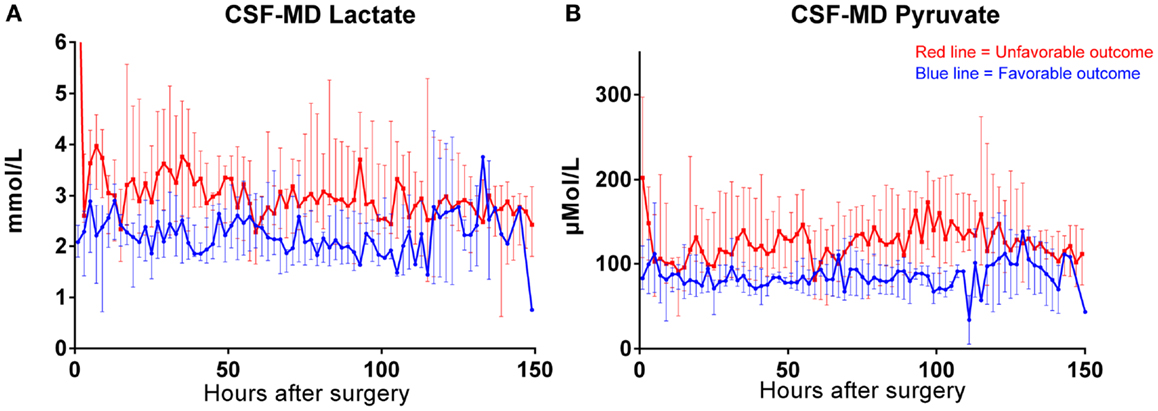
Figure 5. Median (± 1st–3rd quartile) CSF-MD lactate (A) and pyruvate (B) levels in patients with favorable (n = 6) (GOSe 6–8) and unfavorable (GOSe 1–5) outcome (n = 8). One bar represents two samples.
Discussion
The comparison of “global,” CSF microdialysis, conventional CSF samples, and intracerebral microdialysis has, to the best of our knowledge, never been studied before in a clinical setting. This study of 14 patients indicates that the samples acquired using the current “global” CSF-MD method is highly correlated to conventionally drawn CSF samples concerning glucose and lactate and that the median MD recovery of the 20 kD CMA64 MD catheter with a 0.3 μL/min dialysis flow rate in CSF is near 100%, higher than previously described for 20 kD MD catheters in ECF (40). In addition, MD-CSF pyruvate and lactate levels were, despite this small cohort, significantly correlated to outcome.
CSF Parameters and MD-CSF Parameters
The difference between CSF and MD-CSF parameters is illustrated by the Bland–Altman plots (Figures 2A,B). Lactate levels are deemed to be within an acceptable range for clinical use, with only one sample outside the confidence limits. The variance for glucose was higher (0.51) than for lactate (0.13). For glucose, several samples were inside the confidence bounds, yet 32% of the samples were outside 1 SD (±0.84 mmol/L), which could represent a problem if the method was to be clinically implemented. As can be seen for glucose and lactate, one patient (gray dots) significantly lowered the confidence bounds. Also, for glucose, another patient (black) had higher pair-wise difference. These patients could represent that the catheter is in some way malfunctioning and subsequently affect the sampling and the Bland–Altman plot.
Leukocyte, albumin, and erythrocyte concentrations in CSF, as well as the time from MD catheter insertion and sampling, are parameters that could affect the function and recovery of the MD catheter. However, no significant relation was found between these parameters and the differences between MD-CSF and conventional CSF levels of glucose and lactate (Table 4).
Glucose levels exhibited a higher variance than lactate, perhaps because of a higher fluctuation of the metabolite in CSF. Further studies would be needed to elucidate if this is a recurrent observation.
MD Recovery
The amount of substance extracted from a known concentration using MD technique has previously been described as a “recovery” or a “relative recovery” (40, 44).
The median MD recoveries of glucose and lactate were 0.98 and 0.97, respectively. Previous data have shown (n = 3) that the mean “relative recovery,” using a CMA70 MD-Brain catheter in brain parenchyma, perfused with 0.3 μL/min ringer solution, in an extrapolation-to-zero-flow model, was 0.65 for glucose and 0.67 for lactate (40). In our model, the correct concentration in CSF was known, hence no extrapolation was necessary. However, it could be difficult to compare these MD recoveries due to the different models used, different MD catheters (CMA64 vs CMA70) used and conditions between CSF and ECF.
The catheters both have the same diameter, membrane size, and other membrane specific properties, and differ only in the material that was used to make the plastic shaft (polyamid for the CMA70 and polyamid ether sulfone for the CMA64) (personal communication, μ-Dialysis AB, Stockholm, Sweden), making the choice of catheter an unlikely reason for the discrepancy.
Jacobson et al. suggested that the concentration of the metabolites just outside the MD catheter is lower in ECF due to local depletion (45), which may not be applicable in CSF, as the CSF has a higher circulation and is continuously being renewed. Dahlin et al. were able to increase the MD recovery by using human CSF as perfusion fluid in an in vitro model (46). The MD recovery for the CMA64 catheter in peripheral blood is about 80% for glucose (39), lower than what is seen in our study.
In our system, metabolites from a flow of CSF were measured using a CMA64 MD catheter, which might be the cause of the higher observed MD recovery if compared to the studies by Hutchinson et al. (65–67%) (40) and Rooyackers et al. (80%) (39). This finding was in coherence with the manufacturer, who routinely checks the calibration of MD catheters and measures levels of metabolites in known concentrations, in vitro. They have found that the MD recovery is close to 100% if the catheter is placed in a water-like fluid (personal communication, μ-Dialysis AB, Stockholm, Sweden). Their findings were similar to our own; in order to improve the recovery for the MD catheter, it is probable that the analyzed media, in themselves, are more important than the perfusion velocity and MD catheter membrane characteristics.
In conclusion, the MD recovery of glucose and lactate were higher than previously described, perhaps explained by the different conditions between ECF and CSF or dissimilarity with previously described methods.
Glucose
The levels of glucose in MD-CSF remained higher than MD-Brain throughout the first 150 h of monitoring (Figure 4A). There was no significant correlation to outcome for neither MD-CSF glucose nor MD-Brain glucose. The levels of MD-Brain glucose were similar to other studies analyzing glucose in ECF (47), while ECF levels from uninjured patients have been shown to be 0.6–2.6 mmol/L (48).
Glucose is transported directly from the blood to the ECF through the blood–brain barrier using transporter proteins (primarily GLUT1), and ECF levels are considered more stable than plasma levels due to the transporter proteins ability to adapt to hyper/hypoglycemic conditions (49). The level of glucose in the ECF is lower than the CSF due to the increased metabolism in the brain parenchyma. While the levels of glucose between ECF and serum have been studied in both healthy patients (50) and TBI patients (51), and shown to be around 40% of the serum level (52), little is studied about the movement of glucose between the ECF and CSF. Hochwald et al. postulated that glucose enters the CSF from the blood using facilitated transport (53) and that the transport follows saturable kinetics as the extraction rate from serum is independent of the CSF-glucose concentration (54). Second, the flow of glucose between CSF and ECF has been shown to occur via oubain-sensitive (and oubain-insensitive) fluxes and diffusion, with imminent changes between the two compartments (55).
The flow of labeled glucose between CSF and ECF could be easily analyzed using the current setup, making it suitable for further research utilizing the MD technique.
Lactate and Pyruvate
The levels of lactate were generally lower in MD-CSF compared to the brain ECF (MD-brain) (Table 2; Figure 4B). Normal CSF levels of lactate and pyruvate have been shown to be around 1.01–2.09 mmol/L and 30–150 μmol/L, respectively, not being significantly affected by gender (56), while ECF levels in uninjured patients are 2.0–2.9 mmol/L and 120–166 μmol/L (lactate and pyruvate, respectively) (48).
Isolated lactate increase in CSF after TBI has been shown in several studies (57, 58), where it has been correlated to patient outcome and a subsequent increase of ICP (58). Guerra-Romero et al. intrathecally injected rabbits (n = 3) with sodium lactate. The animals were monitored with MD in the ECF, and showed (59) a subsequent increase of CSF-lactate, while no significant changes could be detected in the brain ECF, hence probably indicating a regulated metabolic control of lactate between the two compartments. Increased metabolism leads to higher levels of lactate in the brain parenchyma, which may subsequently be measured in the MD-Brain catheter. The range of lactate levels detected were higher in MD-Brain compared to MD-CSF, and as seen in the study by Guerra-Romero, an increase of lactate in one of the cerebral compartments may not lead to an increase in the other.
Increased MD-CSF lactate and pyruvate levels were correlated to an unfavorable outcome (Table 5; Figures 5A,B). No other MD parameters were significantly correlated to outcome. Also, a post hoc analysis revealed that the significance for MD-CSF lactate and pyruvate remained when different dichotomizations of GOSe were used (15, 36). However, the LPR, commonly used as a marker for ischemia when monitoring with brain-MD, and previously shown to correlate to unfavorable outcome (11, 60), was not elevated. Increased lactate and pyruvate levels in the CSF, following TBI (61, 62) and subarachnoid hemorrhage (63), without any effect on the LPR, have been seen in previous studies (61, 63). This has been suggested to be an effect of red blood cell glycolysis in the CSF and brain parenchyma (63). This is supported by a study from 1969 where blood was injected into the CSF of cats (n = 6), with a subsequent increase of both lactate and pyruvate levels. The authors suggested that an increased glycolysis of the CSF/blood cell mixture was the reason to this metabolic pattern (64). Using MD-Brain, a similar pattern has been shown where lactate and pyruvate levels increase following secondary brain hypoxia in human TBI patients (65). In this study, several patients with increased ischemia (PbtO2 below 10 mmHg) had an increase of pyruvate levels, concurrent with increased lactate levels, leaving the LPR unchanged. The authors postulate that this increase of pyruvate represents glycolysis exceeding the ability of the ischemic-affected brain tissue to adequately metabolize pyruvate (65).
In the present study, the erythrocyte concentration in CSF correlated significantly to the lactate levels in CSF, and to patient outcome (Table 5), which we believe to be the most probable cause of this metabolic pattern of increased lactate and pyruvate levels in CSF. The severity of subarachnoid, and intraventricular hemorrhage after TBI has been extensively correlated to patient outcome (66), which could explain why these patients had a worse outcome.
Other possible mechanisms for the increased lactate and pyruvate could be hypermetabolism, a common problem following TBI (67). Regional seizure activity in the brain might be another reason (68), even though clinical representation of epileptic seizure were treated at our NICU with antiepileptic medication and intermittently monitored with EEG, some non-convulsive seizure activity could be missed.
As is seen in Table 1, the MD-Brain catheters were inserted in pericontusional tissue in 36% of the cases (n = 5), while the other (n = 9) where placed further from the affected brain parenchyma. These catheters would be expected to show higher levels of glycerol and LPR, as well as lower glucose, but no difference was found (Table 2). A recent study proposes that a more global approach to MD monitoring is beneficial (15), with catheters placed in healthy tissue in order to determine the presence of cerebral metabolic crisis (increased lactate and LPR levels, and decreased glucose levels).
In aggregate, the metabolic pattern of increased lactate and pyruvate levels in CSF found in our study is believed to be the result of high levels of erythrocytes in the CSF, yet other metabolic causes in the affected brain cannot be excluded.
Glycerol
Levels of MD-Brain glycerol were higher than MD-CSF (Table 2; Figure 4E). Normal ECF levels of glycerol have been reported to be around 20–80 μmol/L (48) and 8.6–25 μmol/L in CSF (69). The glycerol levels in our study were higher in both ECF and CSF. ECF and CSF levels of glycerol in the intact brain are both related to serum levels of glycerol (70). Increased levels probably correlate to ongoing cell death, due to its abundance in cell membranes (7). It has been postulated by Nau et al. that prolonged persistence of glycerol in the CSF may reflect similar conditions in the ECF (69).
Perhaps due to the relatively short half-life of glycerol in CSF (1.03–3.68 h) and the high flow rate of the CSF, there is a concentration difference between ECF and CSF (69), with an ongoing release in the injured brain, hence increased levels of glycerol in the ECF compared to the CSF.
The Current Setup for Monitoring Patients with Meningitis
The current MD-CSF technique enhances the temporal resolution when monitoring CSF parameters in NICU patients, sampling lactate, and glucose levels every hour. An ICP-guided therapy for patients suffering from acute BM has been shown to improve outcome, compared to traditional therapy (71), and the current monitoring setup, where levels of CSF metabolites may be readily accessible, would definitely assist in this type of neuro-intensive care treatment.
Limitations
The limited sample size provides several obvious limitations to this study. However, the method has analyzed a total of n = 7448 MD-CSF samples and n = 8358 MD-Brain samples generating accurate data for the median levels for the n = 14 patients that could be included. To avoid intra-patient data (dependent and independent data) to affect the analysis, the Bland–Altman plots were adjusted for repeated measures causing wider confidence intervals (Figures 2A,B). The analyses in Table 4 would in theory require a mixed models approach due to repeated measures, this is not possible as several patients only have one data point and all data have been treated as independent data points.
Only 5 of the 14 Brain-MD catheters ended up in the pericontusional locale, an area that has been suggested to better represent tissue at risk after TBI (8). This heterogeneity could explain why Brain-MD samples did not correlate to outcome as well as CSF-MD samples did, even if MD monitoring of “uninjured” brain tissue also has been shown to be a good marker for global metabolic crisis and to be correlated to outcome (15).
The timing of samples when comparing MD-CSF and conventional CSF lagged up to about one hour, since the conventional CSF sampling was not performed at any regular time during the day. However, Table 4 reveals that there was no significant difference between the MD-CSF and conventional CSF levels of glucose and lactate, in regard of the timing when they were acquired.
In fact, all the pumps used in this study cause a sampling delay from the actual monitored metabolic event that could be significant. This is, however, also a limitation using the MD technique, but it is amplified when also using pumped CSF, as it is hard to determine exactly when the potential harmful biochemical event occurred when MD-CSF samples are to be temporally compared to MD-Brain samples.
Conclusion
This new technique of global MD-CSF monitoring correlates with conventional CSF levels of glucose and lactate. The MD recovery, using the current MD set up in CSF, is close to 100% for both lactate and glucose. Increase in lactate and pyruvate, without any effect on the LPR, significantly correlates to unfavorable outcome, though perhaps indicating an effect of the presence of erythrocytes in the CSF, or possibly a hypermetabolic state in the injured brain. Additional studies, including increased sample sizes, are necessary to further validate the method and the current findings.
Conflict of Interest Statement
The authors declare that the research was conducted in the absence of any commercial or financial relationships that could be construed as a potential conflict of interest.
References
1. Gustavsson A, Svensson M, Jacobi F, Allgulander C, Alonso J, Beghi E, et al. Cost of disorders of the brain in Europe 2010. Eur Neuropsychopharmacol (2011) 21:718–79. doi: 10.1016/j.euroneuro.2011.08.008
2. Chesnut RM, Marshall LF, Klauber MR, Blunt BA, Baldwin N, Eisenberg HM, et al. The role of secondary brain injury in determining outcome from severe head injury. J Trauma (1993) 34:216–22. doi:10.1097/00005373-199302000-00006
3. Robertson CS, Valadka AB, Hannay HJ, Contant CF, Gopinath SP, Cormio M, et al. Prevention of secondary ischemic insults after severe head injury. Crit Care Med (1999) 27:2086–95.
4. Johnston AJ, Gupta AK. Advanced monitoring in the neurology intensive care unit: microdialysis. Curr Opin Crit Care (2002) 8:121–7.
5. Persson L, Hillered L. Chemical monitoring of neurosurgical intensive care patients using intracerebral microdialysis. J Neurosurg (1992) 76:72–80. doi:10.3171/jns.1992.76.1.0072
6. Nielsen TH, Bindslev TT, Pedersen SM, Toft P, Olsen NV, Nordstrom CH. Cerebral energy metabolism during induced mitochondrial dysfunction. Acta Anaesthesiol Scand (2013) 57:229–35. doi:10.1111/j.1399-6576.2012.02783.x
7. Hillered L, Valtysson J, Enblad P, Persson L. Interstitial glycerol as a marker for membrane phospholipid degradation in the acutely injured human brain. J Neurol Neurosurg Psychiatry (1998) 64:486–91. doi:10.1136/jnnp.64.4.486
8. Bellander BM, Cantais E, Enblad P, Hutchinson P, Nordstrom CH, Robertson C, et al. Consensus meeting on microdialysis in neurointensive care. Intensive Care Med (2004) 30:2166–9. doi:10.1007/s00134-004-2461-8
9. Hillered L, Vespa PM, Hovda DA. Translational neurochemical research in acute human brain injury: the current status and potential future for cerebral microdialysis. J Neurotrauma (2005) 22:3–41. doi:10.1089/neu.2005.22.3
10. Engstrom M, Polito A, Reinstrup P, Romner B, Ryding E, Ungerstedt U, et al. Intracerebral microdialysis in severe brain trauma: the importance of catheter location. J Neurosurg (2005) 102:460–9. doi:10.3171/jns.2005.102.3.0460
11. Timofeev I, Carpenter KL, Nortje J, Al-Rawi PG, O’Connell MT, Czosnyka M, et al. Cerebral extracellular chemistry and outcome following traumatic brain injury: a microdialysis study of 223 patients. Brain (2011) 134:484–94. doi:10.1093/brain/awq353
12. Chen JW, Rogers SL, Gombart ZJ, Adler DE, Cecil S. Implementation of cerebral microdialysis at a community-based hospital: a 5-year retrospective analysis. Surg Neurol Int (2012) 3:57. doi:10.4103/2152-7806.96868
13. Nelson DW, Thornquist B, MacCallum RM, Nystrom H, Holst A, Rudehill A, et al. Analyses of cerebral microdialysis in patients with traumatic brain injury: relations to intracranial pressure, cerebral perfusion pressure and catheter placement. BMC Med (2011) 9:21. doi:10.1186/1741-7015-9-21
14. Vespa P, Bergsneider M, Hattori N, Wu HM, Huang SC, Martin NA, et al. Metabolic crisis without brain ischemia is common after traumatic brain injury: a combined microdialysis and positron emission tomography study. J Cereb Blood Flow Metab (2005) 25:763–74. doi:10.1038/sj.jcbfm.9600073
15. Stein NR, McArthur DL, Etchepare M, Vespa PM. Early cerebral metabolic crisis after TBI influences outcome despite adequate hemodynamic resuscitation. Neurocrit Care (2012) 17:49–57. doi:10.1007/s12028-012-9708-y
16. Fox E, Bungay PM, Bacher J, McCully CL, Dedrick RL, Balis FM. Zidovudine concentration in brain extracellular fluid measured by microdialysis: steady-state and transient results in rhesus monkey. J Pharmacol Exp Ther (2002) 301:1003–11. doi:10.1124/jpet.301.3.1003
17. Benjamin RK, Hochberg FH, Fox E, Bungay PM, Elmquist WF, Stewart CF, et al. Review of microdialysis in brain tumors, from concept to application: first annual Carolyn Frye-Halloran symposium. Neuro Oncol (2004) 6:65–74. doi:10.1215/S1152851703000103
18. Veening JG, Barendregt HP. The regulation of brain states by neuroactive substances distributed via the cerebrospinal fluid; a review. Cerebrospinal Fluid Res (2010) 7:1. doi:10.1186/1743-8454-7-1
19. Narotam PK, van Dellen JR, du Trevou MD, Gouws E. Operative sepsis in neurosurgery: a method of classifying surgical cases. Neurosurgery (1994) 34:409–15; discussion 415–6. doi:10.1227/00006123-199403000-00004
20. Posner JB, Plum F. Independence of blood and cerebrospinal fluid lactate. Arch Neurol (1967) 16:492–6. doi:10.1001/archneur.1967.00470230044005
21. Leib SL, Boscacci R, Gratzl O, Zimmerli W. Predictive value of cerebrospinal fluid (CSF) lactate level versus CSF/blood glucose ratio for the diagnosis of bacterial meningitis following neurosurgery. Clin Infect Dis (1999) 29:69–74. doi:10.1086/520184
22. Eymann R, Schmitt M, Antes S, Shamdeen MG, Kiefer M. Dynamics of cerebrospinal fluid flow in slit ventricle syndrome. Acta Neurochir Suppl (2012) 113:181–6. doi:10.1007/978-3-7091-0923-6_36
23. Linsler S, Schmidtke M, Steudel WI, Kiefer M, Oertel J. Automated intracranial pressure-controlled cerebrospinal fluid external drainage with LiquoGuard®. Acta Neurochir (2013) 155:1589–95. doi:10.1007/s00701-012-1562-3
24. Teasdale G, Jennett B. Assessment of coma and impaired consciousness. A practical scale. Lancet (1974) 2:81–4. doi:10.1016/S0140-6736(74)91639-0
25. Baker SP, O’Neill B, Haddon W Jr, Long WB. The injury severity score: a method for describing patients with multiple injuries and evaluating emergency care. J Trauma (1974) 14:187–96. doi:10.1097/00005373-197403000-00001
26. Copes WS, Champion HR, Sacco WJ, Lawnick MM, Keast SL, Bain LW. The injury severity score revisited. J Trauma (1988) 28:69–77. doi:10.1097/00005373-198801000-00010
27. Romner B, Ingebrigtsen T, Kongstad P, Borgesen SE. Traumatic brain damage: serum S-100 protein measurements related to neuroradiological findings. J Neurotrauma (2000) 17:641–7. doi:10.1089/089771500415391
28. Skogseid IM, Nordby HK, Urdal P, Paus E, Lilleaas F. Increased serum creatine kinase BB and neuron specific enolase following head injury indicates brain damage. Acta Neurochir (Wien) (1992) 115:106–11. doi:10.1007/BF01406367
29. Thelin EP, Johannesson L, Nelson D, Bellander BM. S100B is an important outcome predictor in traumatic brain injury. J Neurotrauma (2013) 30:519–28. doi:10.1089/neu.2012.2553
30. Stern P, Bartos V, Uhrova J, Bezdickova D, Vanickova Z, Tichy V, et al. Performance characteristics of seven neuron-specific enolase assays. Tumour Biol (2007) 28:84–92. doi:10.1159/000098441
31. Marshall LF, Marshall SB, Klauber MR, Clark MV, Eisenberg HM, Jane JA, et al. A new classification of head-injury based on computerized-tomography. J Neurosurg (1991) 75:S14–20.
32. Maas AI, Hukkelhoven CW, Marshall LF, Steyerberg EW. Prediction of outcome in traumatic brain injury with computed tomographic characteristics: a comparison between the computed tomographic classification and combinations of computed tomographic predictors. Neurosurgery (2005) 57:1173–82; discussion 1173–82. doi:10.1227/01.NEU.0000186013.63046.6B
33. Nelson DW, Nystrom H, MacCallum RM, Thornquist B, Lilja A, Bellander BM, et al. Extended analysis of early computed tomography scans of traumatic brain injured patients and relations to outcome. J Neurotrauma (2010) 27:51–64. doi:10.1089/neu.2009.0986
34. Nelson DW, Bellander BM, Maccallum RM, Axelsson J, Alm M, Wallin M, et al. Cerebral microdialysis of patients with severe traumatic brain injury exhibits highly individualistic patterns as visualized by cluster analysis with self-organizing maps. Crit Care Med (2004) 32:2428–36. doi:10.1097/01.CCM.0000147688.08813.9C
35. Wilson JT, Pettigrew LE, Teasdale GM. Structured interviews for the Glasgow Outcome Scale and the extended Glasgow Outcome Scale: guidelines for their use. J Neurotrauma (1998) 15:573–85. doi:10.1089/neu.1998.15.573
36. Lew HL, Dikmen S, Slimp J, Temkin N, Lee EH, Newell D, et al. Use of somatosensory-evoked potentials and cognitive event-related potentials in predicting outcomes of patients with severe traumatic brain injury. Am J Phys Med Rehabil (2003) 82:53–61; quiz 62–4, 80. doi:10.1097/00002060-200301000-00009
37. Rooyackers O, Blixt C, Mattsson P, Wernerman J. Continuous glucose monitoring by intravenous microdialysis: influence of membrane length and dialysis flow rate. Acta Anaesthesiol Scand (2013) 57:214–9. doi:10.1111/j.1399-6576.2012.02787.x
38. Hage C, Mellbin L, Ryden L, Wernerman J. Glucose monitoring by means of an intravenous microdialysis catheter technique. Diabetes Technol Ther (2010) 12:291–5. doi:10.1089/dia.2009.0150
39. Rooyackers O, Blixt C, Mattsson P, Wernerman J. Continuous glucose monitoring by intravenous microdialysis. Acta Anaesthesiol Scand (2010) 54:841–7. doi:10.1111/j.1399-6576.2010.02264.x
40. Hutchinson PJ, O’Connell MT, Al-Rawi PG, Maskell LB, Kett-White R, Gupta AK, et al. Clinical cerebral microdialysis: a methodological study. J Neurosurg (2000) 93:37–43. doi:10.3171/jns.2000.93.1.0037
41. Bland JM, Altman DG. Multiple significance tests: the Bonferroni method. BMJ (1995) 310:170. doi:10.1136/bmj.310.6973.170
42. Bland JM, Altman DG. Statistical methods for assessing agreement between two methods of clinical measurement. Lancet (1986) 1:307–10. doi:10.1016/S0140-6736(86)90837-8
43. Myles PS, Cui J. Using the Bland-Altman method to measure agreement with repeated measures. Br J Anaesth (2007) 99:309–11. doi:10.1093/bja/aem214
44. Benveniste H, Hansen AJ, Ottosen NS. Determination of brain interstitial concentrations by microdialysis. J Neurochem (1989) 52:1741–50. doi:10.1111/j.1471-4159.1989.tb07252.x
45. Jacobson I, Sandberg M, Hamberger A. Mass transfer in brain dialysis devices – a new method for the estimation of extracellular amino acids concentration. J Neurosci Methods (1985) 15:263–8. doi:10.1016/0165-0270(85)90107-4
46. Dahlin AP, Wetterhall M, Caldwell KD, Larsson A, Bergquist J, Hillered L, et al. Methodological aspects on microdialysis protein sampling and quantification in biological fluids: an in vitro study on human ventricular CSF. Anal Chem (2010) 82:4376–85. doi:10.1021/ac1007706
47. Kerner A, Schlenk F, Sakowitz O, Haux D, Sarrafzadeh A. Impact of hyperglycemia on neurological deficits and extracellular glucose levels in aneurysmal subarachnoid hemorrhage patients. Neurol Res (2007) 29:647–53. doi:10.1179/016164107X248983
48. Reinstrup P, Stahl N, Mellergard P, Uski T, Ungerstedt U, Nordstrom CH. Intracerebral microdialysis in clinical practice: baseline values for chemical markers during wakefulness, anesthesia, and neurosurgery. Neurosurgery (2000) 47:701–9; discussion 709–10. doi:10.1227/00006123-200009000-00035
49. Simpson IA, Appel NM, Hokari M, Oki J, Holman GD, Maher F, et al. Blood-brain barrier glucose transporter: effects of hypo- and hyperglycemia revisited. J Neurochem (1999) 72:238–47. doi:10.1046/j.1471-4159.1999.0720238.x
50. Abi-Saab WM, Maggs DG, Jones T, Jacob R, Srihari V, Thompson J, et al. Striking differences in glucose and lactate levels between brain extracellular fluid and plasma in conscious human subjects: effects of hyperglycemia and hypoglycemia. J Cereb Blood Flow Metab (2002) 22:271–9. doi:10.1097/00004647-200203000-00004
51. Rostami E, Bellander BM. Monitoring of glucose in brain, adipose tissue, and peripheral blood in patients with traumatic brain injury: a microdialysis study. J Diabetes Sci Technol (2011) 5:596–604. doi:10.1177/193229681100500314
53. Hochwald GM, Gandhi M, Goldman S. Net transport of glucose from blood to cerebrospinal fluid in the cat. Neuroscience (1983) 10:1035–40. doi:10.1016/0306-4522(83)90241-5
54. Hochwald GM, Magee J, Ferguson V. Cerebrospinal fluid glucose: turnover and metabolism. J Neurochem (1985) 44:1832–7. doi:10.1111/j.1471-4159.1985.tb07176.x
55. Brondsted HE. Ouabain-sensitive carrier-mediated transport of glucose from the cerebral ventricles to surrounding tissues in the cat. J Physiol (1970) 208:187–201.
56. Zhang WM, Natowicz MR. Cerebrospinal fluid lactate and pyruvate concentrations and their ratio. Clin Biochem (2013) 46:694–7. doi:10.1016/j.clinbiochem.2012.11.008
57. Crockard HA, Taylor AR. Serial CSF lactate-pyruvate values as a guide to prognosis in head injury coma. Eur Neurol (1972) 8:151–7. doi:10.1159/000114569
58. DeSalles AA, Kontos HA, Becker DP, Yang MS, Ward JD, Moulton R, et al. Prognostic significance of ventricular CSF lactic acidosis in severe head injury. J Neurosurg (1986) 65:615–24. doi:10.3171/jns.1986.65.5.0615
59. Guerra-Romero L, Tauber MG, Fournier MA, Tureen JH. Lactate and glucose concentrations in brain interstitial fluid, cerebrospinal fluid, and serum during experimental pneumococcal meningitis. J Infect Dis (1992) 166:546–50. doi:10.1093/infdis/166.3.546
60. Sanchez JJ, Bidot CJ, O’Phelan K, Gajavelli S, Yokobori S, Olvey S, et al. Neuromonitoring with microdialysis in severe traumatic brain injury patients. Acta Neurochir Suppl (2013) 118:223–7. doi:10.1007/978-3-7091-1434-6_42
61. Toczylowska B, Chalimoniuk M, Wodowska M, Mayzner-Zawadzk E. Changes in concentration of cerebrospinal fluid components in patients with traumatic brain injury. Brain Res (2006) 1104:183–9. doi:10.1016/j.brainres.2006.05.057
62. Seifman MA, Adamides AA, Nguyen PN, Vallance SA, Cooper DJ, Kossmann T, et al. Endogenous melatonin increases in cerebrospinal fluid of patients after severe traumatic brain injury and correlates with oxidative stress and metabolic disarray. J Cereb Blood Flow Metab (2008) 28:684–96. doi:10.1038/sj.jcbfm.9600603
63. Mori K, Nakajima K, Maeda M. Long-term monitoring of CSF lactate levels and lactate/pyruvate ratios following subarachnoid haemorrhage. Acta Neurochir (Wien) (1993) 125:20–6. doi:10.1007/BF01401823
64. Granholm L. The effect of blood in the CSF on the CSF lactate, pyruvate and bicarbonate concentrations. Scand J Clin Lab Invest (1969) 23:361–6. doi:10.3109/00365516909081702
65. Hlatky R, Valadka AB, Goodman JC, Contant CF, Robertson CS. Patterns of energy substrates during ischemia measured in the brain by microdialysis. J Neurotrauma (2004) 21:894–906. doi:10.1089/0897715041526195
66. Armin SS, Colohan AR, Zhang JH. Traumatic subarachnoid hemorrhage: our current understanding and its evolution over the past half century. Neurol Res (2006) 28:445–52. doi:10.1179/016164106X115053
67. Foley N, Marshall S, Pikul J, Salter K, Teasell R. Hypermetabolism following moderate to severe traumatic acute brain injury: a systematic review. J Neurotrauma (2008) 25:1415–31. doi:10.1089/neu.2008.0628
68. Sasaki M, Ichiya Y, Kuwabara Y, Yoshida T, Inoue T, Morioka T, et al. Hyperperfusion and hypermetabolism in brain radiation necrosis with epileptic activity. J Nucl Med (1996) 37:1174–6.
69. Nau R, Prins FJ, Kolenda H, Prange HW. Temporary reversal of serum to cerebrospinal fluid glycerol concentration gradient after intravenous infusion of glycerol. Eur J Clin Pharmacol (1992) 42:181–5. doi:10.1007/BF00278481
70. Waterhouse JM, Coxon RV. The entry of glycerol into brain tissue. J Neurol Sci (1970) 10:305–11. doi:10.1016/0022-510X(70)90157-7
Keywords: TBI, microdialysis, cerebrospinal fluid, lactate, pyruvate, outcome
Citation: Thelin EP, Nelson DW, Ghatan PH and Bellander B-M (2014) Microdialysis monitoring of CSF parameters in severe traumatic brain injury patients: a novel approach. Front. Neurol. 5:159. doi: 10.3389/fneur.2014.00159
Received: 30 June 2014; Accepted: 06 August 2014;
Published online: 02 September 2014.
Edited by:
Firas H. Kobeissy, University of Florida, USAReviewed by:
Inga D. Neumann, University of Regensburg, GermanyAjeesh Koshy Cherian, University of Michigan, USA
Copyright: © 2014 Thelin, Nelson, Ghatan and Bellander. This is an open-access article distributed under the terms of the Creative Commons Attribution License (CC BY). The use, distribution or reproduction in other forums is permitted, provided the original author(s) or licensor are credited and that the original publication in this journal is cited, in accordance with accepted academic practice. No use, distribution or reproduction is permitted which does not comply with these terms.
*Correspondence: Eric P. Thelin, Section for Neurosurgery, Department of Clinical Neuroscience, Karolinska Institutet, Building R2:02, Karolinska University Hospital Solna, S-17176, Stockholm, Sweden e-mail: eric.thelin@ki.se