Commentary: Systemic, Local, and Imaging Biomarkers of Brain Injury: More Needed, and Better Use of Those Already Established?
 Keri L. H. Carpenter1,2*
 Marek Czosnyka1
 Ibrahim Jalloh1
 Virginia F. J. Newcombe2,3
 Adel Helmy1
 Richard J. Shannon1
 Karol P. Budohoski1Angelos G. Kolias1Peter J. Kirkpatrick1Thomas Adrian Carpenter2
 David K. Menon2,3Peter J. Hutchinson1,2
- 1Division of Neurosurgery, Department of Clinical Neurosciences, University of Cambridge, Cambridge, UK
- 2Wolfson Brain Imaging Centre, Department of Clinical Neurosciences, University of Cambridge, Cambridge, UK
- 3Division of Anaesthesia, Department of Medicine, University of Cambridge, Cambridge, UK
Much progress has been made over the past two decades in the treatment of severe acute brain injury, including traumatic brain injury and subarachnoid hemorrhage, resulting in a higher proportion of patients surviving with better outcomes. This has arisen from a combination of factors. These include improvements in procedures at the scene (pre-hospital) and in the hospital emergency department, advances in neuromonitoring in the intensive care unit, both continuously at the bedside and intermittently in scans, evolution and refinement of protocol-driven therapy for better management of patients, and advances in surgical procedures and rehabilitation. Nevertheless, many patients still experience varying degrees of long-term disabilities post-injury with consequent demands on carers and resources, and there is room for improvement. Biomarkers are a key aspect of neuromonitoring. A broad definition of a biomarker is any observable feature that can be used to inform on the state of the patient, e.g., a molecular species, a feature on a scan, or a monitoring characteristic, e.g., cerebrovascular pressure reactivity index. Biomarkers are usually quantitative measures, which can be utilized in diagnosis and monitoring of response to treatment. They are thus crucial to the development of therapies and may be utilized as surrogate endpoints in Phase II clinical trials. To date, there is no specific drug treatment for acute brain injury, and many seemingly promising agents emerging from pre-clinical animal models have failed in clinical trials. Large Phase III studies of clinical outcomes are costly, consuming time and resources. It is therefore important that adequate Phase II clinical studies with informative surrogate endpoints are performed employing appropriate biomarkers. In this article, we review some of the available systemic, local, and imaging biomarkers and technologies relevant in acute brain injury patients, and highlight gaps in the current state of knowledge.
Introduction
The ictus–the catastrophic event of severe acute brain injury–is followed over the ensuing hours and days by a secondary cascade of pathological processes that can exacerbate neuronal injury and worsen outcome. These secondary changes are potential targets for therapy. Although progress has been made, many patients still experience varying degrees of long-term disabilities post-injury with consequent demands on carers and resources, and there is room for improvement (1).
Significant advances in treatment over the past two decades for traumatic brain injury (TBI) and subarachnoid hemorrhage (SAH) has led to more patients surviving with better outcomes, due to a combination of factors. These include evolution of evidence-based guidelines for TBI management (2), growing recognition of the benefits of managing severe TBI patients in neuroscience centers and procedures for safe transfer of patients to such centers, better triage and assessment of patients on admission, including computed tomography (CT) scans, better neuromonitoring in the neurocritical care unit, both continuously at the bedside [e.g., intracranial pressure (ICP) and brain tissue oxygen monitoring] and intermittently in scans [e.g., CT and magnetic resonance imaging (MRI)], evolution and refinement of protocol-driven therapy for better management of patients, and improvements in surgical procedures and rehabilitation (1). Even so, TBI remains the leading cause of mortality and disability in young people in high-income countries (3). Moreover, TBI is rising in developing countries largely due to wider use of motor vehicles, while a shift toward older age of patients with TBI due to falls is occurring, especially in high-income countries (3, 4). While SAH can sometimes result from trauma (head injury), it can also occur non-traumatically, usually as a result of rupture of intracranial aneurysms in about 80–85% of non-traumatic SAH (5, 6). Aneurysmal SAH carries a high risk of complications, a high degree of dependency in survivors, and most SAH patients are under 60 years of age (5, 6).
Biomarkers are a key aspect of neuromonitoring. A broad definition of a biomarker is any observable feature that can be used to inform on the state of the patient, e.g., a molecular species, a feature on a scan, or a monitoring characteristic, e.g., cerebrovascular pressure reactivity index (PRx). Examples are tabulated (Table 1). Biomarkers are usually quantitative measures, which can be utilized in diagnosis, prognosis, monitoring evolution of injury and recovery, and response to treatments (7). They are thus crucial to the development of therapies in many pathological states and may be utilized as surrogate endpoints in Phase II clinical trials. To date, there is no specific drug treatment for acute brain injury, and many seemingly promising agents emerging from pre-clinical animal models have failed in clinical trials (7). Part of the discrepancy may be due to the much greater heterogeneity of clinical TBI compared with the highly standardized conditions of experimental models (7). To have enough statistical power, Phase III randomized controlled trials of clinical outcomes require large numbers of patients and are costly, consuming much time and resources. Moreover, they may divert crucial numbers of patients away from other clinical trials. Before deciding to embark on Phase III ventures, it is important that adequate Phase II clinical studies with informative surrogate endpoints are performed employing appropriate biomarkers. In this article, we review some of the available systemic, local, and imaging biomarkers and technologies relevant in acute brain injury patients, and highlight gaps in the current state of knowledge.
TABLE 1
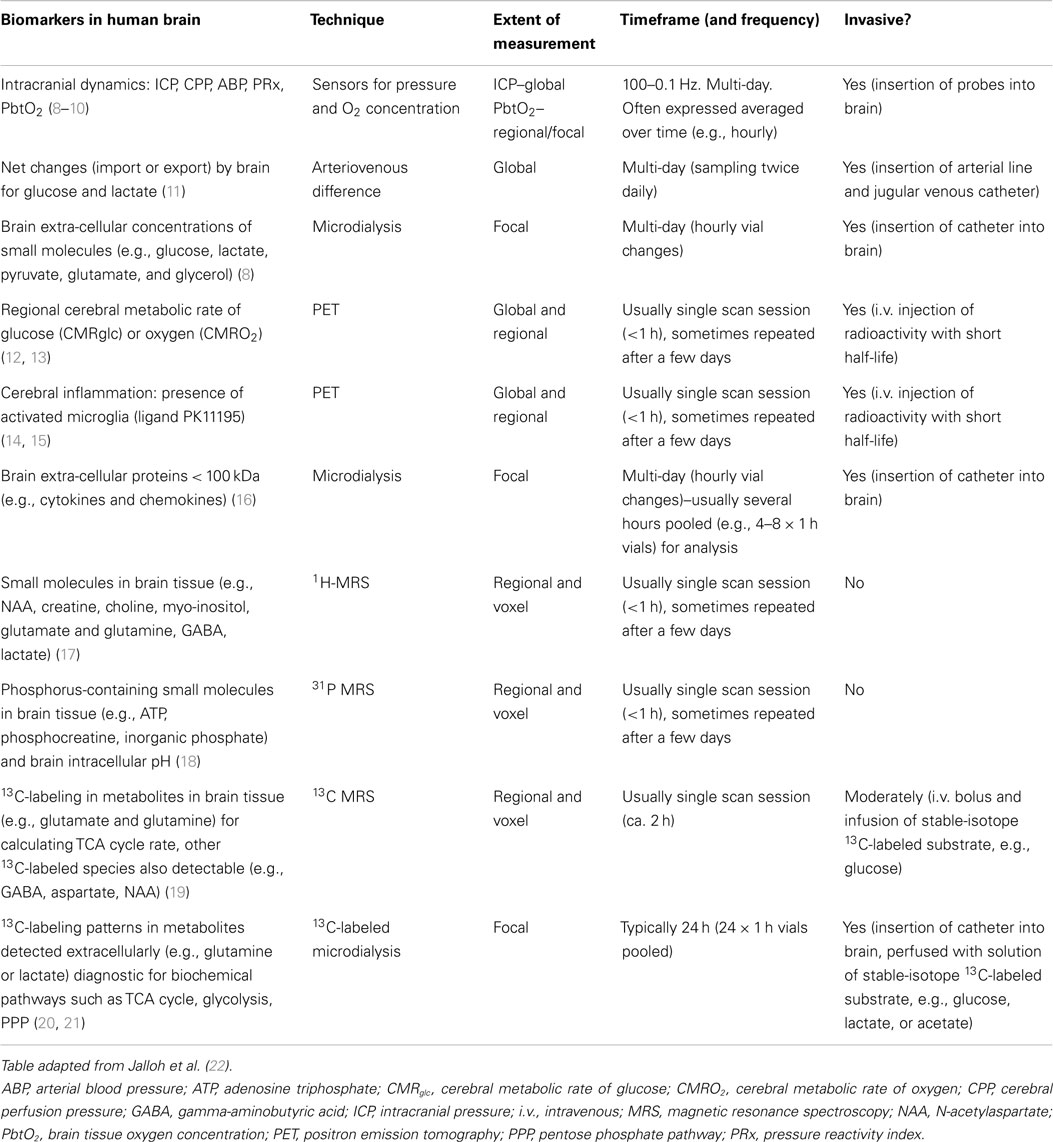
Table 1. Examples of biomarker methodology in human brain.
Biomarkers of Intracranial Dynamics
Raised ICP or inadequate cerebral perfusion pressure [CPP, which is calculated as mean arterial blood pressure (ABP) minus ICP] is one of the most frequent cases of secondary ischemic brain insults after TBI. Example traces are shown in Figure 1. Absolute thresholds for intracranial hypertension and hypoperfusion are known, and they are based on statistical evaluation of large samples of patients, but most probably they are individual- and time-dependent. “Optimal CPP strategy” (23) indicated a possible solution for individualization of CPP management target, using continuous assessment of cerebrovascular reactivity (24, 25). This can be translated to the concept of “optimal mean arterial pressure” in clinical scenarios where raised ICP is not a meaningful factor, e.g., cardiopulmonary bypass surgery (26) and in care of premature newborns (27).
FIGURE 1
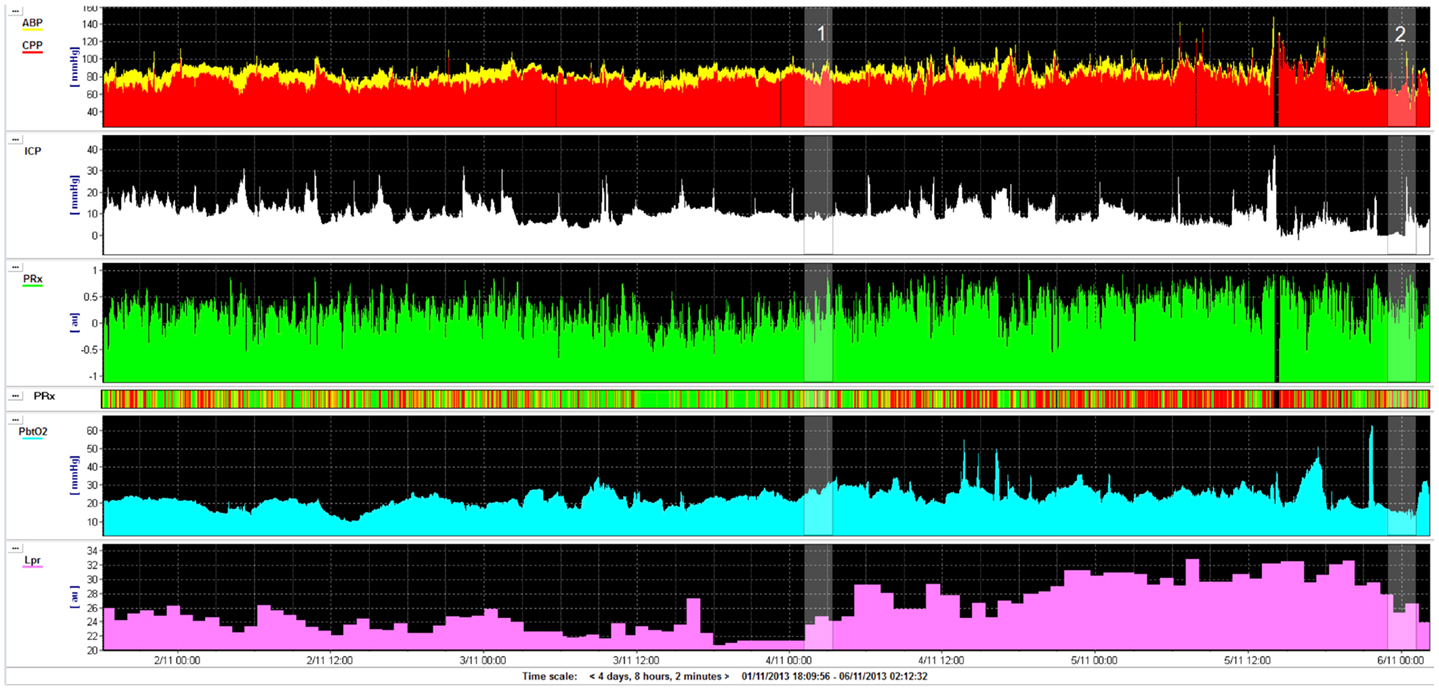
Figure 1. Example of monitoring (for 4 days) in a road traffic accident victim (aged 22 years): intracranial pressure (ICP), cerebral perfusion pressure (CPP), pressure reactivity index (PRx), brain tissue oxygenation (PbtO2), and lactate/pyruvate ratio (LPR). Initial GCS was 13 and deteriorated quickly to 7. Patient had never daily averaged ICP above 20 mmHg, CPP was above 70 mmHg all the time. On day 2 after injury, pressure reactivity (PRx) deteriorated (marker 1, this can be also read by “risk plot,” where PRx is color coded: green–good reactivity, red–deteriorated reactivity) and lactate/pyruvate ratio exceeded 25 and 30 later. On day 4, the patient improved (good CT scan), lactate/pyruvate ratio decreased, and PRx improved (marker 2). The patient was weaned uneventfully from the ventilator and successfully extubated shortly afterward. This example shows that lactate/pyruvate ratio and PRx may be markers of deterioration, adding clinical information independently of ICP and CPP.
In TBI, monitoring and manipulation of ICP and CPP comprise a cornerstone of intensive care. Often, the same principles of management are extrapolated to other, non-traumatic, acute brain injuries where intracranial compliance and pressure-flow dynamics may be compromised. Despite the lack of level-1 evidence, the Brain Trauma Foundation (BTF) guidelines advocate the implementation of therapies when ICP exceeds the range of 20–25 mmHg and to maintain a CPP in the range of 50–70 mmHg (with a recommended goal of 60 mmHg) (28).
Recognition of the strong association between intracranial hypertension and systemic hypotension with increased morbidity and mortality in patients with TBI has been established, based among others, on landmark studies from the Traumatic Coma Data Bank (29).
The goal of CPP ≥ 70 mmHg or the practice of “indiscriminate” CPP augmentation fell out of favor after a demonstration of lack of clinical outcome benefit coupled with an increased incidence of complications and particularly the acute respiratory distress syndrome (ARDS). Yet another aspect of the CPP debate is the Lund concept or the “ICP and microperfusion-guided management” as proposed by the University of Lund, Sweden (30). Proponents of this strategy focus on ICP control (rather than CPP), maintenance of intravascular volume with the use of colloids, and accept a lower CPP to avoid exacerbating cerebral edema by an increase of water leak through capillaries’ walls into brain.
Intracranial hypertension has been closely linked to adverse outcomes after; nevertheless there remain no large randomized trials that directly compare ICP treatment thresholds. Data from observational studies and non-controlled series have suggested thresholds ranging from 20 to 25 mmHg. The BTF’s latest guideline statement has identified a lack of level-1 evidence and offered, as a level-2, the treatment threshold of 20 mmHg based mainly on the largest available, prospective, observational study (31). In the same document, it is recognized that rather than accepting a generic, absolute ICP threshold, an attempt should be made to individualize thresholds based on patient characteristics, other critical parameters, and on a risk-benefit consideration of treating ICP values (32). Similar to individual target in CPP-oriented therapy, we can define patient-specific, pressure reactivity-guided ICP thresholds by graphing the relationship between ICP and PRx (32). The PRx is a moving correlation coefficient of ICP and mean ABP (mABP), and reflects status of cerebral vascular autoregulation. Positive PRx values imply that increases in mABP are positively associated with increases in ICP, suggesting autoregulatory impairment, whereas negative PRx values indicate preserved vascular reactivity, with vasoconstriction and decrease in ICP in relation to surges in mABP. The PRx has been previously validated against other indices of cerebral autoregulation (25), and is related to outcome (10). PRx may be averaged over time, but also across different CPP levels, giving “optimal CPP” values, and across ICP, giving individual “ICP critical thresholds.”
Another, unexplored concept is to use biochemical markers to establish individual thresholds for rising ICP and falling CPP. Biochemical markers of raised ICP and decreased CPP are primary markers of cerebral ischemia. Most established is the lactate/pyruvate ratio (LPR) measured in brain microdialysates. Timofeev et al. found that LPR, glucose, ICP, and PRx are independent and significant predictors of mortality [along with age and admission Glasgow coma scale score (GCS)] (8). Examples of LPR deterioration that are coincidental with worsening of PRx, but not explained by rising ICP or falling CPP are presented in Figure 1. In a swine model of intracranial hemorrhage (ICH), PRx correlated with LPR and glutamate level (33). Glycerol and LPR associated with pressure reactivity only in perilesional tissue after TBI (9). A spontaneous ICH study (34) has suggested similar association. Both PRx and LPR show time-dependent improvement after severe head injury–on average they both recover after 5 days (35).
Serum and cerebrospinal fluid (CSF) content of IL-8 and, to a lesser extent, tumor necrosis factor (TNF)-α demonstrated the most promise to be candidate serum markers of impending intracranial hypertension and cerebral hypoperfusion after TBI with proteomic mapping (36). In different analysis, S-100β levels in CSF were associated with high ICP and low CPP over a full week of ICP monitoring (37). Other neuroscientists suggested that serum IL-6 can be used for the differential diagnosis of elevated ICP in isolated TBI (38). Initial serum ceruloplasmin/copper levels may have diagnostic value in predicting patients at risk for developing high ICP after TBI (39). Analysis of serum retinol binding protein 4 levels at 24–36 h post-injury indicates it may predict subsequent increases in ICP with a sensitivity of 86% and specificity of 88% at 11.6 μg/mL (40). In this study, the authors have identified 31 candidate biomarkers whose serum abundance was altered after injury.
Intracranial dynamics biomarkers are important for monitoring not only TBI but also SAH (see later Section entitled “Biomarkers of Cerebral Circulation in SAH”).
With further regard to TBI patient management, results were published in 2012 from a randomized trial (BEST TRIP) that enrolled 324 patients with severe TBI in South America, which examined the clinical effectiveness of care using ICP monitoring versus imaging and clinical examination-based monitoring (41). The trial concluded that care focused on maintaining ICP at 20 mmHg or less was not superior to care based on imaging and clinical examination. However, it is important to note that patients in both arms received tiered ICP-lowering therapies, and a decompressive craniectomy was performed in 30% of patients in each arm. Hence, the trial findings do not challenge the belief that brain edema and raised ICP should be actively managed after TBI.
In 2014, a consensus statement on the indications for ICP monitoring has been published (42). This was designed as an interim replacement for the BTF guidelines, as numerous specialists regarded the latter as not being explicit enough. Overall, current clinical practice seems to accept the value of post-operative ICP monitoring in severely head-injured patients.
Extra-Cellular Biomarkers of Brain Chemistry
Microdialysis Biomarkers of Energy Metabolism
The pathophysiology of TBI includes derangements to energy metabolism, which are independent of ischemia and evolve over the scale of hours and days (8, 43). Experimental studies suggest an acute increase in glucose metabolism, which relates to disturbances in ionic and neurochemical gradients (44–46). Clinical TBI studies demonstrate changes to glucose uptake and its subsequent metabolism (47–49). The degree of metabolic perturbation observed after injury is affected by interventions and relates to clinical outcome (8, 13, 50–53). Hence, biomarkers of energy metabolism provide important information on the state of the brain-injured patient.
Microdialysis, which allows the in vivo sampling of molecules in the extra-cellular fluid of the human brain, is well suited to following energy metabolism. Early microdialysis studies in human brain were conducted by Hillered et al. in patients undergoing operations for brain tumors (54). Studies by Persson et al. pioneered microdialysis in TBI and SAH patients, where ICP was measured in parallel with microdialysate levels of lactate, pyruvate (and LPR), hypoxanthine, glutamate, and several other amino acids (55). These analyses were by high performance liquid chromatography (HPLC). Nowadays, clinical microdialysis analyzers (which utilize enzymatic colorimetric assays on a micro-scale) are commercially available for use at the bedside, and the analytes that they measure, related to energy metabolism, include glucose, lactate, pyruvate, glutamate, and glycerol. The brain is reliant on a continuous source of glucose as an energy substrate, which it uses almost exclusively under normal physiological conditions. Inside the cytosol, glucose undergoes glycolysis to pyruvate, which can be exported into the extra-cellular space and measured with microdialysis, undergo conversion to acetyl-CoA and subsequent metabolism via the mitochondrial tricarboxylic acid cycle (TCA cycle), or be converted to lactate by the action of lactate dehydrogenase (LDH). The TCA cycle results in the recycling of nicotine adenine dinucleotide (oxidized form; NAD+) to nicotine adenine dinucleotide (reduced form; NADH). The donation of electrons by NADH is the main driver of mitochondrial electron transport chains and hence, adenosine triphosphate (ATP) generation. Lactate is generated from pyruvate by the action of LDH. Importantly, this reaction also converts NADH to NAD+. Normally, cells maintain a tight balance between NAD+ and NADH, the cellular redox status. Hence, the balance of lactate and pyruvate in the extra-cellular fluid, the LPR, reflects the redox status inside the cell which in turn reflects the balance between non-oxygen consuming glycolytic metabolism and oxidative mitochondrial metabolism. The LPR increases if oxidative mitochondrial metabolism reduces due to either hypoxia and/or mitochondrial damage. Glutamate and glycerol are indirectly related to energy metabolism, as both are biosynthesized from products of glucose metabolism. In the context of brain injury, observed extra-cellular increases in glutamate and glycerol are thought to reflect excitotoxicity and cell membrane breakdown, respectively.
Temporal changes in microdialysate glucose concentration might serve a useful biomarker after brain injury. Microdialysate glucose concentrations reflect the balance between glucose delivery and utilization; a fall in concentration indicates reduced delivery and/or increased utilization. Several studies have found an association between glucose concentrations and outcome with averaged glucose concentrations lower in those patients with poor outcome after SAH or TBI (56–58). In the largest study to date of microdialysis in TBI patients, a multivariate logistic regression model found that total monitoring averaged glucose was actually a positive predictor of mortality such that higher averaged glucose concentrations predicted death (8). Regarding temporal trends in individual patients’ glucose concentrations, Vespa et al. observed three patterns of daily mean glucose in 30 patients with severe TBI (59). Patients with a good outcome were found to have initially normal glucose concentrations (0.5–1 mmol/L) that later declined, as opposed to glucose concentrations that were low or variable from the start of monitoring (59). Other authors have also observed patterns of declining glucose in brain-injured patients with time (8, 35).
The situation for glucose concentrations versus clinical outcome is thus complex and still remains poorly understood. A likely explanation is that there may be an optimal range of brain extra-cellular glucose concentrations, and that levels below and above this range are detrimental. Moreover, circulating glucose levels in blood presumably influences brain extra-cellular glucose concentrations. While optimal glucose ranges have yet to be established with certainty, existing evidence, albeit from a small study, suggests that blood glucose levels within the range of 6–9 mM and brain microdialysate glucose levels of 1–5 mM were associated with minimizing the corresponding brain microdialysate LPR and glutamate concentration, while microdialysate glucose levels <1 and >5 mM were associated with high LPR and high glutamate, respectively (60). Firmer evidence for optimal glucose ranges may emerge from the large datasets that continue to accrue in major centers, as well as from more specialized studies involving labeled glucose and scanning technologies.
Elevated lactate and an elevated LPR have both been associated with worse outcomes after both TBI and SAH (8, 57, 58, 61–63). However, there is again not a straightforward linear relationship between the concentration of lactate, the adequacy of energy metabolism and clinical outcomes. Increasingly recognized is the use of lactate as an energy substrate by the brain particularly after injury (11, 64). Hence, the extra-cellular concentration of lactate reflects both the balance between substrate delivery and utilization, and increased generation due to hypoxia and/or a shift in metabolism away from mitochondria (11, 61). The LPR perhaps better represents the energy status of cells and has been found in several studies to discriminate between outcome groups (8, 56, 63, 65).
Glutamate concentrations that increase over the course of the monitoring period are associated with worse outcomes in TBI patients (66). Glutamate concentrations have also been associated with the development of delayed ischemic neurological deficits (DIND) after SAH (67, 68) and outcome at 12 months after SAH (69). Similarly, some studies have found an association between glycerol and outcome (70, 71).
Individual microdialysis parameters are not 100% specific for derangements in energy metabolism; different combinations of microdialysate markers have been used in an attempt to better predict clinical course and outcomes. In poor-grade SAH patients, a combination of a LPR > 40 and glucose < 0.7 mmol/L was associated with death or severe disability using logistic regression (72). In severe TBI patients, the combination of a LPR > 25 and glucose < 0.8 mmol/L was a strong predictor of poor outcome using a multivariate model (73). Microdialysis parameters have also been combined with other physiological measures, such as brain tissue oxygen, to improve their predictive power (74).
There are some important limitations of using microdialysis to follow energy biomarkers after brain injury. Firstly, microdialysis is an invasive technique and so limited to those patients suffering a severe brain injury but not those with milder forms of injury. Secondly, microdialysis data can show a high degree of both between and within patient variability, which is masked by studies that use averaged data. Nelson et al. found microdialysis markers in 90 TBI patients to be highly auto-correlated such that subject identity alone (and not CPP, ICP, or outcome) explained 52-75% of the variance in microdialysis data (75). Thirdly, microdialysis allows the sampling of small extra-cellular molecules up to 100 kDa in size and so any larger biomarkers of energy metabolism would not be detected.
Complementary to extra-cellular measures of brain chemistry is in vivo magnetic resonance spectroscopy (MRS), which measures brain tissue chemistry (see later section entitled In vivo Biomarkers of Brain Chemistry).
Serum Biomarkers of Energy Metabolism
Tracking cerebral energy metabolism by measuring substances outside of the central nervous system (CNS) is challenging due to the non-specific nature of the substrates and enzymes involved in energy metabolism and due to the BBB limiting substances passing from the brain to the circulation. One substance that has been identified as a marker of brain injury and which relates to cerebral energy metabolism is neuron-specific enolase (NSE). Enolase is one of the enzymes essential for glycolysis, catalyzing the conversion of 2-phosphoglycerate to phosphoenolpyruvate. Several enolase isoforms have been identified including NSE, which is thought to localize specifically to the cytoplasm of neurons and has attracted interest as a potential serum biomarker for brain injury. Several studies have demonstrated the value of serum or CSF NSE levels in predicting pathological changes on head CT, although NSE levels are not as specific or as sensitive as S-100 calcium binding protein B [S-100B, a multifunctional protein produced mainly by astrocytes (76)] or glial fibrillary acidic protein [GFAP, an cytoskeletal intermediate filament protein with multiple functions (77)], evaluated as markers in TBI patients’ serum (78–81).
In terms of brain energy supply, serum glucose concentration has received the most attention. For example, in a database of 327 TBI patients‘ admission blood parameters, hierarchical log linear analysis revealed that age, raised serum glucose (>7.1 mmol/L), low hemoglobin, and GCS, each had a direct independent statistical relationship with clinical outcome (82). Control of serum glucose during on-going neurocritical care is achieved using insulin, and there has been debate about whether tight or looser glycemic control is better. Recent opinion is in favor of the looser control, as exemplified by the findings of a detailed crossover study in 13 TBI patients monitored by 18F-fluorodeoxyglucose (FDG)-positron emission tomography (PET) scans and brain microdialysis (83). In that study, there were more frequent critical reductions in microdialysate glucose and elevations of microdialysate LPR during tight glycemic control. We have already mentioned (above) another small study in which blood glucose levels of 6–9 mM and brain microdialysate glucose levels of 1–5 mM were associated with optimal brain microdialysate chemistry (60). While the underlying mechanisms interlinking serum glucose with brain chemistry and physiology are still not fully understood, a very recent study in 86 TBI patients has indicated an interesting association between increasing serum glucose levels and increasing cerebrovascular PRx (84). The issue of management of blood glucose levels after brain injury, and the twin problems of hypo- and hyper-glycemia have been highlighted in a recent review (85). Besides glucose, recent evidence has also suggested that circulating lactate may be able to play a role as an alternative or supplementary source of fuel for the human brain, see for example TBI patient studies of endogenous lactate (11) and exogenous lactate intravenous administration (64). However, this is a topic of much controversy (86, 87).
Biomarkers of Brain Structural Imaging
Computed tomography is the imaging modality of choice in the acutely unwell injured brain due to its speed and relative ease of imaging critically ill patients, particularly with the advent of mobile machines which allow for imaging within the intensive care unit itself. However, while useful in the detection of cerebral edema, blood, and large lesions, it is clear that CT greatly underestimates the extent and distribution of injury after brain injury and correlates poorly with outcome. Issues including the requirements for MRI compatible equipment, and the logistical issues of transporting critically unwell patients to the MRI suite mean that CT is likely to remain the modality of choice in the acute phase. However, in contrast to many of the biomarkers used in neurointensive care, MRI offers a unique opportunity for in vivo assessment of the entire brain.
Magnetic resonance imaging is increasingly being used in the context of TBI. Examples are shown in Figure 2. Conventional MRI sequences (which include T1- and T2-weighted, fluid-attenuated inversion recovery (FLAIR; good for the detection of edema) and gradient recalled echo (GRE; for the detection of blood products) have been clearly shown to be better than CT for the detection of lesions, particularly traumatic axonal injury (TAI), posterior fossa lesions, and brainstem lesions (88). Yet despite improved lesion detection, many patients, particularly at the mild end of the spectrum, have no abnormalities seen on CT or conventional MRI, but still experience significant neurocognitive sequelae following TBI. Even in the more severely injured patients, the distribution of lesions detected are also often not sufficient to explain the deficits seen. Persistent symptoms may be the result of subtle microstructural alterations, such as TAI, which is often demonstrated at post-mortem neuropathology, which lie below the threshold of detection and are hence not demonstrated by conventional imaging during the patient’s life (89, 90).
FIGURE 2
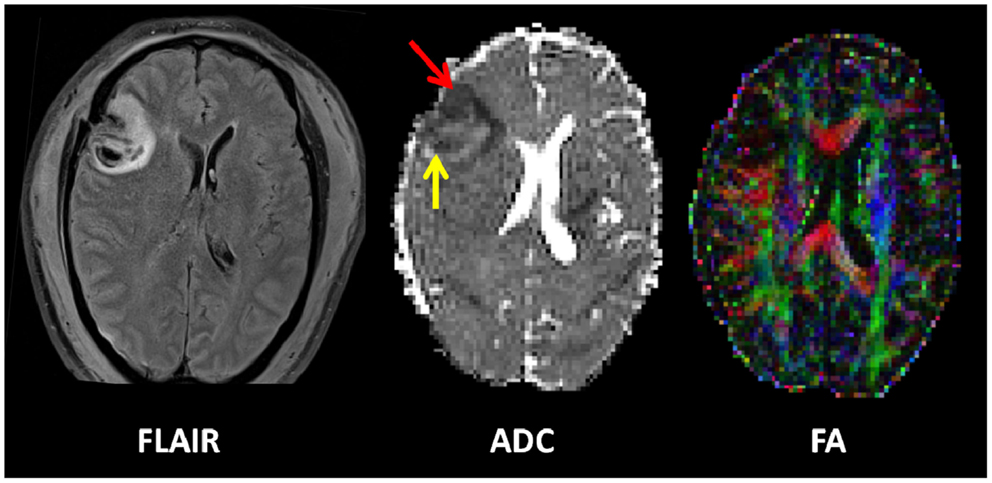
Figure 2. Example of an early contusion in a 49-year-old male who sustained a severe TBI after an alleged assault. He was GCS 4 at the scene. Imaging was performed approximately 48 h after injury. A left frontal contusion can be clearly seen on the FLAIR image. The apparent diffusion coefficient map (ADC) shows a cytotoxic rim (red arrow) and vasogenic rim (yellow arrow). The combined fractional anisotropy and directional map (FA) shows loss of fibers integrity at the site of the contusion. Color hue indicates direction as follows; red, left–right; green, anteroposterior; blue, superior–inferior.
Despite the complexity, in vivo characterization as offered by advanced MRI techniques offers the potential not only for improved detection of the extent and distribution of injury but also may allow for a unique in vivo window into some of the pathophysiological processes that occur after TBI. Diffusion tensor imaging (DTI) offers the most promise to help disentangle the complexities of the anatomical basis of neurotrauma, and has been shown to allow the exquisite delineation of the burden of injury, particularly TAI. The diffusion tensor characterizes the magnitude of water diffusion [apparent diffusion coefficient (ADC)], its directional non-uniformity (anisotropy), and its orientation (eigenvalues). The exact mechanisms of the nature of water diffusion in both gray and white matter are incompletely understood, however the organization of tissue structure including the presence of myelin, microtubules, and organelles, as well as the contribution of intra- and extra-cellular water play a significant role. Susceptibility-weighted imaging (SWI) (see below) is increasingly being used as it is exquisitely sensitive to the presence of blood products and improved the detection of micro-hemorrhages secondary to shearing forces.
It is becoming apparent that the timing of MRI is important after brain injury, particularly when being used as a prognostic biomarker. In moderate-to-severe TBI, the number and volume of lesions detected on FLAIR, gradient echo (GE), and diffusion weighted imaging (DWI) decreased over time in patients imaged at a median of 7 days, 3 months, and 12 months (91). The number of DWI lesions and FLAIR lesion volume in the early MRI were associated with outcome, indicating that early MRI is important for questions of prognosis. A multi-national study [Neuro Imaging for Coma, Emergence Recovery, Consortium (NICER)] investigating DTI parameters in patients who remain in a coma after the first week of intensive care, shows promise for the prediction of poor versus good outcome (92).
There are relatively few studies in humans investigating the hyper-acute (within 72 h) and acute phases of TBI. In patients with moderate-to-severe head injury imaged at a median of 32 h after injury, fractional anisotropy (FA) was decreased in the white matter predominantly as a result of increased radial diffusivity consistent with edema (93). In patients with contusions, three distinct regions are seen within the first 72 h; a core of restricted diffusion, surrounded by an area of raised ADC (likely vasogenic edema) and a thinner rim of reduced ADC (likely cytotoxic edema), which is subsumed by the vasogenic rim after 72 h. This outer cytotoxic rim may represent a “traumatic penumbra” that may be rescued by effective therapy.
Imaging performed in the sub-acute or chronic stages after TBI typically find consistent reductions in FA in classical areas affected by TAI, even when conventional MRI shows no lesion. These regions include the sub-cortical white matter in the frontal and temporal regions, splenium of the corpus callosum, posterior limb of the internal capsule, the cerebral peduncles, and whole brain white matter. A recent meta-analysis concentrating on mild TBI studies by Aoki and colleagues found a decrease in FA and increase in ADC in the corpus callosum (and in particular the splenium) (94). The global nature of abnormality found in what often appears to be structurally normal appearing tissue is underpinned by a study that relates DTI abnormality to the full spectrum of outcome, ranging from the vegetative state to those with minimal or no disability. Here DTI abnormalities in a broad range of regions were noted to scale with clinical outcome (95). A more detailed discussion of the reported DTI literature in TBI is provided in a review by Hulkower and colleagues (96).
A relatively recent MRI development is SWI, which shows promise for imaging the cerebral vasculature, micro-bleeds, iron deposition, and calcification. SWI has been applied clinically in TBI and other brain pathologies (97, 98). While SWI does not replace conventional MRI modalities, it can provide potentially valuable complementary information that moreover may prove useful in clinical interventional trials (97, 98).
It is clear that dynamic changes able to be detected by imaging are not confined to the hyper-acute stage (99, 100). Using advanced MRI techniques to improve our knowledge of longitudinal patterns of change in patient populations is important. Not only will it aid the interpretation of imaging findings in individuals, but may also provide further insight into late pathophysiology, help select appropriate patients for clinical trials, and provide a framework that allows MRI to be used as an imaging biomarker of therapy response.
In comparison to TBI, there has been relatively little research in the use of MRI as a biomarker after SAH. In part this may part be secondary to the technical difficulties of performing MRI in patients with extensive extra-vascular blood products and the need to ensure that any clips and coils are MRI safe. The presence of such clips causes artifacts that may impact image quality (101). A recent study has found cerebral micro-bleeds (on T2* GE) related to the presence of DWI lesions in almost 46% of patients imaged within 7 days of ictus (102). The clinical significance of such lesions is unknown. In poor-grade SAH patients, DWI within 96 h of ictus multifocal areas of ischemia can be seen (103). In patients who do not experience re-rupture, the presence of parenchymal lesions with 24 h was associated with poorer outcome (104). However, the numbers of patients looked at with such techniques are small and much larger studies are required. Diffusion-perfusion mismatch may be seen (105, 106). However, it may be technically difficult in the presence of large amounts of blood products and it has not been compared to other methods including transcranial Doppler (TCD) ultrasonography or Perfusion CT.
Magnetic resonance imaging, including advanced sequences, clearly has much to offer in the detection of injury, the prediction of outcome, and greater understanding of the pathophysiology processes that occur after a brain injury. It is likely that it will be increasingly used in the acute and sub-acute phases of injury to help answer key clinical questions.
In vivo Biomarkers of Brain Chemistry
Magnetic resonance spectroscopy in vivo can be used to explore cellular metabolic status and evidence of cellular injury and so may provide important insights into the complex biochemical and pathophysiological processes after TBI. However, it can be technically difficult to obtain robust spectra and it is only relatively recently that whole brain techniques have become available (107). The majority of studies have studied mild TBI and/or long-term injuries and used a limited number of (or single) voxels, using 1H-MRS. Within 8 h of injury a reduction of N-acetylaspartate (NAA) is apparent (108), and may return to normal levels in patients who make a good recovery (109). In 10 moderate-to-severe TBI patients imaged 48–72 h post-ictus, NAA (a marker of neuronal damage) ratios were found to be decreased and in 5 patients lactate was increased (17) (see Figure 3 for examples). The NAA and lactate levels correlated with GCS at presentation and 3 months Glasgow outcome scale score (GOS) and which suggests early imaging may be important for prediction. Preliminary studies suggest that 1H-MRS may also be informative about outcomes, with studies finding it may discriminate between those who die or remain in a vegetative state compared to those who recover awareness (110–112). However, the best timing of scans, and optimal positioning of spectroscopy voxels (if whole brain methods are not used) is not yet determined. A more detailed consideration of the aspects of brain chemistry that can be addressed by 1H-MRS as well as by 31P and 13C MRS is detailed below.
FIGURE 3
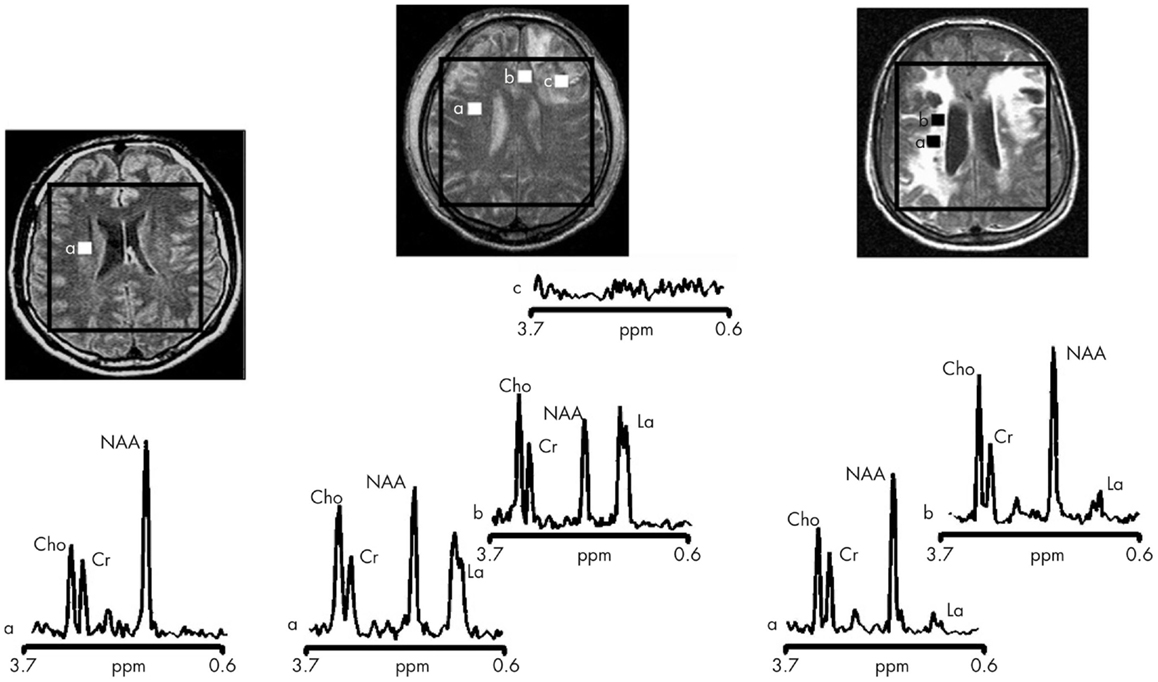
Figure 3. Proton magnetic resonance spectra and conventional magnetic resonance images showing the volume of interest for spectroscopic imaging of a normal control (left panel), Patient 1 (central panel), and Patient 8 (right panel) with traumatic brain injury (TBI) (17). On conventional MRI, Patient 1 shows a focal hematoma in the frontal left hemisphere and Patient 8 shows diffuse MRI abnormalities. Spectra show decreases of N-acetylaspartate (NAA) and increases of choline (Cho) and lactate (La) in patients with TBI (a and b in central and right panels) with respect to the normal control (a in left panel). The spectra of Patient 1 (central panel) show more pronounced metabolic abnormalities than those of Patient 8 (right panel), despite the fact that Patient 8 showed markedly more abnormalities on conventional MRI. In the spectra of Patient 1 (central panel), metabolic abnormalities are clearly evident in the normal appearing brain. Finally, in Patient 1, voxels inside the focal hematoma (c in central panel) were excluded to avoid the artifacts that could be derived by the cerebral hemorrhagic contusion. Cr, creatine [Reproduced from J Neurol Neurosurg Psychiatry, Marino S, et al. 78:501–7 (2007) with permission from BMJ Publishing Group Ltd (17)].
Practical Considerations for Acquisition of in vivo Spectra
Besides providing images of the brain, magnetic resonance enables a chemical signature (spectrum) to be determined for the regions of interest (ROI). The nuclei that can be addressed by MRS at the endogenous level (without administering exogenous label) are 1H and 31P. These spectra can be obtained with either a surface coil or head-coil. 31P MRS can be performed with or without 1H decoupling, and the 1H channel of the coil provides “scout images” for visualizing brain anatomy and setting voxels (3-dimensional grid) for selection of ROIs. MRS is achievable for endogenous 1H and 31P because these nuclei possess high natural abundance (99.985 and 100%, respectively). In contrast, 13C, the magnetic resonance-responsive isotope of carbon, has a natural abundance of only 1.1%, while the most abundant carbon isotope is 12C (98.9%) that is not itself magnetic resonance-responsive. Therefore, 13C MRS requires large amounts of 13C-labeled substrates to be infused intravenously or given orally. Also, 13C MRS is currently limited to surface coils, because of the radio-frequency power absorption by the brain as a consequence of decoupling 1H from the 13C to achieve an interpretable 13C spectrum. The specific absorption rate (SAR) limit to minimize heating of tissue is especially critical with regard to the eyes and so 13C MRS is done using surface coils to address ROIs of the brain avoiding the eyes. Any future design of 13C MRS head-coils would thus necessitate adopting a partial head-coil architecture avoiding the eyes.
Only a few centers worldwide have neurocritical care units adjacent to MRI scanners equipped for MRS and the expertise to support fully ventilated severe TBI patients through the procedure. Another hurdle to MRI/MRS of such patients is that they often have intracranial monitoring probes, e.g., for ICP and PbtO2, and in some cases microdialysis. In many cases, MRI/MRS is possible with these probes kept in situ but with the connecting leads, tubing and pumps disconnected for the duration of the scan. Such probes have to be tested beforehand (without the patient) with the relevant MR coils, to ensure that they do not produce undue heating (113–115). Another difficulty is the physical size, shape, and location of the intracranial probes themselves, which limits the positioning of surface coils and makes use of conventional “birdcage” head-coils difficult. A way round this problem is a birdcage-clamshell design (e.g., Figure 4) that opens up to facilitate use with patients who have intracranial probes.
FIGURE 4
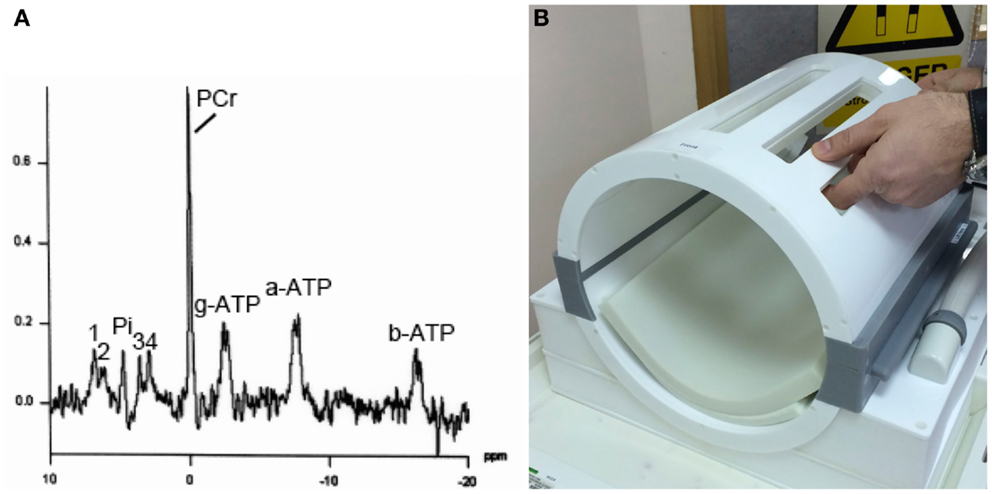
Figure 4. (A) Example of 31P MRS in brain of healthy volunteer (male, 57 years). Signals detected are phosphocreatine (PCR), alpha-, beta-, and gamma-ATP (a-ATP, b-ATP, g-ATP), inorganic phosphate (Pi), phosphatidylethanolamine (1), phosphatidylcholine (2), glycerophosphoethanolamine (3), and glycerophosphocholine (4), in a 3 cm × 3 cm × 3 cm voxel, on a Siemens Verio 3-T MRI scanner using a bespoke PulseTeq birdcage/clamshell 31P head-coil illustrated in (B). The head-coil opens up along the joins (gray), designed to facilitate use with patients. Images are courtesy of the Wolfson Brain Imaging Center.
Consequent to the above constraints, the majority of human brain MRS data thus comes from healthy adult volunteers and those patients who are sufficiently well to be brought easily to the scanner. These include various brain conditions (e.g., neurodegenerative diseases and psychiatric disorders) and a smaller number with mild TBI. Much of the wider MRS literature focuses on tumors in various organs in cancer patients, and muscle in healthy individuals and patients with “metabolic” diseases (e.g., diabetes).
Biomarker Features of the in vivo Spectra
The most commonly used form of in vivo spectroscopy is 1H-MRS (for examples see Figure 3). The most abundant signal in the brain 1H spectrum is usually NAA. The peptide N-acetylaspartylglutamate (NAAG) is a product of NAA and the two are inter-convertible. NAAG is a small peak in the brain 1H-MRS that is difficult to distinguish from NAA. Often both are considered together as “total NAA” that is usually interpreted as a marker for health, viability, and/or number of neurons, particularly their mitochondria. Reduction in NAA is regarded as indicating dysfunction (permanent or temporary) of neuronal tissue. Other 1H signals include creatine [combined signal from creatine and phosphocreatine (PCR)], choline-containing molecules, myo-inositol, glutamate, and glutamine (often considered together as Glx as the two species’ signals are incompletely resolved), gamma-aminobutyric acid (GABA), and lactate.
For a molecular species to be detected on 1H-MRS, it has to be present at millimole per liter concentrations and also be mobile (i.e., free to tumble rapidly–not bound to or closely confined by membranes or macromolecules). Given these caveats, 1H-MRS detects total intra- plus extra-cellular molecules. The intracellular environment dominates the brain volume – it has been estimated that the brain extra-cellular space between cells only comprises about 20% of the total brain volume (116–118). Brain MRS thus appears predominantly to reflect the intracellular compartment and the measures are thus complementary to the extra-cellular measures obtained by microdialysis (see earlier section entitled Extracellular Markers of Brain Chemistry). For example, lactate that is abundant extracellularly (at millimole per liter concentrations) is much less evident on 1H-MRS of normal or TBI brain. Moreover, depending on the choice of echo time (TE), these small lactate signals can virtually disappear or appear inverted. Interpretation of lactate is further complicated by overlap with lipid signals. Thus, some 1H-MRS studies of normal and TBI brain do not consider lactate at all, e.g., Ref. (119). Although lactate is a normal component of energy metabolism, if lactate appears elevated in a tissue on 1H-MRS it is usually a sign of pathology, e.g., in tumors. In TBI, lactate elevation can be seen on 1H-MRS in some but not all instances, illustrated in Ref. (17).
Gamma-amino butyric acid, which has very low (usually <1 μmol/L) extra-cellular concentration, shows up as a 1H-MRS signal reflecting its much higher intracellular concentration, e.g., 1 mMU (120). MRS-detectable GABA likely reflects cytosolic GABA, as the portion of intracellular GABA that is bound in vesicles is thought to be less readily detectable by 1H-MRS, and the same applies to glutamate.
Because of the difficulties in calibrating in vivo spectra, 1H-MRS results are usually expressed as a ratio, e.g., NAA ratio to creatine. In some studies, absolute concentrations of metabolites have been presented by means of comparing the in vivo signals to those of an artificial “phantom” – a large (e.g., 2 L) spherical container of known concentrations of the metabolites of interest in a “physiological” solution, e.g., Ref. (121). Total creatine is generally regarded as a marker of health in all types of brain cells and its levels appear fairly constant in the absence of pathology. However, the creatine signal may increase or decrease in pathological conditions, e.g., ischemic stroke and brain trauma (122, 123). The brain 1H-MRS signal from choline is attributed predominantly to free choline, acetylcholine, and cytidine diphosphate choline, which are all “mobile,” rather than the more abundant choline-containing phospholipids that are not freely mobile as they are present in myelin and cell membranes so contribute less signal (124). The 1H-MRS signal for choline is interpreted as a measure of cell density and/or rate of membrane turnover or breakdown (124). Myo-inositol interpretation in brain 1H-MRS is somewhat debatable, often being regarded as a glial marker but lacking true specificity (124). 1H in vivo MRS in TBI clinically in patients (Figure 3) and in animal models have suggested NAA as the best biomarker, often expressed as a ratio to creatine, or sometimes to choline (17, 125).
31P MRS is less commonly performed than 1H-MRS, and requires a dedicated coil (31P surface coil or 31P head-coil). 31P MRS is typically used to measure ATP in tissues, including human brain (Figure 4). While absolute ATP concentration is difficult to measure in vivo in human brain, the ratio of PCR to γ-ATP is a well-recognized measure of energy status. A high PCR/ATP ratio is usually interpreted as good energy status of the tissue, with “store species” PCR being well-stocked relative to “active” species ATP. However, somewhat lower PCR/ATP ratios are not necessarily harmful per se, but in some cases can be a physiological adaptation, e.g., shown in human heart muscle (126). The ratio of PCR to inorganic phosphate (Pi) is another recognized ratio. Similar to the interpretation of PCR/ATP ratio, a high PCR/Pi ratio is regarded as indicative of good energy status, although the small area under the Pi peak is not easy to measure (integrate) accurately. A more sophisticated 31P MRS method of quantifying tissue energetics is measurement of ATP inter-conversion with ADP by 31P-magnetization transfer techniques, including in vivo saturation transfer (127). This is technically very challenging and, moreover, it has a similar limitation to the simpler PCR/ATP ratio, being unable to ascertain whether the apparently “good” production of ATP is simply due to a lot of glycolysis (“anaerobic” metabolism, probably by glia) that is presumed less favorable than mitochondrial energy metabolism (TCA cycle and oxidative phosphorylation by neurons). Multi-parametric, complementary analytical techniques, in addition to 31P-magnetization transfer, are therefore needed to more fully characterize oxidative function and mitochondrial metabolism in vivo (127). Much debate still exists on this matter.
Another parameter that 31P MRS can measure is tissue intracellular pH, based on the difference in chemical shift (in parts per million) between Pi and PCR (18, 128). Studies of a TBI model, fluid percussion injury in rats, with in vivo MRS of brain pre-injury and at a range of time-points up to 8 h post-injury suggest a transient intracellular pH decrease (31P), lowest at 40 min then recovering, alongside an initial fall in PCR/Pi ratio (31P) at 40 min followed by a temporary rise and subsequent overall decline, and a transient lactate increase (1H) peaking at 40 min then subsiding (129, 130). In TBI patients, brain intracellular pH measured by in vivo31P MRS was reported as slightly higher than in control subjects (131). The relationship between intra- and extra-cellular brain pH is unclear. Extra-cellular brain tissue pH has been measured in TBI patients using the Neurotrend multi-parameter probe (Codman, Raynham, MA). This study suggested lower extra-cellular brain pH in those TBI patients who ultimately did not survive, compared with ultimate survivors (132). Moreover, occurrence of low extra-cellular pH was a significant discriminator of ultimate mortality in TBI patients, despite normal brain tissue oxygen concentration, in a prospective study (133). Although these results look promising, the Neurotrend sensor is no longer manufactured, and there is currently no commercially available clinical intracranial pH probe. The relationship between intra- and extra-cellular brain pH is thus likely to remain uncharted for the foreseeable future. Nevertheless, there is scope for further investigating use of 31P in vivo MRS to evaluate brain intracellular pH in TBI patients.
13C in vivo MRS has been mostly used to evaluate the TCA cycle. The most commonly used substrate is intravenous 1-13C-glucose. Besides the glucose itself, the major labeled signals detected are for glutamate plus smaller signals for glutamine (sometimes considered together as Glx) and minor signals for aspartate. Mathematical modeling of the kinetics of glutamate and glutamine labeling enables the TCA cycle flux to be calculated. Other species detectable in 13C in vivo MRS include GABA, glycerol, myo-inositol, creatine, choline, NAA, lactate, alanine, and bicarbonate. Other 13C-labeled substrates that have been employed include 1,6-13C2 glucose, 2-13C glucose, and 2-13C acetate (134). The latter is regarded as a glial substrate, whereas glucose is a fuel for both neurons and glia.
Besides directly observed 13C MRS, an alternative approach is indirect observation of 13C via the 1H spectrum, termed 1H-observe [13C-edited] spectroscopy, or proton-observe carbon edited (POCE) spectroscopy. The advantages of POCE are that 1H-MRS is inherently more sensitive than 13C MRS and that POCE directly gives 13C fractional enrichment values (134). However, a disadvantage is that the indirect (POCE) modality is more complicated to perform and interpret than directly observed 13C MRS. Part of the difficulty is that the 1H spectrum has a relatively narrow x-axis frequency scale (parts per million), and moreover many of the signals are multiplets due to spin couplings with neighboring protons, so the spectrum contains complex, overlapping signals, making accurate de-convolution a challenge.
Ex vivo NMR Measurements of Brain Extra-Cellular Molecules
High-resolution nuclear magnetic resonance (NMR) spectroscopy can be used ex vivo to characterize extra-cellular molecules from the brain, sampled using microdialysis. Characteristics of microdialysis are that it is selective for hydrophilic molecules < 100 kDa the extra-cellular fluid, and is very focal; it can be done with a brain tissue oxygen sensor in proximity, plus an ICP probe.
Microdialysis is good for measuring lactate, which predominantly shows up extracellularly (see section on Energy Biomarkers above), whereas lactate is often difficult to measure in brain tissue using in vivo MRS (see section on MRS Biomarkers above). Microdialysate lactate (endogenous) is usually quantified using enzymatic colorimetric assays on a bedside analyzer (CMA600 or ISCUS). Besides lactate, microdialysis can sample other endogenous extra-cellular molecules. Also, labeled substrates (e.g., 13C) can be administered directly into the brain extra-cellular space via the microdialysis catheter. Brain cells can take up these substrates, and the metabolites that exit from the cells can be simultaneously collected via the same microdialysis catheter and analyzed by high-resolution NMR in the laboratory (21, 135).
In contrast to the MRS techniques above which are “snapshots” for the duration of the scan, microdialysis is a continuous flow technique. Microdialysates collected are analyzed in suitable sample volumes depending on the assay required, e.g., hourly for endogenous measurements (ISCUS/CMA600), or a 24-h pool for 13C-labeling studies (13C NMR). In principle, shorter sampling/pooling intervals could be achieved by adopting suitable technology, e.g., a microcryoprobe on NMR. Mass spectrometry could also in theory be used for analyzing smaller (shorter) sampling pools but at the expense of at least some information on intra-molecular positions of label within the metabolite molecules. Intra-molecular positions of label are diagnostic for the metabolic pathways and so NMR is the “gold standard” for deducing metabolic pathways in 13C-labeling studies.
Inflammation Biomarkers
The brain has traditionally been considered as an immunologically privileged site as a result of the blood–brain barrier, absence of a lymphatic system, and lack of peripheral immune surveillance of CNS antigens. However, innate inflammation is a highly conserved process that is involved in all types of pathology and inflammatory mediators such as cytokines and chemokines are increasingly recognized as mechanistic mediators of several CNS pathologies (16, 136). This has led to the investigation of these mediators as possible biomarkers of injury or underlying pathological processes.
A number of cytokines and chemokines have been recovered from blood, CSF, and microdialysate following TBI (16). Several studies have attempted to correlate various clinical parameters with these mediator levels in order to develop their use as biomarkers. Interleukin-1beta (IL-1b) is the prototypic pro-inflammatory cytokines and has been measured in a wide range of cerebral pathologies. In TBI, raised CSF concentrations of IL-1b have been correlated to both increased ICP (137) and worsened outcome (138). IL-1b has also been recovered from the brain extra-cellular space using microdialysis. Moreover, the balance between IL-1b and its endogenous antagonist IL-1 receptor antagonist have also been related to dichotomized clinical outcome (139). In contrast, raised IL-6 concentrations have been related to an improved outcome in several studies (140–142). TNF has also been closely investigated as a cytokine with potentially deleterious effects in animal models; however no relationship could be found between CSF TNF concentrations and either blood–brain barrier permeability (143) or ICP (137, 144). CSF IL-8 has been found to correlate with both increased blood–brain barrier permeability (145) and mortality (146). However, plasma IL-8 was not found to correlate with outcome (147).
Cytokines have also been measured following ischemic stroke. Some studies have found a correlation with outcome such as between plasma IL-6 and stroke severity (148) (increased levels correlate with worse outcome) while others have found raised levels of several plasma mediators such as IL-6, matrix metalloprotease 9 (MMP-9), and S-100B but no relationship to outcome (149).
Taken together the evidence for cytokines as biomarkers is often conflicting and inconsistent. There are several reasons why cytokines may not be easily used as biomarkers. Firstly, the same mediators may behave in a different fashion depending on the exact context in which they are released (150–153). Secondly, there are multiple interactions between cytokines that mean that the cytokine milieu may impact on the action of any given biomarker such that it is overly simplistic to simply classify a mediator as damaging or protective (154). Thirdly, the time course over which a cytokine is released in relation to injury has an important effect on the concentration measured. Variations in sampling time can result in widely differing measured concentrations as the absolute levels can change by several orders of magnitude (16). Finally, because of the complexity of cytokine cascades, many cytokines are highly correlated between themselves making it difficult to infer causality from observational studies, even when a cytokine appears to predict a given clinical outcome (16, 155). Our view would be that, as fundamental mediators of the underlying pathophysiology, cytokine measurements are likely to be important biomarkers, however, a more nuanced approach to univariate correlations is required that takes into account the multiple possible interactions and utilizes panels of cytokines and patterns of expression (155).
Although not yet in widespread use, recent clinical research has demonstrated the principle of using PET with (R)-11C-PK11195, a ligand for activated microglia, to image neuroinflammation, following up patients in the months and years after TBI (14, 15). As a result, it has been suggested that therapeutic interventions may be beneficial for longer periods after trauma than previously assumed (15). Greater availability of PET technology in future would facilitate the measurement of neuroinflammation and might offer a useful guide to therapy.
Cell Death Biomarkers
In the hours and days following the primary injury, complex and variable series of changes, including energy perturbations, inflammation, and cell death, occur in the injured brain, leading to further neurological impairment and mortality. Due to its delayed nature, this secondary injury is potentially preventable. A goal of TBI research is development and clinical validation of novel pharmacological treatments to improve outcome. Studies using light and electron microscopy, cell/tissue staining, and DNA fragmentation have been instrumental in illustrating cell death, by apoptosis and necrosis, in cell and animal models of injury. However, they offer only a snapshot of a complex evolving process. Apoptotic cells can die and disappear within hours, so can be missed if the cells or tissue is analyzed too early or too late. The continuous drainage of CSF, often used to manage life-threatening intracranial hypertension in TBI patients, presents an opportunity to measure biomarkers of cell death in the brain of human TBI patients over periods of time. The changing levels of these biomarkers, typically analyzed by ELISA or immunoblotting techniques, has begun to shed light on time-dependent cell death in the brains of TBI patients.
To summarize, biomarkers used to elucidate pathways of cell death in human TBI patients, such as caspase-3 (156, 157), soluble Fas (156, 158), cytochrome c (159–161), Bcl-2 (162), alpha II-spectrin breakdown products (163), neurofilament cleavage products (164), and HMGB1 (159, 165) offer the possibility to probe cell death pathways in human TBI patients. A particular biomarker may identify a patient population that will be most susceptible to a particular neuroprotective strategy (166). Most of the cell death biomarker studies cited above have been in CSF, with the exception of Ref. (164), which was in brain microdialysates. The latter technique provides better scope for continuous monitoring in TBI patients, particularly as CSF is not always drained, and several of the cell death biomarkers are under 100 kDa making them potentially suitable for microdialysis. Better understanding of cell death biomarkers may suggest ways to better manage patients and provide appropriate neuroprotective strategies at the most effective times.
Biomarkers of Cerebral Circulation in SAH
Advancement of understanding of the pathophysiology of SAH has led to a considerable reduction in mortality (167). Factors that exert the strongest effects on outcomes have been identified as: age, neurological grade on admission, amount of SAH on admission CT, presence of intracerebral or intraventricular hemorrhage, aneurysm size and location, and presence of delayed cerebral ischemia (DCI) (168, 169). These prognosticators have remained unchanged since the 1990s. Nevertheless, new biomarkers of brain injury are being investigated.
Aneurysm rupture leads to intracranial hypertension and transient cerebral circulatory arrest (170, 171). Clinically, this manifests with depressed consciousness and is categorized using grading scales – currently the most important determinant of outcome. However, cerebral ischemia is known to cause activation of several key pathophysiological pathways, which may propagate primary injury, as well as increase tissue vulnerability to secondary insults, including DCI.
In excess of 40 different clinical scales have been described. The most frequently used are the Hunt and Hess scale (172) and the World Federation of Neurosurgical Societies scale (173), which describe the level of consciousness and the presence of neurological deficits (168, 169).
Imaging characteristics have always been an important tool evaluating SAH. The amount of SAH on the initial CT scan is known to be associated with development of DCI (however, less so with overall outcome) (174). The first systematic scale grading subarachnoid blood load was described by Fisher et al. (174) and remains to be the most widely used scale to date. Subsequently, numerous different classifications have been introduced with the aim of refining the predictive power, although few of these have added real clinical benefit and have not been as widely implemented (175–177).
Besides blood load, other early imaging characteristics have also been used for outcome prediction. Early CT perfusion has gained interest as a predictor of DCI risk. However, while current evidence supports CT perfusion for detecting DCI, the available data does not uniformly demonstrate that early imaging has prognostic value (178). Contrary to CT perfusion, early ischemia on MRI was shown to be a poor prognostic factor (103). However, these findings are hampered by small numbers, as well as by applicability only to poor-grade patients. Another acute imaging characteristic is global cerebral edema, present in up to 8% of patients on the initial CT, and further 12% on subsequent imaging (179). Patients with global edema have a higher incidence of cerebral metabolic crisis in the initial 12 h (180), and have less favorable outcomes (179).
Serial clinical examination is not possible in poor-grade patients, hence the interest in invasive and non-invasive brain monitoring techniques, including measurements of cerebral perfusion and ICP, venous oximetry (jugular bulb catheters), brain tissue oxygen tension (PbtO2), microdialysis, continuous electroencephalography (EEG), and TCD. Results are best interpreted when assessed using multimodality brain monitoring protocols (Figure 5). TCD is the most common neuromonitoring modality used in SAH. Flow velocity and Lindegaard ratio are used to detect vasospasm (181, 182). Although sensitive, only 50% of patients with positive TCD have clinical symptoms. Most PbtO2 and microdialysis data have been extrapolated from head injury. Despite the lack of large scale studies, metabolic derangements are frequently demonstrated in patients with SAH, in particular those with cerebral edema (180). Furthermore, decreased glucose, increased LPR as well as increased glutamate levels have been associated with DCI. Microdialysis is able to predict DCI with 82% sensitivity and 89% specificity (68). Similarly, frequent episodes of cerebral hypoxia (PbtO2 < 15 mmHg) have been shown to be associated with fatal outcome (183). Importantly, metabolic derangement and hypoxia are frequently not related to intracranial hypertension nor reduced cerebral perfusion, supporting the need for multimodal monitoring as well as routine imaging (184). Other experimental methods include electrocorticography to detect cortical spreading depolarizations (SD), which when clustered can lead to an inverse hemodynamic response, and thus hypoperfusion and hypoxia, and tend to be related to DCI (185, 186). Despite these promising findings and the wealth of pathophysiological information gained, the use of monitoring in guiding management remains to be determined. In particular, the focal nature of DCI poses a challenge for all focal monitoring modalities (Figure 5) (187).
FIGURE 5
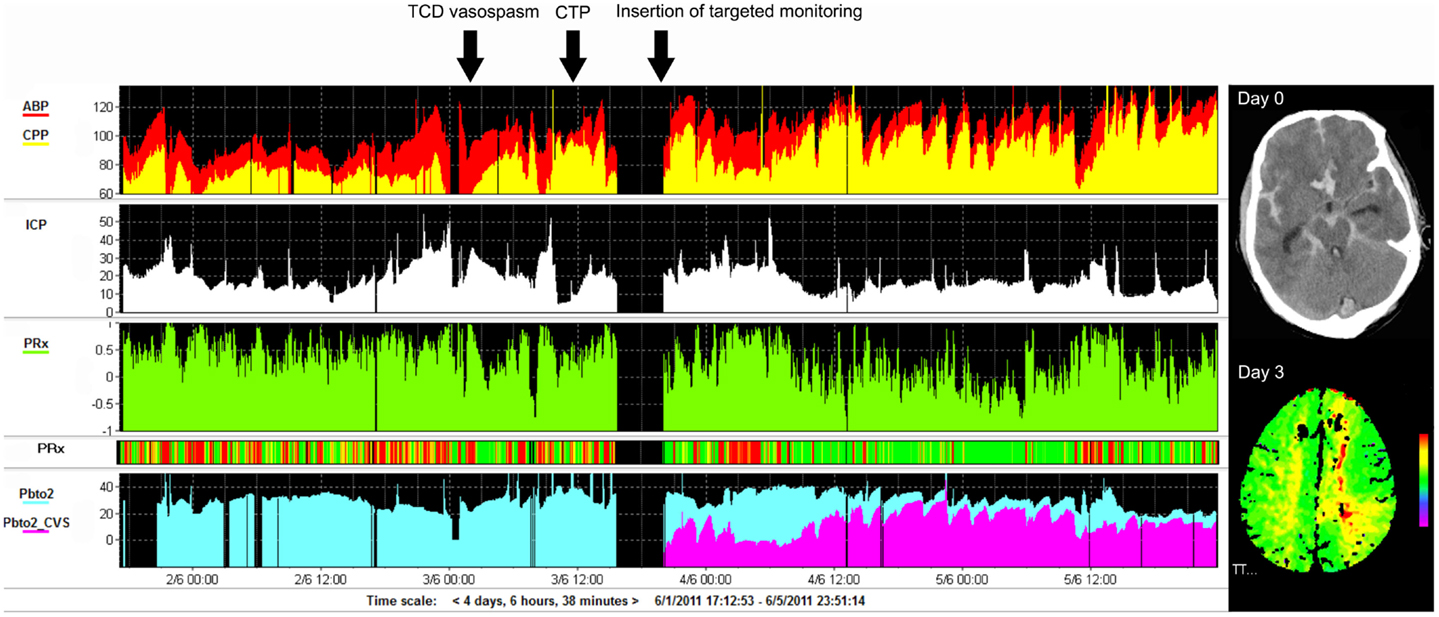
Figure 5. Example of monitoring and imaging data from a patient with SAH (WFNS 5) with an AComA aneurysm, which was clipped on day 2 post-ictus. Invasive monitoring probes including ICP and PbtO2, as well as an EVD, were inserted on the right side on admission. During the course of treatment, the patient developed cerebral vasospasm, which was initially detected using TCD monitoring on day 3 post-ictus (black arrow). Subsequent CTP on day 4 demonstrated a perfusion deficit in the left ACA territory (second black arrow signifies the time CTP performed), i.e., contralateral to the PbtO2 probe (importantly, the PbtO2 values were within normal range at all times, i.e., >25 mmHg and further responded to hypertension, rising to >30–35 mmHg). A further PbtO2 probe, targeted to the area of perfusion deficit seen on CTP, was inserted (third black arrow indicates time of insertion), which demonstrated lower/ischemic (<15 mmHg) values of PbtO2 (purple color on graph). ACA, anterior cerebral artery; AComA, anterior communicating artery; CTP, CT perfusion; EVD, external ventricular drain; PbtO2, brain tissue oxygen; SAH, subarachnoid hemorrhage; TCD, transcranial Doppler; WFNS, world federation of neurosurgical societies scale.
Different modalities, such as TCD, PbtO2, and near-infrared spectroscopy, have been used to assess the state of cerebral blood flow autoregulation–a possible homeostatic mechanism, which is thought to be affected following acute insult to the brain. The theory of the importance of autoregulation is related to the presumed dual control mechanism of cerebral blood flow, whereby, in physiological conditions, a single insult such as reduced cerebral perfusion or vessel narrowing will not produce significant alterations of blood flow due to autoregulatory compensation (188). Loss of autoregulation in the first 5 days has been found to be predictive of both unfavorable outcome as well as DCI (189, 190).
A number of biochemical compounds have been investigated as potential markers of brain injury and; however, none have been incorporated into clinical routine. Interestingly, investigated compounds can be divided into those which are thought to signify on-going brain damage/ischemia and those that are thought to play a role in the pathogenesis of DCI. Hyponatremia has been associated with cerebral infarction (191). The exact mechanism remains unknown; nevertheless, some clinicians use it as a marker of DCI. S-100beta is another compound that is known to indicate brain injury, which increases in patients after SAH (192). A recent study, looking at a panel of four markers of brain ischemia (including S-100beta), sampled within 50 h of ictus showed good predictive power for poor outcome (193). Others have studied compounds, which are thought to play a role in the pathogenesis of DCI. Notably, Endothelin-1 (ET-1), a potent vasoconstrictor, has been shown to be a marker of DCI (194). However, administration of ET-1 receptor antagonists does not improve outcome (195). Inflammation is thought to play an important role in brain ischemia after SAH, suggesting pro-inflammatory cytokines could be used as biomarkers as well as therapeutic targets. It has been shown that early increases if IL-6, both in serum and CSF, are predictive of DCI (196, 197). However, it must be noted that these findings may be contaminated by the presence of sepsis, which in itself is a poor prognosticator.
Numerous methods of stratifying brain damage after SAH have been investigated, ranging from clinical grading scales, through imaging findings and invasive neuromonitoring modalities and finally to assessment of molecular biomarkers form serum and CSF. However, despite the wealth of pathophysiological insight, few methods have gained widespread clinical acceptance. Clinical assessment with the use of grading scales remains the gold standard for outcome prognostication and decision-making. Similarly, DCI is diagnosed on the basis of neurological deterioration. TCD, angiography as well as perfusion imaging remain useful as confirmatory tools, while neuromonitoring, although showing promise is limited to only a subset of patients and is hampered by the focal nature of available probes. Further research is needed before reliable biochemical markers are available for clinical use.
Integration of Biomarkers from Multiple Modalities with Different Timescales
Important considerations in brain monitoring are those of timescales and sampling frequency. Data from modalities such as ICP, CPP, brain tissue oxygenation, pressure reactivity, etc., are captured at high rates–e.g., from 100 Hz to once per 10 s. The Nyquist theorem (198) states that any time-variable modality should be sampled at least two times more frequently than the maximal rate of its expected changes. These sampling frequencies are thus without doubt sufficiently fast to express any underlying pathological changes whatever their timescale. In contrast, biochemical changes are, of necessity, sampled much more slowly, e.g., brain microdialysis routinely has hourly vial changes and readings, while samplings of blood and CSF for analysis are typically twice a day. Furthermore, scans such as MRI and PET are “snapshots” done usually just once or twice over the course of the patient‘s neurocritical care. The question thus arises of how best to integrate data modalities with such diverse time-bases. ICP and other rapid-sampling data can be averaged, e.g., over 60-min periods, to put them on an equal footing with the hourly microdialysis data for statistical evaluation (8, 9). There is evidence to suggest that TBI patients‘ brain chemistry in many cases evolves relatively slowly; Nelson et al. found that cerebral microdialysis data are often highly auto-correlated even up to a future 30 h, but with weak correlation to ICP and CPP (75) (also see earlier section entitled Extracellular Biomarkers of Brain Chemistry). Thus, the dominant processes monitored by microdialysis may be long-term, possibly spanning days or longer, and arguably may be better related to scans than to rapid changes evident from ICP and CPP, etc. A notable exception regarding the speed of changes in brain chemistry may be in the situation of SD where pre-clinical studies indicate rapid changes in chemistry following propagation of the SD wave (199) or in the case of seizures (200). The development of rapid/continuous online detectors for microdialysis (199), as well as for blood and CSF, may assist in getting a truer picture of temporal changes in brain chemistry.
Conclusion and Future Prospects
Here, we have reviewed many of the different types of biomarkers that are available, or potentially available, for monitoring the human brain after severe acute traumatic and non-TBI. While only a small number of these biomarkers are in routine use, and then only in relatively specialized neurocritical care centers, there is a much scope for more of the non-routine biomarkers to play a role in clinical research studies to provide surrogate endpoints in Phase II studies. The latter are typically in small numbers of patients and are not statistically powered for clinical outcomes. In such context, intelligent selection of biomarkers can provide useful pointers toward efficacy at the biochemical level, which may assist decision-making as to which agents and/or procedures are worth pursuing into larger, much more costly and time-consuming Phase III trials. Examples of biomarker methodology are summarized in Table 1. Whether we need more biomarkers is an open question, which may be partly answered by increased use of screening techniques such as metabolomics and proteomics, which may help identify hitherto unrecognized candidate biomarkers.
Better use of the biomarkers we have identified already is certainly needed. Future advances in sensor technology such as lab-on-a-chip and replacement of current invasive brain probes with smaller, less invasive devices may help promote the monitoring of biomarkers at the bedside. Even with existing technology, part of the answer may be in advances in data handling methods, including multivariate analysis and machine learning technologies, particularly those that address temporal patterns. An essential foundation is the large databases that are continuing to accrue in specialist centers and multi-center collaborations. Currently, interpretations hinge on consideration of each of the parameters in relation to “consensus” thresholds based on collective experience among clinicians, and such thresholds are often debated. Furthermore, temporal patterns are usually evaluated visually. We are reaching the stage when simply “eyeballing” complex multimodal datasets may be insufficient to assess the true situation and prospect for the individual patient. More objective evaluation methods may enable better integration of time-variant, multi-parameter data and piece together the jigsaw puzzle of complex evidence to create an informative picture.
Conflict of Interest Statement
Peter J. Hutchinson is a Director of Technicam. Marek Czosnyka has a financial interest in a fraction of the licensing fee for ICM+ Software (http://www.neurosurg.cam.ac.uk/pages/ICM/index.php) licensed by Cambridge Enterprise, Cambridge, UK. The other authors have no conflicts of interest concerning this review.
Acknowledgments
We gratefully acknowledge financial support as follows. Research support: the Medical Research Council (MRC, Grant Nos. G0600986 ID79068 and G1002277 ID98489) and the National Institute for Health Research Biomedical Research Centre (NIHR BRC) Cambridge (Neuroscience Theme; Brain Injury and Repair Theme). Authors’ support: Keri Linda H. Carpenter – NIHR BRC Cambridge (Neuroscience Theme; Brain Injury and Repair Theme); Ibrahim Jalloh – MRC (Grant no. G1002277 ID 98489) and NIHR BRC Cambridge; Adel Helmy – MRC/Royal College of Surgeons of England Clinical Research Training Fellowship (Grant no. G0802251) and Raymond and Beverly Sackler Fellowship; Virginia F. J. Newcombe–Health Foundation/Academy of Medical Sciences Clinician Scientist Fellowship; Richard J. Shannon–NIHR BRC (Neuroscience Theme; Brain Injury and Repair Theme); Angelos G. Kolias–Royal College of Surgeons of England Research Fellowship, NIHR Academic Clinical Fellowship, and a Raymond and Beverly Sackler Studentship; David Krishna Menon–NIHR Senior Investigator Award; Peter J. Hutchinson – NIHR Research Professorship, Academy of Medical Sciences/Health Foundation Senior Surgical Scientist Fellowship.
Abbreviations
ABP, arterial blood pressure; ADC, apparent diffusion coefficient; ARDS, acute respiratory distress syndrome; ATP, adenosine triphosphate; BTF, Brain Trauma Foundation; CMRglc, cerebral metabolic rate of glucose; CMRO2, cerebral metabolic rate of oxygen; CNS, central nervous system; CPP, cerebral perfusion pressure; CSF, cerebrospinal fluid; CT, computed tomography; DCI, delayed cerebral ischemia; DIND, delayed ischemic neurological deficits; DTI, diffusion tensor imaging; DWI, diffusion weighted imaging; EEG, electroencephalography; ET, endothelin; FA, fractional anisotropy; FDG, 18F-fluorodeoxyglucose; FLAIR, fluid-attenuated inversion recovery; GABA, gamma-aminobutyric acid; GCS, Glasgow coma scale score; GFAP, glial fibrillary acidic protein; GOS, Glasgow outcome scale score; GE, gradient echo; GRE, gradient recalled echo; HPLC, high performance liquid chromatography; ICH, intracranial hemorrhage; ICP, intracranial pressure; IL, interleukin; i.v., intravenous; LDH, lactate dehydrogenase; LPR, lactate/pyruvate ratio; MMP, matrix metalloprotease; MRI, magnetic resonance imaging; MRS, magnetic resonance spectroscopy; NAA, N-acetylaspartate; NAAG, N-acetylaspartylglutamate; NAD+, nicotine adenine dinucleotide (oxidized form); NADH, nicotine adenine dinucleotide (reduced form); NMR, nuclear magnetic resonance; NSE, neuron-specific enolase; PbtO2, brain tissue oxygen tension; PCR, phosphocreatine; PET, positron emission tomography; Pi, inorganic phosphate; POCE, proton-observe carbon edited; PPP, pentose phosphate pathway; PRx, pressure reactivity index; ROI, region(s) of interest; SAH, subarachnoid hemorrhage; SD, spreading depolarizations; SWI, susceptibility-weighted imaging; TAI, traumatic axonal injury; TBI, traumatic brain injury; TCA cycle, tricarboxylic acid cycle; TCD, transcranial Doppler; TNF, tumor necrosis factor.
References
1. Kolias AG, Guilfoyle MR, Helmy A, Allanson J, Hutchinson PJ. Traumatic brain injury in adults. Pract Neurol (2013) 13(4):228–35. doi:10.1136/practneurol-2012-000268
2. Brain Trauma Foundation, American Association of Neurological Surgeons, Congress of Neurological Surgeons. Guidelines for the management of severe traumatic brain injury. J Neurotrauma (2007) 24(Suppl 1):S1–106. doi:10.1089/neu.2007.9999
3. Maas AI, Stocchetti N, Bullock R. Moderate and severe traumatic brain injury in adults. Lancet Neurol (2008) 7(8):728–41. doi:10.1016/S1474-4422(08)70164-9
4. Roozenbeek B, Maas AI, Menon DK. Changing patterns in the epidemiology of traumatic brain injury. Nat Rev Neurol (2013) 9(4):231–6. doi:10.1038/nrneurol.2013.22
Pubmed Abstract | Pubmed Full Text | CrossRef Full Text | Google Scholar
5. Suarez JI, Tarr RW, Selman WR. Aneurysmal subarachnoid hemorrhage. N Engl J Med (2006) 354(4):387–96. doi:10.1056/NEJMra052732
6. van Gijn J, Rinkel GJ. Subarachnoid haemorrhage: diagnosis, causes and management. Brain (2001) 124(Pt 2):249–78. doi:10.1093/brain/124.2.249
Pubmed Abstract | Pubmed Full Text | CrossRef Full Text | Google Scholar
7. Maas AI, Menon DK, Lingsma HF, Pineda JA, Sandel ME, Manley GT. Re-orientation of clinical research in traumatic brain injury: report of an international workshop on comparative effectiveness research. J Neurotrauma (2012) 29(1):32–46. doi:10.1089/neu.2010.1599
Pubmed Abstract | Pubmed Full Text | CrossRef Full Text | Google Scholar
8. Timofeev I, Carpenter KL, Nortje J, Al-Rawi PG, O’Connell MT, Czosnyka M, et al. Cerebral extracellular chemistry and outcome following traumatic brain injury: a microdialysis study of 223 patients. Brain (2011) 134(Pt 2):484–94. doi:10.1093/brain/awq353
Pubmed Abstract | Pubmed Full Text | CrossRef Full Text | Google Scholar
9. Timofeev I, Czosnyka M, Carpenter KL, Nortje J, Kirkpatrick PJ, Al-Rawi PG, et al. Interaction between brain chemistry and physiology after traumatic brain injury: impact of autoregulation and microdialysis catheter location. J Neurotrauma (2011) 28(6):849–60. doi:10.1089/neu.2010.1656
Pubmed Abstract | Pubmed Full Text | CrossRef Full Text | Google Scholar
10. Czosnyka M, Balestreri M, Steiner L, Smielewski P, Hutchinson PJ, Matta B, et al. Age, intracranial pressure, autoregulation, and outcome after brain trauma. J Neurosurg (2005) 102(3):450–4. doi:10.3171/jns.2005.102.3.0450
11. Jalloh I, Helmy A, Shannon RJ, Gallagher CN, Menon DK, Carpenter KL, et al. Lactate uptake by the injured human brain: evidence from an arteriovenous gradient and cerebral microdialysis study. J Neurotrauma (2013) 30(24):2031–7. doi:10.1089/neu.2013.2947
Pubmed Abstract | Pubmed Full Text | CrossRef Full Text | Google Scholar
12. Hutchinson PJ, O’Connell MT, Seal A, Nortje J, Timofeev I, Al-Rawi PG, et al. A combined microdialysis and FDG-PET study of glucose metabolism in head injury. Acta Neurochir (Wien) (2009) 151(1):51–61. doi:10.1007/s00701-008-0169-1
13. Hutchinson PJ, Gupta AK, Fryer TF, Al-Rawi PG, Chatfield DA, Coles JP, et al. Correlation between cerebral blood flow, substrate delivery, and metabolism in head injury: a combined microdialysis and triple oxygen positron emission tomography study. J Cereb Blood Flow Metab (2002) 22(6):735–45. doi:10.1097/00004647-200206000-00012
Pubmed Abstract | Pubmed Full Text | CrossRef Full Text | Google Scholar
14. Folkersma H, Boellaard R, Yaqub M, Kloet RW, Windhorst AD, Lammertsma AA, et al. Widespread and prolonged increase in (R)-(11)C-PK11195 binding after traumatic brain injury. J Nucl Med (2011) 52(8):1235–9. doi:10.2967/jnumed.110.084061
Pubmed Abstract | Pubmed Full Text | CrossRef Full Text | Google Scholar
15. Ramlackhansingh AF, Brooks DJ, Greenwood RJ, Bose SK, Turkheimer FE, Kinnunen KM, et al. Inflammation after trauma: microglial activation and traumatic brain injury. Ann Neurol (2011) 70(3):374–83. doi:10.1002/ana.22455
Pubmed Abstract | Pubmed Full Text | CrossRef Full Text | Google Scholar
16. Helmy A, De Simoni MG, Guilfoyle MR, Carpenter KL, Hutchinson PJ. Cytokines and innate inflammation in the pathogenesis of human traumatic brain injury. Prog Neurobiol (2011) 95(3):352–72. doi:10.1016/j.pneurobio.2011.09.003
Pubmed Abstract | Pubmed Full Text | CrossRef Full Text | Google Scholar
17. Marino S, Zei E, Battaglini M, Vittori C, Buscalferri A, Bramanti P, et al. Acute metabolic brain changes following traumatic brain injury and their relevance to clinical severity and outcome. J Neurol Neurosurg Psychiatry (2007) 78(5):501–7. doi:10.1136/jnnp.2006.099796
Pubmed Abstract | Pubmed Full Text | CrossRef Full Text | Google Scholar
18. Hamilton G, Allsop JM, Patel N, Forton DM, Thomas HC, O’Sullivan CP, et al. Variations due to analysis technique in intracellular pH measurements in simulated and in vivo 31P MR spectra of the human brain. J Magn Reson Imaging (2006) 23(4):459–64. doi:10.1002/jmri.20524
Pubmed Abstract | Pubmed Full Text | CrossRef Full Text | Google Scholar
19. Rothman DL, De Feyter HM, de Graaf RA, Mason GF, Behar KL. 13C MRS studies of neuroenergetics and neurotransmitter cycling in humans. NMR Biomed (2011) 24(8):943–57. doi:10.1002/nbm.1772
Pubmed Abstract | Pubmed Full Text | CrossRef Full Text | Google Scholar
20. Jalloh I, Carpenter KL, Grice P, Howe DJ, Mason A, Gallagher CN, et al. Glycolysis and the pentose phosphate pathway after human traumatic brain injury: microdialysis studies using 1,2-13C2 glucose. J Cereb Blood Flow Metab (2015) 35(1):111–20. doi:10.1038/jcbfm.2014.177
Pubmed Abstract | Pubmed Full Text | CrossRef Full Text | Google Scholar
21. Gallagher CN, Carpenter KL, Grice P, Howe DJ, Mason A, Timofeev I, et al. The human brain utilizes lactate via the tricarboxylic acid cycle: a 13C-labelled microdialysis and high-resolution nuclear magnetic resonance study. Brain (2009) 132(Pt 10):2839–49. doi:10.1093/brain/awp202
Pubmed Abstract | Pubmed Full Text | CrossRef Full Text | Google Scholar
22. Jalloh I, Carpenter KL, Helmy A, Carpenter TA, Menon DK, Hutchinson PJ. Glucose metabolism following human traumatic brain injury: methods of assessment and pathophysiological findings. Metab Brain Dis (2014). doi:10.1007/s11011-014-9628-y
Pubmed Abstract | Pubmed Full Text | CrossRef Full Text | Google Scholar
23. Aries MJ, Czosnyka M, Budohoski KP, Steiner LA, Lavinio A, Kolias AG, et al. Continuous determination of optimal cerebral perfusion pressure in traumatic brain injury. Crit Care Med (2012) 40(8):2456–63. doi:10.1097/CCM.0b013e3182514eb6
Pubmed Abstract | Pubmed Full Text | CrossRef Full Text | Google Scholar
24. Howells T, Elf K, Jones PA, Ronne-Engstrom E, Piper I, Nilsson P, et al. Pressure reactivity as a guide in the treatment of cerebral perfusion pressure in patients with brain trauma. J Neurosurg (2005) 102(2):311–7. doi:10.3171/jns.2005.102.2.0311
Pubmed Abstract | Pubmed Full Text | CrossRef Full Text | Google Scholar
25. Czosnyka M, Smielewski P, Kirkpatrick P, Laing RJ, Menon D, Pickard JD. Continuous assessment of the cerebral vasomotor reactivity in head injury. Neurosurgery (1997) 41(1):11–7. doi:10.1097/00006123-199707000-00005
Pubmed Abstract | Pubmed Full Text | CrossRef Full Text | Google Scholar
26. Joshi B, Ono M, Brown C, Brady K, Easley RB, Yenokyan G, et al. Predicting the limits of cerebral autoregulation during cardiopulmonary bypass. Anesth Analg (2012) 114(3):503–10. doi:10.1213/ANE.0b013e31823d292a
Pubmed Abstract | Pubmed Full Text | CrossRef Full Text | Google Scholar
27. Mitra S, Czosnyka M, Smielewski P, O’Reilly H, Brady K, Austin T. Heart rate passivity of cerebral tissue oxygenation is associated with predictors of poor outcome in preterm infants. Acta Paediatr (2014) 103(9):e374–82. doi:10.1111/apa.12696
Pubmed Abstract | Pubmed Full Text | CrossRef Full Text | Google Scholar
28. Bratton SL, Chestnut RM, Ghajar J, McConnell Hammond FF, Harris OA, Hartl R, et al. Guidelines for the management of severe traumatic brain injury. IX. Cerebral perfusion thresholds. J Neurotrauma (2007) 24(Suppl 1):S59–64. doi:10.1089/neu.2007.9987
Pubmed Abstract | Pubmed Full Text | CrossRef Full Text | Google Scholar
29. Marmarou A, Anderson RL, Ward JD, Choi SC, Young HF, Eisenberg HM, et al. NINDS Traumatic Coma Data Bank: intracranial pressure monitoring methodology. J Neurosurgery (1991) 75(Suppl):S21–7.
30. Grande PO. The “Lund concept” for the treatment of severe head trauma – physiological principles and clinical application. Intensive Care Med (2006) 32(10):1475–84. doi:10.1007/s00134-006-0294-3
31. Bratton SL, Chestnut RM, Ghajar J, McConnell Hammond FF, Harris OA, Hartl R, et al. Guidelines for the management of severe traumatic brain injury. VIII. Intracranial pressure thresholds. J Neurotrauma (2007) 24(Suppl 1):S55–8. doi:10.1089/neu.2007.9988
32. Lazaridis C, DeSantis SM, Smielewski P, Menon DK, Hutchinson P, Pickard JD, et al. Patient-specific thresholds of intracranial pressure in severe traumatic brain injury. J Neurosurg (2014) 120(4):893–900. doi:10.3171/2014.1.JNS131292
Pubmed Abstract | Pubmed Full Text | CrossRef Full Text | Google Scholar
33. Santos E, Orakcioglu B, Kentar MM, Diedler J, Uozumi Y, Scholl M, et al. Pressure reactivity index correlates with metabolic dysfunction in a porcine model of intracerebral hemorrhage. Acta Neurochir Suppl (2012) 114:363–7. doi:10.1007/978-3-7091-0956-4_70
Pubmed Abstract | Pubmed Full Text | CrossRef Full Text | Google Scholar
34. Diedler J, Karpel-Massler G, Sykora M, Poli S, Sakowitz OW, Veltkamp R, et al. Autoregulation and brain metabolism in the perihematomal region of spontaneous intracerebral hemorrhage: an observational pilot study. J Neurol Sci (2010) 295(1–2):16–22. doi:10.1016/j.jns.2010.05.027
Pubmed Abstract | Pubmed Full Text | CrossRef Full Text | Google Scholar
35. Yokobori S, Watanabe A, Matsumoto G, Onda H, Masuno T, Fuse A, et al. Time course of recovery from cerebral vulnerability after severe traumatic brain injury: a microdialysis study. J Trauma (2011) 71(5):1235–40. doi:10.1097/TA.0b013e3182140dd7
Pubmed Abstract | Pubmed Full Text | CrossRef Full Text | Google Scholar
36. Stein DM, Lindell A, Murdock KR, Kufera JA, Menaker J, Keledjian K, et al. Relationship of serum and cerebrospinal fluid biomarkers with intracranial hypertension and cerebral hypoperfusion after severe traumatic brain injury. J Trauma (2011) 70(5):1096–103. doi:10.1097/TA.0b013e318216930d
Pubmed Abstract | Pubmed Full Text | CrossRef Full Text | Google Scholar
37. Stein DM, Kufera JA, Lindell A, Murdock KR, Menaker J, Bochicchio GV, et al. Association of CSF biomarkers and secondary insults following severe traumatic brain injury. Neurocrit Care (2011) 14(2):200–7. doi:10.1007/s12028-010-9496-1
Pubmed Abstract | Pubmed Full Text | CrossRef Full Text | Google Scholar
38. Hergenroeder GW, Moore AN, McCoy JP Jr, Samsel L, Ward NH III, Clifton GL, et al. Serum IL-6: a candidate biomarker for intracranial pressure elevation following isolated traumatic brain injury. J Neuroinflammation (2010) 7:19. doi:10.1186/1742-2094-7-19
Pubmed Abstract | Pubmed Full Text | CrossRef Full Text | Google Scholar
39. Dash PK, Redell JB, Hergenroeder G, Zhao J, Clifton GL, Moore A. Serum ceruloplasmin and copper are early biomarkers for traumatic brain injury-associated elevated intracranial pressure. J Neurosci Res (2010) 88(8):1719–26. doi:10.1002/jnr.22336
Pubmed Abstract | Pubmed Full Text | CrossRef Full Text | Google Scholar
40. Hergenroeder G, Redell JB, Moore AN, Dubinsky WP, Funk RT, Crommett J, et al. Identification of serum biomarkers in brain-injured adults: potential for predicting elevated intracranial pressure. J Neurotrauma (2008) 25(2):79–93. doi:10.1089/neu.2007.0386
Pubmed Abstract | Pubmed Full Text | CrossRef Full Text | Google Scholar
41. Chesnut RM, Temkin N, Carney N, Dikmen S, Rondina C, Videtta W, et al. A trial of intracranial-pressure monitoring in traumatic brain injury. N Engl J Med (2012) 367(26):2471–81. doi:10.1056/NEJMoa1207363
Pubmed Abstract | Pubmed Full Text | CrossRef Full Text | Google Scholar
42. Stocchetti N, Picetti E, Berardino M, Buki A, Chesnut RM, Fountas KN, et al. Clinical applications of intracranial pressure monitoring in traumatic brain injury: report of the Milan consensus conference. Acta Neurochir (Wien) (2014) 156(8):1615–22. doi:10.1007/s00701-014-2127-4
Pubmed Abstract | Pubmed Full Text | CrossRef Full Text | Google Scholar
43. Vespa P, Bergsneider M, Hattori N, Wu HM, Huang SC, Martin NA, et al. Metabolic crisis without brain ischemia is common after traumatic brain injury: a combined microdialysis and positron emission tomography study. J Cereb Blood Flow Metab (2005) 25(6):763–74. doi:10.1038/sj.jcbfm.9600073
44. Kawamata T, Katayama Y, Hovda DA, Yoshino A, Becker DP. Administration of excitatory amino acid antagonists via microdialysis attenuates the increase in glucose utilization seen following concussive brain injury. J Cereb Blood Flow Metab (1992) 12(1):12–24. doi:10.1038/jcbfm.1992.3
Pubmed Abstract | Pubmed Full Text | CrossRef Full Text | Google Scholar
45. Yoshino A, Hovda DA, Kawamata T, Katayama Y, Becker DP. Dynamic changes in local cerebral glucose utilization following cerebral conclusion in rats: evidence of a hyper- and subsequent hypometabolic state. Brain Res (1991) 561(1):106–19. doi:10.1016/0006-8993(91)90755-K
Pubmed Abstract | Pubmed Full Text | CrossRef Full Text | Google Scholar
46. Sunami K, Nakamura T, Ozawa Y, Kubota M, Namba H, Yamaura A. Hypermetabolic state following experimental head injury. Neurosurg Rev (1989) 12(Suppl 1):400–11. doi:10.1007/BF01790682
Pubmed Abstract | Pubmed Full Text | CrossRef Full Text | Google Scholar
47. Hattori N, Huang SC, Wu HM, Yeh E, Glenn TC, Vespa PM, et al. Correlation of regional metabolic rates of glucose with Glasgow coma scale after traumatic brain injury. J Nucl Med (2003) 44(11):1709–16.
48. Bergsneider M, Hovda DA, Lee SM, Kelly DF, McArthur DL, Vespa PM, et al. Dissociation of cerebral glucose metabolism and level of consciousness during the period of metabolic depression following human traumatic brain injury. J Neurotrauma (2000) 17(5):389–401. doi:10.1089/neu.2000.17.389
Pubmed Abstract | Pubmed Full Text | CrossRef Full Text | Google Scholar
49. Bergsneider M, Hovda DA, Shalmon E, Kelly DF, Vespa PM, Martin NA, et al. Cerebral hyperglycolysis following severe traumatic brain injury in humans: a positron emission tomography study. J Neurosurg (1997) 86(2):241–51. doi:10.3171/jns.1997.86.2.0241
Pubmed Abstract | Pubmed Full Text | CrossRef Full Text | Google Scholar
50. Helbok R, Kurtz P, Schmidt JM, Stuart RM, Fernandez L, Malhotra R, et al. Effect of mannitol on brain metabolism and tissue oxygenation in severe haemorrhagic stroke. J Neurol Neurosurg Psychiatry (2011) 82(4):378–83. doi:10.1136/jnnp.2009.198754
Pubmed Abstract | Pubmed Full Text | CrossRef Full Text | Google Scholar
51. Oddo M, Frangos S, Milby A, Chen I, Maloney-Wilensky E, Murtrie EM, et al. Induced normothermia attenuates cerebral metabolic distress in patients with aneurysmal subarachnoid hemorrhage and refractory fever. Stroke (2009) 40(5):1913–6. doi:10.1161/STROKEAHA.108.534115
Pubmed Abstract | Pubmed Full Text | CrossRef Full Text | Google Scholar
52. Ho CL, Wang CM, Lee KK, Ng I, Ang BT. Cerebral oxygenation, vascular reactivity, and neurochemistry following decompressive craniectomy for severe traumatic brain injury. J Neurosurg (2008) 108(5):943–9. doi:10.3171/JNS/2008/108/5/0943
Pubmed Abstract | Pubmed Full Text | CrossRef Full Text | Google Scholar
53. Soukup J, Zauner A, Doppenberg EM, Menzel M, Gilman C, Bullock R, et al. Relationship between brain temperature, brain chemistry and oxygen delivery after severe human head injury: the effect of mild hypothermia. Neurol Res (2002) 24(2):161–8. doi:10.1179/016164102101199710
Pubmed Abstract | Pubmed Full Text | CrossRef Full Text | Google Scholar
54. Hillered L, Persson L, Ponten U, Ungerstedt U. Neurometabolic monitoring of the ischaemic human brain using microdialysis. Acta Neurochir (Wien) (1990) 102(3–4):91–7. doi:10.1007/BF01405420
Pubmed Abstract | Pubmed Full Text | CrossRef Full Text | Google Scholar
55. Persson L, Hillered L. Chemical monitoring of neurosurgical intensive care patients using intracerebral microdialysis. J Neurosurg (1992) 76(1):72–80. doi:10.3171/jns.1992.76.1.0072
Pubmed Abstract | Pubmed Full Text | CrossRef Full Text | Google Scholar
56. Paraforou T, Paterakis K, Fountas K, Paraforos G, Chovas A, Tasiou A, et al. Cerebral perfusion pressure, microdialysis biochemistry and clinical outcome in patients with traumatic brain injury. BMC Res Notes (2011) 4:540. doi:10.1186/1756-0500-4-540
Pubmed Abstract | Pubmed Full Text | CrossRef Full Text | Google Scholar
57. Hlatky R, Valadka AB, Goodman JC, Robertson CS. Evolution of brain tissue injury after evacuation of acute traumatic subdural hematomas. Neurosurgery (2004) 55(6):1318–23. doi:10.1227/01.NEU.0000143029.42638.2C
Pubmed Abstract | Pubmed Full Text | CrossRef Full Text | Google Scholar
58. Zauner A, Doppenberg EM, Woodward JJ, Choi SC, Young HF, Bullock R. Continuous monitoring of cerebral substrate delivery and clearance: initial experience in 24 patients with severe acute brain injuries. Neurosurgery (1997) 41(5):1082–91. doi:10.1097/00006123-199711000-00011
Pubmed Abstract | Pubmed Full Text | CrossRef Full Text | Google Scholar
59. Vespa PM, McArthur D, O’Phelan K, Glenn T, Etchepare M, Kelly D, et al. Persistently low extracellular glucose correlates with poor outcome 6 months after human traumatic brain injury despite a lack of increased lactate: a microdialysis study. J Cereb Blood Flow Metab (2003) 23(7):865–77. doi:10.1097/01.WCB.0000076701.45782.EF
Pubmed Abstract | Pubmed Full Text | CrossRef Full Text | Google Scholar
60. Meierhans R, Bechir M, Ludwig S, Sommerfeld J, Brandi G, Haberthur C, et al. Brain metabolism is significantly impaired at blood glucose below 6 mM and brain glucose below 1 mM in patients with severe traumatic brain injury. Crit Care (2010) 14(1):R13. doi:10.1186/cc8869
Pubmed Abstract | Pubmed Full Text | CrossRef Full Text | Google Scholar
61. Oddo M, Levine JM, Frangos S, Maloney-Wilensky E, Carrera E, Daniel RT, et al. Brain lactate metabolism in humans with subarachnoid hemorrhage. Stroke (2012) 43(5):1418–21. doi:10.1161/STROKEAHA.111.648568
Pubmed Abstract | Pubmed Full Text | CrossRef Full Text | Google Scholar
62. Clausen T, Khaldi A, Zauner A, Reinert M, Doppenberg E, Menzel M, et al. Cerebral acid-base homeostasis after severe traumatic brain injury. J Neurosurg (2005) 103(4):597–607. doi:10.3171/jns.2005.103.4.0597
Pubmed Abstract | Pubmed Full Text | CrossRef Full Text | Google Scholar
63. Kett-White R, Hutchinson PJ, Al-Rawi PG, Gupta AK, Pickard JD, Kirkpatrick PJ. Adverse cerebral events detected after subarachnoid hemorrhage using brain oxygen and microdialysis probes. Neurosurgery (2002) 50(6):1213–21. doi:10.1097/00006123-200206000-00008
Pubmed Abstract | Pubmed Full Text | CrossRef Full Text | Google Scholar
64. Bouzat P, Sala N, Suys T, Zerlauth JB, Marques-Vidal P, Feihl F, et al. Cerebral metabolic effects of exogenous lactate supplementation on the injured human brain. Intensive Care Med (2014) 40(3):412–21. doi:10.1007/s00134-013-3203-6
Pubmed Abstract | Pubmed Full Text | CrossRef Full Text | Google Scholar
65. Sarrafzadeh AS, Haux D, Ludemann L, Amthauer H, Plotkin M, Kuchler I, et al. Cerebral ischemia in aneurysmal subarachnoid hemorrhage: a correlative microdialysis-PET study. Stroke (2004) 35(3):638–43. doi:10.1161/01.STR.0000116101.66624.F1
Pubmed Abstract | Pubmed Full Text | CrossRef Full Text | Google Scholar
66. Chamoun R, Suki D, Gopinath SP, Goodman JC, Robertson C. Role of extracellular glutamate measured by cerebral microdialysis in severe traumatic brain injury. J Neurosurg (2010) 113(3):564–70. doi:10.3171/2009.12.JNS09689
Pubmed Abstract | Pubmed Full Text | CrossRef Full Text | Google Scholar
67. Sarrafzadeh AS, Sakowitz OW, Kiening KL, Benndorf G, Lanksch WR, Unterberg AW. Bedside microdialysis: a tool to monitor cerebral metabolism in subarachnoid hemorrhage patients? Crit Care Med (2002) 30(5):1062–70. doi:10.1097/00003246-200205000-00018
68. Unterberg AW, Sakowitz OW, Sarrafzadeh AS, Benndorf G, Lanksch WR. Role of bedside microdialysis in the diagnosis of cerebral vasospasm following aneurysmal subarachnoid hemorrhage. J Neurosurg (2001) 94(5):740–9. doi:10.3171/jns.2001.94.5.0740
Pubmed Abstract | Pubmed Full Text | CrossRef Full Text | Google Scholar
69. Nagel A, Graetz D, Schink T, Frieler K, Sakowitz O, Vajkoczy P, et al. Relevance of intracranial hypertension for cerebral metabolism in aneurysmal subarachnoid hemorrhage. Clinical article. J Neurosurg (2009) 111(1):94–101. doi:10.3171/2009.1.JNS08587
Pubmed Abstract | Pubmed Full Text | CrossRef Full Text | Google Scholar
70. Li AL, Zhi DS, Wang Q, Huang HL. Extracellular glycerol in patients with severe traumatic brain injury. Chin J Traumatol (2008) 11(2):84–8.
71. Peerdeman SM, Girbes AR, Polderman KH, Vandertop WP. Changes in cerebral interstitial glycerol concentration in head-injured patients; correlation with secondary events. Intensive Care Med (2003) 29(10):1825–8. doi:10.1007/s00134-003-1850-8
72. Schmidt JM, Ko SB, Helbok R, Kurtz P, Stuart RM, Presciutti M, et al. Cerebral perfusion pressure thresholds for brain tissue hypoxia and metabolic crisis after poor-grade subarachnoid hemorrhage. Stroke (2011) 42(5):1351–6. doi:10.1161/STROKEAHA.110.596874
Pubmed Abstract | Pubmed Full Text | CrossRef Full Text | Google Scholar
73. Stein NR, McArthur DL, Etchepare M, Vespa PM. Early cerebral metabolic crisis after TBI influences outcome despite adequate hemodynamic resuscitation. Neurocrit Care (2012) 17(1):49–57. doi:10.1007/s12028-012-9708-y
Pubmed Abstract | Pubmed Full Text | CrossRef Full Text | Google Scholar
74. Oddo M, Levine JM, Kumar M, Iglesias K, Frangos S, Maloney-Wilensky E, et al. Anemia and brain oxygen after severe traumatic brain injury. Intensive Care Med (2012) 38(9):1497–504. doi:10.1007/s00134-012-2593-1
Pubmed Abstract | Pubmed Full Text | CrossRef Full Text | Google Scholar
75. Nelson DW, Thornquist B, MacCallum RM, Nystrom H, Holst A, Rudehill A, et al. Analyses of cerebral microdialysis in patients with traumatic brain injury: relations to intracranial pressure, cerebral perfusion pressure and catheter placement. BMC Med (2011) 9:21. doi:10.1186/1741-7015-9-21
Pubmed Abstract | Pubmed Full Text | CrossRef Full Text | Google Scholar
76. Rothermundt M, Peters M, Prehn JH, Arolt V. S100B in brain damage and neurodegeneration. Microsc Res Tech (2003) 60(6):614–32. doi:10.1002/jemt.10303
77. Middeldorp J, Hol EM. GFAP in health and disease. Prog Neurobiol (2011) 93(3):421–43. doi:10.1016/j.pneurobio.2011.01.005
Pubmed Abstract | Pubmed Full Text | CrossRef Full Text | Google Scholar
78. Wolf H, Frantal S, Pajenda GS, Salameh O, Widhalm H, Hajdu S, et al. Predictive value of neuromarkers supported by a set of clinical criteria in patients with mild traumatic brain injury: S100B protein and neuron-specific enolase on trial: clinical article. J Neurosurg (2013) 118(6):1298–303. doi:10.3171/2013.1.JNS121181
Pubmed Abstract | Pubmed Full Text | CrossRef Full Text | Google Scholar
79. Honda M, Tsuruta R, Kaneko T, Kasaoka S, Yagi T, Todani M, et al. Serum glial fibrillary acidic protein is a highly specific biomarker for traumatic brain injury in humans compared with S-100B and neuron-specific enolase. J Trauma (2010) 69(1):104–9. doi:10.1097/TA.0b013e3181bbd485
Pubmed Abstract | Pubmed Full Text | CrossRef Full Text | Google Scholar
80. Mussack T, Biberthaler P, Kanz KG, Heckl U, Gruber R, Linsenmaier U, et al. Immediate S-100B and neuron-specific enolase plasma measurements for rapid evaluation of primary brain damage in alcohol-intoxicated, minor head-injured patients. Shock (2002) 18(5):395–400. doi:10.1097/00024382-200211000-00002
Pubmed Abstract | Pubmed Full Text | CrossRef Full Text | Google Scholar
81. Fridriksson T, Kini N, Walsh-Kelly C, Hennes H. Serum neuron-specific enolase as a predictor of intracranial lesions in children with head trauma: a pilot study. Acad Emerg Med (2000) 7(7):816–20. doi:10.1111/j.1553-2712.2000.tb02276.x
Pubmed Abstract | Pubmed Full Text | CrossRef Full Text | Google Scholar
82. Helmy A, Timofeev I, Palmer CR, Gore A, Menon DK, Hutchinson PJ. Hierarchical log linear analysis of admission blood parameters and clinical outcome following traumatic brain injury. Acta Neurochir (Wien) (2010) 152(6):953–7. doi:10.1007/s00701-009-0584-y
83. Vespa P, McArthur DL, Stein N, Huang SC, Shao W, Filippou M, et al. Tight glycemic control increases metabolic distress in traumatic brain injury: a randomized controlled within-subjects trial. Crit Care Med (2012) 40(6):1923–9. doi:10.1097/CCM.0b013e31824e0fcc
Pubmed Abstract | Pubmed Full Text | CrossRef Full Text | Google Scholar
84. Donnelly J, Czosnyka M, Sudhan N, Varsos GV, Nasr N, Jalloh I, et al. Increased blood glucose is related to disturbed cerebrovascular pressure reactivity after traumatic brain injury. Neurocrit Care (2015) 22(1):20–5. doi:10.1007/s12028-014-0042-4
Pubmed Abstract | Pubmed Full Text | CrossRef Full Text | Google Scholar
85. Jauch-Chara K, Oltmanns KM. Glycemic control after brain injury: boon and bane for the brain. Neuroscience (2014) 283:202–9. doi:10.1016/j.neuroscience.2014.04.059
Pubmed Abstract | Pubmed Full Text | CrossRef Full Text | Google Scholar
86. Bouzat P, Magistretti PJ, Oddo M. Hypertonic lactate and the injured brain: facts and the potential for positive clinical implications. Intensive Care Med (2014) 40(6):920–1. doi:10.1007/s00134-014-3312-x
87. Nordstrom CH, Nielsen TH. Exogenous lactate supplementation to the injured brain: misleading conclusions with clinical implications. Intensive Care Med (2014) 40(6):919. doi:10.1007/s00134-014-3297-5
88. Mannion RJ, Cross J, Bradley P, Coles JP, Chatfield D, Carpenter A, et al. Mechanism-based MRI classification of traumatic brainstem injury and its relationship to outcome. J Neurotrauma (2007) 24(1):128–35. doi:10.1089/neu.2006.0127
Pubmed Abstract | Pubmed Full Text | CrossRef Full Text | Google Scholar
89. Bigler ED. Neuropsychological results and neuropathological findings at autopsy in a case of mild traumatic brain injury. J Int Neuropsychol Soc (2004) 10(5):794–806. doi:10.1017/S1355617704105146
Pubmed Abstract | Pubmed Full Text | CrossRef Full Text | Google Scholar
90. Blumbergs PC, Scott G, Manavis J, Wainwright H, Simpson DA, McLean AJ. Staining of amyloid precursor protein to study axonal damage in mild head injury. Lancet (1994) 344(8929):1055–6. doi:10.1016/S0140-6736(94)91712-4
Pubmed Abstract | Pubmed Full Text | CrossRef Full Text | Google Scholar
91. Moen KG, Skandsen T, Folvik M, Brezova V, Kvistad KA, Rydland J, et al. A longitudinal MRI study of traumatic axonal injury in patients with moderate and severe traumatic brain injury. J Neurol Neurosurg Psychiatry (2012) 83(12):1193–200. doi:10.1136/jnnp-2012-302644
Pubmed Abstract | Pubmed Full Text | CrossRef Full Text | Google Scholar
92. Galanaud D, Perlbarg V, Gupta R, Stevens RD, Sanchez P, Tollard E, et al. Assessment of white matter injury and outcome in severe brain trauma: a prospective multicenter cohort. Anesthesiology (2012) 117(6):1300–10. doi:10.1097/ALN.0b013e3182755558
Pubmed Abstract | Pubmed Full Text | CrossRef Full Text | Google Scholar
93. Newcombe VF, Williams GB, Nortje J, Bradley PG, Harding SG, Smielewski P, et al. Analysis of acute traumatic axonal injury using diffusion tensor imaging. Br J Neurosurg (2007) 21(4):340–8. doi:10.1080/02688690701400882
Pubmed Abstract | Pubmed Full Text | CrossRef Full Text | Google Scholar
94. Aoki Y, Inokuchi R, Gunshin M, Yahagi N, Suwa H. Diffusion tensor imaging studies of mild traumatic brain injury: a meta-analysis. J Neurol Neurosurg Psychiatry (2012) 83(9):870–6. doi:10.1136/jnnp-2012-302742
Pubmed Abstract | Pubmed Full Text | CrossRef Full Text | Google Scholar
95. Newcombe V, Chatfield D, Outtrim J, Vowler S, Manktelow A, Cross J, et al. Mapping traumatic axonal injury using diffusion tensor imaging: correlations with functional outcome. PLoS One (2011) 6(5):e19214. doi:10.1371/journal.pone.0019214
Pubmed Abstract | Pubmed Full Text | CrossRef Full Text | Google Scholar
96. Hulkower MB, Poliak DB, Rosenbaum SB, Zimmerman ME, Lipton MLA. Decade of DTI in traumatic brain injury: 10 years and 100 articles later. AJNR Am J Neuroradiol (2013) 34(11):2064–74. doi:10.3174/ajnr.A3395
Pubmed Abstract | Pubmed Full Text | CrossRef Full Text | Google Scholar
97. Benson RR, Gattu R, Sewick B, Kou Z, Zakariah N, Cavanaugh JM, et al. Detection of hemorrhagic and axonal pathology in mild traumatic brain injury using advanced MRI: implications for neurorehabilitation. NeuroRehabilitation (2012) 31(3):261–79. doi:10.3233/NRE-2012-0795
Pubmed Abstract | Pubmed Full Text | CrossRef Full Text | Google Scholar
98. Sehgal V, Delproposto Z, Haacke EM, Tong KA, Wycliffe N, Kido DK, et al. Clinical applications of neuroimaging with susceptibility-weighted imaging. J Magn Reson Imaging (2005) 22(4):439–50. doi:10.1002/jmri.20404
Pubmed Abstract | Pubmed Full Text | CrossRef Full Text | Google Scholar
99. Dinkel J, Drier A, Khalilzadeh O, Perlbarg V, Czernecki V, Gupta R, et al. Long-term white matter changes after severe traumatic brain injury: a 5-year prospective cohort. AJNR Am J Neuroradiol (2013) 35(1):23–9. doi:10.3174/ajnr.A3616
Pubmed Abstract | Pubmed Full Text | CrossRef Full Text | Google Scholar
100. Farbota KD, Bendlin BB, Alexander AL, Rowley HA, Dempsey RJ, Johnson SC. Longitudinal diffusion tensor imaging and neuropsychological correlates in traumatic brain injury patients. Front Hum Neurosci (2012) 6:160. doi:10.3389/fnhum.2012.00160
Pubmed Abstract | Pubmed Full Text | CrossRef Full Text | Google Scholar
101. Khursheed F, Rohlffs F, Suzuki S, Kim DH, Ellmore TM. Artifact quantification and tractography from 3T MRI after placement of aneurysm clips in subarachnoid hemorrhage patients. BMC Med Imaging (2011) 11:19. doi:10.1186/1471-2342-11-19
Pubmed Abstract | Pubmed Full Text | CrossRef Full Text | Google Scholar
102. Jeon SB, Parikh G, Choi HA, Badjatia N, Lee K, Schmidt JM, et al. Cerebral microbleeds in patients with acute subarachnoid hemorrhage. Neurosurgery (2014) 74(2):176–81. doi:10.1227/NEU.0000000000000244
103. Wartenberg KE, Sheth SJ, Michael Schmidt J, Frontera JA, Rincon F, Ostapkovich N, et al. Acute ischemic injury on diffusion-weighted magnetic resonance imaging after poor grade subarachnoid hemorrhage. Neurocrit Care (2011) 14(3):407–15. doi:10.1007/s12028-010-9488-1
Pubmed Abstract | Pubmed Full Text | CrossRef Full Text | Google Scholar
104. Sato K, Shimizu H, Fujimura M, Inoue T, Matsumoto Y, Tominaga T. Acute-stage diffusion-weighted magnetic resonance imaging for predicting outcome of poor-grade aneurysmal subarachnoid hemorrhage. J Cereb Blood Flow Metab (2010) 30(6):1110–20. doi:10.1038/jcbfm.2009.264
Pubmed Abstract | Pubmed Full Text | CrossRef Full Text | Google Scholar
105. Vatter H, Guresir E, Berkefeld J, Beck J, Raabe A, du Mesnil de Rochemont R, et al. Perfusion-diffusion mismatch in MRI to indicate endovascular treatment of cerebral vasospasm after subarachnoid haemorrhage. J Neurol Neurosurg Psychiatry (2011) 82(8):876–83. doi:10.1136/jnnp.2010.219592
Pubmed Abstract | Pubmed Full Text | CrossRef Full Text | Google Scholar
106. Ohtonari T, Kakinuma K, Kito T, Ezuka I, Kanazawa T. Diffusion-perfusion mismatch in symptomatic vasospasm after subarachnoid hemorrhage. Neurol Med Chir (Tokyo) (2008) 48(8):331–6. doi:10.2176/nmc.48.331
Pubmed Abstract | Pubmed Full Text | CrossRef Full Text | Google Scholar
107. Govindaraju V, Gauger GE, Manley GT, Ebel A, Meeker M, Maudsley AA. Volumetric proton spectroscopic imaging of mild traumatic brain injury. AJNR Am J Neuroradiol (2004) 25(5):730–7.
108. Condon B, Oluoch-Olunya D, Hadley D, Teasdale G, Wagstaff A. Early 1H magnetic resonance spectroscopy of acute head injury: four cases. J Neurotrauma (1998) 15(8):563–71. doi:10.1089/neu.1998.15.563
Pubmed Abstract | Pubmed Full Text | CrossRef Full Text | Google Scholar
109. Signoretti S, Marmarou A, Aygok GA, Fatouros PP, Portella G, Bullock RM. Assessment of mitochondrial impairment in traumatic brain injury using high-resolution proton magnetic resonance spectroscopy. J Neurosurg (2008) 108(1):42–52. doi:10.3171/JNS/2008/108/01/0042
Pubmed Abstract | Pubmed Full Text | CrossRef Full Text | Google Scholar
110. Carpentier A, Galanaud D, Puybasset L, Muller JC, Lescot T, Boch AL, et al. Early morphologic and spectroscopic magnetic resonance in severe traumatic brain injuries can detect “invisible brain stem damage” and predict “vegetative states”. J Neurotrauma (2006) 23(5):674–85. doi:10.1089/neu.2006.23.674
Pubmed Abstract | Pubmed Full Text | CrossRef Full Text | Google Scholar
111. Uzan M, Albayram S, Dashti SG, Aydin S, Hanci M, Kuday C. Thalamic proton magnetic resonance spectroscopy in vegetative state induced by traumatic brain injury. J Neurol Neurosurg Psychiatry (2003) 74(1):33–8. doi:10.1136/jnnp.74.1.33
Pubmed Abstract | Pubmed Full Text | CrossRef Full Text | Google Scholar
112. Ricci R, Barbarella G, Musi P, Boldrini P, Trevisan C, Basaglia N. Localised proton MR spectroscopy of brain metabolism changes in vegetative patients. Neuroradiology (1997) 39(5):313–9. doi:10.1007/s002340050415
Pubmed Abstract | Pubmed Full Text | CrossRef Full Text | Google Scholar
113. Scheel M, Dreier JP, Bohner G. Evaluation of intracranial electrocorticography recording strips and tissue partial pressure of oxygen and temperature probes for radio-frequency-induced heating. Acta Neurochir Suppl (2013) 115:149–52. doi:10.1007/978-3-7091-1192-5_29
Pubmed Abstract | Pubmed Full Text | CrossRef Full Text | Google Scholar
114. Newcombe VF, Hawkes RC, Harding SG, Willcox R, Brock S, Hutchinson PJ, et al. Potential heating caused by intraparenchymal intracranial pressure transducers in a 3-Tesla magnetic resonance imaging system using a body radiofrequency resonator: assessment of the Codman MicroSensor Transducer. J Neurosurg (2008) 109(1):159–64. doi:10.3171/JNS/2008/109/7/0159
Pubmed Abstract | Pubmed Full Text | CrossRef Full Text | Google Scholar
115. Coles JP, Steiner LA, Martin J, Donovan T, Hutchinson PJ, Carpenter TA, et al. Assessment of the ventrix parenchymal intracranial pressure monitoring probe (NL950-P) and monitor (NL950-100) in a 3 Tesla magnetic resonance scanner. Anaesthesia (2003) 58(2):143–8. doi:10.1046/j.1365-2044.2003.02966.x
Pubmed Abstract | Pubmed Full Text | CrossRef Full Text | Google Scholar
116. Nicholson C, Kamali-Zare P, Tao L. Brain extracellular space as a diffusion barrier. Comput Vis Sci (2011) 14(7):309–25. doi:10.1007/s00791-012-0185-9
Pubmed Abstract | Pubmed Full Text | CrossRef Full Text | Google Scholar
117. Sykova E, Nicholson C. Diffusion in brain extracellular space. Physiol Rev (2008) 88(4):1277–340. doi:10.1152/physrev.00027.2007
118. Nicholson C, Sykova E. Extracellular space structure revealed by diffusion analysis. Trends Neurosci (1998) 21(5):207–15. doi:10.1016/S0166-2236(98)01261-2
Pubmed Abstract | Pubmed Full Text | CrossRef Full Text | Google Scholar
119. Kirov II, Tal A, Babb JS, Lui YW, Grossman RI, Gonen O. Diffuse axonal injury in mild traumatic brain injury: a 3D multivoxel proton MR spectroscopy study. J Neurol (2013) 260(1):242–52. doi:10.1007/s00415-012-6626-z
Pubmed Abstract | Pubmed Full Text | CrossRef Full Text | Google Scholar
120. Puts NA, Edden RA. In vivo magnetic resonance spectroscopy of GABA: a methodological review. Prog Nucl Magn Reson Spectrosc (2012) 60:29–41. doi:10.1016/j.pnmrs.2011.06.001
121. Kierans AS, Kirov II, Gonen O, Haemer G, Nisenbaum E, Babb JS, et al. Myoinositol and glutamate complex neurometabolite abnormality after mild traumatic brain injury. Neurology (2014) 82(6):521–8. doi:10.1212/WNL.0000000000000105
Pubmed Abstract | Pubmed Full Text | CrossRef Full Text | Google Scholar
122. Signoretti S, Di Pietro V, Vagnozzi R, Lazzarino G, Amorini AM, Belli A, et al. Transient alterations of creatine, creatine phosphate, N-acetylaspartate and high-energy phosphates after mild traumatic brain injury in the rat. Mol Cell Biochem (2010) 333(1–2):269–77. doi:10.1007/s11010-009-0228-9
Pubmed Abstract | Pubmed Full Text | CrossRef Full Text | Google Scholar
123. Lei H, Berthet C, Hirt L, Gruetter R. Evolution of the neurochemical profile after transient focal cerebral ischemia in the mouse brain. J Cereb Blood Flow Metab (2009) 29(4):811–9. doi:10.1038/jcbfm.2009.8
Pubmed Abstract | Pubmed Full Text | CrossRef Full Text | Google Scholar
124. Maddock RJ, Buonocore MH. MR spectroscopic studies of the brain in psychiatric disorders. Curr Top Behav Neurosci (2012) 11:199–251. doi:10.1007/7854_2011_197
Pubmed Abstract | Pubmed Full Text | CrossRef Full Text | Google Scholar
125. Marino S, Ciurleo R, Bramanti P, Federico A, De Stefano N. 1H-MR spectroscopy in traumatic brain injury. Neurocrit Care (2011) 14(1):127–33. doi:10.1007/s12028-010-9406-6
Pubmed Abstract | Pubmed Full Text | CrossRef Full Text | Google Scholar
126. Hochachka PW, Clark CM, Holden JE, Stanley C, Ugurbil K, Menon RS. 31P magnetic resonance spectroscopy of the Sherpa heart: a phosphocreatine/adenosine triphosphate signature of metabolic defense against hypobaric hypoxia. Proc Natl Acad Sci U S A (1996) 93(3):1215–20. doi:10.1073/pnas.93.3.1215
Pubmed Abstract | Pubmed Full Text | CrossRef Full Text | Google Scholar
127. Befroy DE, Rothman DL, Petersen KF, Shulman GI. (3)(1)P-magnetization transfer magnetic resonance spectroscopy measurements of in vivo metabolism. Diabetes (2012) 61(11):2669–78. doi:10.2337/db12-0558
Pubmed Abstract | Pubmed Full Text | CrossRef Full Text | Google Scholar
128. Petroff OA, Prichard JW, Behar KL, Alger JR, den Hollander JA, Shulman RG. Cerebral intracellular pH by 31P nuclear magnetic resonance spectroscopy. Neurology (1985) 35(6):781–8. doi:10.1212/WNL.35.6.781
129. McIntosh TK, Faden AI, Bendall MR, Vink R. Traumatic brain injury in the rat: alterations in brain lactate and pH as characterized by 1H and 31P nuclear magnetic resonance. J Neurochem (1987) 49(5):1530–40. doi:10.1111/j.1471-4159.1987.tb01024.x
Pubmed Abstract | Pubmed Full Text | CrossRef Full Text | Google Scholar
130. Vink R, McIntosh TK, Weiner MW, Faden AI. Effects of traumatic brain injury on cerebral high-energy phosphates and pH: a 31P magnetic resonance spectroscopy study. J Cereb Blood Flow Metab (1987) 7(5):563–71. doi:10.1038/jcbfm.1987.106
Pubmed Abstract | Pubmed Full Text | CrossRef Full Text | Google Scholar
131. Garnett MR, Corkill RG, Blamire AM, Rajagopalan B, Manners DN, Young JD, et al. Altered cellular metabolism following traumatic brain injury: a magnetic resonance spectroscopy study. J Neurotrauma (2001) 18(3):231–40. doi:10.1089/08977150151070838
Pubmed Abstract | Pubmed Full Text | CrossRef Full Text | Google Scholar
132. Gupta AK, Zygun DA, Johnston AJ, Steiner LA, Al-Rawi PG, Chatfield D, et al. Extracellular brain pH and outcome following severe traumatic brain injury. J Neurotrauma (2004) 21(6):678–84. doi:10.1089/0897715041269722
Pubmed Abstract | Pubmed Full Text | CrossRef Full Text | Google Scholar
133. Timofeev I, Nortje J, Al-Rawi PG, Hutchinson PJ, Gupta AK. Extracellular brain pH with or without hypoxia is a marker of profound metabolic derangement and increased mortality after traumatic brain injury. J Cereb Blood Flow Metab (2013) 33(3):422–7. doi:10.1038/jcbfm.2012.186
Pubmed Abstract | Pubmed Full Text | CrossRef Full Text | Google Scholar
134. de Graaf RA, Rothman DL, Behar KL. State of the art direct 13C and indirect 1H-[13C] NMR spectroscopy in vivo. A practical guide. NMR Biomed (2011) 24(8):958–72. doi:10.1002/nbm.1761
Pubmed Abstract | Pubmed Full Text | CrossRef Full Text | Google Scholar
135. Carpenter KL, Jalloh I, Gallagher CN, Grice P, Howe DJ, Mason A, et al. (13)C-labelled microdialysis studies of cerebral metabolism in TBI patients. Eur J Pharm Sci (2014) 57:87–97. doi:10.1016/j.ejps.2013.12.012
Pubmed Abstract | Pubmed Full Text | CrossRef Full Text | Google Scholar
136. Denes A, Thornton P, Rothwell NJ, Allan SM. Inflammation and brain injury: acute cerebral ischaemia, peripheral and central inflammation. Brain Behav Immun (2010) 24(5):708–23. doi:10.1016/j.bbi.2009.09.010
Pubmed Abstract | Pubmed Full Text | CrossRef Full Text | Google Scholar
137. Hayakata T, Shiozaki T, Tasaki O, Ikegawa H, Inoue Y, Toshiyuki F, et al. Changes in CSF S100B and cytokine concentrations in early-phase severe traumatic brain injury. Shock (2004) 22(2):102–7. doi:10.1097/01.shk.0000131193.80038.f1
Pubmed Abstract | Pubmed Full Text | CrossRef Full Text | Google Scholar
138. Shiozaki T, Hayakata T, Tasaki O, Hosotubo H, Fuijita K, Mouri T, et al. Cerebrospinal fluid concentrations of anti-inflammatory mediators in early-phase severe traumatic brain injury. Shock (2005) 23(5):406–10. doi:10.1097/01.shk.0000161385.62758.24
Pubmed Abstract | Pubmed Full Text | CrossRef Full Text | Google Scholar
139. Hutchinson PJ, O’Connell MT, Rothwell NJ, Hopkins SJ, Nortje J, Carpenter KL, et al. Inflammation in human brain injury: intracerebral concentrations of IL-1alpha, IL-1beta, and their endogenous inhibitor IL-1ra. J Neurotrauma (2007) 24(10):1545–57. doi:10.1089/neu.2007.0295
Pubmed Abstract | Pubmed Full Text | CrossRef Full Text | Google Scholar
140. Chiaretti A, Antonelli A, Mastrangelo A, Pezzotti P, Tortorolo L, Tosi F, et al. Interleukin-6 and nerve growth factor upregulation correlates with improved outcome in children with severe traumatic brain injury. J Neurotrauma (2008) 25(3):225–34. doi:10.1089/neu.2007.0405
Pubmed Abstract | Pubmed Full Text | CrossRef Full Text | Google Scholar
141. Chiaretti A, Genovese O, Aloe L, Antonelli A, Piastra M, Polidori G, et al. Interleukin 1beta and interleukin 6 relationship with paediatric head trauma severity and outcome. Childs Nerv Syst (2005) 21(3):185–93. doi:10.1007/s00381-004-1032-1
Pubmed Abstract | Pubmed Full Text | CrossRef Full Text | Google Scholar
142. Singhal A, Baker AJ, Hare GM, Reinders FX, Schlichter LC, Moulton RJ. Association between cerebrospinal fluid interleukin-6 concentrations and outcome after severe human traumatic brain injury. J Neurotrauma (2002) 19(8):929–37. doi:10.1089/089771502320317087
Pubmed Abstract | Pubmed Full Text | CrossRef Full Text | Google Scholar
143. Csuka E, Morganti-Kossmann MC, Lenzlinger PM, Joller H, Trentz O, Kossmann T. IL-10 levels in cerebrospinal fluid and serum of patients with severe traumatic brain injury: relationship to IL-6, TNF-alpha, TGF-beta1 and blood-brain barrier function. J Neuroimmunol (1999) 101(2):211–21. doi:10.1016/S0165-5728(99)00148-4
Pubmed Abstract | Pubmed Full Text | CrossRef Full Text | Google Scholar
144. Goodman JC, Van M, Gopinath SP, Robertson CS. Pro-inflammatory and pro-apoptotic elements of the neuroinflammatory response are activated in traumatic brain injury. Acta Neurochir Suppl (2008) 102:437–9. doi:10.1007/978-3-211-85578-2_85
Pubmed Abstract | Pubmed Full Text | CrossRef Full Text | Google Scholar
145. Kossmann T, Stahel PF, Lenzlinger PM, Redl H, Dubs RW, Trentz O, et al. Interleukin-8 released into the cerebrospinal fluid after brain injury is associated with blood-brain barrier dysfunction and nerve growth factor production. J Cereb Blood Flow Metab (1997) 17(3):280–9. doi:10.1097/00004647-199703000-00005
Pubmed Abstract | Pubmed Full Text | CrossRef Full Text | Google Scholar
146. Kushi H, Saito T, Makino K, Hayashi N. IL-8 is a key mediator of neuroinflammation in severe traumatic brain injuries. Acta Neurochir Suppl (2003) 86:347–50.
147. Gopcevic A, Mazul-Sunko B, Marout J, Sekulic A, Antoljak N, Siranovic M, et al. Plasma interleukin-8 as a potential predictor of mortality in adult patients with severe traumatic brain injury. Tohoku J Exp Med (2007) 211(4):387–93. doi:10.1620/tjem.211.387
Pubmed Abstract | Pubmed Full Text | CrossRef Full Text | Google Scholar
148. Yan J, Greer JM, McCombe PA. Prolonged elevation of cytokine levels after human acute ischaemic stroke with evidence of individual variability. J Neuroimmunol (2012) 246(1–2):78–84. doi:10.1016/j.jneuroim.2012.02.013
Pubmed Abstract | Pubmed Full Text | CrossRef Full Text | Google Scholar
149. An SA, Kim J, Kim OJ, Kim JK, Kim NK, Song J, et al. Limited clinical value of multiple blood markers in the diagnosis of ischemic stroke. Clin Biochem (2013) 46(9):710–5. doi:10.1016/j.clinbiochem.2013.02.005
Pubmed Abstract | Pubmed Full Text | CrossRef Full Text | Google Scholar
150. Pinteaux E, Trotter P, Simi A. Cell-specific and concentration-dependent actions of interleukin-1 in acute brain inflammation. Cytokine (2009) 45(1):1–7. doi:10.1016/j.cyto.2008.10.008
Pubmed Abstract | Pubmed Full Text | CrossRef Full Text | Google Scholar
151. Suzuki S, Tanaka K, Suzuki N. Ambivalent aspects of interleukin-6 in cerebral ischemia: inflammatory versus neurotrophic aspects. J Cereb Blood Flow Metab (2009) 29(3):464–79. doi:10.1038/jcbfm.2008.141
Pubmed Abstract | Pubmed Full Text | CrossRef Full Text | Google Scholar
152. Kadhim HJ, Duchateau J, Sebire G. Cytokines and brain injury: invited review. J Intensive Care Med (2008) 23(4):236–49. doi:10.1177/0885066608318458
Pubmed Abstract | Pubmed Full Text | CrossRef Full Text | Google Scholar
153. Popovich PG, Longbrake EE. Can the immune system be harnessed to repair the CNS? Nat Rev Neurosci (2008) 9(6):481–93. doi:10.1038/nrn2398
Pubmed Abstract | Pubmed Full Text | CrossRef Full Text | Google Scholar
154. Viviani B, Bartesaghi S, Corsini E, Galli CL, Marinovich M. Cytokines role in neurodegenerative events. Toxicol Lett (2004) 149(1–3):85–9. doi:10.1016/j.toxlet.2003.12.022
155. Helmy A, Antoniades CA, Guilfoyle MR, Carpenter KL, Hutchinson PJ. Principal component analysis of the cytokine and chemokine response to human traumatic brain injury. PLoS One (2012) 7(6):e39677. doi:10.1371/journal.pone.0039677
Pubmed Abstract | Pubmed Full Text | CrossRef Full Text | Google Scholar
156. Uzan M, Erman H, Tanriverdi T, Sanus GZ, Kafadar A, Uzun H. Evaluation of apoptosis in cerebrospinal fluid of patients with severe head injury. Acta Neurochir (Wien) (2006) 148(11):1157–64. doi:10.1007/s00701-006-0887-1
Pubmed Abstract | Pubmed Full Text | CrossRef Full Text | Google Scholar
157. Hentze H, Schwoebel F, Lund S, Keel M, Ertel W, Wendel A, et al. In vivo and in vitro evidence for extracellular caspase activity released from apoptotic cells. Biochem Biophys Res Commun (2001) 283(5):1111–7. doi:10.1006/bbrc.2001.4918
Pubmed Abstract | Pubmed Full Text | CrossRef Full Text | Google Scholar
158. Lenzlinger PM, Marx A, Trentz O, Kossmann T, Morganti-Kossmann MC. Prolonged intrathecal release of soluble Fas following severe traumatic brain injury in humans. J Neuroimmunol (2002) 122(1–2):167–74. doi:10.1016/S0165-5728(01)00466-0
Pubmed Abstract | Pubmed Full Text | CrossRef Full Text | Google Scholar
159. Au AK, Aneja RK, Bell MJ, Bayir H, Feldman K, Adelson PD, et al. Cerebrospinal fluid levels of high-mobility group box 1 and cytochrome C predict outcome after pediatric traumatic brain injury. J Neurotrauma (2012) 29(11):2013–21. doi:10.1089/neu.2011.2171
Pubmed Abstract | Pubmed Full Text | CrossRef Full Text | Google Scholar
160. Wagner AK, Amin KB, Niyonkuru C, Postal BA, McCullough EH, Ozawa H, et al. CSF Bcl-2 and cytochrome C temporal profiles in outcome prediction for adults with severe TBI. J Cereb Blood Flow Metab (2011) 31(9):1886–96. doi:10.1038/jcbfm.2011.31
Pubmed Abstract | Pubmed Full Text | CrossRef Full Text | Google Scholar
161. Darwish RS, Amiridze NS. Detectable levels of cytochrome C and activated caspase-9 in cerebrospinal fluid after human traumatic brain injury. Neurocrit Care (2010) 12(3):337–41. doi:10.1007/s12028-009-9328-3
Pubmed Abstract | Pubmed Full Text | CrossRef Full Text | Google Scholar
162. Clark RS, Kochanek PM, Adelson PD, Bell MJ, Carcillo JA, Chen M, et al. Increases in bcl-2 protein in cerebrospinal fluid and evidence for programmed cell death in infants and children after severe traumatic brain injury. J Pediatr (2000) 137(2):197–204. doi:10.1067/mpd.2000.106903
Pubmed Abstract | Pubmed Full Text | CrossRef Full Text | Google Scholar
163. Mondello S, Robicsek SA, Gabrielli A, Brophy GM, Papa L, Tepas J, et al. AlphaII-spectrin breakdown products (SBDPs): diagnosis and outcome in severe traumatic brain injury patients. J Neurotrauma (2010) 27(7):1203–13. doi:10.1089/neu.2010.1278
Pubmed Abstract | Pubmed Full Text | CrossRef Full Text | Google Scholar
164. Petzold A, Tisdall MM, Girbes AR, Martinian L, Thom M, Kitchen N, et al. In vivo monitoring of neuronal loss in traumatic brain injury: a microdialysis study. Brain (2011) 134(Pt 2):464–83. doi:10.1093/brain/awq360
Pubmed Abstract | Pubmed Full Text | CrossRef Full Text | Google Scholar
165. Bell CW, Jiang W, Reich CF III, Pisetsky DS. The extracellular release of HMGB1 during apoptotic cell death. Am J Physiol Cell Physiol (2006) 291(6):C1318–25. doi:10.1152/ajpcell.00616.2005
Pubmed Abstract | Pubmed Full Text | CrossRef Full Text | Google Scholar
166. Satchell MA, Lai Y, Kochanek PM, Wisniewski SR, Fink EL, Siedberg NA, et al. Cytochrome c, a biomarker of apoptosis, is increased in cerebrospinal fluid from infants with inflicted brain injury from child abuse. J Cereb Blood Flow Metab (2005) 25(7):919–27. doi:10.1038/sj.jcbfm.9600088
Pubmed Abstract | Pubmed Full Text | CrossRef Full Text | Google Scholar
167. Lovelock CE, Rinkel GJ, Rothwell PM. Time trends in outcome of subarachnoid hemorrhage: population-based study and systematic review. Neurology (2010) 74(19):1494–501. doi:10.1212/WNL.0b013e3181dd42b3
Pubmed Abstract | Pubmed Full Text | CrossRef Full Text | Google Scholar
168. Kassell NF, Torner JC, Haley EC Jr, Jane JA, Adams HP, Kongable GL. The international cooperative study on the timing of aneurysm surgery. Part 1: overall management results. J Neurosurg. (1990) 73(1):18–36.
169. Kassell NF, Torner JC, Jane JA, Haley EC Jr, Adams HP. The international cooperative study on the timing of aneurysm surgery. Part 2: surgical results. J Neurosurg (1990) 73(1):37–47. doi:10.3171/jns.1990.73.1.0037
Pubmed Abstract | Pubmed Full Text | CrossRef Full Text | Google Scholar
170. Grote E, Hassler W. The critical first minutes after subarachnoid hemorrhage. Neurosurgery (1988) 22(4):654–61. doi:10.1227/00006123-198804000-00006
Pubmed Abstract | Pubmed Full Text | CrossRef Full Text | Google Scholar
171. Voldby B, Enevoldsen EM. Intracranial pressure changes following aneurysm rupture. Part 1: clinical and angiographic correlations. J Neurosurg (1982) 56(2):186–96. doi:10.3171/jns.1982.56.2.0186
Pubmed Abstract | Pubmed Full Text | CrossRef Full Text | Google Scholar
172. Hunt WE, Hess RM. Surgical risk as related to time of intervention in the repair of intracranial aneurysms. J Neurosurg (1968) 28(1):14–20. doi:10.3171/jns.1968.28.1.0014
173. Drake CG, Hunt WE, Kassell N, Pertuiset B, Sano K, Teasdale G, et al. Report of World Federation of Neurological Surgeons Committee on a universal subarachnoid hemorrhage grading scale. J Neurosurg (1988) 68(6):985–6.
174. Fisher CM, Kistler JP, Davis JM. Relation of cerebral vasospasm to subarachnoid hemorrhage visualized by computerized tomographic scanning. Neurosurgery (1980) 6(1):1–9. doi:10.1227/00006123-198001000-00001
Pubmed Abstract | Pubmed Full Text | CrossRef Full Text | Google Scholar
175. Abla AA, Wilson DA, Williamson RW, Nakaji P, McDougall CG, Zabramski JM, et al. The relationship between ruptured aneurysm location, subarachnoid hemorrhage clot thickness, and incidence of radiographic or symptomatic vasospasm in patients enrolled in a prospective randomized controlled trial. J Neurosurg (2014) 120(2):391–7. doi:10.3171/2013.10.JNS13419
Pubmed Abstract | Pubmed Full Text | CrossRef Full Text | Google Scholar
176. Frontera JA, Claassen J, Schmidt JM, Wartenberg KE, Temes R, Connolly ES Jr, et al. Prediction of symptomatic vasospasm after subarachnoid hemorrhage: the modified fisher scale. Neurosurgery (2006) 59(1):21–7. doi:10.1227/01.NEU.0000218821.34014.1B
177. Hijdra A, van Gijn J, Nagelkerke NJ, Vermeulen M, van Crevel H. Prediction of delayed cerebral ischemia, rebleeding, and outcome after aneurysmal subarachnoid hemorrhage. Stroke (1988) 19(10):1250–6. doi:10.1161/01.STR.19.10.1250
Pubmed Abstract | Pubmed Full Text | CrossRef Full Text | Google Scholar
178. Cremers CH, van der Schaaf IC, Wensink E, Greving JP, Rinkel GJ, Velthuis BK, et al. CT perfusion and delayed cerebral ischemia in aneurysmal subarachnoid hemorrhage: a systematic review and meta-analysis. J Cereb Blood Flow Metab (2014) 34(2):200–7. doi:10.1038/jcbfm.2013.208
Pubmed Abstract | Pubmed Full Text | CrossRef Full Text | Google Scholar
179. Claassen J, Carhuapoma JR, Kreiter KT, Du EY, Connolly ES, Mayer SA. Global cerebral edema after subarachnoid hemorrhage: frequency, predictors, and impact on outcome. Stroke (2002) 33(5):1225–32. doi:10.1161/01.STR.0000015624.29071.1F
Pubmed Abstract | Pubmed Full Text | CrossRef Full Text | Google Scholar
180. Helbok R, Ko SB, Schmidt JM, Kurtz P, Fernandez L, Choi HA, et al. Global cerebral edema and brain metabolism after subarachnoid hemorrhage. Stroke (2011) 42(6):1534–9. doi:10.1161/STROKEAHA.110.604488
Pubmed Abstract | Pubmed Full Text | CrossRef Full Text | Google Scholar
181. Lindegaard KF, Nornes H, Bakke SJ, Sorteberg W, Nakstad P. Cerebral vasospasm after subarachnoid haemorrhage investigated by means of transcranial Doppler ultrasound. Acta Neurochir Suppl (Wien) (1988) 42:81–4.
182. Aaslid R, Huber P, Nornes H. A transcranial Doppler method in the evaluation of cerebrovascular spasm. Neuroradiology (1986) 28(1):11–6. doi:10.1007/BF00341759
183. Ramakrishna R, Stiefel M, Udoetuk J, Spiotta A, Levine JM, Kofke WA, et al. Brain oxygen tension and outcome in patients with aneurysmal subarachnoid hemorrhage. J Neurosurg (2008) 109(6):1075–82. doi:10.3171/JNS.2008.109.12.1075
Pubmed Abstract | Pubmed Full Text | CrossRef Full Text | Google Scholar
184. Chen HI, Stiefel MF, Oddo M, Milby AH, Maloney-Wilensky E, Frangos S, et al. Detection of cerebral compromise with multimodality monitoring in patients with subarachnoid hemorrhage. Neurosurgery (2011) 69(1):53–63. doi:10.1227/NEU.0b013e3182191451
Pubmed Abstract | Pubmed Full Text | CrossRef Full Text | Google Scholar
185. Dreier JP, Woitzik J, Fabricius M, Bhatia R, Major S, Drenckhahn C, et al. Delayed ischaemic neurological deficits after subarachnoid haemorrhage are associated with clusters of spreading depolarizations. Brain (2006) 129(Pt 12):3224–37. doi:10.1093/brain/awl297
Pubmed Abstract | Pubmed Full Text | CrossRef Full Text | Google Scholar
186. Dreier JP, Major S, Manning A, Woitzik J, Drenckhahn C, Steinbrink J, et al. Cortical spreading ischaemia is a novel process involved in ischaemic damage in patients with aneurysmal subarachnoid haemorrhage. Brain (2009) 132(Pt 7):1866–81. doi:10.1093/brain/awp102
Pubmed Abstract | Pubmed Full Text | CrossRef Full Text | Google Scholar
187. Ulrich CT, Fung C, Vatter H, Setzer M, Gueresir E, Seifert V, et al. Occurrence of vasospasm and infarction in relation to a focal monitoring sensor in patients after SAH: placing a bet when placing a probe? PLoS One (2013) 8(5):e62754. doi:10.1371/journal.pone.0062754
Pubmed Abstract | Pubmed Full Text | CrossRef Full Text | Google Scholar
188. Harper AM, Deshmukh VD, Sengupta D, Rowan JO, Jennett WB. The effect of experimental spasm on the CO2 response of cerebral bloodflow in primates. Neuroradiology (1972) 3(3):134–6. doi:10.1007/BF00341495
189. Budohoski KP, Czosnyka M, Smielewski P, Kasprowicz M, Helmy A, Bulters D, et al. Impairment of cerebral autoregulation predicts delayed cerebral ischemia after subarachnoid hemorrhage: a prospective observational study. Stroke (2012) 43(12):3230–7. doi:10.1161/STROKEAHA.112.669788
Pubmed Abstract | Pubmed Full Text | CrossRef Full Text | Google Scholar
190. Jaeger M, Soehle M, Schuhmann MU, Meixensberger J. Clinical significance of impaired cerebrovascular autoregulation after severe aneurysmal subarachnoid hemorrhage. Stroke (2012) 43(8):2097–101. doi:10.1161/STROKEAHA.112.659888
Pubmed Abstract | Pubmed Full Text | CrossRef Full Text | Google Scholar
191. Wijdicks EF, Vermeulen M, Hijdra A, van Gijn J. Hyponatremia and cerebral infarction in patients with ruptured intracranial aneurysms: is fluid restriction harmful? Ann Neurol (1985) 17(2):137–40. doi:10.1002/ana.410170206
Pubmed Abstract | Pubmed Full Text | CrossRef Full Text | Google Scholar
192. Sanchez-Pena P, Pereira AR, Sourour NA, Biondi A, Lejean L, Colonne C, et al. S100B as an additional prognostic marker in subarachnoid aneurysmal hemorrhage. Crit Care Med (2008) 36(8):2267–73. doi:10.1097/CCM.0b013e3181809750
Pubmed Abstract | Pubmed Full Text | CrossRef Full Text | Google Scholar
193. Turck N, Vutskits L, Sanchez-Pena P, Robin X, Hainard A, Gex-Fabry M, et al. A multiparameter panel method for outcome prediction following aneurysmal subarachnoid hemorrhage. Intensive Care Med (2010) 36(1):107–15. doi:10.1007/s00134-009-1641-y
Pubmed Abstract | Pubmed Full Text | CrossRef Full Text | Google Scholar
194. Juvela S. Plasma endothelin concentrations after aneurysmal subarachnoid hemorrhage. J Neurosurg (2000) 92(3):390–400. doi:10.3171/jns.2000.92.3.0390
195. Macdonald RL, Higashida RT, Keller E, Mayer SA, Molyneux A, Raabe A, et al. Clazosentan, an endothelin receptor antagonist, in patients with aneurysmal subarachnoid haemorrhage undergoing surgical clipping: a randomised, double-blind, placebo-controlled phase 3 trial (CONSCIOUS-2). Lancet Neurol (2011) 10(7):618–25. doi:10.1016/S1474-4422(11)70108-9
Pubmed Abstract | Pubmed Full Text | CrossRef Full Text | Google Scholar
196. Muroi C, Hugelshofer M, Seule M, Tastan I, Fujioka M, Mishima K, et al. Correlation among systemic inflammatory parameter, occurrence of delayed neurological deficits, and outcome after aneurysmal subarachnoid hemorrhage. Neurosurgery (2013) 72(3):367–75. doi:10.1227/NEU.0b013e31828048ce
Pubmed Abstract | Pubmed Full Text | CrossRef Full Text | Google Scholar
197. Schoch B, Regel JP, Wichert M, Gasser T, Volbracht L, Stolke D. Analysis of intrathecal interleukin-6 as a potential predictive factor for vasospasm in subarachnoid hemorrhage. Neurosurgery (2007) 60(5):828–36. doi:10.1227/01.NEU.0000255440.21495.80
Pubmed Abstract | Pubmed Full Text | CrossRef Full Text | Google Scholar
198. Cho S, Grazioso R, Zhang N, Aykac M, Schmand M. Digital timing: sampling frequency, anti-aliasing filter and signal interpolation filter dependence on timing resolution. Phys Med Biol (2011) 56(23):7569–83. doi:10.1088/0031-9155/56/23/015
Pubmed Abstract | Pubmed Full Text | CrossRef Full Text | Google Scholar
199. Rogers ML, Feuerstein D, Leong CL, Takagaki M, Niu X, Graf R, et al. Continuous online microdialysis using microfluidic sensors: dynamic neurometabolic changes during spreading depolarization. ACS Chem Neurosci (2013) 4(5):799–807. doi:10.1021/cn400047x
Pubmed Abstract | Pubmed Full Text | CrossRef Full Text | Google Scholar
200. Kanamori K, Ross BD. Chronic electrographic seizure reduces glutamine and elevates glutamate in the extracellular fluid of rat brain. Brain Res (2011) 1371:180–91. doi:10.1016/j.brainres.2010.11.064
Pubmed Abstract | Pubmed Full Text | CrossRef Full Text | Google Scholar
Keywords: acute brain injury (human), biomarkers, cerebral energy metabolism, cell death, inflammation, blood–brain barrier, multimodality monitoring, imaging
Citation: Carpenter KLH, Czosnyka M, Jalloh I, Newcombe VFJ, Helmy A, Shannon RJ, Budohoski KP, Kolias AG, Kirkpatrick PJ, Carpenter TA, Menon DK and Hutchinson PJ (2015) Systemic, local, and imaging biomarkers of brain injury: more needed, and better use of those already established? Front. Neurol. 6:26. doi: 10.3389/fneur.2015.00026
Received: 01 October 2014; Accepted: 30 January 2015;
Published online: 18 February 2015.
Edited by:
Elham Rostami, Uppsala University Hospital, SwedenCopyright: © 2015 Carpenter, Czosnyka, Jalloh, Newcombe, Helmy, Shannon, Budohoski, Kolias, Kirkpatrick, Carpenter, Menon and Hutchinson. This is an open-access article distributed under the terms of the Creative Commons Attribution License (CC BY). The use, distribution or reproduction in other forums is permitted, provided the original author(s) or licensor are credited and that the original publication in this journal is cited, in accordance with accepted academic practice. No use, distribution or reproduction is permitted which does not comply with these terms.
*Correspondence: Keri L. H. Carpenter, Division of Neurosurgery, Department of Clinical Neurosciences, University of Cambridge, Box 167, Cambridge Biomedical Campus, Cambridge CB2 0QQ, UK e-mail: klc1000@wbic.cam.ac.uk