 Elise Facer-Childs
 Roland Brandstaetter
- School of Biosciences, University of Birmingham, Birmingham, UK
Team performance is a complex phenomenon involving numerous influencing factors including physiology, psychology, and management. Biological rhythms and the impact of circadian phenotype have not been studied for their contribution to this array of factors so far despite our knowledge of the circadian regulation of key physiological processes involved in physical and mental performance. This study involved 216 individuals from 12 different teams who were categorized into circadian phenotypes using the novel RBUB chronometric test. The composition of circadian phenotypes within each team was used to model predicted daily team performance profiles based on physical performance tests. Our results show that the composition of circadian phenotypes within teams is variable and unpredictable. Predicted physical peak performance ranged from 1:52 to 8:59 p.m. with performance levels fluctuating by up to 14.88% over the course of the day. The major predictor for peak performance time in the course of a day in a team is the occurrence of late circadian phenotypes. We conclude that circadian phenotype is a performance indicator in teams that allows new insight and a better understanding of team performance variation in the course of a day as often observed in different groupings of individuals.
Introduction
Whether it is in the sports world, the academic world, or the corporate world, the pressures on personal best and team performances in modern society are growing and understanding the influencing factors affecting optimal performance, which span from cognitive and physical abilities to expert skills, training, and experience (1–3), becomes increasingly important. Both physical and mental performances are of great significance to individuals and teams when trying to maximize productivity or optimize performance and positive links between physical and mental performance have been identified in a considerable number of studies (4–11). Various factors are involved in overall performance, including intensity of activity, duration, response time (12, 13), the effect of physical activity on executive cognitive function (13–18), and individual fitness, which have impacts on post-exercise mental performance (19). Critical decision-making is also imperative to overall optimal performance. Macora and colleagues (20) described that a state of “mental fatigue” occurs after extended periods of cognitive processing and found that exercise tolerance could be affected by the state of mental fatigue, impairing physical performance. Interestingly, it was the perception of effort that was significantly different under a mental fatigued state, and not any physiological functions, such as cardiovascular mechanisms (20). It has, therefore, been proposed in the motivation intensity theory that perceived exertion and potential motivation influence performance (21). Further interactions between circadian processes and sleep homeostasis in human performance have been described in the two-process model of sleep regulation (22). Disturbances in these processes have been shown to affect neural activation and brain metabolism, ultimately influencing mental and physical performance (23). This model has been adapted to account for a buildup of sleep debt by McCauley and colleagues (24). In this model, the effect on performance is determined by the daily time spent awake and a recent study showed that physical performance strongly depends on time since awakening (25) supporting the view that this model requires further development and consideration of further sleep related parameters (23).
A complex network of endogenously driven biological clocks regulates virtually all physiological and behavioral diurnal variations in humans. Circadian rhythmicity has been shown to contribute to the regulation of key physiological and cognitive processes involved in performance, including plasma levels of hormones, glucose tolerance, core body temperature, blood pressure, and performance variables, such as reaction times, alertness, and memory speed (26–30). The master circadian oscillator, the hypothalamic suprachiasmatic nucleus (SCN), acts as an internal coordinator and synchronizer at the whole-organism level (31–33). At the cellular level, circadian rhythm generation is based on interlocking molecular feedback loops and post-translational modifications, referred to as the transcriptional translational feedback loop (TTFL) (34). Individual circadian rhythms, i.e., whether individuals are “larks” or “owls” (35, 36), have strong impact on the individual performance (25). The differences between larks and owls, also called “morning/evening types” or “chronotypes” (35, 37), and referred to as circadian phenotypes (25) in this paper, are due to environmental influences, genetic variation, age, and gender. The combination of these factors results in disparities between individuals’ biological clocks and how they entrain to exogenous (environmental) cues, such as the environmental light/dark cycle and social factors (38).
In this paper, we are exploring the possible impact of individual diurnal performance variation in interdependent group situations (e.g., sports teams) depending on the within-group composition of circadian phenotypes. We use a simple model considering individual diurnal performance variation of different circadian phenotypes to predict team performance variability establishing circadian phenotype as an important performance indicator in teams.
Experimental Procedures
Participants and Chronometric Testing
Two hundred and sixteen individuals (114 females, 102 males, ages ranged from 16 to 35, average age of 21.5 ± 3.96 years), across 12 sports teams including 5 field hockey teams and 7 football teams (Table 1) with standards ranging from regional club to international level participated in this study. Participants were recruited during training sessions and all team members asked to complete the RBUB chronometric test. In 9 out the 12 teams, 100% of team members returned the completed chronometric test (teams 1, 3, 4, 5, 6, 7, 8, 11, and 12); in the remaining three teams, 82% (team 2), 91% (team 9), and 73% (team 10) of team members returned the completed chronometric test.
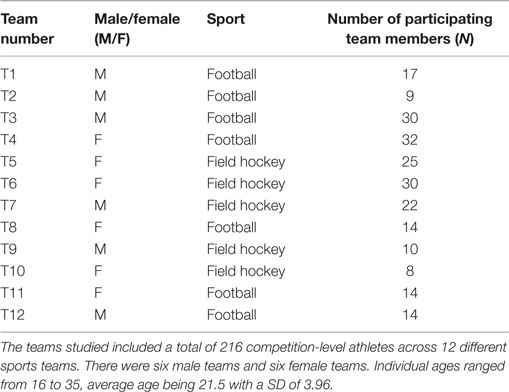
Table 1. Details of composition, gender, total number of team players, and sport for each team.
The chronometric questionnaire (RBUB chronometric test) (25) was developed to study sleep/wake-related circadian parameters as compared to training, competition, and performance variables. All data were collected according to the Human Ethics regulations of the University of Birmingham and all participants were informed that data collected were treated anonymously and held according to the Data protection Act 1998. The RBUB chronometric test (25) collects information on wake-up times, sleep-onset times, sleep-onset delays, sleep duration, alarm use, light exposure, food intake, exogenous schedules (work, training, competition, school and/or university timetables), sleep quality, daytime naps, periods of mental and physical high and low activity, energy drink consumption, alcohol consumption, caffeine consumption, and smoking. Completion of the chronometric test took athletes 10 min on average. For each individual, scores were allocated to wake-up times and sleep-onset times during weekdays, weekends, and free days, the time lag between weekday and weekend wake-up times, self-reported times of high (mentally and physically active) and low (tiredness, fatigue) activity periods and meal times. Masking factors, such as working hours, university timetables, and training schedules, were considered when allocating scores. Scores represented time in hours and were used to categorize into early (ECT), intermediate (ICT), and late (LCT) circadian phenotypes.
Modeling of Predicted Physical Performance Rhythms
Predicted physical performance was calculated from previously collected performance-test results (25). Briefly, performance data from three different performance tests (BLEEP tests, sprints, and skills/accuracy tests) carried out at six different times of day between 07.00 and 22.00 h were analyzed separately for athletes of the three different circadian phenotypes, i.e., early (ECT), intermediate (ICT), and late (LCT), and diurnal performance curves produced for each circadian phenotype showing significantly different curve shapes and peak performance times in the course of a day (25).
From the previously obtained BLEEP test results (25), representative daily performance curves were generated for each circadian phenotype by using second-order polynomial non-linear regressions generating 15-min time interval curve fits. Peak performance times were determined as time of day of maximum values of second-order polynomial non-linear regression curves and peak performance values as percentage of maximum performance. The x/y data of these curve fits were then combined by averaging ECT, ICT, and LCT data to generate performance curves modeling predicted diurnal team performance curves according to the distribution of circadian phenotypes for each team. Second-order polynomial non-linear regressions were used as curve fits throughout the study to calculate performance values as a function of time of day as well as to determine peak performance values. Kruskal–Wallis test was used to test differences of circadian and performance parameters between circadian phenotypes between teams and between different times of day for statistical significance. Dunn’s multiple comparison test was used to compare individual group mean values.
Results
Circadian Phenotyping
Following comprehensive analysis and consideration of specific sleep/wake-related criteria, including wake-up times on weekdays, weekends, and training-free days, sleep onset on weekdays, weekends, and training-free days, sleep durations, periods of high and low activity, sleep inertia, and meal times, as previously described (25), all participants could be categorized into “circadian phenotypes” (CT). In total, we identified 15% early circadian phenotypes (ECT; n = 32), 51% intermediate circadian phenotypes (ICT; n = 111), and 34% late circadian phenotypes (LCT; n = 73). The circadian phenotyping methodology proved consistent with relevant circadian parameters, such as wake-up times, sleep-onset times, and sleep durations (Figure 1). Average wake-up times differed significantly between circadian phenotypes (Kruskal–Wallis, p < 0.001) being 6.90 ± 0.11 h for ECTs on weekdays as compared to 7.55 ± 0.11 h on weekends, for ICTs 7.77 ± 0.08 h at weekdays and 9.29 ± 0.06 h on weekends, and for LCTs 8.98 ± 0.14 h on weekdays and 10.91 ± 0.10 h on weekends (Figures 1A,B). Significant differences were also seen in sleep-onset times (Kruskal–Wallis, p < 0.001) and sleep duration times (Kruskal–Wallis, p < 0.001). ECT sleep onset was 23.23 ± 0.13 h on weekdays and 23.84 ± 0.17 h on weekends, whilst ICT sleep onset was 23.53 ± 0.08 h on weekdays and 24.32 ± 0.10 h on weekends. LCT average sleep onset was 24.27 ± 0.13 h on weekdays and 01.66 ± 0.16 h on weekends (Figures 1C,D). ECTs slept for 7.66 ± 0.12 h on weekdays and 7.70 ± 0.22 h on weekends, ICTs for an average of 8.24 ± 0.11 h on weekdays and 8.97 ± 0.12 h on weekends, and LCTs for 8.70 ± 0.17 h on weekdays and 9.25 ± 0.17 h on weekends (Figures 1E,F).
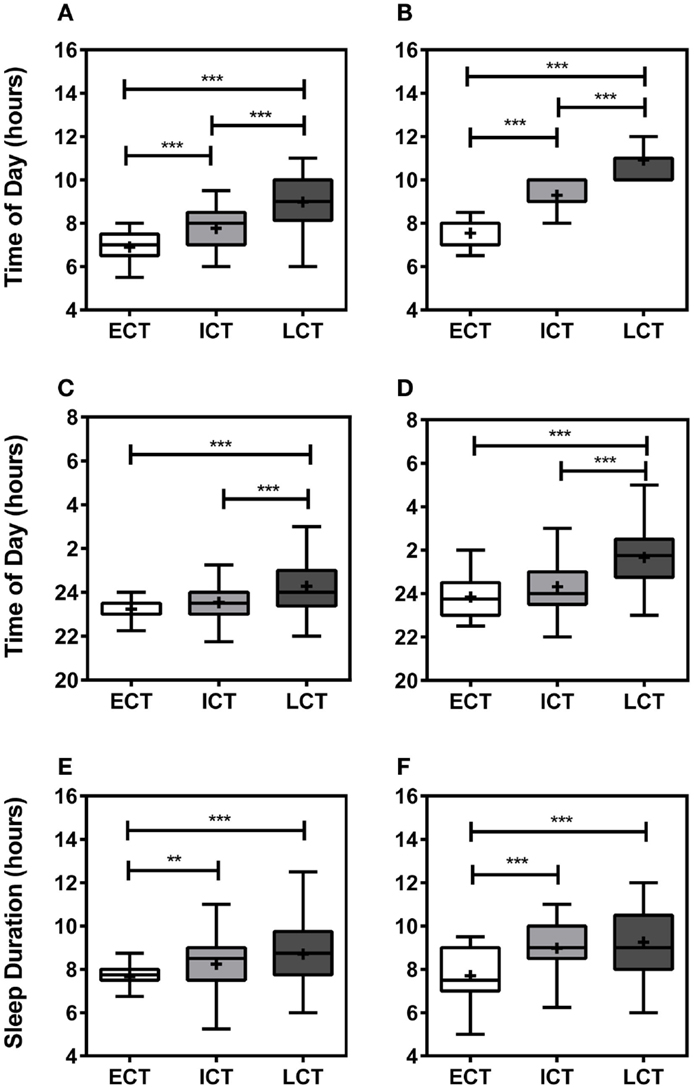
Figure 1. Relevant sleep/wake parameters validate circadian phenotyping. (A) Average wake-up time on weekdays. (B) Average wake-up time at weekends. (C) Average sleep onset on weekdays. (D) Average sleep onset at weekends. (E) Average sleep duration during weekdays. (F) Average sleep duration weekends. White boxes represent early circadian phenotypes (ECT), light gray boxes represent intermediate circadian phenotypes (ICT), late circadian phenotypes are shown in dark gray (LCT). Boxplots show 25th–75th percentile. Whiskers and outliers are plotted by the Tukey method and the mean is shown within the box as a +. Statistical analysis was carried out using Kruskal–Wallis non-parametric tests combined with Dunn’s multiple comparison test. ns, not significant, **p < 0.01, ***p < 0.001.
Team Distribution of Circadian Phenotypes and Predicted Diurnal Physical Performance
The composition of circadian phenotypes was highly variable between the 12 teams (T1–T12). The most prominent differences in circadian phenotype composition were found between one female team (T10) made up of 75% ECTs and 25% ICTs (average age 27.0 years) and one male team (T3) made up of 7% ECTs, 23% ICTs, and 70% LCTs (average age 19.9 years) (Figure 2). Overall, ECTs ranged from 0 (T2) to 75% (T10), ICTs from 23 (T3) to 89% (T2), and LCTs from 0 (T8, T10) to 70% (T3) (Figures 2A–L). Predicted diurnal peak performance times varied by 7.12 h between teams, with earliest peak performance found in T10 at 13.52 h and latest peak performance found in T3 at 20.59 h (Figures 2A–L). Several teams showed comparable performance peaks in the afternoon (T8 at 14.53 h, T2 at 15.05 h, T9 at 15.08 h, T5 at 15.23 h, and T6 at 15.38 h), while others showed their performance peaks significantly later, i.e., early evening (T1 at 18.26 h, T4 and T7 at 18.41 h) (Figures 2A–L). Further analysis showed a highly significant correlation between the number of LCTs and predicted team peak performance time with peak performance time being later in the day with increasing numbers of LCTs (Spearman non-parametric correlation, p < 0.001), while there was no significant correlation between the number of ECTs and ICTs and predicted team peak performance time (p = 0.06 and p = 0.25, respectively).
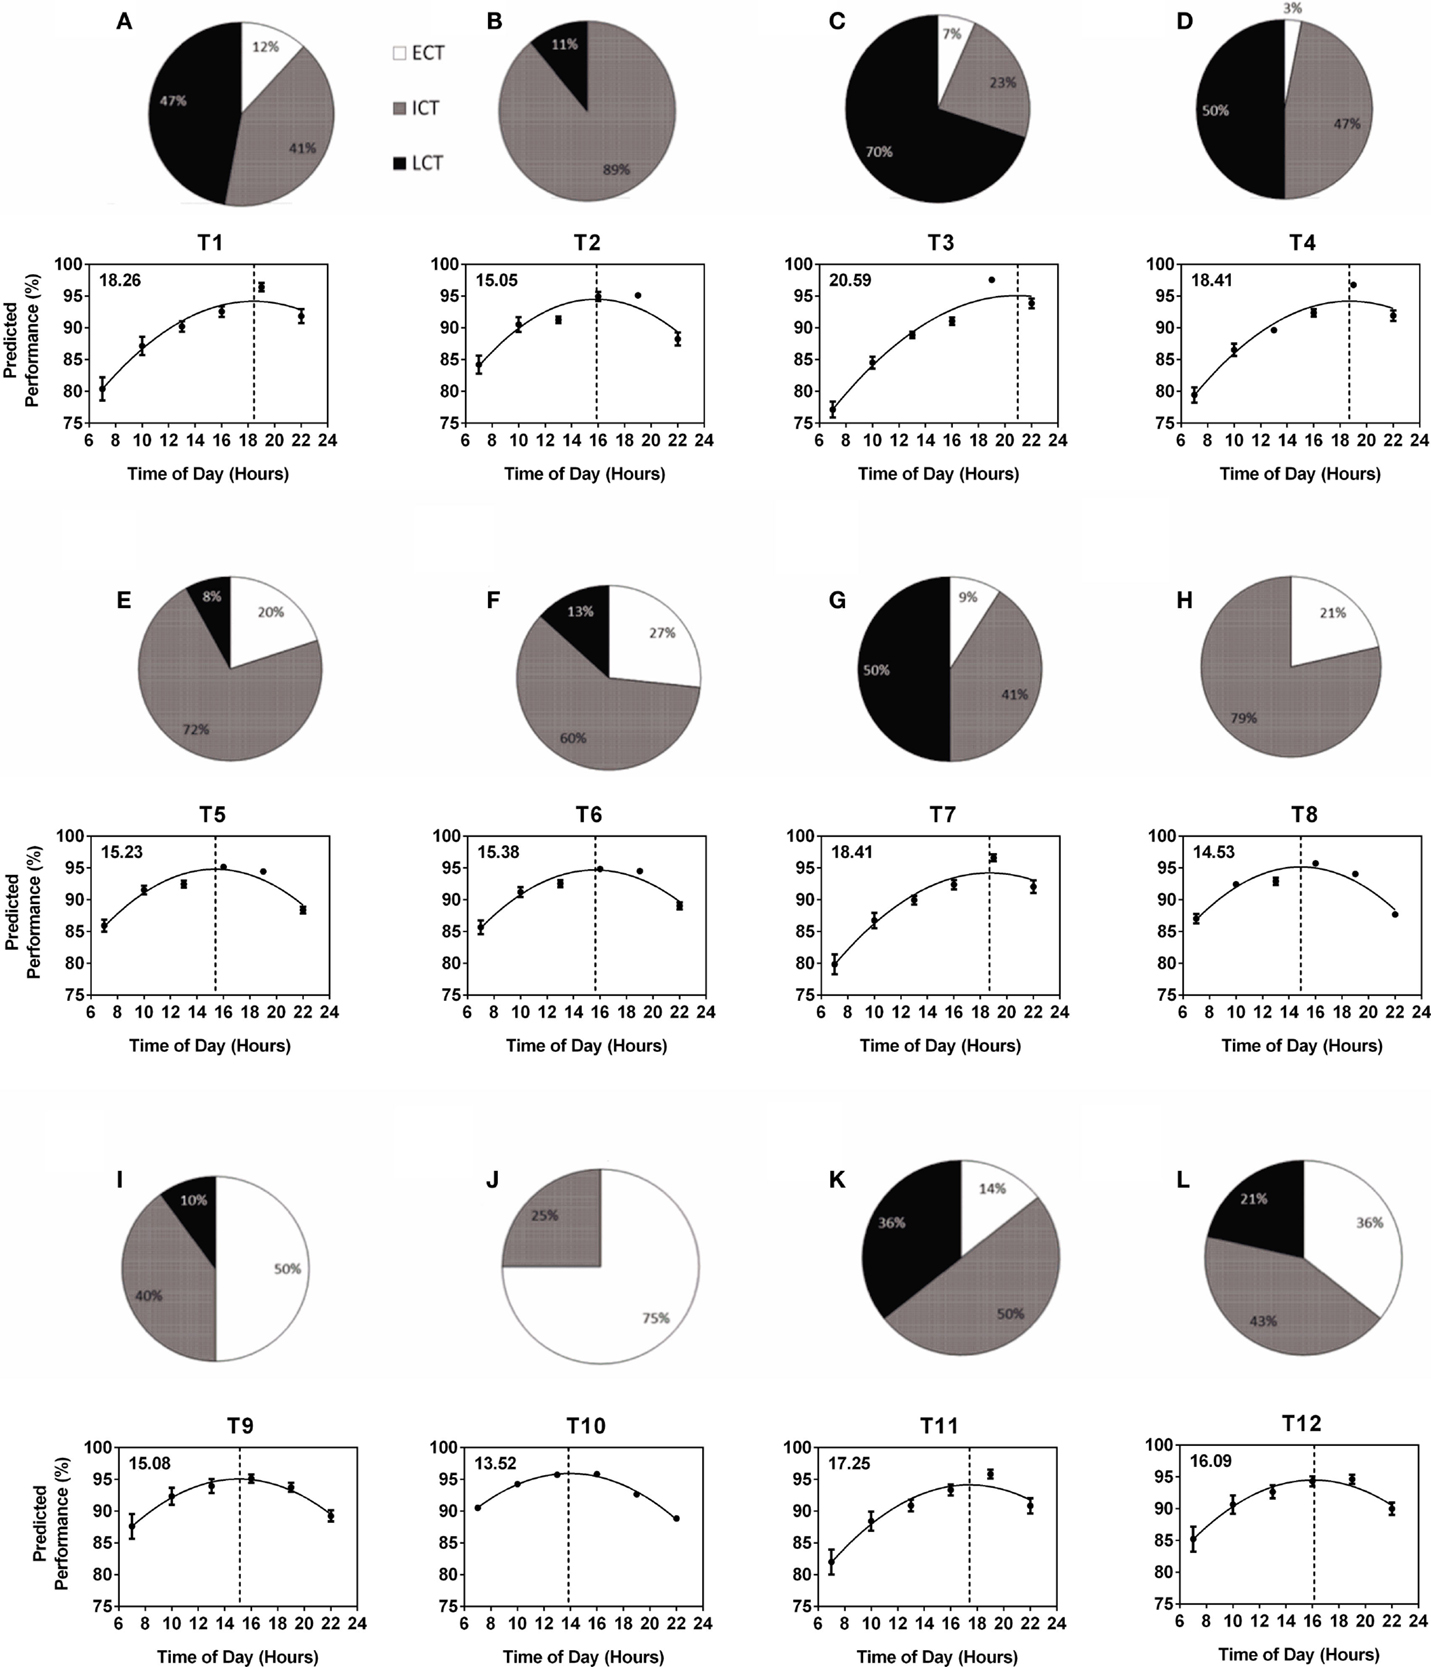
Figure 2. Variability of within-team circadian phenotype composition determines predicted diurnal performance curves and peak performance times. Each team (T1–T12) is represented by a pie chart showing the composition of circadian phenotypes and a graph showing predicted performance over the course of a day calculated from performance tests conducted at six different times of day (25). Peak performance times are indicated by the dotted vertical lines and shown in the top left hand corner of each graph. Early circadian phenotypes (ECT) are shown in white, intermediate circadian phenotypes (ICT) in gray and late circadian phenotypes (LCT) in black. (A) T1. (B) T2. (C) T3. (D) T4. (E) T5. (F) T6. (G) T7. (H) T8. (I) T9. (J) T10. (K) T11. (L) T12.
Diurnal Performance Variation within and between Teams
When analyzing performance during morning (M = 07.00–10.00 h), afternoon (A = 13.00–16.00 h), and evening (E = 19.00–22.00 h) within teams, our model predicts significant differences in performance levels between at least two of the three different times of day in all teams and significant differences between all three times of day in five (42%) of the teams. In seven (58%) of the teams, performance values were highest in the afternoon, while performance levels peaked in the evening in five teams (Figures 3A–L). T3, T4, T5, T6, and T7 showed significant differences in peak performance between M/A, A/E, and M/E (Kruskal–Wallis, p < 0.001). T1, T2, T11, and T12 showed significant differences between M/A and M/E whilst significant differences were seen between M/A, between A/E in T10, and between M/A in T9 (Kruskal–Wallis, p < 0.001). The largest performance variation over the course of the day was 14.88% in T3 with predicted performance values of 80.83 ± 0.92% of maximum performance in the morning, 89.97 ± 0.41% in the afternoon, and 95.71 ± 0.50% in the evening (Kruskal–Wallis, p < 0.001) (Figures 3A–L).
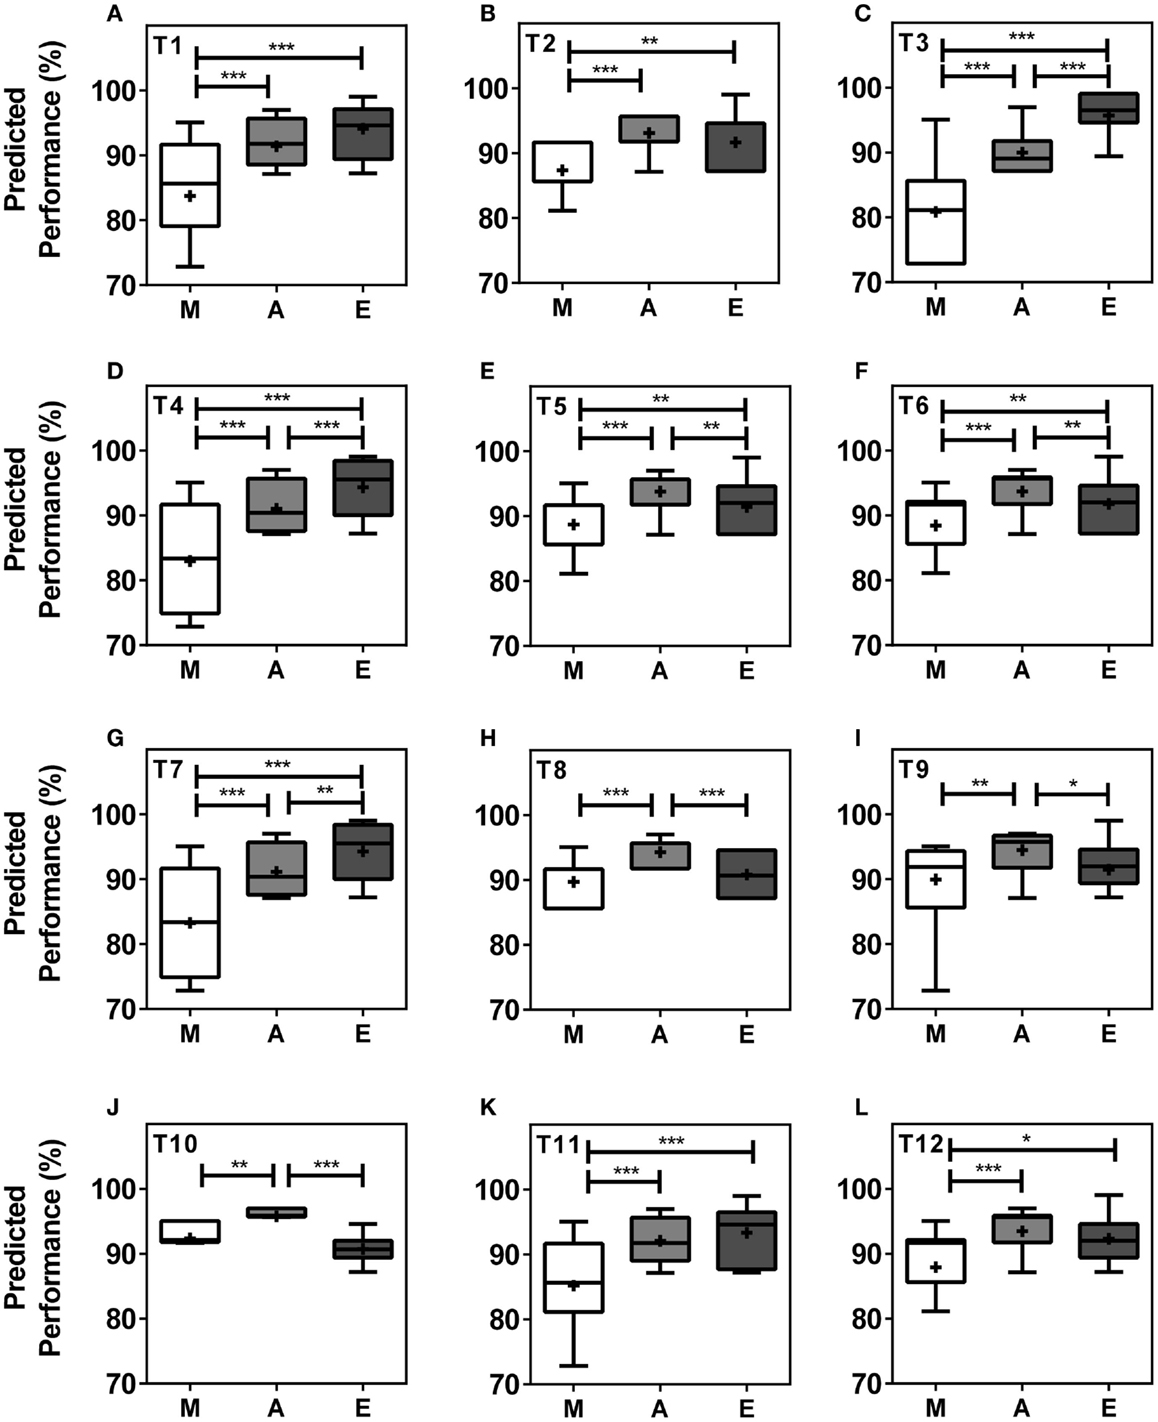
Figure 3. Team performance undergoes significant changes in the course of a day within teams. Boxplots represent predicted team performance levels of T1 (A) to T12 (L). (M) = morning, i.e., 07.00–10.00 h, light gray bars; (A) = afternoon, i.e., 13.00–16.00 h, dark gray bars; (E) = evening, i.e., 19.00–22.00 h, black bars. Tukey boxplots show 25th–75th percentile; mean values are shown within the box as a +. Statistical analysis was carried out using Kruskal–Wallis non-parametric tests combined with Dunn’s multiple comparison test. *p < 0.05, **p < 0.01, ***p < 0.001.
Morning (M), afternoon (A), and evening (E) comparison between teams predicts highly significant differences (Kruskal–Wallis, p < 0.001) with clear differences in variability between the different times of day (Figure 4). Kruskal–Wallis and Dunn’s post-test allowed 66 possible combinations of analyses between the teams; for both morning (M) and afternoon (A) performance, 20 out of the 66 possible team comparisons were significantly different, while for evening (E) performance, 12 out of 66 possible team comparisons differed significantly (Figures 4A–C; Table S1 in Supplementary Material).
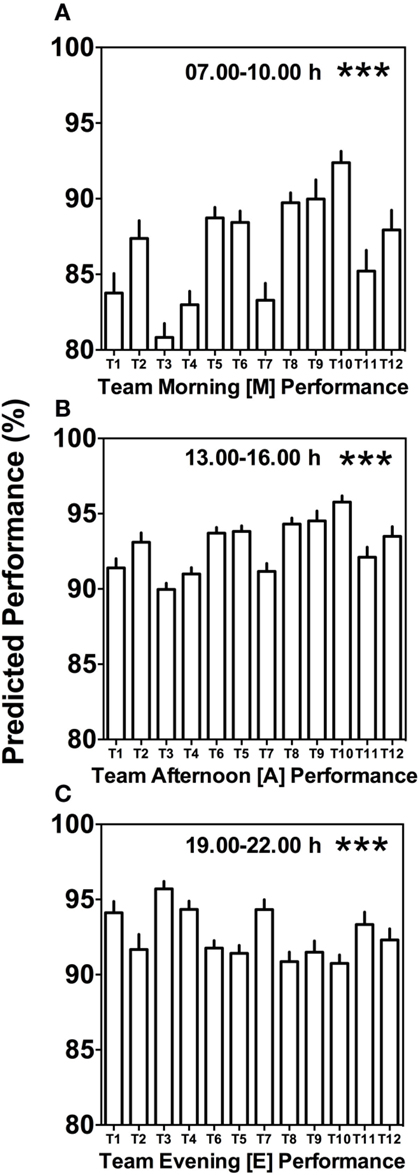
Figure 4. Between-team performance differences are most pronounced in the morning and afternoon. (A) Average predicted team performance in the morning ([M] = 07.00 and 10.00 h performance tests), (B) average predicted team performance in the afternoon ([A] = 13.00 and 16.00 h performance tests), and (C) average predicted team performance in the evening ([E] = 19.00 and 22.00 h performance tests). Bars represent mean values + SE of predicted team performance levels based on the composition of circadian phenotypes within each team. Statistical analysis was carried out using Kruskal–Wallis non-parametric tests combined with Dunn’s multiple comparison test. ***p < 0.001. Predicted performance represents percentage of maximum performance attained. Dunn’s multiple comparison test results are shown in Table S1 in Supplementary Material.
Impact of Age and Gender on Predicted Performance
A higher percentage of males were LCT (45%) as compared to females (24%), whilst the percentage of ECTs was similar for both males and females (12 and 17%, respectively). Average age for ECTs was 24.16 ± 0.97, for ICTs 21.36 ± 0.35, and for LCTs 20.51 ± 0.36 showing a significant increase of ECTs with age (Kruskal–Wallis, p < 0.001). Analysis of age vs. circadian phenotype composition within teams showed that the significant increase of ECTs with age was caused by a significant positive correlation between increasing age and increasing percentage of ECTs (p = 0.0239) in males only (Figures 5A–F). Age did not correlate with predicted peak performance times (Figures 5G–I).
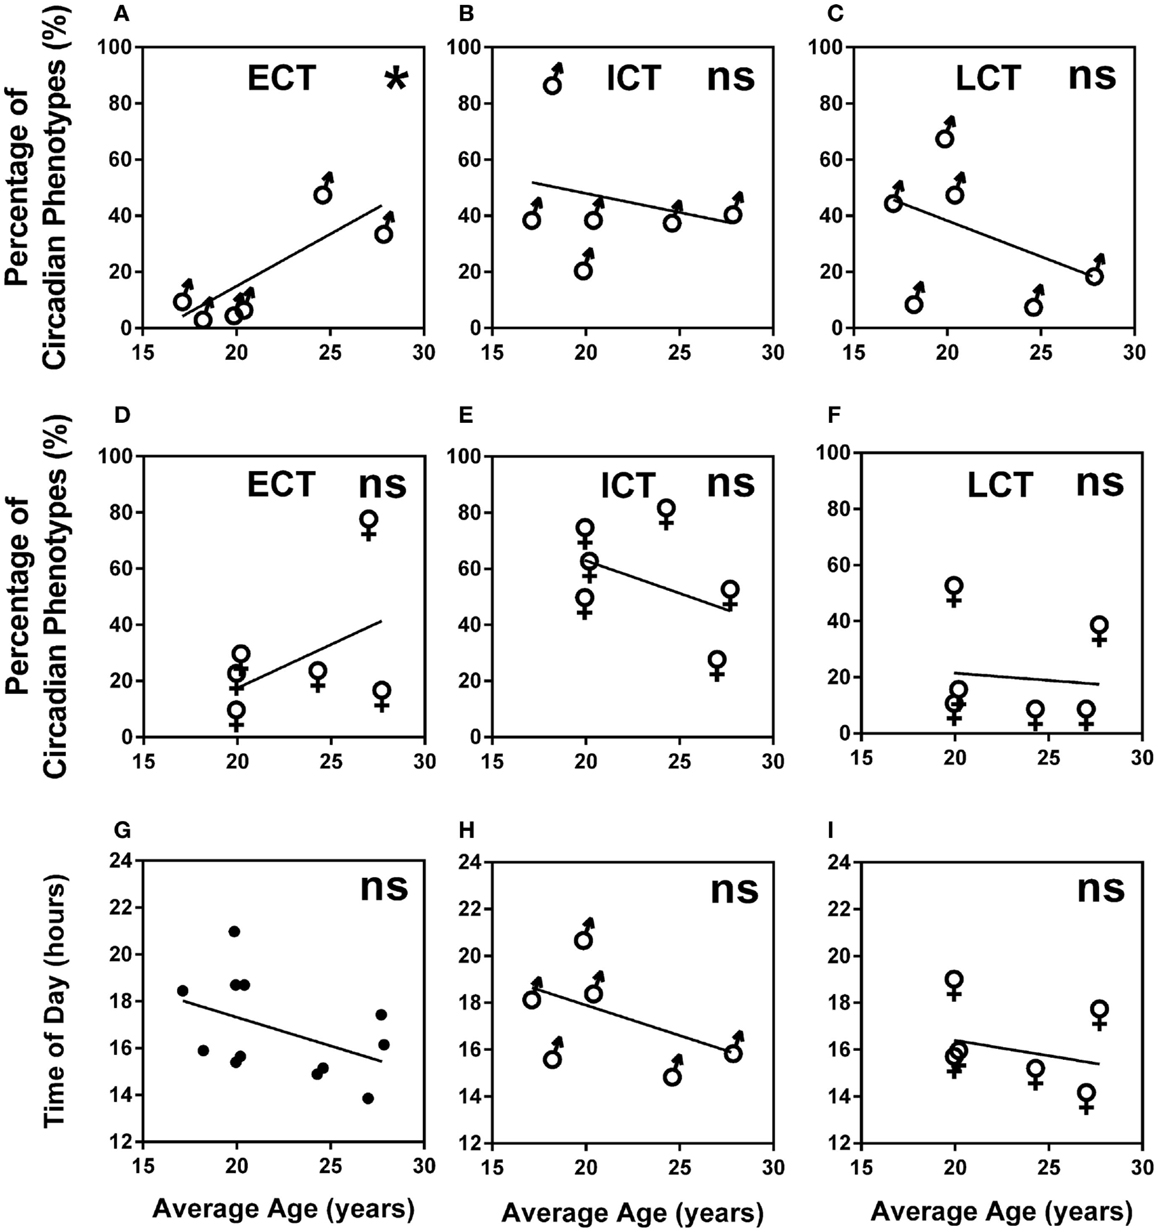
Figure 5. Age and gender are negligible predictors of circadian phenotype composition and peak performance times. (A) Male teams average age vs. percentage of ECTs. (B) Male teams average age vs. percentage of ICTs. (C) Male teams average age vs. percentage of LCTs. (D) Female teams average age vs. percentage of ECTs. (E) Female teams average age vs. percentage of ICTs. (F) Female teams average age vs. percentage of LCTs. (G) Age vs. predicted peak performance for all teams. (H) Age vs. predicted peak performance in male teams. (I) Age vs. predicted peak performance in female teams. Statistical analysis was carried out using linear regression analysis; ns, not significant, *p < 0.05. Early circadian phenotypes are labeled as ECT, intermediate circadian phenotypes as ICT and late circadian phenotypes as LCT; male teams, ♂; female teams, ♀.
Self-Reported Mental and Physical Performance
Through the analysis of the chronometric tests, self-reported high mental and physical activity frequency curves overlap considerably in each of the circadian phenotypes. Highest percentage of ECTs reported highest mental activity at X = 12 (90.48%) and highest physical performance at X = 12 (80.95%). ICT curves were similar with highest mental performance at X = 13 (72.73%) and physical at X = 13 (69.70%). LCT curves were delayed as compared to ECTs and ICTs with highest mental performance at X = 14 (81.25%) and highest physical at X = 16 (68.75%) (Figures 6A–C).
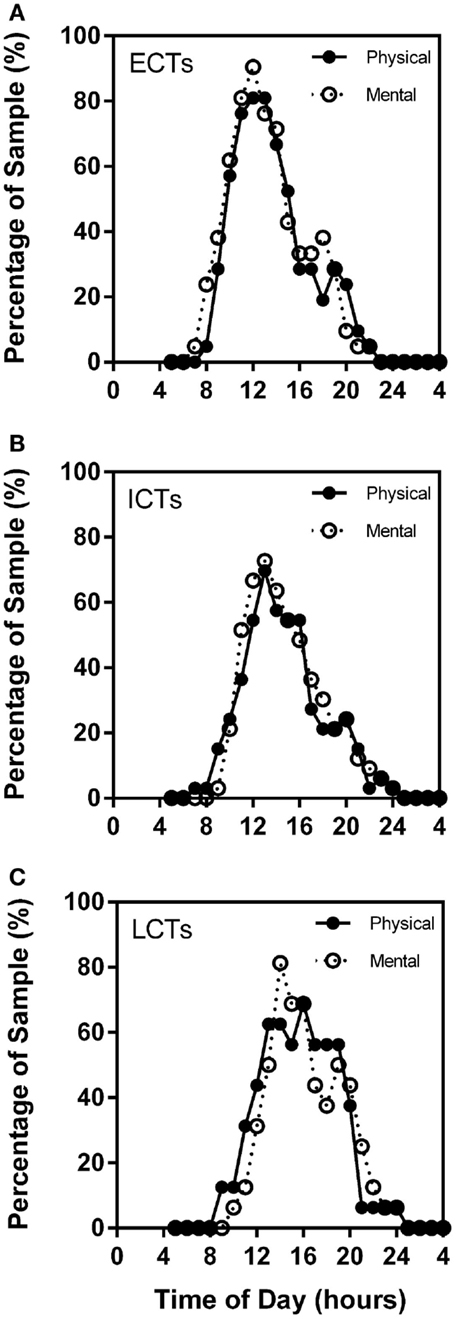
Figure 6. Subjective mental and physical performance are strongly linked. Frequency plots show both self-reported high mental and physical performance depending on time of day. Subjective physical performance is shown by the solid black line and subjective mental performance by the stippled line. X-axes = time of day in hours. Y-axes = percentage of total sample (%). (A) ECTs. (B) ICTs. (C) LCTs.
Discussion
A detailed understanding of factors contributing to performance is a major goal for researchers, coaches, and managers in the sports world and the corporate world. Advances in technology have allowed detailed analysis of physiological and cognitive performance variables, such as heart rate (39, 40), distance covered (41–43), direction of runs (44, 45), body temperature (46), maximal oxygen uptake (47), and cognitive abilities (23, 48–52). When exploring requirements for appropriate performance evaluation in teams, strategy, coordination, psychology, and skills have to be considered as well as comprehensive performance indicators, both at the level of the individual and the team (53, 54).
Tools for evaluating team performance incorporate both cognitive and behavioral processes that individuals invest toward similar or shared goals. It is important that when analyzing team performance, both individual and team goals are considered (55). To optimize team effectiveness and performance, there is a need to understand individual and team learning. Individuals’ perception of reality has been shown to be a predictor of performance, also known as mental models (56). If roles, goals, and tactics are similar between individuals then team mental models could predict team performance. In competing sports teams, optimal performance as a team with each team member delivering their personal best performance and playing an equally important role in achieving a common goal is a general principle. Very recently, Dijkstra et al. suggested a health management and coaching model for the optimization of performance (57). Comparable to other theoretical approaches to performance optimization, this model does not consider individual variations of sleep/wake rhythms, circadian rhythms of physiology, or the relevance of time of day in training efficiency (26, 27, 58, 59), while disruptions of circadian rhythmicity can lead to sleep disorders, cognitive impairments, and ultimately have impact on both individual and team performance (60, 61). For example, traveling across time zones can have detrimental effects on both physical and mental performance (62–64). There has been increasing research on using chronobiological knowledge to readjust circadian misalignment, thereby improving performance, mood, and quality of sleep (61).
Our simulation of competition at different times of day (Figure 3) revealed T10 as the physically strongest team in the morning and afternoon but weakest team in the evening, while T3 was the strongest team in the evening and weakest team in the morning and afternoon. These data suggest that teams with a large proportion of late types are disadvantaged in morning competitions, while teams with either large proportions of early types or large proportions of intermediate types are disadvantaged in evening competitions. The strong link between physical performance and perceived mental performance may further contribute to these diurnal performance variations (20, 21).
With this paper, we establish the importance of circadian phenotype and individual diurnal performance variation as considerable performance indicators in groups of individuals or teams. Our results show that both, predicted performance levels as well as peak performance times in the course of a day, are influenced by the circadian phenotype distribution within a team suggesting that it is the number of late circadian phenotypes that has the strongest influence on peak performance of a team in the course of a day. Age and gender, however, are only weak predictors of circadian phenotype despite a higher percentage of early circadian phenotypes found in females and an increasing percentage of early phenotypes with increasing age in males. This supports previous studies that have reported more ECTs in females and older age groups and more LCTs in males and younger age groups (65–67); other studies, however, suggested that morningness/eveningness preference is largely independent of gender, indicating that it is a stable characteristic that may be better explained by endogenous factors (68), and that sleep disturbances between different chronotypes were not influenced by age or gender (69). Consistent with these reports, age did not correlate with the differences in peak performances in our study, while all performance parameters differed significantly with circadian phenotype distribution within teams. In our study, age did not have an effect on performance in the course of a day.
Circadian phenotype distribution within a team is not related to age and is not predictable; this is supported by our results showing an exclusively male team with an average age of 17.23 years and an exclusively female team with average age 27.71 years showing highly similar circadian phenotype composition and, as a consequence, very similar performance curves regardless of the age and gender differences (Figure 2, T1 and T11).
Our model of predicted performance shows, for the first time, how varied team performance can be, both mental and physical, in the course of a day depending on the composition of circadian phenotypes with a 7-h difference in peak performance times between the teams studied. Our novel tools, including a chronometric test specifically designed for the analysis of circadian phenotypes and performance analysis at different times of day, could help teams to have a “circadian advantage” over other teams due to detailed knowledge about peak performance and times and peak performance levels of individual team members and the team as a whole. The need to understand the biological clocks and to develop new strategies and techniques to enhance performance taking into account circadian influences has been shown in various studies (70–74). Knowledge into team compositions of circadian phenotypes could allow better preparation for demanding tasks, competitions for athletes, adjustment of work or training schedules, and more effective people management. For example, a selection of a higher number of players of the late circadian phenotype for evening matches, such as Champions league matches in football, could shift peak team performance to a later time of day and enhance team performance. Thus, knowledge about circadian phenotype has the potential to become one of the important criteria for team member recruitment depending on routines and schedules with afternoon tasks benefiting from a higher number of early and intermediate circadian phenotypes and evening tasks benefiting from a higher number of late circadian phenotypes. For the evaluation of team performance to be efficient, a considerable number of factors need to be taken into consideration, including team structure (75), individual and team goals (55, 76), individual and team mental models (56), feedback and reflection (77), motivation (78) as well as an understanding behind physical fitness (19), cognitive abilities (13, 14, 23, 24), and health (61, 79, 80). With this study, we provide new insight into the analysis and interpretation of team performance by introducing circadian phenotype as a relevant team performance indicator.
Conflict of Interest Statement
The authors declare that the research was conducted in the absence of any commercial or financial relationships that could be construed as a potential conflict of interest.
Funding
This study was carried out as a MIBTP PhD mini-project supported by the Biotechnology and Biological Sciences Research Council (BBSRC), grant number BB/J014532/1.
Acknowledgments
RB developed the chronometric test, the model to predict team performance as a function of individual performance variation, and designed the study. EF-C collected the data (hockey) with assistance from Emily Slater (football), which is gratefully acknowledged. EF-C and RB completed the analysis and wrote the paper. Our sincere thanks are due to all participating athletes/teams.
Supplementary Material
The Supplementary Material for this article can be found online at http://journal.frontiersin.org/article/10.3389/fneur.2015.00208
References
1. Ericsson KA, Lehmann AC. Expert and exceptional performance: evidence of maximal adaptation to task constraints. Annu Rev Psychol (1996) 47:273–305. doi: 10.1146/annurev.psych.47.1.273
2. Gelade GA, Ivery M. The impact of human resource management and work climate on organizational performance. Pers Psychol (2003) 56(2):383–404. doi:10.1111/j.1744-6570.2003.tb00155.x
3. Hunter JE. Validity and utility of alternative predictors of job performance. In: Hunter RF, editor. Psychological Bulletin. Michigan State: American Psychological Association (APA). (1984). p. 72–98. doi:10.1037/0033-2909.96.1.72
4. Alderman RB. Influence of local fatigue on speed and accuracy in motor learning. Res Q (1965) 36:131–40.
5. Bender VL, McGlynn GH. The effect of various levels of strenuous to exhaustive exercise on reaction time. Eur J Appl Physiol Occup Physiol (1976) 35(2):95–101. doi:10.1007/BF02333799
6. Hart ME, Shay CT. Relationship between physical fitness and academic success. Res Q (1964) 35(Suppl):443–5.
7. Hammerton M, Tickner AH. Physical fitness and skilled work after exercise. Ergonomics (1968) 11(1):41–5. doi:10.1080/00140136808930932
8. Heyn P, Abreu BC, Ottenbacher KJ. The effects of exercise training on elderly persons with cognitive impairment and dementia: a meta-analysis. Arch Phys Med Rehabil (2004) 85(10):1694–704. doi:10.1016/j.apmr.2004.03.019
9. McAdam RE, Wang YK. Performance of a simple mental task following various treatments. Res Q (1967) 38(2):208–12.
10. Weingarten G. Mental performance during physical exertion: the benefit of being physically fit. Int J Sport Psychol (1973) 4(1):16–26.
11. Gutin B. Effect of increase in physical fitness on mental ability following physical and mental stress. Res Q (1966) 37(2):211–20.
12. Brisswalter J, Collardeau M, Arcelin R. Effects of acute physical exercise characteristics on cognitive performance. Sports Med (2002) 32(9):555–66. doi:10.2165/00007256-200232090-00002
13. Tomporowski PD. Effects of acute bouts of exercise on cognition. Acta Psychol (2003) 112(3):297–324. doi:10.1016/S0001-6918(02)00134-8
14. Coles K, Tomporowski PD. Effects of acute exercise on executive processing, short-term and long-term memory. J Sports Sci (2008) 26(3):333–44. doi:10.1080/02640410701591417
15. Davey CP. Physical exertion and mental performance. Ergonomics (1973) 16(5):595–9. doi:10.1080/00140137308924550
16. Tomporowski PD, Ellis NR, Stephens R. The immediate effects of strenuous exercise on free-recall memory. Ergonomics (1987) 30(1):121–9. doi:10.1080/00140138708969682
17. Labban JD, Etnier JL. Effects of acute exercise on long-term memory. Res Q Exerc Sport (2011) 82(4):712–21. doi:10.1080/02701367.2011.10599808
18. Stroth S, Hille K, Spitzer M, Reinhardt R. Aerobic endurance exercise benefits memory and affect in young adults. Neuropsychol Rehabil (2009) 19(2):223–43. doi:10.1080/09602010802091183
19. Sjoberg H. Physical fitness and mental performance during and after work. Ergonomics (1980) 23(10):977–85. doi:10.1080/00140138008924807
20. Marcora SM, Staiano W, Manning V. Mental fatigue impairs physical performance in humans. J Appl Physiol (2009) 106(3):857–64. doi:10.1152/japplphysiol.91324.2008
21. Marcora SM. Do we really need a central governor to explain brain regulation of exercise performance? Eur J Appl Physiol (2008) 104(5):929–31. doi:10.1007/s00421-008-0818-3
23. Goel N, Basner M, Rao HY, Dinges DF. Circadian rhythms, sleep deprivation, and human performance. Prog Mol Biol Transl (2013) 119:155–90. doi:10.1016/B978-0-12-396971-2.00007-5
24. McCauley P, Kalachev LV, Mollicone DJ, Banks S, Dinges DF, Van Dongen HPA. Dynamic circadian modulation in a biomathematical model for the effects of sleep and sleep loss on waking neurobehavioral performance. Sleep (2013) 36(12):1987–97. doi:10.5665/sleep.3246
25. Facer-Childs E, Brandstaetter R. The impact of circadian phenotype and time since awakening on diurnal performance in athletes. Curr Biol (2015) 25(4):518–22. doi:10.1016/j.cub.2014.12.036
26. Atkinson G, Jones H, Ainslie PN. Circadian variation in the circulatory responses to exercise: relevance to the morning peaks in strokes and cardiac events. Eur J Appl Physiol (2010) 108(1):15–29. doi:10.1007/s00421-009-1243-y
27. Chtourou H, Souissi N. The effect of training at a specific time of day: a review. J Strength Cond Res (2012) 26(7):1984–2005. doi:10.1519/JSC.0b013e31825770a7
28. Reilly T, Atkinson G, Waterhouse JM. Biological Rhythms and Exercise. Oxford, New York: Oxford University Press (1996). 162 p.
29. Schwartz PJ, Rosenthal NE, Turner EH, Drake CL, Liberty V, Wehr TA. Seasonal variation in core temperature regulation during sleep in patients with winter seasonal affective disorder. Biol Psychiatry (1997) 42(2):122–31. doi:10.1016/S0006-3223(96)00332-0
30. Wever RA. Influence of physical workload on freerunning circadian rhythms of man. Pflugers Arch (1979) 381(2):119–26. doi:10.1007/BF00582342
31. Brandstaetter R. Circadian lessons from peripheral clocks: is the time of the mammalian pacemaker up? Proc Natl Acad Sci U S A (2004) 101(16):5699–700. doi:10.1073/pnas.0401378101
32. Mistlberger RE, de Groot MH, Bossert JM, Marchant EG. Discrimination of circadian phase in intact and suprachiasmatic nuclei-ablated rats. Brain Res (1996) 739(1–2):12–8. doi:10.1016/S0006-8993(96)00466-0
33. Weber F. Remodeling the clock: coactivators and signal transduction in the circadian clockworks. Naturwissenschaften (2009) 96(3):321–37. doi:10.1007/s00114-008-0474-9
34. Oishi K. [Clock genes and clock-controlled genes in mammals]. Nihon Rinsho (2012) 70(7):1109–14.
35. Horne JA, Ostberg O. A self-assessment questionnaire to determine morningness-eveningness in human circadian rhythms. Int J Chronobiol (1976) 4(2):97–110.
36. Roenneberg T, Wirz-Justice A, Merrow M. Life between clocks: daily temporal patterns of human chronotypes. J Biol Rhythms (2003) 18(1):80–90. doi:10.1177/0748730402239679
38. Allebrandt KV, Roenneberg T. The search for circadian clock components in humans: new perspectives for association studies. Braz J Med Biol Res (2008) 41(8):716–21. doi:10.1590/S0100-879X2008000800013
39. Escobar GA, Eliason JL, Hurie J, Arya S, Rectenwald JE, Coleman DM. Rifampin soaking dacron-based endografts for implantation in infected aortic aneurysms-new application of a time-tested principle. Ann Vasc Surg (2014) 28(3):744–8. doi:10.1016/j.avsg.2013.10.006
40. Ingebrigtsen J, Bendiksen M, Randers MB, Castagna C, Krustrup P, Holtermann A. Yo-Yo IR2 testing of elite and sub-elite soccer players: performance, heart rate response and correlations to other interval tests. J Sports Sci (2012) 30(13):1337–45. doi:10.1080/02640414.2012.711484
41. Di Salvo V, Benito PJ, Calderón FJ, Di Salvo M, Pigozzi F. Activity profile of elite goalkeepers during football match-play. J Sports Med Phys Fitness (2008) 48(4):443–6.
42. Hartwig T, Naughton G, Searl J. Motion analyses of adolescent rugby union players: linking training and game demands among under 16 players. J Sci Med Sport (2006) 9(Suppl):16. doi:10.1016/j.jsams.2006.12.034
43. Suarez-Arrones L, Nuñez FJ, Portillo J, Mendez-Villanueva A. Match running performance and exercise intensity in elite female Rugby Sevens. J Strength Cond Res (2012) 26(7):1858–62. doi:10.1519/JSC.0b013e318238ea3e
44. Gray AJ, Jenkins DG. Match analysis and the physiological demands of Australian football. Sports Med (2010) 40(4):347–60. doi:10.2165/11531400-000000000-00000
45. Fonseca S, Milho J, Travassos B, Araújo D. Spatial dynamics of team sports exposed by Voronoi diagrams. Hum Mov Sci (2012) 31(6):1652–9. doi:10.1016/j.humov.2012.04.006
46. Bandelow S, Maughan R, Shirreffs S, Ozgünen K, Kurdak S, Ersöz G, et al. The effects of exercise, heat, cooling and rehydration strategies on cognitive function in football players. Scand J Med Sci Sports (2010) 20(Suppl 3):148–60. doi:10.1111/j.1600-0838.2010.01220.x
47. Buglione A, Lazzer S, Colli R, Introini E, Di Prampero PE. Energetics of best performances in elite kayakers and canoeists. Med Sci Sports Exerc (2011) 43(5):877–84. doi:10.1249/MSS.0b013e3181fdfdb7
48. Gaggioni G, Maquet P, Schmidt C, Dijk DJ, Vandewalle G. Neuroimaging, cognition, light and circadian rhythms. Front Syst Neurosci (2014) 8:126. doi:10.3389/fnsys.2014.00126
49. Lara T, Madrid JA, Correa A. The vigilance decrement in executive function is attenuated when individual chronotypes perform at their optimal time of day. PLoS One (2014) 9(2):e88820. doi:10.1371/journal.pone.0088820
50. Ficca G, Axelsson J, Mollicone DJ, Muto V, Vitiello MV. Naps, cognition and performance. Sleep Med Rev (2010) 14(4):249–58. doi:10.1016/j.smrv.2009.09.005
51. Schmidt C, Collette F, Leclercq Y, Sterpenich V, Vandewalle G, Berthomier P, et al. Homeostatic sleep pressure and responses to sustained attention in the suprachiasmatic area. Science (2009) 324(5926):516–9. doi:10.1126/science.1167337
52. Schmidt C, Peigneux P, Leclercq Y, Sterpenich V, Vandewalle G, Phillips C, et al. Circadian preference modulates the neural substrate of conflict processing across the day. PLoS One (2012) 7(1):e29658. doi:10.1371/journal.pone.0029658
53. Grehaigne J, Godbout P, Bouthier D. Performance assessment in team sports. J Teach Phys Educ (1997) 16(4):500–16.
54. Hughes M, Bartlett R. The use of performance indicators in performance analysis. J Sports Sci (2002) 20(10):739–54. doi:10.1080/026404102320675602
55. DeShon RP, Kozlowski SWJ, Schmidt AM, Milner KR, Wiechmann D. A multiple-goal, multilevel model of feedback effects on the regulation of individual and team performance. J Appl Psychol (2004) 89(6):1035–56. doi:10.1037/0021-9010.89.6.1035
56. Lim BC, Klein KJ. Team mental models and team performance: a field study of the effects of team mental model similarity and accuracy. J Organ Behav (2006) 27(4):403–18. doi:10.1037/a0025148
57. Dijkstra HP, Pollock N, Chakraverty R, Alonso JM. Managing the health of the elite athlete: a new integrated performance health management and coaching model. Br J Sports Med (2014) 48(7):523–31. doi:10.1136/bjsports-2013-093222
58. Callard D, Davenne D, Gauthier A, Lagarde D, Van Hoecke J. Circadian rhythms in human muscular efficiency: continuous physical exercise versus continuous rest. A crossover study. Chronobiol Int (2000) 17(5):693–704. doi:10.1081/CBI-100101075
59. Souissi N, Gauthier A, Sesboüé B, Larue J, Davenne D. Effects of regular training at the same time of day on diurnal fluctuations in muscular performance. J Sports Sci (2002) 20(11):929–37. doi:10.1080/026404102320761813
60. Caldwell JA, Mallis MM, Caldwell JL, Paul MA, Miller JC, Neri DF, et al. Fatigue countermeasures in aviation. Aviat Space Environ Med (2009) 80(1):29–59. doi:10.3357/ASEM.2435.2009
61. Munch M, Bromundt V. Light and chronobiology: implications for health and disease. Dialogues Clin Neurosci (2012) 14(4):448–53.
62. Kolla BP, Auger RR. Jet lag and shift work sleep disorders: how to help reset the internal clock. Cleve Clin J Med (2011) 78(10):675–84. doi:10.3949/ccjm.78a.10083
63. Samuels CH. Jet lag and travel fatigue: a comprehensive management plan for sport medicine physicians and high-performance support teams. Clin J Sport Med (2012) 22(3):268–73. doi:10.1097/JSM.0b013e31824d2eeb
64. Waterhouse J, Edwards B, Nevill A, Carvalho S, Atkinson G, Buckley P, et al. Identifying some determinants of “jet lag” and its symptoms: a study of athletes and other travellers. Br J Sports Med (2002) 36(1):54–60. doi:10.1136/bjsm.36.1.54
65. Carciofo R, Du F, Song N, Qi Y, Zhang K. Age-related chronotype differences in Chinese, and reliability assessment of a reduced version of the Chinese Morningness-Eveningness Questionnaire. Sleep Biol Rhythms (2012) 10(4):310–8. doi:10.1111/j.1479-8425.2012.00577.x
66. Park Y, Matsumoto K, Seo Y, Shinkoda H, Park K. Sleep in relation to age, sex, and chronotype in Japanese workers. Percept Mot Skills (1998) 87(1):199–215. doi:10.2466/pms.1998.87.1.199
67. Seo Y, Matsumoto K, Park Y, Shinkoda H, Noh T. The relationship between sleep and shift system, age and chronotype in shift workers. Biol Rhythm Res (2000) 31(5):559–79. doi:10.1076/brhm.31.5.559.5655
68. Broms U, Pitkaniemi J, Backmand H, Heikkila K, Koskenvuo M, Peltonen M, et al. Long-term consistency of diurnal-type preferences among men. Chronobiol Int (2014) 31(2):182–8. doi:10.3109/07420528.2013.836534
69. Merikanto I, Kronholm E, Peltonen M, Laatikainen T, Lahti T, Partonen T. Relation of chronotype to sleep complaints in the general Finnish population. Chronobiol Int (2012) 29(3):311–7. doi:10.3109/07420528.2012.655870
70. Winter WC, Hammond WR, Green NH, Zhang Z, Bliwise DL. Measuring circadian advantage in Major League Baseball: a 10-year retrospective study. Int J Sports Physiol Perform (2009) 4(3):394–401.
71. Jowett A, Steinweg J. Leave no stone unturned: body clock manipulation and other strategies in the Socceroos’ World Cup qualification for Germany 2006. J Sci Med Sport (2006) 9(Suppl):16. doi:10.1016/j.jsams.2006.12.035
72. Filaire E, Bernain X, Sagnol M, Lac G. Preliminary results on mood state, salivary testosterone:cortisol ratio and team performance in a professional soccer team. Eur J Appl Physiol (2001) 86(2):179–84. doi:10.1007/s004210100512
73. Hammouda O, Chtourou H, Chaouachi A, Chahed H, Bellimem H, Chamari K, et al. Time-of-day effects on biochemical responses to soccer-specific endurance in elite Tunisian football players. J Sports Sci (2013) 31(9):963–71. doi:10.1080/02640414.2012.757345
74. Smith RS, Efron B, Mah CD, Malhotra A. The impact of circadian misalignment on athletic performance in professional football players. Sleep (2013) 36(12):1999–2001. doi:10.5665/sleep.3248
75. Stewart GL, Barrick MR. Team structure and performance: assessing the mediating role of intrateam process and the moderating role of task type. Acad Manage J (2000) 43(2):135–48. doi:10.2307/1556372
76. Weaver SJ, Dy SM, Rosen MA. Team-training in healthcare: a narrative synthesis of the literature. BMJ Qual Saf (2014) 23(5):359–72. doi:10.1136/bmjqs-2013-001848
77. Francis J, Jones G. Elite rugby union players perceptions of performance analysis. Int J Perform Anal Sport (2014) 14(1):188–207. doi:10.1080/02640410701790787
78. Barth JL, Holding DH, Stamford BA. Risk versus effort in assessment of motor fatigue. J Motor Behav (1976) 8(3):189–94. doi:10.1080/00222895.1976.10735071
79. Matchock RL, Mordkoff JT. Effects of sleep stage and sleep episode length on the alerting, orienting, and conflict components of attention. Exp Brain Res (2014) 232(3):811–20. doi:10.1007/s00221-013-3790-z
Keywords: circadian, physical, mental, performance, sleep
Citation: Facer-Childs E and Brandstaetter R (2015) Circadian phenotype composition is a major predictor of diurnal physical performance in teams. Front. Neurol. 6:208. doi: 10.3389/fneur.2015.00208
Received: 14 July 2015; Accepted: 11 September 2015;
Published: 01 October 2015
Edited by:
Ralph E. Mistlberger, Simon Fraser University, CanadaReviewed by:
Monica M. C. Gonzalez, Instituto Ferrero de Neurologia y Sueno (IFN), ArgentinaTimo Partonen, National Institute for Health and Welfare, Finland
Copyright: © 2015 Facer-Childs and Brandstaetter. This is an open-access article distributed under the terms of the Creative Commons Attribution License (CC BY). The use, distribution or reproduction in other forums is permitted, provided the original author(s) or licensor are credited and that the original publication in this journal is cited, in accordance with accepted academic practice. No use, distribution or reproduction is permitted which does not comply with these terms.
*Correspondence: Roland Brandstaetter, School of Biosciences, University of Birmingham, B15 2TT Birmingham, UK, r.brandstaetter@bham.ac.uk