 Karishma Chhabria
 V. Srinivasa Chakravarthy
- Computational Biophysics and Neurosciences Laboratory, Department of Biotechnology, Bhupat and Jyoti Mehta School of Biosciences, Indian Institute of Technology Madras, Chennai, India
The motivation of developing simple minimal models for neuro-glio-vascular (NGV) system arises from a recent modeling study elucidating the bidirectional information flow within the NGV system having 89 dynamic equations (1). While this was one of the first attempts at formulating a comprehensive model for neuro-glio-vascular system, it poses severe restrictions in scaling up to network levels. On the contrary, low-dimensional models are convenient devices in simulating large networks that also provide an intuitive understanding of the complex interactions occurring within the NGV system. The key idea underlying the proposed models is to describe the glio-vascular system as a lumped system, which takes neural firing rate as input and returns an “energy” variable (analogous to ATP) as output. To this end, we present two models: biophysical neuro-energy (Model 1 with five variables), comprising KATP channel activity governed by neuronal ATP dynamics, and the dynamic threshold (Model 2 with three variables), depicting the dependence of neural firing threshold on the ATP dynamics. Both the models show different firing regimes, such as continuous spiking, phasic, and tonic bursting depending on the ATP production coefficient, ɛp, and external current. We then demonstrate that in a network comprising such energy-dependent neuron units, ɛp could modulate the local field potential (LFP) frequency and amplitude. Interestingly, low-frequency LFP dominates under low ɛp conditions, which is thought to be reminiscent of seizure-like activity observed in epilepsy. The proposed “neuron-energy” unit may be implemented in building models of NGV networks to simulate data obtained from multimodal neuroimaging systems, such as functional near infrared spectroscopy coupled to electroencephalogram and functional magnetic resonance imaging coupled to electroencephalogram. Such models could also provide a theoretical basis for devising optimal neurorehabilitation strategies, such as non-invasive brain stimulation for stroke patients.
1. Introduction
A key tenet of the contemporary neuroscience states that neurons constitute the primary units of brain’s information processing networks. However, there is growing evidence suggesting an imperative role of the “other brain” in sustaining the brain’s physiological activity (2–4). This other brain comprises the glial cells that occupy around half of the brain’s volume, though the exact numbers and neuron/glia ratio vary across the brain (5–8). Developments in glial research over the last two decades reveal the immense and extensive contributions of this system to brain functions, such as neurotransmitter homeostasis, potassium siphoning, and shuttling the energy substrates across the blood–brain barrier among others (2, 9–18). Interestingly, glial cells also sense and modulate the synaptic activity (19, 20) in addition to the above-mentioned maintenance functions. There are significant studies speculating on the contributions of glial cells in brain’s computations (21, 22).
Neural activity is constantly sensed by a type of glial cells called the astrocytes, whose perisynaptic processes eavesdrop on ongoing neurotransmission events (23–25). The end-feet of astrocytes also wrap around the blood vessels, thereby forming the blood–brain barrier (26). This configuration is known to facilitate the transmission of “hunger signals” from the neurons to the cerebral blood vessels through the glial interface (27, 28). The possibility of reverse influence from the vessels to the neurons is generally neglected, though there are experimental grounds supporting the role of vasomotion in various diseases, such as diabetes, hypertension, and even Alzheimer’s disease (29, 30). Recent studies present substantial evidence supporting the role of glio-vascular dysfunction in cognitive impairments, such as epilepsy, neurodegenerative disorders, and migraine (31–33). Furthermore, some recent proposals postulate a role for the glio-vascular system in neural information processing (1, 34–36).
These significant developments in glial and cerebrovascular research indicate a need to incorporate both the glial and vascular systems in an expanded theory of brain’s computations. Hence, it seems pragmatic to investigate further the role of glial cells and the cerebral vasculature in information processing in the brain. Therefore, we hypothesize that the neural activity also has an obligate dependence on the spatiotemporal vascular dynamics governed by the astrocyte activity.
Chander and Chakravarthy (1) proposed a model of the neuro-glio-vascular (NGV) system, in which a single neuron interacts with a single astrocyte and single microvessel. The model is a detailed biophysical model consisting of 89 dynamic equations. In order to explore, using computational models, the possible role of NGV system as a fundamental unit in brain’s information processing, it is essential to develop network models of the NGV system. However, with a model that is significantly complex at single-unit level, it is difficult to scale up to the network level. Therefore, the main objective of the present study was to formulate simple models of the NGV system whose rationale is inspired by the behaviors observed in more complex models like that of Chander and Chakravarthy (1). Considering the serious challenges involved in systematically reducing an 89-dimensional system to a five-variable system, we begin with a simple five-variable biophysical neuron model that captures the dependence of neural firing on ATP. This five-variable biophysical model is constructed by modifying the neuron model of Ching et al. (37).
In an attempt to develop a more generic, low-dimensional model that shows the effects of varying energy (ATP) levels in a spiking neuron model as a function of vessel dynamics, we have developed two models (Figure 1). Our approach to development of the proposed simplified model of the NGV system is as follows: instead of treating the astrocyte and the vessels as independent, isolated entities, we represent the entire glial-vascular system as a single, lumped system, which represents a source of energy substrates for the neurons. Thus, the proposed system has two modules: a neuron module and an “energy” module. The output of the neuron module is its firing activity, which is sensed by the energy module. In turn, the energy module supplies “energy” to the neuron module to fuel its firing activity. Since the neuron module is characterized by the fast neural dynamics, it is considered the fast subsystem. The “energy” module, which represents the slower glial and vascular dynamics, is the slow subsystem. The energy module takes the firing activity output of the neuron module and releases energy in the form of ATP. It must be noted that the firing activity of the neuron has a dual impact on the ATP dynamics: on the one hand, neural firing activity leads to the consumption of ATP via the activity of Na+–K+ ATPase pump, while on the other hand, it acts as a trigger to induce the energy module to release more energy in the form of ATP (38). Based on this paradigm, we first present the two minimal models for NGV. The first minimal model (Model 1 with five dynamic variables) described in the present study is biophysical and elucidates the effect of intracellular [ATP] on the excitability of a mammalian cortical pyramidal neuron by modulating the KATP channel activity. The first model reproduces most of the dynamical behaviors (such as tonic spiking and tonic bursting) of the detailed model. We then propose that this regulatory effect of [ATP] changes the neuronal firing threshold and thereby governs its excitability. Accordingly, we propose the second model (Model 2 with three dynamic variables), which comprises a quadratic integrate-and-fire neuron with a dynamic threshold, governed by intracellular [ATP].
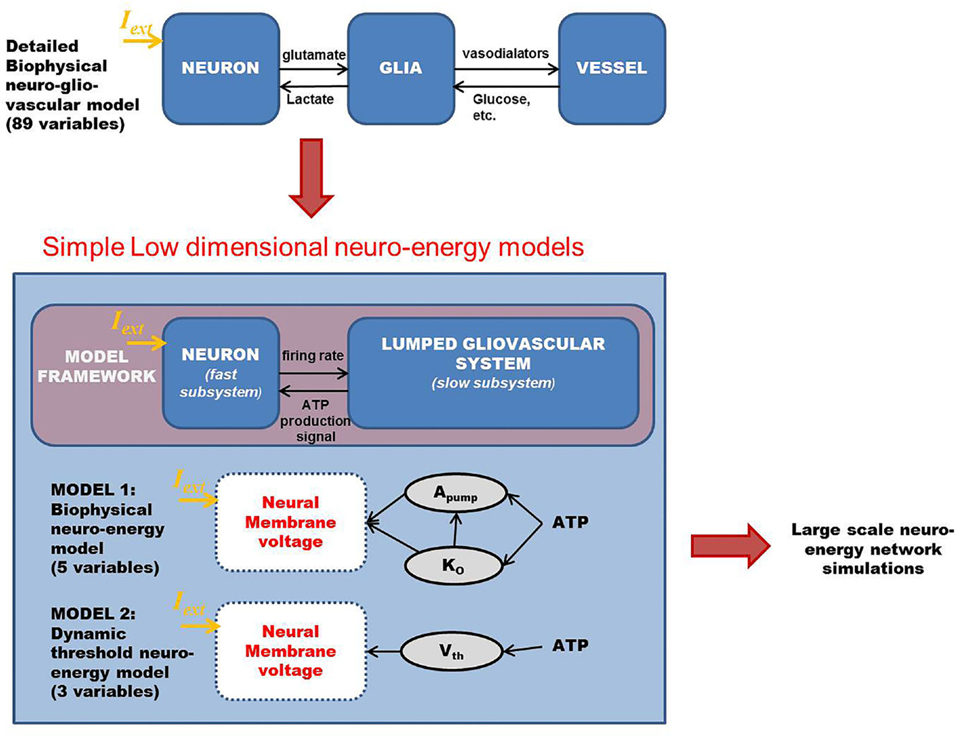
Figure 1. Schematic representation of the proposed modeling framework for the low-dimensional models of “neurovascular unit,” wherein the glio-vascular system is lumped into a single module. Model 1 is biophysical with neuronal ATP affecting the Na+–K+ ATPase pump activity (Apump) and extracellular potassium ion concentrations (Ko), which eventually governs the neuronal membrane potential. Model 2 is an abstract model with neuronal ATP modulating the firing threshold (Vth) of a quadratic integrate-and-fire model. Iext is the common key parameter across all the models and represents the external input current to the neuron (in microampere per square centimeter).
In both the models, ATP consumption directly depends on neural spiking activity. The production rate coefficient of ATP, ɛp, is a crucial parameter that is proposed to represent local vascular activity. Furthermore, the simpler Model 2 is calibrated against the biophysical Model 1 so as to obtain similar spiking rates. The neural dynamics in both the models expresses the same behaviors (tonic spiking, phasic bursting, and tonic bursting) for a similar range of control parameters: production rate coefficient of ATP, ɛp, and external input current, Iext.
We then describe a network model comprising one of the described “neuro-energy” models, followed by analyzing the model behavior under physiological and energy-starved conditions. This is done by calculating local field potentials (LFPs) and comparing the frequency spectrum for different values of control parameters.
2. Materials and Methods
The simple models proposed in this study are canonical and are formulated to study further the relation between firing patterns and intraneuronal ATP, as was observed in the detailed biophysical model (1). We begin with a five-variable biophysical model that instantiates the dependence of neural firing on ATP and closely relates to the model of Ching et al. (37). Model behavior is studied by varying two parameters: ɛp and Iext. The first parameter ɛp controls ATP production rate. Reduced values of parameter, ɛp, leads to slow-down in ATP production as, for example, in the case of a constricted vessel. The second key parameter of both the models is Iext, which represents the input current received by the neuron. The neurons activity is also critically governed by Iext such that below a threshold value of the current, the neuron does not spike at all as is the conventional approach to modeling biophysical neuron. In the models described in the following sections, we demonstrate the physiological range of these parameters, wherein the neuron shows continuous firing and the pathological range (especially ɛp), wherein the neuron enters burst firing modes.
2.1. Model 1: Biophysical Neuro-Energy Model
Model 1 is described by five dynamic variables with the neuron represented by two variables: membrane voltage, V, and Na+ channel gating variable, n [Eq. (1)]. The typical Hodgkin–Huxley-based mammalian cortical neuron model is reduced to two variables by assuming the gating variables m to be extremely fast and h to be slow. Such assumptions are regularly made to construct low-dimensional neuron models, for example, the FitzHugh–Nagumo model (39, 40). This makes m simply a function of voltage, V (Eq. 2) and h, a constant (Eq. 4). An important characteristic of the model is the additional KATP channel (41), which is an ATP-dependent potassium channel and forms a direct link between metabolism and neuronal activity. The schematic representation of the model is given in Figure 2.
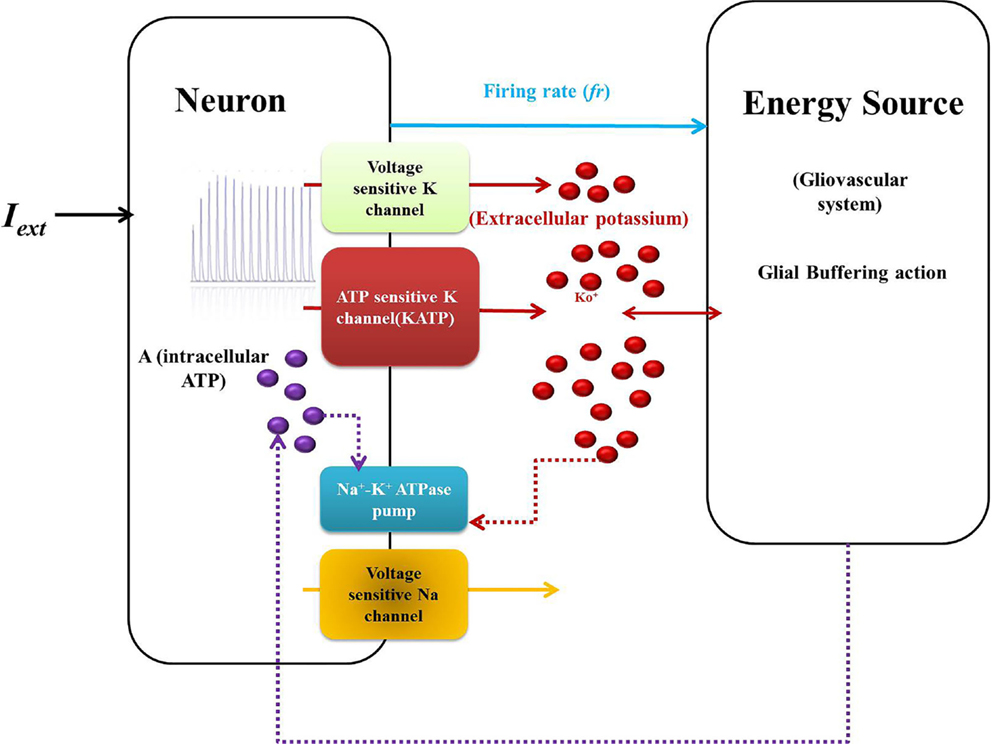
Figure 2. Schematic representation of Model 1: biophysical model: the neuron comprises the first compartment with the corresponding ion channels. The second compartment represents the glio-vascular system influencing the activity of the first via two mechanisms: (a) buffering of the Ko and (b) regulation of production rate of ATP (ɛp). The input to the glio-vascular system is the delayed firing rate signal from the neuron.
where
and
The corresponding forward and backward rate functions, αm(V), βm(V), αn(V), and βm(V), given by Eqs 5–8 (37). In addition, C is the membrane capacitance, gi and Ei are the maximal channel conductance and reversal potential, respectively, for the ith ion, and is the maximal channel conductance for the KATP channel gated by variable z given by Eq. 9, as implemented by Ching et al. (37).
where A is intracellular [ATP] and Iext is the continuous external current. The inverse relation of the gating variable, z, with the ATP, A, signifies the functionality of the KATP channels, depicting that the channels would be open under low ATP concentrations and closed at physiological ATP concentrations (37). The values and units of the variables are shown in Table 1.
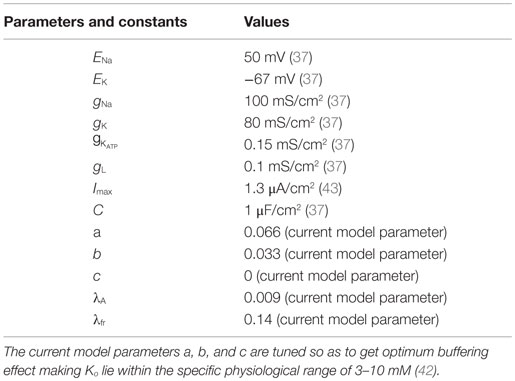
Table 1. Table for values of different parameters and constants used in the formulation of Model 1.
In addition, the Ko dynamics affect the membrane voltage through EK (in millivolts), which is given by the Nernst potential equation (Eq. 10).
where
where Ki and Ko are the intracellular and extracellular potassium ion concentrations, respectively. Ktot denotes the sum of intracellular and extracellular potassium ion concentrations, fixed at 133 mM for our simulations, assuming the intra- and extra-compartmental volumes to be the same (Eq. 12).
The Ko dynamics is given by summation of both inward and outward K+ currents along with a quadratic term: (Eq. 14), which denotes the extracellular potassium buffering activity of the glial cells around the neuron. The quadratic term is more appropriate compared to a linear term because at resting conditions, with a linear buffering term, Ko can reach 0 value in the absence of buffering, i.e., (which does not happen physiologically). On the contrary, the quadratic term ensures that Ko is always non-zero and maintained at the basal physiological value. The constants and other parameters are given in Table 1. Buffering is important as it does not allow Ko to go beyond a critical value. Studies have shown that Ko needs to be effectively buffered by spatial diffusion and/or glial activity (18). The buffering effect is due to the activity of various channels present on the membrane of glial cells, such as inward-rectifying potassium channels (Kir) and potassium pumps (Na–K and NKCC) (44–46). The activity/conductance of the channels and the pumps depend on the concentration of extracellular potassium (Ko). The conductance of a Kir channel is described by g = f(Ko)n, where n varies with the type of cell/neuron (47, 48) and the pump activity depends non-linearly on [Ko]. However, the combined buffering effect of the channels and the pumps, together, is not explicitly modeled. There are models for potassium buffering, though more detailed than ours, like that of Kager et al. (43), which assume the buffering capacity to be limited. On the other hand, we modeled the buffering term with no constraint on the upper limit of the buffering capacity in order to study the effect of “energy” on the neural excitability, in isolation. Thus, as a simple case, we assume the glial buffering term to be quadratic and encompassing all the effects resulting in decrease in extracellular potassium. The advantage of a quadratic buffering term is that it gives a stable fixed point at a finite value of [Ko], representing the stable value of [Ko] sustained by the buffering process. Further experiments are required to validate the buffering term, .
In general, buffering is important as in the absence of buffering, Ko accumulates, making the neuron hyperexcitable, a phenomenon observed in cases of epilepsy and spreading depression (49). Few experimental studies also attribute anomalies in Ca2+ activated K+ channels to the excessive accumulation of Ko (50). Thus, we speculate that the non-linear buffering term, , is generic and is representative of the multiple factors affecting the concentration of Ko.
where
and
where a, b, and c are buffering constants and πS is the “current density to concentration” conversion factor (1), whose values are given in Table 1. is outward potassium current (Eq. 16), is the inward potassium pump current (Eq. 17), and is the outward potassium current through the ATP-dependent potassium channel (Eq. 18). The various ion channel current equations are described by Eqs 16–18.
and
The activity of the Na+–K+ ATPase pump (Apump) is modeled by a combination of sigmoidal functions of the concentrations of ATP and Ko concentrations (Figure 3), assuming it to be independent of Na+ dynamics (Eq. 19). This is done so as to represent the significance of intracellular ATP and Ko in modulating the pump activity under pathological conditions (51). The formulation of Na+–K+ ATPase pump dynamics is similar to that implemented by Forrest et al. (52) with parameters adjusted for the current model.
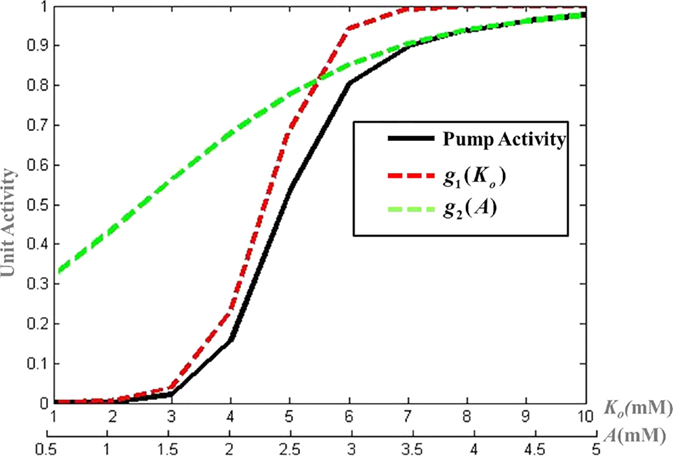
Figure 3. Modeled activity of Na+–K+ ATPase pump, where and g2(A) = 1 + e−μ(A − l) and λ, μ, k, and l are slope parameters tuned as per the model for mammalian cortical neuron.
where λ, μ, k, and l are slope parameters, A represents the intracellular ATP concentration and is given by Eq. 20 with τA as the time constant for the ATP dynamics. The steady state value of intracellular neuronal ATP is constrained to 2 mM as per the experimental observations (53). The model can be adapted to different neuronal types by changing the slope parameters for ATP and Ko in the Eq. 19.
where f, a quantity analogous to neural firing rate, is calculated according to Eq. 21. In Eq. 20, f controls ATP production via the proportionality constant ɛp, the production signal calculated by integration of the membrane voltage (Eq. 21). Furthermore, the consumption term is given by the activity of the Apump (Eq. 19). On the one hand, consumption being local (to the neuron) affects the membrane voltage on a faster time scale. On the other hand, the production signal influences the membrane voltage on a slower time scale, since it is an outcome of the activities within the glio-vascular system.
where λf is the damping coefficient, τp is the time constant of ATP production (signifying the delay arising through the processing of information in glio-vascular loop), and H(V) denotes a Heaviside function of membrane voltage, V.
The model shows different firing patterns by varying the Iext along with production coefficient, ɛp.
2.2. Model 2: Dynamic Threshold Neuro-Energy Model
In our quest to develop simple canonical models for NGV unit, we formulated the five-variable model described in Section 2.1, which depicts bursting behavior under energy-starved conditions. We then consider whether we could effectively replicate the behaviors of the previous model in a further simpler framework (Figure 4) and explore the plausible extent of abstraction, we now seek out a model that is simpler than that of Section 2.1, and reproduces the broad dynamic regimes and their transitions. The main intuitive idea behind the second model is that ATP controls the firing threshold of the neuron. The threshold is low for high ATP levels and increases under low ATP or energy-starved conditions (Figure 5). To this end, we construct the second model, which has three dynamic variables. This model comprises a quadratic integrate-and-fire neuron (Eq. 22), whose parameters are adjusted to obtain similar spike characteristics as that of the previous model (for a given Iext). The parameter and constants are listed in Table 2.

Figure 4. Schematic representation of Model 2: dynamic threshold model.
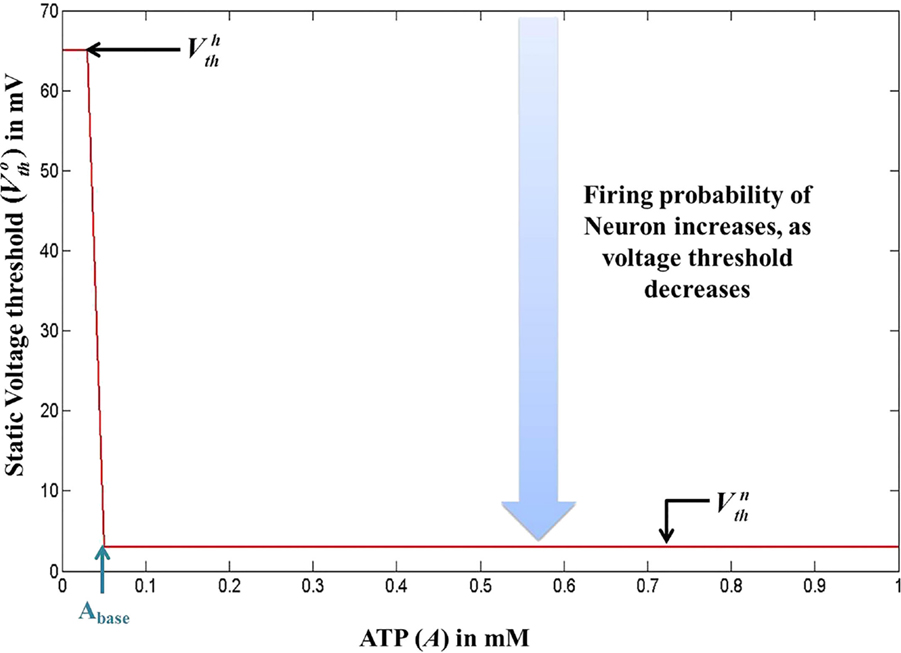
Figure 5. Modeled voltage threshold function dependent on intracellular ATP concentrations (millimolar). The switch from to occurs at .
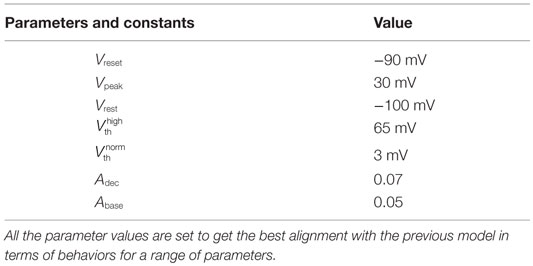
Table 2. Table for values of different parameters and constants used in the formulation of Model 2.
where V is the membrane voltage, Vrest is the resting membrane potential, set to −100 mV (analogous to Model 1), and Vth is the dynamic voltage threshold that is dependent on the ATP inside the cell, given by Eqs 23 and 24.
The voltage is reset back to Vreset = −90 mV, when it reached the peak value, Vpeak = 25 mV. The values of Vreset and Vpeak were set to specific values in order to align the firing rates of Model 2 with that of Model 1.
where is a function of ATP, denoted by A.
where is the basal of membrane voltage threshold, set to 3 mV for the present set of simulations, and H(V) is the Heaviside function of membrane voltage, V. Figure 5 shows the relationship between A and , wherein Vth takes a higher value (=65 mV) under low ATP conditions , and a lower value, (basal threshold = 3 mV) for higher A (>Abase). The ATP dynamics are modeled with a production term and a consumption term similar to that of Model 1. Here, the production term does not explicitly depend on the firing rate; instead, in the absence of firing activity, A approaches exponentially a maximal value of Amax, assumed to be the physiological ceiling level of ATP (53).
where τA is the time constant for ATP dynamics, Adec is the step decrease in A, whenever the cell spikes, and finally, ɛp is the production coefficient analogous to the one used in the previous model. The present model is simplified and shows qualitatively the same range of behaviors as that of the previous biophysical model by varying ɛp along with Iext.
2.3. Neuro-Energy-Based Network Model
The neuro-energy unit as described in Section 2.2 is then implemented to construct a network model of 1000 such units in order to study the effect of the control parameter/s on the emergent properties of the network. The network configuration is similar to that implemented in the earlier studies (37, 54) and is illustrated in Figure 6. It comprises 85% excitatory neurons and 15% inhibitory neurons (55). Unlike Ching et al. (37), the inhibitory neurons also have the intracellular ATP dynamics associated with their activity, which in turn controls their firing threshold.
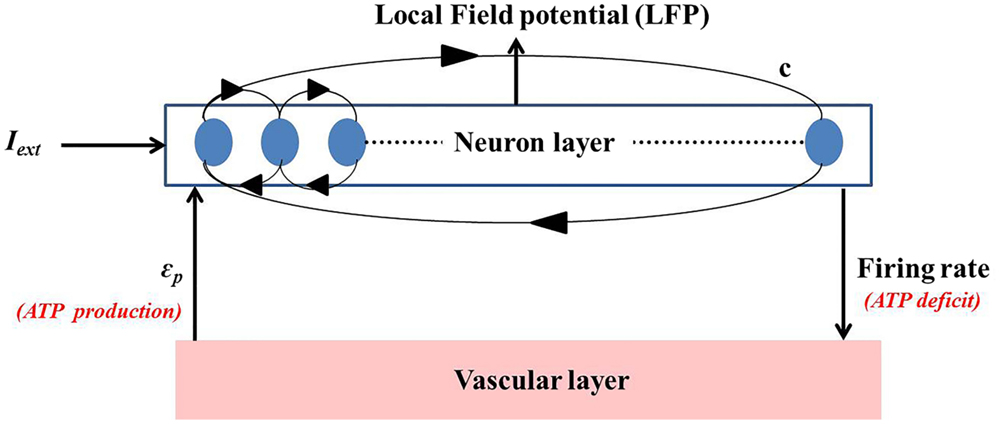
Figure 6. Simulated network representation: the neuron layer comprises 1000 neurons with 15% as fast spiking inhibitory interneurons. The activity of each neuron is coupled to the ATP dynamics. The connectivity between the neurons is random and sparse (c = 20%). ATP production rate for each neuron is governed by a production rate coefficient, ϵp, proposed to be representing vascular input parameter. Neuronal firing consumes ATP, creating a deficit which results in increase in the production of ATP, representing the vascular feedback.
The basic neuronal model for both excitatory and inhibitory neuron is the quadratic integrate-and-fire neuron, with the major difference in the time constants (τexcitatory = 2τinhibitory). This ensures faster dynamics of the inhibitory neurons, representative of the fast spiking inhibitory neurons in the cortex. In addition, the neurons in the network are connected through synapses modeled as alpha function (Eqs 26 and 27), with the synaptic parameters (Table 3) corresponding to that of cortical pyramidal and fast spiking inhibitory neurons similar to Cunningham et al. (56).

Table 3. Network parameters utilized for modeling the synaptic currents as adapted from Ching et al. (37).
where “i” represents the type of synapse (excitatory or inhibitory); EAMPA and EGABA are 0 and −80 mV, respectively. Synaptic currents, Isyn, are calculated from the integral of the presynaptic spike history δ(t − tsp), which can be obtained by using auxiliary variable, h, similar to Mazzoni et al. (54) with the damping constant, λ, tuned as per this model. The values for E and g are taken from Ching et al. (37), while the value for τ was tuned in a way so that τext = 0.5τin as the inhibitory synapse are at least twice as fast as excitatory synapses (37).
The corresponding gi values for both types of synapses are given in Table 3. Furthermore, to maintain a conservative biological realism in the model, the connectivity was chosen to be random and sparse with a 0.2 probability of directed connection between any pair of neurons, similar to Mazzoni et al. (54). For the described set of parameters, LFPs are calculated as sum of synaptic currents, averaged over the neurons in the network and is given by the following equation:
where N is the number of neurons in the network and each neuron receives input from C synapses (20% of the total number of synapses).
3. Simulation Results
Both the models show same set of behaviors for a similar range of parameters, Iext and ɛp. As ɛp corresponds to the vascular input to the neurons, we suggest that low ɛp would be representative of “energy deficient” condition in the neurons. Both the models show bursting (tonic/phasic) under low ɛp and moderate Iext conditions, thereby suggesting metabolic basis of bursting. We demonstrate this effect in Model 1, wherein low ɛp conditions result in activations of KATP channels and thus show bursting at some moderate values of Iext.
3.1. Model 1: Simulation Results
Model 1, with its biophysical framework, shows four major behaviors by varying ɛp and Iext: no firing, phasic bursting, tonic bursting, and continuous spiking. In addition, it also shows phasic spiking (a single spike followed by a pause of fixed duration) for some values of ɛp and Iext (traces not shown). Figures 7 and 8 illustrate the voltage dynamics and the corresponding ATP dynamics for the regimes mentioned above for Model 1. In addition to the voltage trace (black), the EK dynamics is also depicted in the both the figures (in green). For any value of ɛp and subthreshold Iext, the neuron tends to be in a no-firing state as in Figure 7A.1. The value of ɛp becomes significant for suprathreshold Iext. For example, for Iext >4 μA/cm2 and low values of ɛp, the model shows (phasic or tonic) bursting (Figures 7B.1 and 8C.1), whereas for higher values of ɛp, continuous spiking is observed (Figure 8D.1). The state as described in Figure 8D.1 is considered to be physiological state, wherein the cell is showing continuous activity for the given Iext value. On the contrary, the states described in Figures 7B.1 and 8C.1 could be considered as pathological states, wherein the neuron is unable to fire for a long time/continuously due to lesser availability of energy/ATP (low ɛp). The corresponding ATP dynamics (as in Figures 7A.2, B.2 and 8C.2, D.2) reveal fast and slow components in the sense that the ATP production is slower than its consumption. Particularly, in the case of continuous spiking, ATP increases slowly after the initial decrease, to stabilize at a value around 1.8 mM as shown in Figure 9. This state represents the physiological state as the demand of ATP is matched with the supply, maintaining a homeostatic [ATP] = 1.8 mM (53).
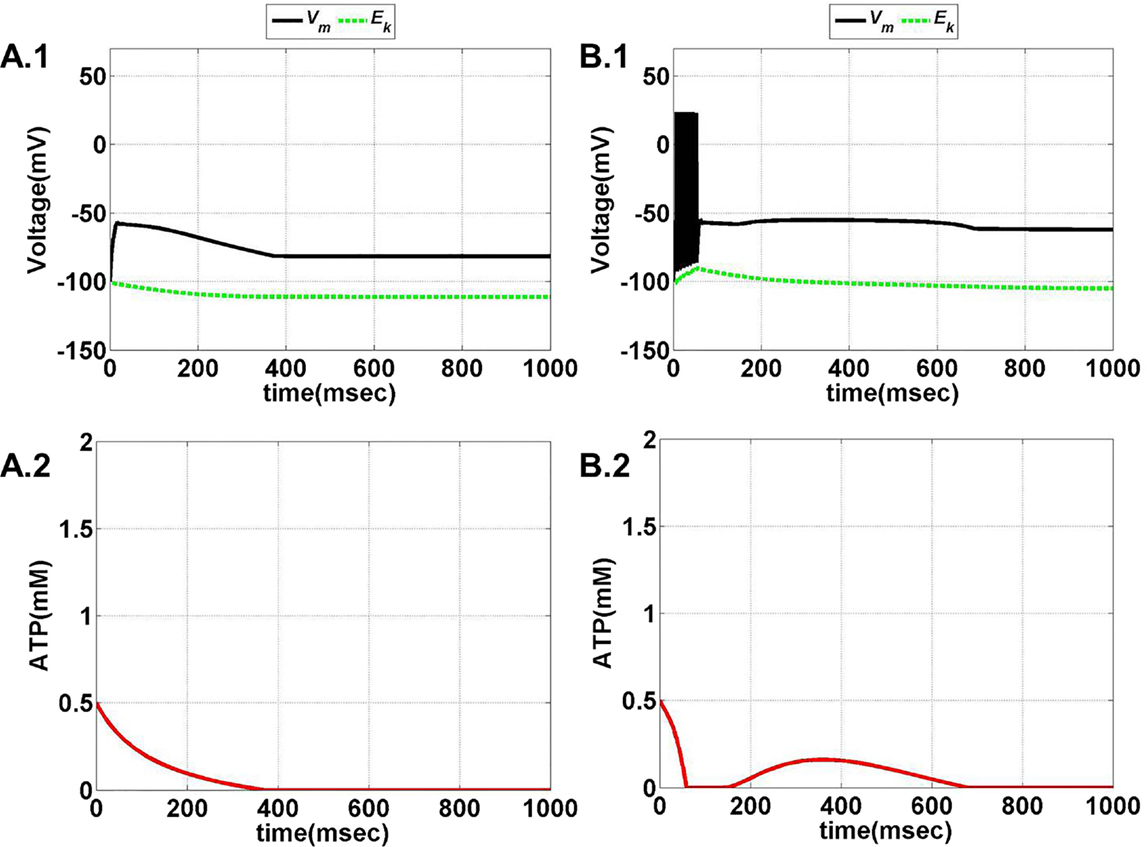
Figure 7. Model 1: the membrane voltage dynamics (A.1,B.1) are shown as black traces. The green trace represents the EK (Nernst potential for potassium) dynamics for no firing and phasic bursting, respectively. The corresponding ATP dynamics as in (A.2,B.2) for respective regimes are illustrated with continuous red lines (simulated for 1 s). (A) No spiking at Iext = 3 μA/cm2. Note that in this case, the value of ɛp affects the slope of the ATP dynamics, and not changing the overall behavior/regime. (B) Phasic bursting at ɛp = 0.8 and Iext = 7 μA/cm2. As can be observed from the ATP dynamics in (B.2), there is a slight rise in the [ATP], followed by complete silence, owing to low ɛp conditions.
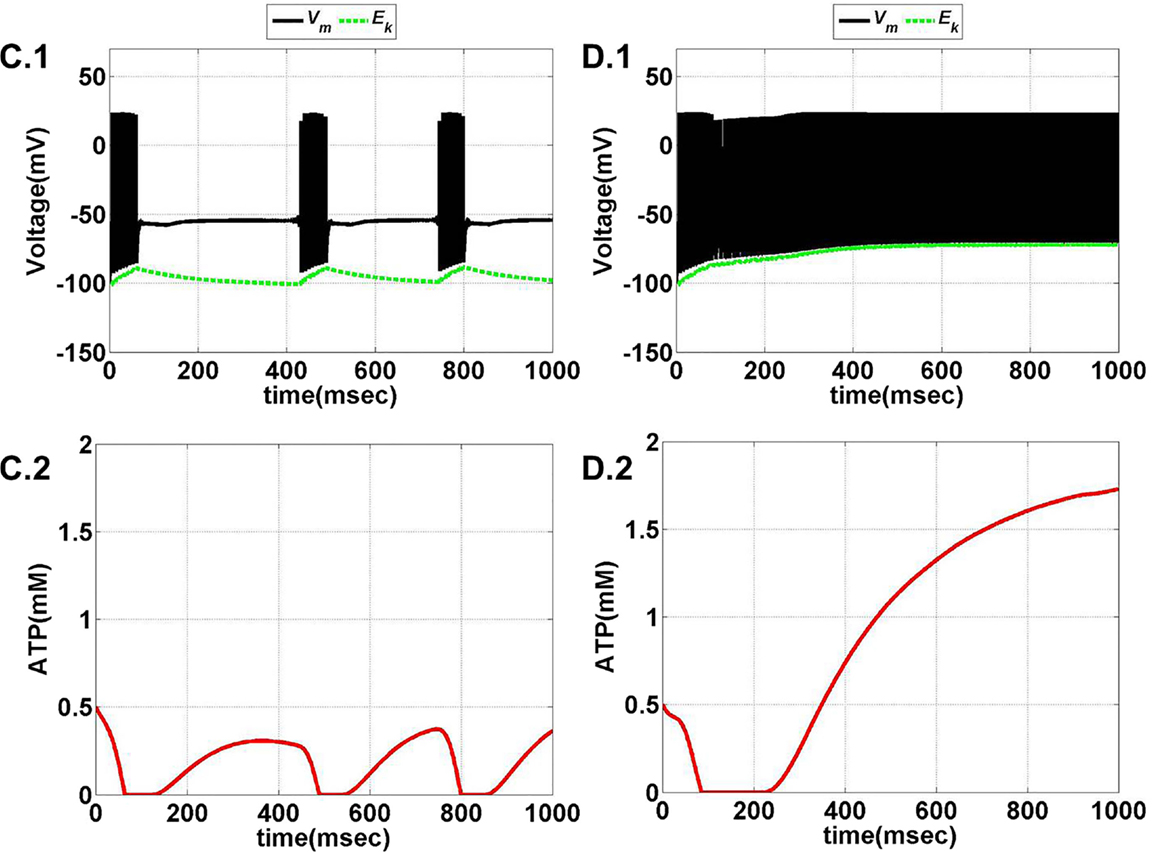
Figure 8. Model 1: the membrane voltage dynamics (C.1,D.1) are shown as black traces. The green trace represents the EK (Nernst potential for potassium) dynamics for no firing and phasic bursting, respectively. The corresponding ATP dynamics (C.2,D.2) for respective regimes are illustrated with continuous red lines (simulated for 1 s). The green trace is that of the EK dynamics, (C) tonic bursting at Iext = 7 μA/cm2 and ɛp = 1. The ATP dynamics [as in (C.2)] clearly demonstrate the effect of fast-slow subsystems, i.e., the production is slower than the consumption. Consequently, the uphill is more stretched across time as compared to the downhill. (D) Continuous spiking at ɛp = 2 and Iext = 7 μA/cm2. The initial dip in the ATP dynamics is characteristic of the fast local consumption; however, due to higher ɛp, the demand for ATP is sufficiently matched with the supply and the intraneuronal ATP then reach to a homeostatic physiological value (=1.8 mM).
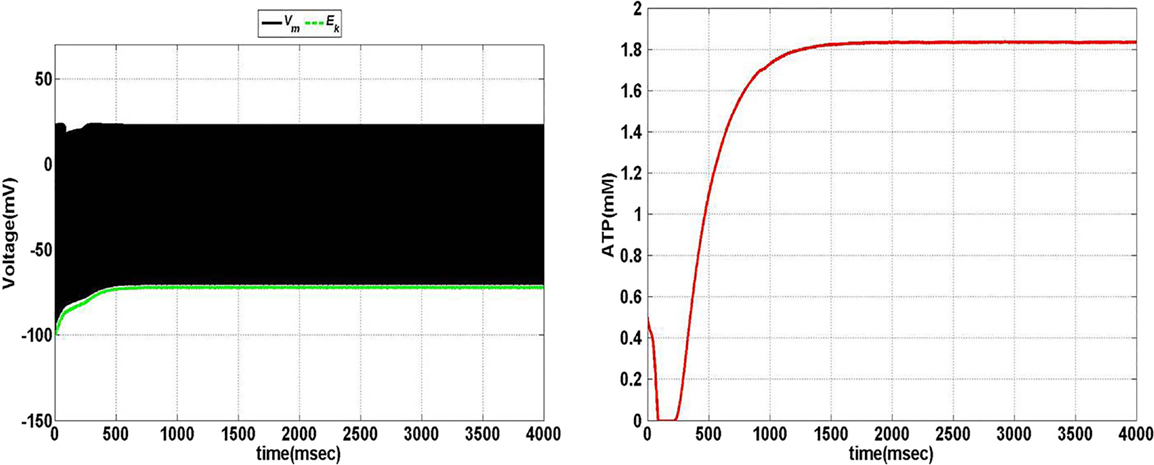
Figure 9. Model 1: the membrane voltage dynamics (left) with corresponding ATP dynamics (right) for corresponding regimes at Iext = 7 μA/cm2 and ɛp = 1.7 simulated for 4 s to show the stabilization of ATP over the time in case of continuous firing.
As mentioned before, in order to keep minimal variables in the model, we incorporated Ko in our model to emphasize the importance of Ko in pathological conditions. Interestingly, Ko was shown to be slowly accumulating during normal phase of firing (57), which is also demonstrated in the proposed model.
We further show that the transition from one behavior to another is smooth with an intermediate regime, which shows a mixture of dynamics characteristic of the adjacent two regimes. Specifically, with respect to Model 1, such a transition zone was seen between the tonic bursting and continuous spiking regimes. Figure 10 illustrates the map for Model 1 showing the gross regimes obtained by varying the two control parameters: ɛp and Iext.
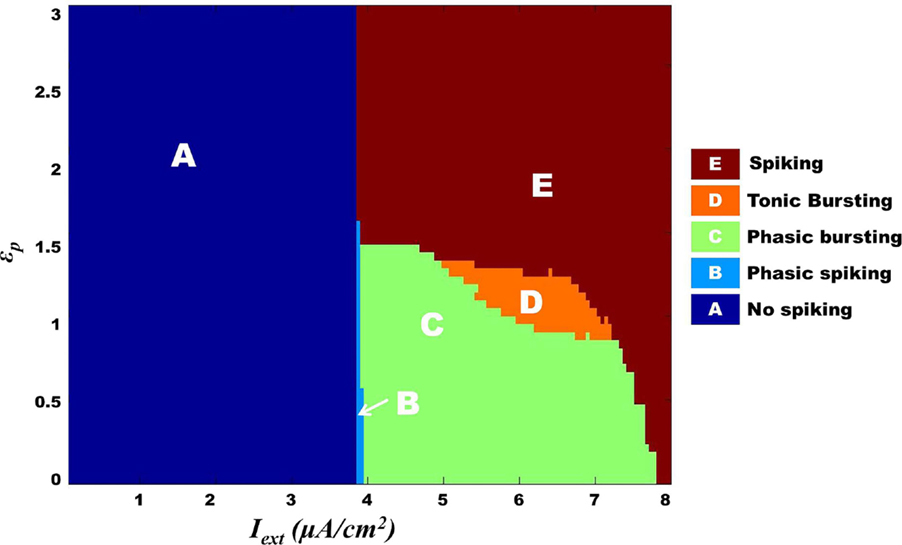
Figure 10. Model 1: complete map of different regimes obtained by varying ɛp and Iext simulated for 1 s. The vertical boundary between regime A and the other regimes depicts the threshold value of Iext. Bursting (tonic/phasic) is observed only under low ɛp conditions and medial above threshold Iext. The direct switch from no spiking to continuous spiking (A–E) is considered to be physiological. Note that the phasic spiking regime (regime B) is dependent on the initial conditions of membrane potential set to −100 mV [similar to Cunningham et al. (56) and Ching et al. (37)].
3.2. Model 2: Simulation Results
Model 2 is a lower dimensional model compared to Model 1. The decrease in ATP is modeled to be a step decrease and the production of ATP is similar to that modeled by Ching et al. (37). In addition, the production term is a slowly increasing term whose slope is governed by ɛp, which we propose to be analogous to the glio-vascular input.
The model is optimized such that variation of ɛp within the range of 0–5 displays all the behaviors observed in the previous model (Figures 11 and 12). Intuitively, the results suggest that there is a critical homeostatic balance between production and consumption of energy that has to be physiologically maintained by the coordinated activities of the three networks working in parallel: the neural, the glial, and the vascular network. The coordination is of great importance for generating complex spatiotemporal patterns of delivery of energy resources required for normal cerebral functioning.
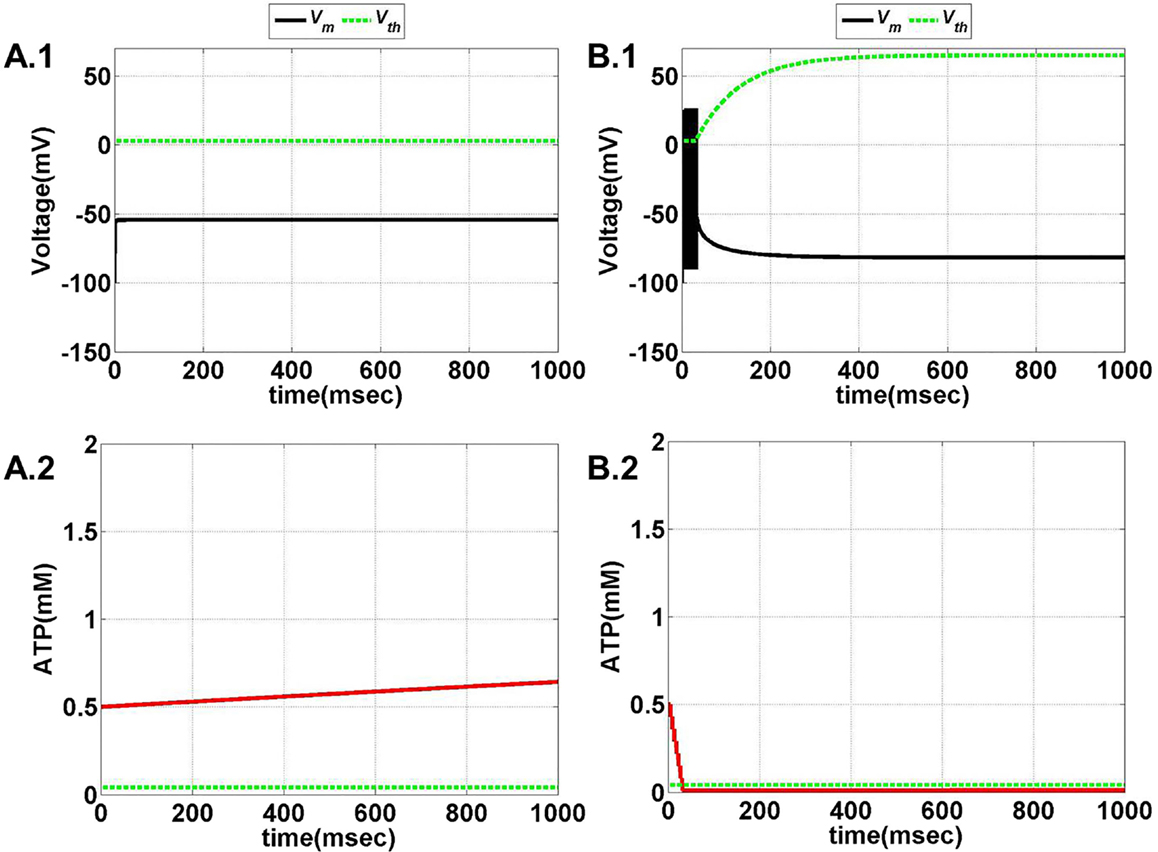
Figure 11. Model 2: the membrane voltage dynamics (A.1,B.1) are illustrated in the black traces and the voltage threshold, Vth in the dashed green traces. The corresponding ATP dynamics (A.2,B.2) for respective regimes are depicted by red traces with the dashed green trace representing the Abase (simulated for 1 s). The value of Abase is deterministic for the state of the neuron such that if A crosses Abase, the threshold is raised to the higher value and neuron ceases to fire [(B.1,B.2)]. (A) No spiking at Iext = 6 μA/cm2 for any value of ɛp. (B) Phasic bursting at ɛp = 0.001 and Iext = 7 μA/cm2. Here, the ɛp is very low to make the A cross the Abase, and thus, the neuron tends to be in the phasic bursting mode.

Figure 12. Model 2: the membrane voltage dynamics (C.1,D.1) are illustrated in the black traces and the voltage threshold, Vth in the dashed green traces. The corresponding ATP dynamics (C.2,D.2) for respective regimes are depicted by red traces with the dashed green trace representing the Abase (simulated for 1 s) and at Iext = 7 μA/cm2. (C) Tonic bursting at ɛp = 1, note that here the decrease in ATP is a step decrease, and hence, the downhill of ATP is not smooth as compared to Model 1. (D) Continuous spiking at ɛp = 50, wherein the ATP stabilizes at the physiological value of 1.8 mM (ATP oscillates around the baseline of 1.8 mM).
Model 2 captures the essence of the previous model and faithfully reproduces the same range of behaviors, such as continuous spiking, phasic, and tonic bursting, by varying ɛp and Iext as were observed in Model 1 (Figure 13). Figures 11 and 12 illustrate the various regimes and the corresponding ATP dynamics. The voltage threshold, Vth is also shown along with the membrane voltage traces (dashed green traces and black traces as in Figures 11A.1, B.1 and 12C.1, D.1, respectively). Correspondingly, the ATP traces are shown with the critical base ATP value (red traces and dashed green traces as in Figures 11A.2, B.2 and 12C.2, D.2). The characteristic transitions between the regimes (depending on the set of parameters) are analogous to Model 1. At subthreshold Iext, the neuron tends to be in a no-firing state (Figure 11A.1) and for suprathreshold Iext, the value of ɛp governs the firing pattern and physiological state of the neuron (Figures 11B.1 and 12C.1, D.1). However, the values of the parameters corresponding to different behaviors observed in the two models (Model 1 and Model 2) are not identical. One reason behind this could be the difference in the time scales of the two models, which were adjusted to align the two models. The values of the control parameters (Iext and ɛp) for which a range of behaviors is observed lack direct mapping to the physiological values, and thus, future experiments are required for validation.
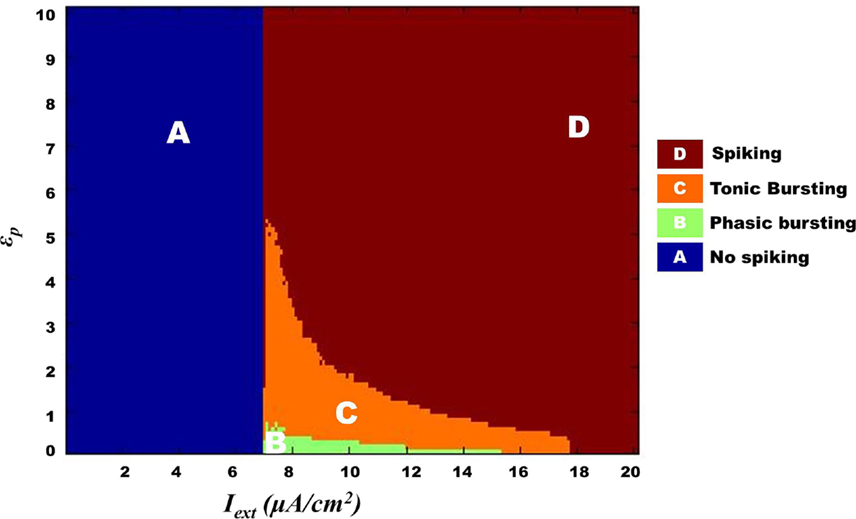
Figure 13. Complete map for Model 2 regimes obtained by varying ɛp and Iext simulated for 1 s. The regimes transitions in the map are qualitatively similar to that observed in Model 1 (Figure 10) such that bursting (tonic/phasic) prevails under low ɛp and medial above threshold Iext.
Compared to Model 1, Model 2 represents an important step toward an abstract model. While Model 1 relates energy to neural firing via KATP channel, Model 2 relates the two through a more abstract parameter viz., “firing threshold.” Furthermore, Model 2 also has fewer dynamic variables than Model 1.
3.3. Model Comparisons
The parameters of Model 2 were tuned as per Model 1 so that the firing rates and burst rates for a given set of parameters match with good approximation. The firing rate comparison in shown in Figure 14 (top), while the individual spike dynamics is also shown in Figure 14 (bottom right). In addition, the inter-burst frequency is also comparable (Figure 14, bottom left) for a specific range of Iext. However, with the variation in , the match between the burst frequencies of the two models worsens (Figure 14: top red bar charts) due to the presence of aperiodic bursting in Model 2 (absent in Model 1). Consequently, the mean inter- and intra-burst frequencies are variable across the range of control parameters (both and Iext). In general, the alignment between the models is consistent in terms of range of behaviors observed and their association with the control parameters.
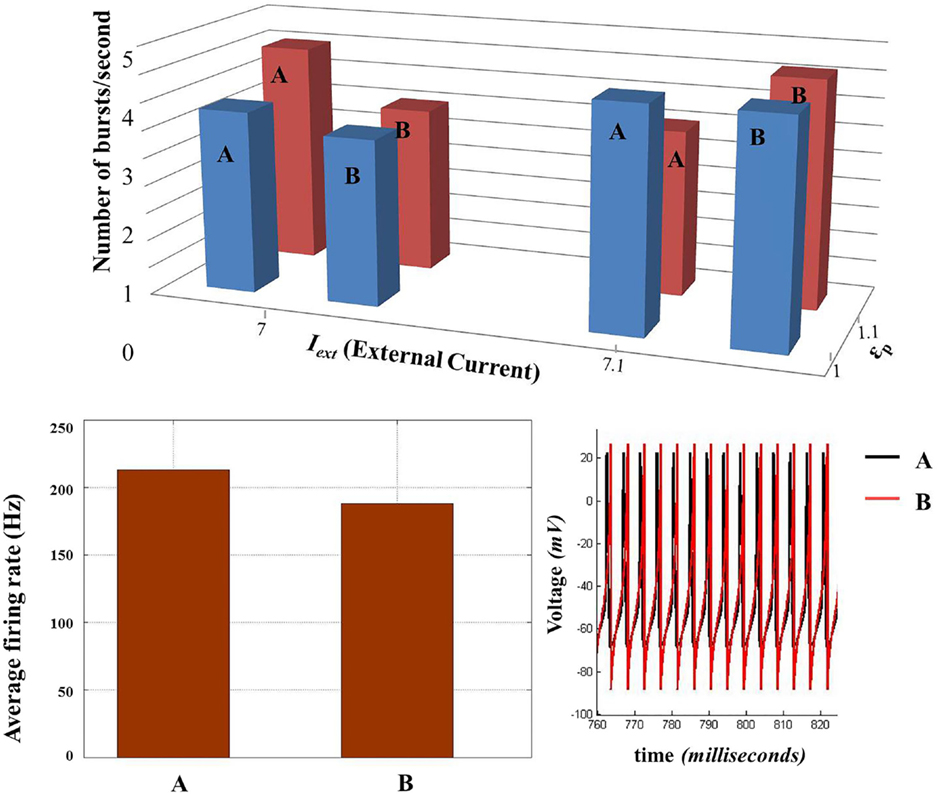
Figure 14. Comparison of biophysical model (Model 1) (A) with the threshold model (Model 2) (B). (Top) Comparison of inter-burst frequency (number of burst per second) between the two models across two sets of control parameters (Iext and ɛp). (Bottom left) Comparison of average firing rate at Iext = 8 and ɛp = 5. (Bottom right) The voltage traces of the two models compared. (Since the average firing rate and inter-burst frequency are slightly different, the traces do not match completely throughout the time of simulation and for all the parameter configurations.)
3.4. Network Simulation Results
The production rate of ATP described by ɛp effectively changes the neural dynamics. Low ɛp is thought to represent the “metabolically compromised” network state and depicts that lower frequencies LFP dominate. This is similar to that observed under propofol-anesthetic conditions [associated with reduced metabolism (58, 59)], which is characterized by decreased LFP power (60–62). We further show that a broader spectrum of LFPs is observed at high ɛp conditions as opposed to the low ɛp conditions, wherein a sharper spectrum is observed.
The network output is analyzed in terms of LFP, population responses of excitatory and fast spiking inhibitory neurons, and the mean ATP corresponding to each population and network.
Figure 15 illustrates the LFP patterns (Figure 15A.1–A.4) and mean ATP profiles for excitatory, inhibitory, and for the complete network, corresponding to various values of ɛp. As can be observed, the baseline for mean ATP for the inhibitory neuron population is lower than that of the excitatory population. We believe that this happens as a result of relatively fast consumption of ATP by the inhibitory neurons as they display higher firing rates compared the excitatory/glutamatergic neurons. The fast consumption could be attributed to the synchronous population firing observed in case of inhibitory neurons as depicted in Figure 16, while the excitatory neuron population show desynchronous activation patterns. Higher ɛp shows continuous activation of both sets of neurons and is proposed to represent normal state (balanced excitation and inhibition).
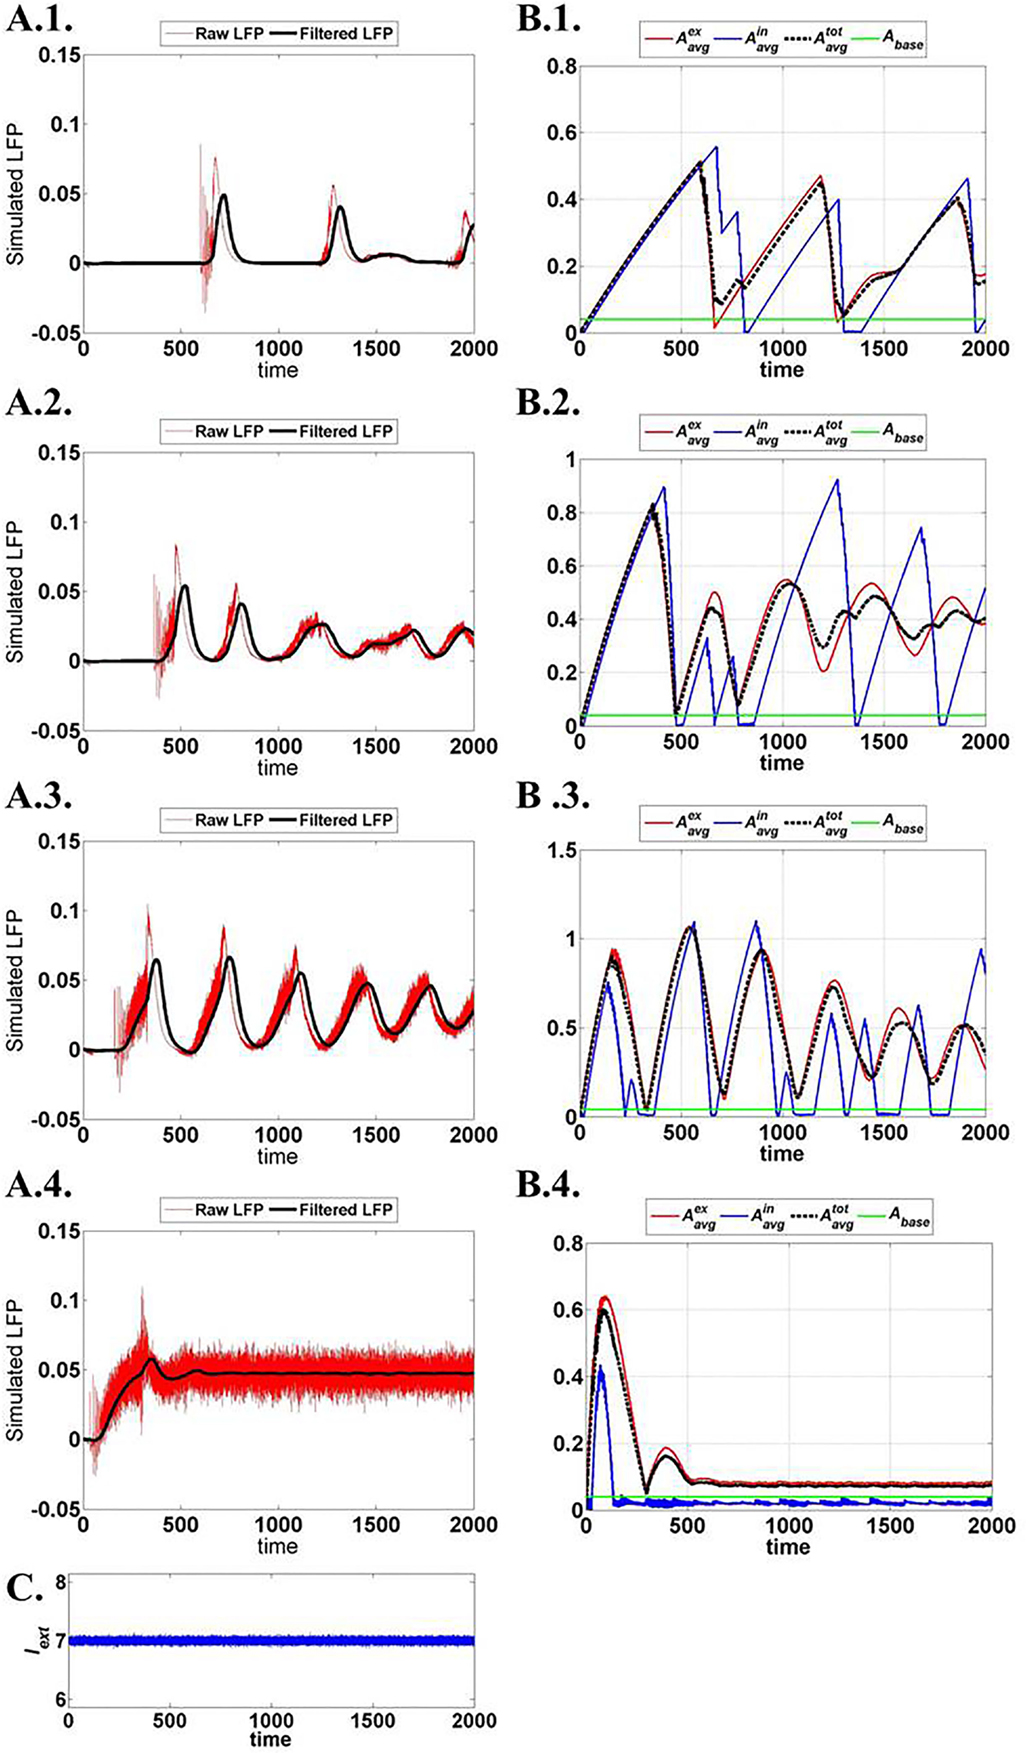
Figure 15. Network output activity for increasing ɛp: (A.1)–(A.4) raw and filtered LFP for ɛp; 1, 3, 8, and 15 (top to bottom). (B.1)–(B.4) ATP dynamics averaged across neuron populations; inhibitory, excitatory, and complete layer for varying ɛp. (C) External input current signal to the network with Gaussian noise.
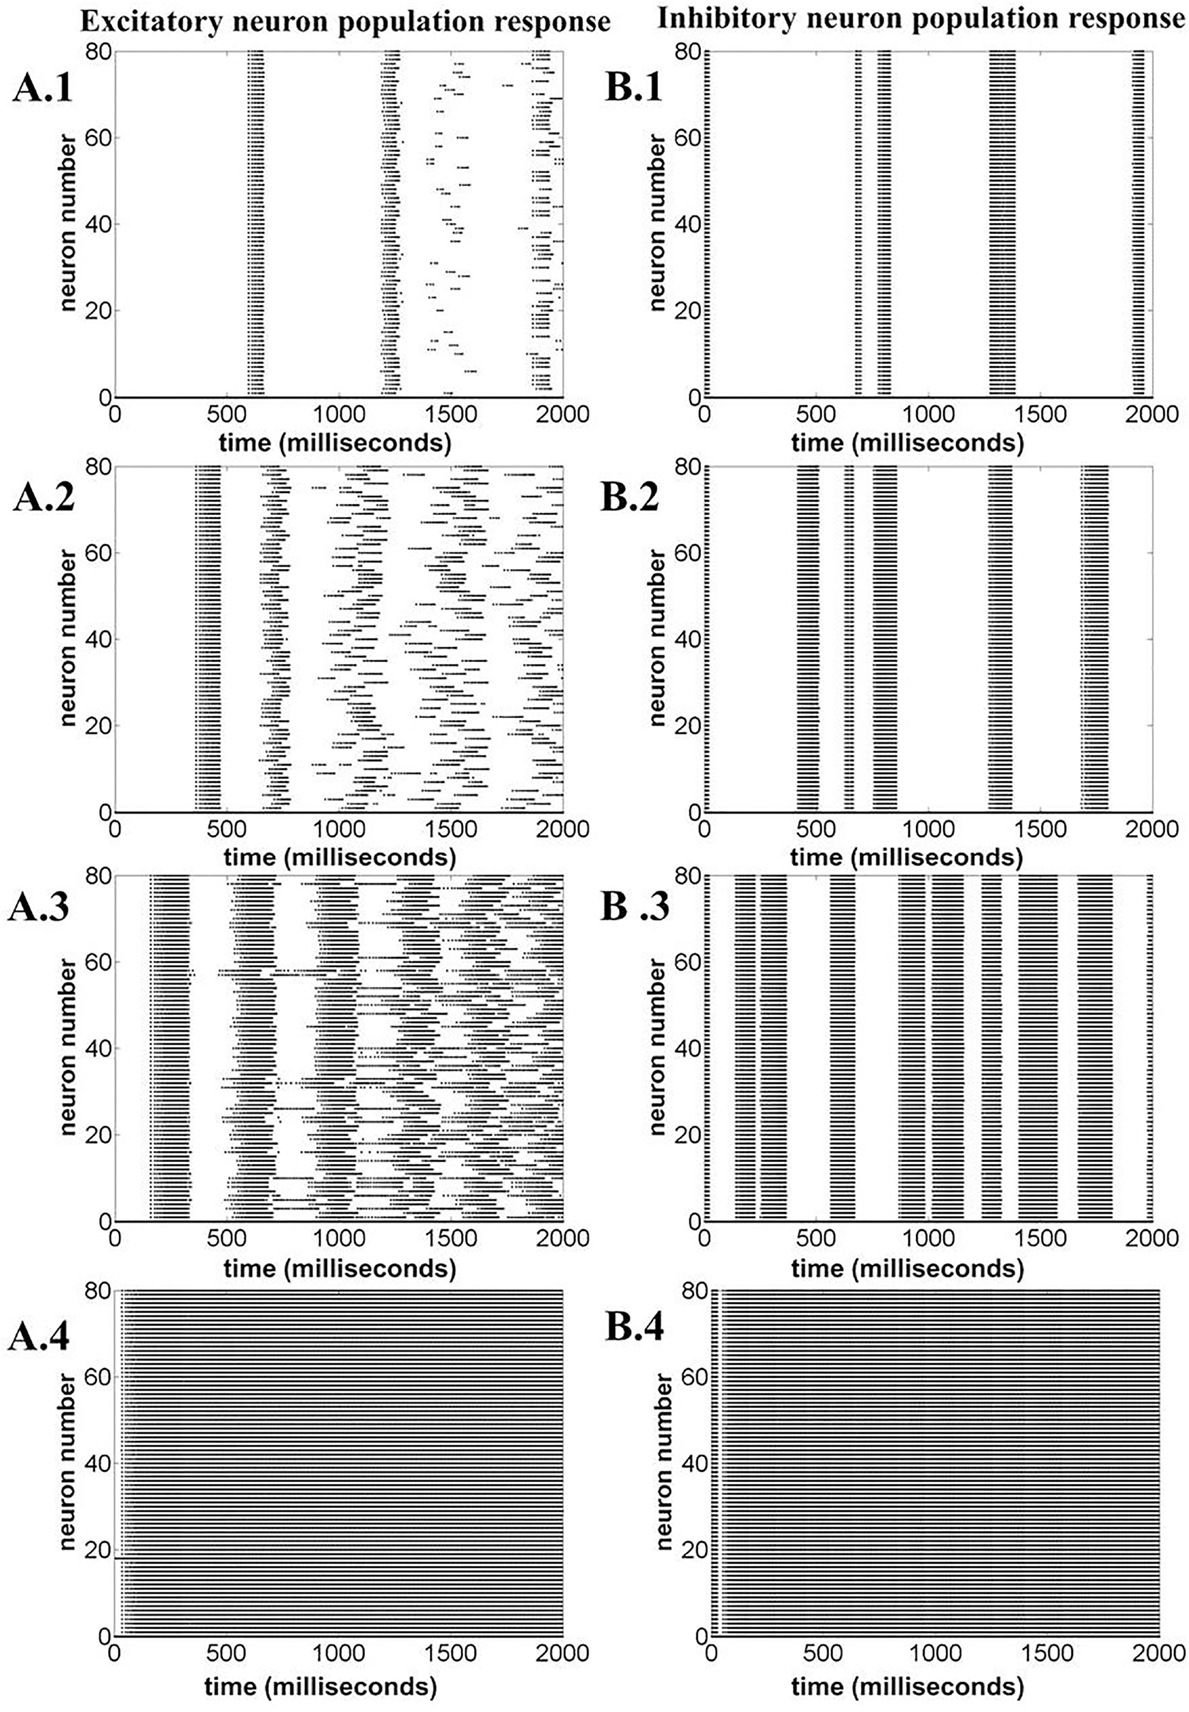
Figure 16. Neuronal population response for varying ɛp; 1, 3, 8, and 15 (top to bottom). (A.1)–(A.4) Excitatory neuron population response. (B.1)–(B.4) Inhibitory neuron population response. The figure illustrates that varying ɛp governs the synchronous firing among the excitatory neurons, making the network response more desynchronized at higher ɛp.
The spectrogram for the calculated LFPs corresponding to different values of ɛp is shown in Figure 17, which shows the existence of high frequency activity with alternating periods of quiescence at low ɛp values. This is similar to the spectrum observed under deeper anesthetic conditions with isoflurane administration as described by Silva et al. (63), representing a metabolically compromised or low energy state of the brain.
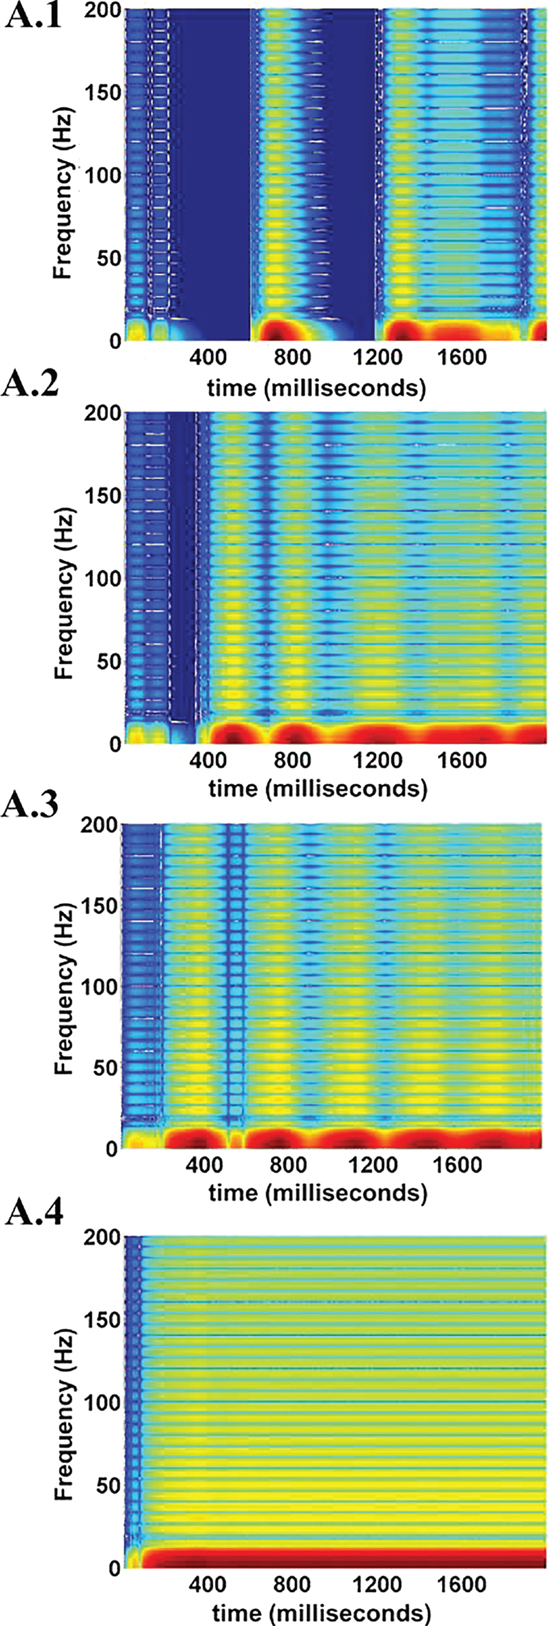
Figure 17. LFP spectrograms for varying ɛp; 1, 3, 8, and 15 (from A.1 to A.4). The effect of increasing ɛp is evident in terms of frequency range of LFPs. At low ɛp (=1) the LFP spectrum oscillates between high and low frequency (almost zero) components (A.1). Increasing ɛp results in a broader and less oscillatory LFP spectrum (A.2 and A.3). At very large values of ɛp rthe higher frequency components are uniformly seen throughout the simulation time period (A.4.).
4. Discussion
The present study proposes a minimal and computationally efficient model of the neurovascular system that could be used for simulating large scale networks. The first part of the study describes two low-dimensional single-unit neurovascular models depicting the importance of neuronal ATP production rate (representative of the vascular input) in modulating the neural firing patterns. As described earlier, the first model is biophysical and highlights the crucial link between the neuronal ATP and neural firing through the activity of the KATP channels. In order to simplify the first model further, based on the simple idea that “ATP controls the firing threshold,” we postulated the second model, a three-variable model. With a quadratic integrate-and-fire neuron model, the second neurovascular model parameters were adapted to mimic the spike characteristics observed in the first biophysical model. The second model effectively depicts the same set of behaviors observed in the first model as described in the previous sections. In the second part of the study, we then present a network model comprising the units described by the model equations of Section 2.2. With respect to the physiological correlates for the cortical neuronal networks, the simulated network is set to have 85% of the neurons as glutamatergic and 15% as GABAergic (55). The connectivity between the neuronal units is assumed to be sparse on the lines of earlier studies (64, 65). The simulation of the network shows that the LFP spectrum depends on the ATP production rate, ɛp.
The described models specifically present the case of low ATP conditions (metabolic stress) in the neurons, wherein bursting (tonic/phasic) is observed at the single neuron level. Although there are studies showing burst suppression in electroencephalogram (EEG) as a result of reduced metabolic states, such as hypothermia, hypoxic–ischemic trauma (66, 67), there is no direct evidence showing bursting under such low ATP conditions at single neuronal level. However, there are experiments studying the activity of KATP channels under energy deficits or hypoxic conditions (68). Since KATP channel activations are associated with bursting both in vitro and in vivo (69, 70), this forms the crucial link between low ɛp and bursting. In the presented models, the neuronal system could show both tonic and phasic bursting. While most of the studies mentioned above demonstrate the occurrence of tonic bursting under reduced metabolic states, phasic bursting at the single neuron level is not studied well. However, there are studies showing that cervical interneurons transition from tonic bursting to phasic bursting under extreme hypoxic conditions (71). This highlights the key advantage of conducting computational modeling studies, wherein behaviors can be predicted and subsequently validated by experiments. Based on our simulation results, some of the testable predictions that suggest themselves are summarized as follows.
• The models described in the current study describe single neuronal behaviors. Hence, it would be pragmatic to first test the effect of “energy deficits” at the single neuron level experiments by designing a low energy conditions for the neurons followed by analysis of their activity. It would be also plausible to conduct such experiments on the slice cultures under low glucose and/or low oxygen conditions. It would be thus very interesting to see the change in the neuronal activity in these low energy conditions.
• The current study also suggests the existence of phasic bursting under extremely low energy conditions. Similar to the studies conducted by Sandhu et al. (71), experiments can be designed for cortical systems to investigate if the transition from tonic to phasic bursting occurs under extreme hypoxic conditions.
• An even more general experiment would be to observe the evolution of intracellular ATP during all the regimes described in the present study. Since there are few studies pertaining to the real time intracellular ATP measurements (69), it would be beneficial to measure the ATP levels along with the neuronal activity in the conditions suggested in the present study and look for oscillations in ATP occurring in synchrony with neural bursting.
At the network level models proposed in the present study, low-frequency large amplitude oscillations in LFP are observed with low ATP production rates. Studies depict a correlation between seizure activity or a spreading depression event and hypoxic–ischemic conditions for hippocampal neurons in vitro (72). We suggest that seizures or spreading depression observed in slice cultures could be linked to tonic bursting at single neuron level [similar suggestions have been made by Kager et al. (43)]. Furthermore, experiments by Sandhu and Gonzalez-Rothi (71) describe the impact of hypoxic condition on a subset of cervical interneurons and show a switch from tonic to phasic bursting with increasing level of hypoxia. The physiological evidence also associates the comatose conditions to the persistence of burst suppression activity in EEG (66). The neonatal seizures and EEG burst suppression also have been correlated to the manifestation of metabolically compromised state of the brain as a result of hypoventilation, hypoxic–ischemic encephalopathy, intracranial hemorrhage, or hypoglycemic conditions (73, 74). All these conditions are concomitant to reduced energy release by the vascular system or low cerebral blood flow rates, leading on to hyperexcitability of the cerebral cortex due to increased release of glutamate (75, 76). The excitability of the neurons is also known to be governed by the concentration of extracellular potassium, determined by the activity of the various potassium channels (49). Specific among the gamut of potassium channels, KATP is of specific interest as its activity is dependent on the energy state (intracellular [ATP]) of the neuron such that low energy inside the neuron is attributed to higher efflux of potassium from the neurons (77). Therefore, low intracellular energy would lead to hyper excitability as a result of either increased release of glutamate or higher potassium efflux from the neurons. These evidences reinforce our proposition of ATP controlling the neural firing threshold, thereby determining the excitability of the neurons. In the present study, the simulation of the network model depicts burst suppression, such as activity under low ATP production rate conditions, as demonstrated earlier.
It is thus evident that neuronal energy states are crucial in maintaining the physiological activity of the brain. We further speculate that these energy states must be considered in the background of the neurovascular coupling, as the neurons mostly depend on the surrounding glial cells and cerebral vasculature for energy supply (78). However, recent studies show the presence of glycogen metabolism in the neurons although it is thought to occur at meager levels under extreme cerebral hypoxia (79). Interestingly, the pathologies associated with the metabolically compromised brain states might possibly have an associated vascular dysfunction. Studies by Schwartz discuss the possibility of developing hemodynamic markers associated with the seizure onset in case of epilepsy (32). There exist clinical studies that also demonstrate occurrence of seizures in post-stroke cases (80), implicating vascular anomaly as one of the probable factors affecting the onset of epilepsy. Recent studies investigate the association between cerebral angiopathies and pathologies, such as Alzheimer’s disease, migraine, and epilepsy (81, 82). However, a clear causational relation between neurovascular pathophysiology and such disorders is not evident. For example, it is necessary to understand that whether the decrease in BOLD signal is associated with post-stroke seizure or it is an outcome of neuronal morbidity, as also discussed by Schwartz et al. (32). Thus, further studies are required to consolidate the notion of vascular dysfunction underlying cerebral pathologies. However, the “silent vascular infarcts” (also known as silent stroke) have been associated with dementia and neuropathies, such as vascular Parkinson’s disease (83–85). Such studies suggest that a primary vascular pathology may be a key factor precipitating neuronal dysfunction (82). The post-stroke studies depicting prolonged cognitive impairments (86) further corroborate the significance of the cerebral vasculature. All these studies highlight the notion that the vascular dysfunction could adversely affect the energy states of the neurons and therefore could predispose neurons to various pathologies.
The present study propounds a new perspective of energy coupled neuronal system, wherein the energy inside the neuron varies dynamically, depending on the neural activity and the local vascular influence. We further propose that this vascular influence boils down to the production rate of ATP inside the neurons, which is controlled by the production coefficient, ɛp, in the models. This study presents low-dimensional models for neurovascular coupling, wherein glio-vascular system is lumped into an energy reservoir and the coupling is represented by ɛp. Such models can be implemented to simulate network models to study the effect of neurovascular coupling on the network activity as the one described in the present study.
Another plausible direction of the study could be to introduce explicit vascular dynamics controlling ɛp associated with the neurons. The vascular component in such a neurovascular network model may be designed on the lines of the existing vascular network models (87–91). Significant among these models is the vascular anatomic network (VAN) model proposed by Boas et al. (90) as it is relatively simple and is able to qualitatively predict the BOLD response characteristics. The model proposed in the present study provides an optimal substrate for developing comprehensive neurovascular models, wherein the evolution of neural dynamics in terms of EEG/LFP can be studied along with corresponding vascular responses in terms of BOLD signals. The firing rate signal calculated from the neural network would govern the vasodilatory signal that is fed to the VAN. The cerebral metabolic rate of oxygen (CMRO2) calculated from the model set parameters can then be employed to control the ATP production rates, ɛp of the neurons, completing the picture of neurovascular coupling. Thus, VAN coupled effectively to the model demonstrated in the present study would provide the basis for understanding and simulating the data obtained from multimodal systems, such as EEG coupled to functional magnetic resonance imaging (EEG–fMRI) and EEG coupled to functional near infrared spectroscopy (EEG–fNIRS).
In particular, this genre of neurovascular models will prove to be a vital brain mapping tool and could be implemented to understand the functional mechanisms of post-stroke recovery. As described earlier, there are clinical studies depicting the existence of post-stroke seizures and spreading depression, such as events which affect the post-stroke rehabilitation (92–94). Studies have shown the association between the early onset seizures post-stroke with factors, such as metabolic dysfunction, glutamate excitotoxicity, hypoxia, and global hypoperfusion (80, 95, 96). These events are associated with cellular processes including ATP deprivation, mitochondrial dysfunction, reactive oxygen (RO), and nitrogen species production that further result in irreversible neuronal damage causing larger cortical lesions and impairing the recovery process (80, 95, 97–99). With the vascular component coupled to the network model presented in this study, the vascular dynamics resulting in low ɛp can be investigated quantitatively (as the low ɛp conditions underpin seizure-like activity as observed in our model simulations). This would further lead to effective monitoring of stroke rehabilitation, wherein the epileptic seizure-like event could be anticipated. Moreover, a clear association could be established between specific hemodynamic patterns and seizure-like events. Furthermore, with a neurovascular model, the downstream effects of non-invasive brain stimulation (NIBS), an add-on stroke rehabilitation procedure to promote motor function recovery, could be simulated. Major efforts are being undertaken in devising optimal stimulation parameters for NIBS and to make it suitable to specific stroke patient groups (100, 101). Therefore, there is an immediate need to have a computational simulation platform, wherein the patient-specific stroke conditions can be simulated and the rehabilitation procedures can be calibrated by deriving the appropriate and patient-specific stimulation parameter set. The present study hence forms the base for developing such simulation platforms for stroke rehabilitation procedures.
In general, this line of study would help in deciphering the vascular basis of the all the brain functions and would also lead to vascular-based frontiers for diagnosis and treatment of brain pathologies. Another interesting line of extension pertaining to the present study could be to further reduce the current low-dimensional models to two-variable models for neurovascular coupling, which would be amendable to phase plane analysis. This is important as it would provide an insight into the mathematical basis of complex neuronal behaviors (such as bursting) and also how vascular system/energy parameters affect such behaviors.
Author Contributions
KC and VC: computational model development, analysis, and manuscript preparation.
Conflict of Interest Statement
The authors declare that the research was conducted in the absence of any commercial or financial relationships that could be construed as a potential conflict of interest.
References
1. Chander BS, Chakravarthy VS. A computational model of neuro-glio-vascular loop interactions. PLoS One (2012) 7(11):e48802. doi: 10.1371/journal.pone.0048802
2. Henn FA, Hamberger A. Glial cell function: uptake of transmitter substances. Proc Natl Acad Sci U S A (1971) 68(11):2686–90. doi:10.1073/pnas.68.11.2686
3. Gallo V, Ghiani CA. Glutamate receptors in glia: new cells, new inputs and new functions. Trends Pharmacol Sci (2000) 21(7):252–8. doi:10.1016/S0165-6147(00)01494-2
4. Zonta M, Angulo MC, Gobbo S, Rosengarten B, Hossmann KA, Pozzan T, et al. Neuron-to-astrocyte signaling is central to the dynamic control of brain microcirculation. Nat Neurosci (2002) 6(1):43–50. doi:10.1038/nn980
5. Pakkenberg B, Gundersen H. Total number of neurons and glial cells in human brain nuclei estimated by the dissector and the fractionator. J Microsc (1988) 150(1):1–20. doi:10.1111/j.1365-2818.1988.tb04582.x
6. Fields RD. The other half of the brain. Sci Am (2004) 290(4):54–61. doi:10.1038/scientificamerican0404-54
7. Jessen KR. Glial cells. Int J Biochem Cell Biol (2004) 36(10):1861–7. doi:10.1016/j.biocel.2004.02.023
8. Azevedo FA, Carvalho LR, Grinberg LT, Farfel JM, Ferretti RE, Leite RE, et al. Equal numbers of neuronal and nonneuronal cells make the human brain an isometrically scaled-up primate brain. J Comp Neurol (2009) 513(5):532–41. doi:10.1002/cne.21974
9. Merrill J, Chen I. HIV-1, macrophages, glial cells, and cytokines in AIDS nervous system disease. FASEB J (1991) 5(10):2391–7.
10. Renkawek K, De Jong W, Merck KB, Frenken CW, van Workum FP, Bosman GJ. αB-crystallin is present in reactive glia in Creutzfeldt-Jakob disease. Acta Neuropathol (1992) 83(3):324–7. doi:10.1007/BF00296796
11. Giaume C, Kirchhoff F, Matute C, Reichenbach A, Verkhratsky A. Glia: the fulcrum of brain diseases. Cell Death Differ (2007) 14(7):1324–35. doi:10.1038/sj.cdd.4402144
12. Barres BA. The mystery and magic of glia: a perspective on their roles in health and disease. Neuron (2008) 60(3):430–40. doi:10.1016/j.neuron.2008.10.013
13. Bernstein HG, Steiner J, Bogerts B. Glial cells in schizophrenia: pathophysiological significance and possible consequences for therapy. Expert Rev Neurother (2009) 9:1059–71. doi:10.1586/ern.09.59
14. Schroeter ML, Abdul-Khaliq H, Sacher J, Steiner J, Blasig IE, Mueller K. Mood disorders are glial disorders: evidence from in vivo studies. Cardiovasc Psychiatry Neurol (2010) 2010:780645. doi:10.1155/2010/780645
15. Molofsky AV, Krencik R, Ullian EM, Tsai HH, Deneen B, Richardson WD, et al. Astrocytes and disease: a neurodevelopmental perspective. Genes Dev (2012) 26(9):891–907. doi:10.1101/gad.188326.112
16. Cabezas R, Avila MF, Torrente D, El-Bachá RS, Morales L, Gonzalez J, et al. Astrocytes role in Parkinson: a double-edged sword. Neurodegenerative Disease (2013) 10(5772):54305.
17. Parri R, Crunelli V. An astrocyte bridge from synapse to blood flow. Nat Neurosci (2003) 6(1):5–6. doi:10.1038/nn0103-5
18. Wallraff A, Köhling R, Heinemann U, Theis M, Willecke K, Steinhäuser C. The impact of astrocytic gap junctional coupling on potassium buffering in the hippocampus. J Neurosci (2006) 26(20):5438–47. doi:10.1523/JNEUROSCI.0037-06.2006
19. Di Garbo A, Barbi M, Chillemi S, Alloisio S, Nobile M. Calcium signalling in astrocytes and modulation of neural activity. Biosystems (2007) 89(1):74–83. doi:10.1016/j.biosystems.2006.05.013
20. Eroglu C, Barres BA. Regulation of synaptic connectivity by glia. Nature (2010) 468(7321):223–31. doi:10.1038/nature09612
21. Navarrete M, Perea G, Fernandez de Sevilla D, Gómez-Gonzalo M, Núñez A, Martín ED, et al. Astrocytes mediate in vivo cholinergic-induced synaptic plasticity. PLoS Biol (2012) 10(2):e1001259. doi:10.1371/journal.pbio.1001259
22. Araque A, Carmignoto G, Haydon PG, Oliet SH, Robitaille R, Volterra A. Gliotransmitters travel in time and space. Neuron (2014) 81(4):728–39. doi:10.1016/j.neuron.2014.02.007
23. Wang X, Lou N, Xu Q, Tian GF, Peng WG, Han X, et al. Astrocytic Ca2+ signaling evoked by sensory stimulation in vivo. Nat Neurosci (2006) 9(6):816–23. doi:10.1038/nn1703
24. Bekar LK, He W, Nedergaard M. Locus coeruleus α-adrenergic-mediated activation of cortical astrocytes in vivo. Cereb Cortex (2008) 18(12):2789–95. doi:10.1093/cercor/bhn040
25. Perea G, Navarrete M, Araque A. Tripartite synapses: astrocytes process and control synaptic information. Trends Neurosci (2009) 32(8):421–31. doi:10.1016/j.tins.2009.05.001
26. Koehler RC, Roman RJ, Harder DR. Astrocytes and the regulation of cerebral blood flow. Trends Neurosci (2009) 32(3):160–9. doi:10.1016/j.tins.2008.11.005
27. Leybaert L. Neurobarrier coupling in the brain: a partner of neurovascular and neurometabolic coupling? J Cereb Blood Flow Metab (2005) 25(1):2–16. doi:10.1038/sj.jcbfm.9600001
28. Haydon PG, Carmignoto G. Astrocyte control of synaptic transmission and neurovascular coupling. Physiol Rev (2006) 86(3):1009–31. doi:10.1152/physrev.00049.2005
29. Nilsson H, Aalkjær C. Vasomotion: mechanisms and physiological importance. Mol Interv (2003) 3(2):79. doi:10.1124/mi.3.2.79
30. Di Marco LY, Farkas E, Martin C, Venneri A, Frangi AF. Is vasomotion in cerebral arteries impaired in Alzheimer’s disease? J Alzheimers Dis (2015) 46(1):35–53. doi:10.3233/JAD-142976
31. Iadecola C. Neurovascular regulation in the normal brain and in Alzheimer’s disease. Nat Rev Neurosci (2004) 5(5):347–60. doi:10.1038/nrn1387
32. Schwartz TH. Neurovascular coupling and epilepsy: hemodynamic markers for localizing and predicting seizure onset. Epilepsy Curr (2007) 7(4):91–4. doi:10.1111/j.1535-7511.2007.00183.x
33. Maizels M, Aurora S, Heinricher M. Beyond neurovascular: migraine as a dysfunctional neurolimbic pain network. Headache (2012) 52(10):1553–65. doi:10.1111/j.1526-4610.2012.02209.x
34. Moore CI, Cao R. The hemo-neural hypothesis: on the role of blood flow in information processing. J Neurophysiol (2008) 99(5):2035–47. doi:10.1152/jn.01366.2006
35. Sirotin YB, Das A. Anticipatory haemodynamic signals in sensory cortex not predicted by local neuronal activity. Nature (2009) 457(7228):475–9. doi:10.1038/nature07664
36. Porto-Pazos AB, Veiguela N, Mesejo P, Navarrete M, Alvarellos A, Ibáñez O, et al. Artificial astrocytes improve neural network performance. PLoS One (2011) 6(4):e19109. doi:10.1371/journal.pone.0019109
37. Ching S, Purdon PL, Vijayan S, Kopell NJ, Brown EN. A neurophysiological-metabolic model for burst suppression. Proc Natl Acad Sci U S A (2012) 109(8):3095–100. doi:10.1073/pnas.1121461109
38. Pellerin L, Magistretti PJ. Neuroenergetics: calling upon astrocytes to satisfy hungry neurons. Neuroscientist (2004) 10(1):53–62. doi:10.1177/1073858403260159
39. FitzHugh R. Impulses and physiological states in theoretical models of nerve membrane. Biophys J (1961) 1(6):445. doi:10.1016/S0006-3495(61)86902-6
40. Nagumo J, Arimoto S, Yoshizawa S. An active pulse transmission line simulating nerve axon. Proc IRE (1962) 50(10):2061–70. doi:10.1109/JRPROC.1962.288235
41. Liss B, Roeper J. Molecular physiology of neuronal K-ATP channels. Mol Membr Biol (2001) 18(2):117–27. doi:10.1080/09687680110047373
42. Frohlich F, Timofeev I, Sejnowski T, Bazhenov M. Extracellular potassium dynamics and epileptogenesis. Comput Neurosci Epilepsy (2008):419–39. doi:10.1016/B978-012373649-9.50029-6
43. Kager H, Wadman WJ, Somjen GG. Simulated seizures and spreading depression in a neuron model incorporating interstitial space and ion concentrations. J Neurophysiol (2000) 84(1):495–512.
44. Neusch C, Papadopoulos N, Müller M, Maletzki I, Winter SM, Hirrlinger J, et al. Lack of the Kir4.1 channel subunit abolishes K+ buffering properties of astrocytes in the ventral respiratory group: impact on extracellular K+ regulation. J Neurophysiol (2006) 95(3):1843–52. doi:10.1152/jn.00996.2005
45. Øyehaug L, Østby I, Lloyd CM, Omholt SW, Einevoll GT. Dependence of spontaneous neuronal firing and depolarisation block on astroglial membrane transport mechanisms. J Comput Neurosci (2012) 32(1):147–65. doi:10.1007/s10827-011-0345-9
46. Witthoft A, Filosa JA, Karniadakis GE. Potassium buffering in the neurovascular unit: models and sensitivity analysis. Biophys J (2013) 105(9):2046–54. doi:10.1016/j.bpj.2013.09.012
47. Newman EA. Inward-rectifying potassium channels in retinal glial (Muller) cells. J Neurosci (1993) 13(8):3333–45.
48. Quayle JM, Dart C, Standen NB. The properties and distribution of inward rectifier potassium currents in pig coronary arterial smooth muscle. J Physiol (1996) 494(3):715–26. doi:10.1113/jphysiol.1996.sp021527
49. Florence G, Pereira T, Kurths J. Extracellular potassium dynamics in the hyperexcitable state of the neuronal ictal activity. Commun Nonlinear Sci Numer Simul (2012) 17(12):4700–6. doi:10.1016/j.cnsns.2011.06.023
50. Vergara C, Latorre R, Marrion NV, Adelman JP. Calcium-activated potassium channels. Curr Opin Neurobiol (1998) 8(3):321–9. doi:10.1016/S0959-4388(98)80056-1
51. Pietrobon D, Moskowitz MA. Chaos and commotion in the wake of cortical spreading depression and spreading depolarizations. Nat Rev Neurosci (2014) 15(6):379–93. doi:10.1038/nrn3770
52. Forrest MD, Wall MJ, Press DA, Feng J. The sodium-potassium pump controls the intrinsic firing of the cerebellar Purkinje neuron. PLoS One (2012) 7(12):e51169. doi:10.1371/journal.pone.0051169
53. Aubert A, Costalat R. A model of the coupling between brain electrical activity, metabolism, and hemodynamics: application to the interpretation of functional neuroimaging. Neuroimage (2002) 17(3):1162–81. doi:10.1006/nimg.2002.1224
54. Mazzoni A, Panzeri S, Logothetis NK, Brunel N. Encoding of naturalistic stimuli by local field potential spectra in networks of excitatory and inhibitory neurons. PLoS Comput Biol (2008) 4(12):e1000239. doi:10.1371/journal.pcbi.1000239
55. Braitenberg V, Schüz A. Anatomy of the Cortex: Statistics and Geometry. London and New York: Springer-Verlag Publishing (1991).
56. Cunningham MO, Pervouchine DD, Racca C, Kopell NJ, Davies CH, Jones RS, et al. Neuronal metabolism governs cortical network response state. Proc Natl Acad Sci U S A (2006) 103(14):5597–601. doi:10.1073/pnas.0600604103
57. Frankenhaeuser B, Hodgkin A. The after-effects of impulses in the giant nerve fibres of Loligo. J Physiol (1956) 131(2):341–76. doi:10.1113/jphysiol.1956.sp005467
58. Pinaud M, Lelausque JN, Chetanneau A, Fauchoux N, Ménégalli D, Souron R. Effects of propofol on cerebral hemodynamics and metabolism in patients with brain trauma. Anesthesiology (1990) 73(3):404–9. doi:10.1097/00000542-199009000-00007
59. Heinke W, Koelsch S. The effects of anesthetics on brain activity and cognitive function. Curr Opin Anesthesiol (2005) 18(6):625–31. doi:10.1097/01.aco.0000189879.67092.12
60. Brown EN, Lydic R, Schiff ND. General anesthesia, sleep, and coma. N Engl J Med (2010) 363(27):2638–50. doi:10.1056/NEJMra0808281
61. Hanrahan SJ, Greger B, Parker RA, Ogura T, Obara S, Egan TD, et al. The effects of propofol on local field potential spectra, action potential firing rate, and their temporal relationship in humans and felines. Front Hum Neurosci (2013) 7:136. doi:10.3389/fnhum.2013.00136
62. Chery R, Gurden H, Martin C. Anesthetic regimes modulate the temporal dynamics of local field potential in the mouse olfactory bulb. J Neurophysiol (2014) 111(5):908–17. doi:10.1152/jn.00261.2013
63. Silva A, Cardoso-Cruz H, Silva F, Galhardo V, Antunes L. Comparison of anesthetic depth indexes based on thalamocortical local field potentials in rats. Anesthesiology (2010) 112(2):355. doi:10.1097/ALN.0b013e3181ca3196
64. Sjöström PJ, Turrigiano GG, Nelson SB. Rate, timing, and cooperativity jointly determine cortical synaptic plasticity. Neuron (2001) 32(6):1149–64. doi:10.1016/S0896-6273(01)00542-6
65. Holmgren C, Harkany T, Svennenfors B, Zilberter Y. Pyramidal cell communication within local networks in layer 2/3 of rat neocortex. J Physiol (2003) 551(1):139–53. doi:10.1113/jphysiol.2003.044784
66. Young GB. The EEG in coma. J Clin Neurophysiol (2000) 17(5):473–85. doi:10.1097/00004691-200009000-00006
67. Stecker MM, Cheung AT, Pochettino A, Kent GP, Patterson T, Weiss SJ, et al. Deep hypothermic circulatory arrest: II. Changes in electroencephalogram and evoked potentials during rewarming. Ann Thorac Surg (2001) 71(1):22–8. doi:10.1016/S0003-4975(00)01592-7
68. Ballanyi K. Protective role of neuronal KATP channels in brain hypoxia. J Exp Biol (2004) 207(18):3201–12. doi:10.1242/jeb.01106
69. Haller M, Mironov S, Karschin A, Richter DW. Dynamic activation of KATP channels in rhythmically active neurons. J Physiol (2001) 537(1):69–81. doi:10.1111/j.1469-7793.2001.0069k.x
70. Schiemann J, Schlaudraff F, Klose V, Bingmer M, Seino S, Magill PJ, et al. K-ATP channels in dopamine substantia nigra neurons control bursting and novelty-induced exploration. Nat Neurosci (2012) 15(9):1272–80. doi:10.1038/nn.3185
71. Sandhu MS, Gonzalez-Rothi EJ, Lee KZ, Maling N, Lane MA, Reier PJ, et al. Cervical interneuron bursting during hypoxia in anesthetized rats. FASEB J (2012) 26(1_MeetingAbstracts):1147-3.
72. Kawasaki K, Traynelis SF, Dingledine R. Different responses of CA1 and CA3 regions to hypoxia in rat hippocampal slice. J Neurophysiol (1990) 63(3):385–94.
73. Mizrahi EM. Neonatal seizures and neonatal epileptic syndromes. Neurol Clin (2001) 19(2):427–63. doi:10.1016/S0733-8619(05)70025-6
74. Glass HC. Neonatal seizures and therapeutic hypothermia for hypoxic-ischemic encephalopathy. Mol Cell Epilepsy (2014) 1(3):14888. doi:10.14800/mce.88
75. Choi DW. Cerebral hypoxia: some new approaches and unanswered questions. J Neurosci (1990) 10(8):2493–501.
76. Erecińska M, Silver IA. Metabolism and role of glutamate in mammalian brain. Prog Neurobiol (1990) 35(4):245–96. doi:10.1016/0301-0082(90)90013-7
77. Mironov SL, Langohr K, Haller M, Richter DW. Hypoxia activates ATP-dependent potassium channels in inspiratory neurons of neonatal mice. J Physiol (1998) 509(3):755–66. doi:10.1111/j.1469-7793.1998.755bm.x
78. Swanson RA, Choi DW. Glial glycogen stores affect neuronal survival during glucose deprivation in vitro. J Cereb Blood Flow Metab (1993) 13(1):162–9. doi:10.1038/jcbfm.1993.19
79. Saez I, Duran J, Sinadinos C, Beltran A, Yanes O, Tevy MF, et al. Neurons have an active glycogen metabolism that contributes to tolerance to hypoxia. J Cereb Blood Flow Metab (2014) 34(6):945–55. doi:10.1038/jcbfm.2014.33
80. Myint PK, Staufenberg EF, Sabanathan K. Post-stroke seizure and post-stroke epilepsy. Postgrad Med J (2006) 82(971):568–72. doi:10.1136/pgmj.2005.041426
81. Gorelick PB, Scuteri A, Black SE, Decarli C, Greenberg SM, Iadecola C, et al. Vascular contributions to cognitive impairment and dementia a statement for healthcare professionals from the American Heart Association/American Stroke Association. Stroke (2011) 42(9):2672–713. doi:10.1161/STR.0b013e3182299496
82. Stanimirovic DB, Friedman A. Pathophysiology of the neurovascular unit: disease cause or consequence? J Cereb Blood Flow Metab (2012) 32(7):1207–21. doi:10.1038/jcbfm.2012.25
83. Lee SC, Park SJ, Ki HK, Gwon HC, Chung CS, Byun HS, et al. Prevalence and risk factors of silent cerebral infarction in apparently normal adults. Hypertension (2000) 36(1):73–7. doi:10.1161/01.HYP.36.1.73-a
84. Vermeer SE, Longstreth WT Jr, Koudstaal PJ. Silent brain infarcts: a systematic review. Lancet Neurol (2007) 6(7):611–9. doi:10.1016/S1474-4422(07)70170-9
85. Vizcarra JA, Lang AE, Sethi KD, Espay AJ. Vascular parkinsonism: deconstructing a syndrome. Mov Disord (2015) 30(7):886–94. doi:10.1002/mds.26263
86. Tatemichi TK, Desmond DW, Stern Y, Paik M, Sano M, Bagiella E. Cognitive impairment after stroke: frequency, patterns, and relationship to functional abilities. J Neurol Neurosurg Psychiatry (1994) 57(2):202–7. doi:10.1136/jnnp.57.2.202
87. Buxton RB, Frank LR. A model for the coupling between cerebral blood flow and oxygen metabolism during neural stimulation. J Cereb Blood Flow Metab (1997) 17(1):64–72. doi:10.1097/00004647-199701000-00009
88. Mandeville JB, Marota JJ, Ayata C, Zaharchuk G, Moskowitz MA, Rosen BR, et al. Evidence of a cerebrovascular postarteriole windkessel with delayed compliance. J Cereb Blood Flow Metab (1999) 19(6):679–89. doi:10.1097/00004647-199906000-00012
89. Zheng Y, Johnston D, Berwick J, Chen D, Billings S, Mayhew J. A three-compartment model of the hemodynamic response and oxygen delivery to brain. Neuroimage (2005) 28(4):925–39. doi:10.1016/j.neuroimage.2005.06.042
90. Boas DA, Jones SR, Devor A, Huppert TJ, Dale AM. A vascular anatomical network model of the spatio-temporal response to brain activation. Neuroimage (2008) 40(3):1116–29. doi:10.1016/j.neuroimage.2007.12.061
91. Fantini S. Dynamic model for the tissue concentration and oxygen saturation of hemoglobin in relation to blood volume, flow velocity, and oxygen consumption: implications for functional neuroimaging and coherent hemodynamics spectroscopy (CHS). Neuroimage (2014) 85:202–21. doi:10.1016/j.neuroimage.2013.03.065
92. Dromerick A, Reding M. Medical and neurological complications during inpatient stroke rehabilitation. Stroke (1994) 25(2):358–61. doi:10.1161/01.STR.25.2.358
93. Davenport RJ, Dennis MS, Wellwood I, Warlow CP. Complications after acute stroke. Stroke (1996) 27(3):415–20. doi:10.1161/01.STR.27.3.421
94. Teasell RW, Foley NC, Bhogal SK, Speechley MR. An evidence-based review of stroke rehabilitation. Top Stroke Rehabil (2003) 10(1):29–58. doi:10.1310/8YNA-1YHK-YMHB-XTE1
95. Broughton BR, Reutens DC, Sobey CG. Apoptotic mechanisms after cerebral ischemia. Stroke (2009) 40(5):e331–9. doi:10.1161/STROKEAHA.108.531632
96. Kadam SD, White AM, Staley KJ, Dudek FE. Continuous electroencephalographic monitoring with radio-telemetry in a rat model of perinatal hypoxia-ischemia reveals progressive post-stroke epilepsy. J Neurosci (2010) 30(1):404–15. doi:10.1523/JNEUROSCI.4093-09.2010
97. Dirnagl U, Iadecola C, Moskowitz MA. Pathobiology of ischaemic stroke: an integrated view. Trends Neurosci (1999) 22(9):391–7. doi:10.1016/S0166-2236(99)01401-0
98. Burneo JG, Fang J, Saposnik G, Investigators of the Registry of the Canadian Stroke Network. Impact of seizures on morbidity and mortality after stroke: a Canadian multi-centre cohort study. Eur J Neurol (2010) 17(1):52–8. doi:10.1111/j.1468-1331.2009.02739.x
99. Gooshe M, Abdolghaffari AH, Aleyasin AR, Chabouk L, Tofigh S, Hassanzadeh GR, et al. Hypoxia/ischemia a key player in early post stroke seizures: modulation by opioidergic and nitrergic systems. Eur J Pharmacol (2015) 746:6–13. doi:10.1016/j.ejphar.2014.11.005
100. Padberg F, Möller HJ. Repetitive transcranial magnetic stimulation. CNS Drugs (2003) 17(6):386–403.
Keywords: neuro-glio-vascular, ATP, firing threshold, bursting, LFP
Citation: Chhabria K and Chakravarthy VS (2016) Low-Dimensional Models of “Neuro-Glio-Vascular Unit” for Describing Neural Dynamics under Normal and Energy-Starved Conditions. Front. Neurol. 7:24. doi: 10.3389/fneur.2016.00024
Received: 14 July 2015; Accepted: 18 February 2016;
Published: 09 March 2016
Edited by:
Thanh G. Phan, Monash Health, AustraliaReviewed by:
Christopher French, University of Melbourne, AustraliaDavid Reutens, The University of Queensland, Australia
George Karniadakis, Brown University, USA
Copyright: © 2016 Chhabria and Chakravarthy. This is an open-access article distributed under the terms of the Creative Commons Attribution License (CC BY). The use, distribution or reproduction in other forums is permitted, provided the original author(s) or licensor are credited and that the original publication in this journal is cited, in accordance with accepted academic practice. No use, distribution or reproduction is permitted which does not comply with these terms.
*Correspondence: V. Srinivasa Chakravarthy, schakra@ee.iitm.ac.in