Expensive brains: “brainy” rodents have higher metabolic rate
- 1 Departamento de Ecología, Pontificia Universidad Católica de Chile, Santiago, Chile
- 2 Department of Environmental Science and Policy, George Mason University, Fairfax, VA, USA
- 3 Department of Biology, University of Puerto Rico, San Juan, PR, USA
- 4 Departamento de Zoología, Universidad de Concepción, Concepción, Chile
Brains are the centers of the nervous system of animals, controlling the organ systems of the body and coordinating responses to changes in the ecological and social environment. The evolution of traits that correlate with cognitive ability, such as relative brain size is thus of broad interest. Brain mass relative to body mass (BM) varies among mammals, and diverse factors have been proposed to explain this variation. A recent study provided evidence that energetics play an important role in brain evolution (Isler and van Schaik, 2006). Using composite phylogenies and data drawn from multiple sources, these authors showed that basal metabolic rate (BMR) correlates with brain mass across mammals. However, no such relationship was found within rodents. Here we re-examined the relationship between BMR and brain mass within Rodentia using a novel species-level phylogeny. Our results are sensitive to parameter evaluation; in particular how species mass is estimated. We detect no pattern when applying an approach used by previous studies, where each species BM is represented by two different numbers, one being the individual that happened to be used for BMR estimates of that species. However, this approach may compromise the analysis. When using a single value of BM for each species, whether representing a single individual, or available species mean, our findings provide evidence that brain mass (independent of BM) and BMR are correlated. These findings are thus consistent with the hypothesis that large brains evolve when the payoff for increased brain mass is greater than the energetic cost they incur.
Introduction
Brain mass (BrM) varies across mammals. While BrM scales with body mass (BM), several other factors seem to influence BrM, such as sociability, environmental and dietary specializations, as well as energetic costs of brain tissue (Mace et al., 1981). Large brains contain more neurons and neural connections, and thus have greater potential for information processing. Large brains also tend to be more modular, which allows a great amount of connections between neurons (Krubitzer and Kaas, 2005). Hence, increased brain mass and potential for neural connections may have facilitated large brained mammals to colonize complex habitats, develop sensory systems and evolved complex societies (e.g., Budeau and Verts, 1986).
While there are many potential benefits of large brains, brain tissue is costly. For example, the mass-specific metabolic rate of the human brain is nine times higher than that of the body as a whole (Martin, 1981). The metabolic costs by having a large brain must be paid for by a direct mother metabolic constraint or by a trade-off mechanism between brain mass and energy consumption by other functions (e.g., Gibbons, 1998; Pitnick et al., 2006). Other energy allocations such as relative costs of flight and reproductive strategy in birds may also be reduced to shunt energy to an enlarged brain (Isler and van Schaik, 2006). Recent examples also show that BrM may become decoupled from BM over short time spans. For example, Gonzalez-Voyer et al. (2009) found that Tanganyikan cichlid BM exhibited recent bursts of rapid evolution, a process that is consistent with divergence linked to ecological specialization, while BrM showed no bursts of divergence but evolved in gradual manner, consistent with energetic constraints to rapid BM change.
Originally, Aiello and Wheeler (1995) proposed that a primate is able to meet the high metabolic cost of a large brain without incurring a compensatory increase in relative basal metabolic rate (BMR) by decreasing the amount of other metabolically expensive tissues (i.e., heart, lung, kidney, liver, and gastrointestinal tract). A similar hypothesis was recently proposed for fish (Kaufman et al., 2003). Recently, Isler and van Schaik (2009) using a large compilation of brain size, BM, and life history data, found evidence that an energetically costly increase in brain size has to be met by either increasing the total energy budget of a species or by compensating changes of energy allocation to other maintenance functions, such as digestion or growth and offspring production, or a combination of these. Martin, 1981, 1996), for example, found that the energetic investment of the mammalian mother during the development of the fetus and during the postnatal life up to the time of weaning resulted in a weak link between BMR and brain mass. Similarly, Jones and MacLarnon (2004) showed that for certain clades of bats, maternal investment plays an important role in the adult brain mass. While a number of studies have thus focused on these mechanisms of development, little is known about the evolutionary relationship between BMR and BrM. Very few studies have tested the generality of the “costly brain” hypotheses across multiple species with different evolutionary histories, and using phylogenetic approaches.
Basal metabolic rate is a fundamental parameter in comparative studies and lineages-specific exponents characterize its allometric scaling (White et al., 2009). Recently, Isler and van Schaik (2006) controlling both for BM and phylogentic relationships found evidence that BMR correlated with BrM in large groups of mammals. However, BrM explained a small % of the variation in metabolic rate at the species and family level (2.6 and 10.4%, respectively). At higher taxonomic levels, independent contrast (IC) revealed a significant correlation only for primates.
It is possible that the use of composite phylogenies lacking resolution and accurate estimates of branch lengths (BL) may have obscured the underlying patterns (e.g., Malia et al., 2003). Other potential confounding variables are the different possible ways of controlling for species BM. Here we generated a novel phylogeny of wild rodents using Bayesian analysis of cytochrome b sequence data. We included species where high-quality BMR, BrM, and BM data are available. We then used this analysis to test the hypothesis that BMR and BrM are correlated within rodents, after taking into consideration both BM and phylogeny.
Materials and Methods
Cytochrome b for 132 rodent species and six rabbits as outgroups (Wilson and Reeder, 2005) were downloaded from GenBank, and one sequence donated (Table A1 in Appendix). Cytochrome b was chosen as that marker has proven to be of high utility for species level phylogenetics (May-Collado and Agnarsson, 2006; Agnarsson et al., 2010, 2011)
Sequences were aligned using ClustalX 1.83 (Thompson et al., 1997) via Mesquite (Maddison and Maddison, 2008). The preferred model for the Bayesian analyses was selected with Modeltest (Posada and Crandall, 2001) using the AIC criterion (Posada and Buckley, 2004). The best-fitting model was GTR + γ + I (Yang, 1994). Bayesian analyses were carried out using MrBayes V3.12 (Huelsenbeck and Ronchist, 2001) with the settings as specified in Agnarsson and May-Collado (2008). The Markov chain Monte Carlo search was ran with 10,000,000 generations sampling the Markov chain every 1,000 generations, and the sample points of the first 7,000,000 generations were removed (“burnin”), after which the chain had reached stationarity.
Data on the log of BrM and BM (g), and BMR (cm3O2/h) were used in this study (Table A1 in Appendix). For studies comparing traits among species, such as regression analyses, it is necessary to account for phylogenetic relationships among the compared species (Felsenstein, 1985). Ignoring phylogenetic relationships can lead to pseudoreplication as species are not independent data points, rather independent evolutionary changes in the traits being compared are the data points, or the IC (see Felsenstein, 1985; May-Collado et al., 2007) among species and lineages. To describe the evolutionary relationship between BMR and BrM we performed various phylogenetic analyses. (i) The PDAP module in Mesquite (Midford et al., 2008) was used to estimate IC (Felsenstein, 1985). We used BL as estimated by MrBayes testing them for statistic appropriateness using PDAP. To correct for BM we regressed BMR and BrM against BM and subsequently regressed the residuals from these regressions (Garland et al., 1993). If the residuals are correlated then that is consistent with a relationship among these variables (BMR and BrM), that is independent of the BM of, and phylogenetic relationship among, species (e.g., May-Collado et al., 2007). Regression of residuals was performed using SPSS 2007 (SPSS Inc.). We also regressed BMR and BrM directly. (ii) To evaluate the correlated evolution among BMR, BrM, and BM, we assess the phylogenetic effect on the trends in character relationships between taxa (i.e., the observed pattern) using the best model of evolution that was found for each character. To do this we evaluated the significance of the relationships between the pair of characters using a measure of correlated evolution (CORR) in a Bayesian framework implemented in BayesTrait 1.0 (Pagel and Meade, 2007), assessing the probability of positively correlated (CORR > 0) and negatively correlated evolution (CORR < 0). As the null hypothesis we used a model in which the covariance between characters was set to zero (i.e., complete character independence, CORR = 0), and the alternative hypothesis was, then, the observed covariance between characters (Pagel, 1999a, 1999b). If the null hypothesis was rejected (i.e., a significant historical relationship between characters exists), then we concluded that the phylogenetic relationship and the models of evolution of the characters influence the observed patterns, and we corroborate the hypothesis of correlated evolution between BMR, BrM, and BM.
These methods account for phylogenetic uncertainty by running analyses across multiple trees. We used a Bayesian approach based on maximum likelihood with 10 test per tree and estimating Pagel (1999a,b) escalated phylogenetic parameters (Table A2 in Appendix). The sign test was used for statistical comparisons (Zar, 1996) with STATISTICA 6.0 (StatSoft, 2001).
Results
The novel phylogeny finds support for the monophyly of each currently recognized taxonomical bat family with the exception that Heteromyidae contains Geomyidae, and one species of Muridae, Sigmodon hispidus, groups with Cricetidae (Figure A1 in Appendix). The phylogeny overall agrees well with recent rodent phylogenies at higher levels (e.g., Jansa and Weksler, 2004; Montgelard et al., 2008) and thus represents an reasonable hypothesis for to study the evolution of characters (e.g., Pagel and Harvey, 1988)
Independent contrast revealed associations between BM and BMR (p < 0.0001; r2 = 0.77), and with BrM (p < 0.0001; r2 = 0.85), and between BMR and BrM (p < 0.0001; r2 = 0.71). When using a single value to represent species mass we also found significant correlation between BMR and BrM, after accounting for BM. When using a single individual weight to represent the species, BMR explained 9.7% of the variation in BrM (p = 0.0003; r2 = 0.097; Figure 1A). Two extreme outliers affected the regression and removing these outliers resulted in much stronger regression (p < 0.0001; r2 = 0.20; Figure 1B). The outliers represent 3 species of small rodents (Cricetidae, Arvicolinae), that inhabit circumpolar Northern Hemisphere biome (Nowak, 1999). These Lemmings seem to have higher metabolic rate than typical rodents with similar BrM, which may be related to living in extreme climates requiring higher metabolism. This demonstrates that the climate and habitat as well as other potentially confounding factors (BM, food habits, substrate, a restriction to islands or highlands, use of torpor, and type of reproduction) make it difficult to demonstrate a significant correlation between BMR and BrM, even when it exists (e.g., McNab, 2008).

Figure 1. (A) Independent contrast regression analysis between BMR and BrM residuals, corrected by BM. (B) IC regression analysis between BMR and BrM residuals, corrected by BM and removing outliners (Myopus schisticolor, Lemmus sibiricus, and L. lemmus). Where BM = body mass, BMR = basal metabolic rate, and BrM = rodent brain mass.
When using species mean BM, BMR explained approximately 3% of variation in BrM (p < 0.05, r2 = 0.029). This correlation, however, disappears when using two BM values for each species, one, the estimated species mean, to calculate residuals of BrM, and the second, of the individuals used for the BMR experiments, to calculate residuals of BMR (p > 0.05).
CORR indicated significant correlations between all variables (p < 0.0001; CORR ≥ 1), with the highest correlation recorded between BM and BrM (p < 0.0001; CORR = 2.86; r2 = 0.95; Figure 2), followed by BM and BMR (p < 0.0001; CORR = 2.24; r2 = 0.92; Figure 2), and finally BMR and BrM (p < 0.0001; CORR = 1.86; r2 = 0.91; Figure 2).
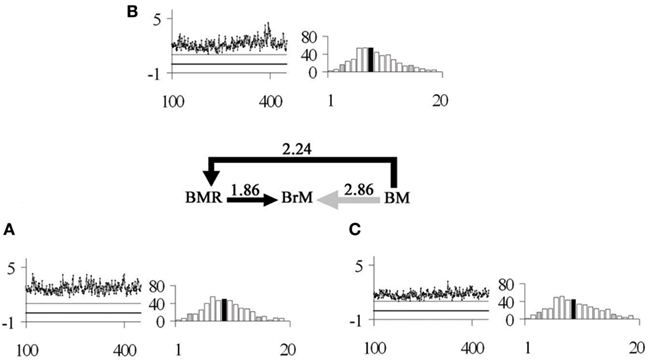
Figure 2. The series of arrows in the middle of the figure indicates the model of correlated evolution between the studied characters in a Bayesian framework (for more details see Materials and Methods), where BM = body mass, BMR = basal metabolic rate, and BrM = rodent brain mass. Average CORR values for each set of variables are presented above each arrow. Each inset labeled with a lower-case letter contains: on the left-hand side a line graph of a sample of 1,000 Markov Chain estimations (x-axis) of CORR (y-axis) between pairs of characters, where the continuous black line represents CORR = 0, and the continuous gray line indicates CORR = 1; and on the right-hand side a histogram of the probability distribution of covariance between pairs of characters, where the black bar indicates the average value and the gray bars indicate the lower 5% percentile (LP) and upper 95% percentile (UP). In particular, the analyzed characters were (A) BMR and BrM (LP = 1.33, UP = 2.46); (B) BM and BMR (LP = 1.50, UP = 3.12); and (C) BM and BrM (LP = 2.08, UP = 3.77).
Discussion
Brains are the centers of the nervous system of vertebrates, controlling the organ systems of the body and coordinating responses to changes in the ecological and social environment (Shultz, 2010). Although brain mass per se does not capture the complexity of brain function, there is general evidence that relative brain size roughly correlates with cognitive ability (e.g., Barton and Harvey, 2000). Hence the evolution of brain size is of broad interest, including what factors may favor and constrain the evolution of relatively large, modular and complex brains (Sol, 2009).
Basal metabolic rate is influenced by a variety of factors (BM White and Seymour, 2003; climate Lovegrove, 2000; demography Kurta and Ferkin, 1991). Furthermore, an increase in BrM results in increased costs for maintenance and information processing (Niven and Laughlin, 2008). For example, Karbowski (2007) found that in volume-specific cerebral glucose metabolic rate of different brain structures closely scales with brain volume. These results confirm that information processing in the brain requires large amounts of metabolic energy.
Here, we demonstrate a possible correlation between BMR and BrM within Rodentia. Independent of BM large brained rodents exhibit correspondingly higher BMR. These results contrast previous studies (McNab and Eisenberg, 1989). For instance, Isler and van Schaik (2006) found support for this relationship across all mammals combined, and within primates (IC p = 0.025, r2 = 0.20), but not within other orders, such as rodents. Adjustments appear to be clade-specific, the slopes of best-fit lines for BrM against BM tend to be higher in analyses of more inclusive taxa (e.g., orders and suborders) and lower in analyses of less inclusive taxa (families, subfamilies, and genera; e.g., Finarelli and Flynn, 2009). We hypothesize that the discrepancy between our findings and previous studies is potentially caused by two factors. First, the use of a composite versus primary-data based phylogenies, and second, differences in accounting for BM. Composite phylogenies often reflect taxonomy, not necessarily phylogeny, and typically lack accurate BL estimates, two aspects that reduce the efficiency of comparative tests. Accounting for BM is a complicated problem, but we argue that using more than a single value for a species, as have prior studies, may introduce confounding variables. Thus using an estimate of species BM, such as average species BM to generate BrM residuals, and the BM of the individual that happened to be used to evaluate BMR to generate BMR residuals, can likely adds noise that may obscure real patterns. If, for example, the evaluation of BMR happened to have been done on an atypically small or large animal, this would strongly affect the BM-BMR residual, and could readily obscure subtle patterns across two or more variables that are both highly correlated with BM. Instead using a single value, whether mean BM of a species, or the weight of a single individual seems at least to be a reasonable alternative. Furthermore, species mean BM is a measure independent of the available measures for BMR and BrM (typically single individuals), and as such provides a relatively neutral control unlikely to result in systematic error.
Here, we used a novel primary-data-based phylogeny with BL estimates and single estimates of species BM (species average or single individuals). Considering the compendium of factors that may contribute to BMR, the up to 20% of variation explained by BrM in rodents is high. Clearly, though, further research is necessary to understand the interplay between these variables, and ideally accurate estimates of species means based on multiple individuals would be available for each of these variables (e.g., Smith and Jungers, 1997).
Our study is also consistent with two evolutionary paths “favoring” an increase in BrM across rodent species. First, a “direct” path in which an increase in BMR correlates with an increase in BrM (Figure 2A). Alternatively, an “indirect” and additive path in which the effect of BM on BMR allows BrM to increase (Figures 2A,B). Comparatively, the direct scaling effect of BMR on BrM is the least important relationship (Figure 2A), but the importance of direct scaling increases when considering the indirect path. Dunbar and Shultz (2007) supported the indirect path scenario in primates, where BMR had a limiting effect on BrM, while BM had an effect on BrM through BMR.
Concluding Remarks
Here, we corroborate the hypothesis of Isler and van Schaik (2006) that an increase in brain mass is accompanied by an increase in basal metabolic rate, and suggests that this pattern may be general across mammals. Our findings corroborate the hypothesis that large brains evolve when the payoff for increased brain mass is greater than the energetic cost they incur (Niven and Laughlin, 2008).
Conflict of Interest Statement
The authors declare that the research was conducted in the absence of any commercial or financial relationships that could be construed as a potential conflict of interest.
Acknowledgments
We would like to thank to K. Isler (University of Zürich-Irchel) for providing BMR, BM, and BrM data and D. M. Bustamante for compiling an initial dataset. We also thank two anonymous reviewers. Funding was provided by CONICYT fellowship (Raúl Sobrero); FONDECYT 3050092 and 11080110, and DIUC 205.113.070-1.0 (Cristián E. Hernández).
References
Agnarsson, I., Kuntner, M., and May-Collado, L. J. (2010). Dogs, cats, and kin: a molecular species-level phylogeny of Carnivora. Mol. Phylogenet. Evol. 54, 726–745.
Agnarsson, I., and May-Collado, L. J. (2008). The phylogeny of Cetartiodactyla: the importance of dense taxon sampling, missing data, and the remarkable promise of Cytochrome b to provide reliable species-level phylogenies. Mol. Phylogenet. Evol. 48, 964–985.
Agnarsson, I., Zambrana-Torrelio, C. M., Flores Saldaña, N. P., and May-Collado, L. J.. (2011). A time-calibrated species-level phylogeny of bats (Chiroptera, Mammalia). PLoS Curr. Tree of Life. Version 44. Available at: http://knol.google.com/k/ingi-agnarsson/a-time-calibrated-species-level/3chrbtx927cxs/5/
Aiello, L., and Wheeler, P. (1995). The expensive tissue hypothesis: the brain and the digestive system in human and primate evolution. Curr. Anthropol. 36, 199–221.
Barton, R. A., and Harvey, P. H. (2000). Mosaic evolution of brain structure in mammals. Nature 405, 1055–1058.
Budeau, D. A., and Verts, B. J. (1986). Relative brain size and structural complexity of habitats of Chipmunks. J. Mammal. 67, 579–581.
Dunbar, R. I. M., and Shultz, S. (2007). Understanding primate brain evolution. Philos. Trans. R. Soc. Lond., B, Biol. Sci. 362, 649–658.
Felsenstein, J. (1985). Confidence limits on phylogenies with a molecular clock. Syst. Zool. 34, 152–161.
Finarelli, J. S., and Flynn, J. J. (2009). Brain-size evolution and sociality in Carnivora. Proc. Natl. Acad. Sci. U.S.A. 106, 345–9349.
Garland, T. Jr., Dickerman, A. W., Janis, C. M., and Jones, J. A. (1993). Phylogenetic analysis of covariance by computer simulation. Syst. Biol. 42, 265–292.
Gonzalez-Voyer, A., Winberg, S., and Kolm, N. (2009). Distinct evolutionary patterns of brain and body size during adaptive radiation. Evolution 63, 2266–2274.
Huelsenbeck, J. P., and Ronchist, F. (2001). MRBAYES: Bayesian inference of phylogenetic trees. Bioinformatics 17, 754–755.
Isler, K., and van Schaik, C. P. (2009). The brain expensive: a framework for evolutionary explaining changes in brain size. J. Hum. Evol. 57, 392–400.
Jansa, S. A., and Weksler, M. (2004). Phylogeny of muroid rodents: Relationships within and among major lineages as revealed by nuclear IRBP gene sequences. Mol. Phylogenet. Evol. 31, 256–276.
Jones, K. E., and MacLarnon, A. M. (2004). Affording larger brains: testing hypotheses of mammalian brain evolution on bats. Am. Nat. 164, 20–31.
Karbowski, J. (2007). Global and regional brain metabolic scaling and its functional consequences. BMC Biol. 5, 18. doi: 10.1186/1741-7007-5-18
Kaufman, J. A., Hladik, C. M., and Pasquet, P. (2003). On the expensive-tissue hypothesis: independent support from highly encephalized fish. Curr. Anthropol. 44, 705–707.
Krubitzer, L., and Kaas, J. (2005). The evolution of the neocortex in mammals: how is phenotypic diversity generated? Curr. Opin. Neurobiol. 15, 444–453.
Kurta, A., and Ferkin, M. (1991). The correlation between demography and metabolic rate: a test using the beach vole (Microtus breweri) and the meadow vole (Microtus pennsylvanicus). Oecologia 87, 102–105.
Mace, G. M., Harvey, P. H., and Clutton-Brock, T. H. (1981). Brain size and ecology in small mammals. J. Zool. 193, 333–354.
Maddison, W. P., and Maddison, D. R. (2008). Mesquite: A Modular System for Evolutionary Analysis, Version 2.5. Available at: http://mesquiteproject.org/
Malia, M. J. Jr., Lipscomb, D. L., and Allard, M. W. (2003). The misleading effects of composite taxa in supermatrices. Mol. Phylogenet. Evol. 27, 522–527.
Martin, R. (1981). Relative brain size and basal metabolic rate in terrestrial vertebrates. Nature 293, 57–60.
Martin, R. D. (1996). Scaling of the mammalian brain: the maternal energy hypothesis. News Physiol. Sci. 11, 149–156.
May-Collado, L., and Agnarsson, I. (2006). Cytochrome b and Bayesian inference of whale phylogeny. Mol. Phylogenet. Evol. 38, 344–354.
May-Collado, L. J., Agnarsson, I., and Wartzok, D. (2007). A phylogenetic review of tonal sound production in whales. BMC Evol. Biol. 7, 136. doi: 10.1186/1471-2148-7-136
McNab, B. K. (2008). An analysis of the factors that influence the level and scaling of mammalian BMR. Comp. Biochem. Physiol., Part A Mol. Integr. Physiol. 151, 5–28.
McNab, B. K., and Eisenberg, J. F. (1989). Brain size and its relation to the rate of metabolism in mammals. Am. Nat. 133, 157–167.
Midford, P. E., Garland, T. Jr., and Maddison, W. (2008). “PDAP:PDTREE” Package for Mesquite, Version 1.11. Available at: http://mesquiteproject.org/pdap_ mesquite/
Montgelard, C., Forty, E., Arnal, V., and Matthee, C. A. (2008). Suprafamilial relationships among Rodentia and the phylogenetic effect of removing fast-evolving nucleotides in mitochondrial, exon and intron fragments. BMC Evol. Biol. 8, 321. doi: 10.1186/1471-2148-8-321
Niven, J. E., and Laughlin, S. B. (2008). Energy limitation as a selective pressure on the evolution of sensory systems. J. Exp. Biol. 211, 1792–1804.
Nowak, R. M. (1999). Walker’s Mammals of the World, 6th Edn. Baltimore, MD: Johns Hopkins University Press.
Pagel, M. (1999b). The maximum likelihood approach to reconstructing ancestral character states of discrete characters on phylogenies. Syst. Biol. 48, 612–622.
Pagel, M., and Harvey, P. (1988). Recent developments in the analysis of comparative data. Q. Rev. Biol. 63, 413–440.
Pagel, M., and Meade, A. (2007). BayesTraits Version 1.0 Computer Package. Available at: http://www.evoluion.reading.ac.uk/BayesTraits.html/
Pitnick, S., Jones, K., and Wilkinson, G. (2006). Mating system and brain size in bats. Proc. R. Soc. Lond., B, Biol. Sci. 273, 719–724.
Posada, D., and Buckley, T. R. (2004). Model selection and model averaging in phylogenetics: advantages of akaike information criterion and bayesian approaches over likelihood ratio tests. Syst. Biol. 53, 793–808.
Posada, D., and Crandall, K. A. (2001). Selecting the best-fit model of nucleotide substitution. Syst. Biol. 50, 580–601.
Shultz, S. (2010). “Brain evolution in vertebrates,” in Encyclopedia of Behavioral Neuroscience, eds G. F. Koob, M. Le Moal, and R. F. Thompson (Burlington, MA: Elsevier Academic Press), 180–186.
Smith, R. L., and Jungers, W. L. (1997). Body mass in comparative primatology. J. Hum. Evol. 32, 523–559.
Sol, D. (2009). Revisiting the cognitive buffer hypothesis for the evolution of large brains. Biol. Lett. 5, 130–133.
StatSoft. (2001). STATISTICA (Data Analysis Software System), version 6. URL: http://www.statsoft.com
Thompson, J., Gibson, T. P., Lewniak, F., Jeanmougin, F., and Higgins, D. (1997). The ClustalX windows interface: flexible strategies for multiple sequence alignment aided by quality analysis tools. Nucleic Acids Res. 25, 4876–4882.
White, C. R., Blackburn, T. M., and Seymour, R. S. (2009). Phylogenetically informed analysis of the allometry of mammalian basal metabolic rate supports neither geometric nor quarter-power scaling. Evolution 63, 2658–2667.
White, C. R., and Seymour, R. S. (2003). Mammalian basal metabolic rate is proportional to body mass (2/3). Proc. Natl. Acad. Sci. U.S.A. 100, 4046–4049.
Wilson, D. E., and Reeder, D. M. (2005). Mammal Species of the World: A Taxonomic and Geographic Reference, 3rd Edn. Baltimore, MD: Johns Hopkins University Press.
Appendix
Electronic Supplementary Material to the Manuscript “Expensive brains: ‘brainy’ rodents have higher metabolic rate” by Raul Sobrero, Laura J. May-Collado, Ingi Agnarsson, and Cristian E. Hernandez.
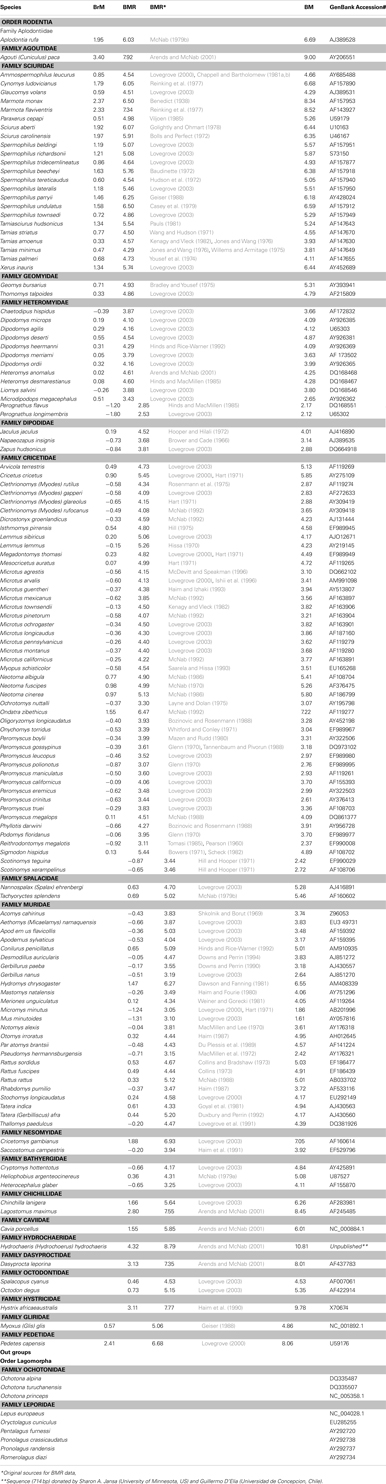
Table A1. List of species and GenBank accesses of rodent and rabbit for the cytochrome b mitochondrial gene. Data on the log of brain mass (BrM, g), body mass (BM, g), and basal metabolic rate (BMR, cm3O2/h) for rodent species based on McNab and Eisenberg (1989); White and Seymour (2003); and Isler and van Schaik (2006).

Table A2. Results of Bayesian estimations of lambda (λ) and kappa (κ) phylogenetic parameters of Pagel (2002) under a Continuous Random Walk model. In this approach: (1) λ, reveals whether the phylogeny fits to the patterns of covariance among species for a given trait. If a trait is not evolving among species this parameter will take the value 0, indicating that a phylogenetic correction is not necessary. If traits are evolving as expected given the tree topology, λ, takes the value of 1.0. Values of λ = 1.0 are consistent with the constant-variance model (sometimes called Brownian motion) and is therefore a correct representation of the data; (2) κ scales the relationship between individual branch lengths and trait evolution (Pagel, 1994, 2002). The value of this parameter is the power to which individual branch lengths should be raised in order to maximize the fit of the model of evolution to the data. If κ is 1, trait evolution is directly proportional to branch length and, then, the gradual mode of trait evolution is better supported. Values of κ greater than 1 signify proportionally more evolution in longer branches. Values of κ less than 1 signify proportionally more evolution in shorter branches. In the extreme case of κ = 0, trait evolution is independent of branch length, which is consistent with a punctuational mode of evolution.
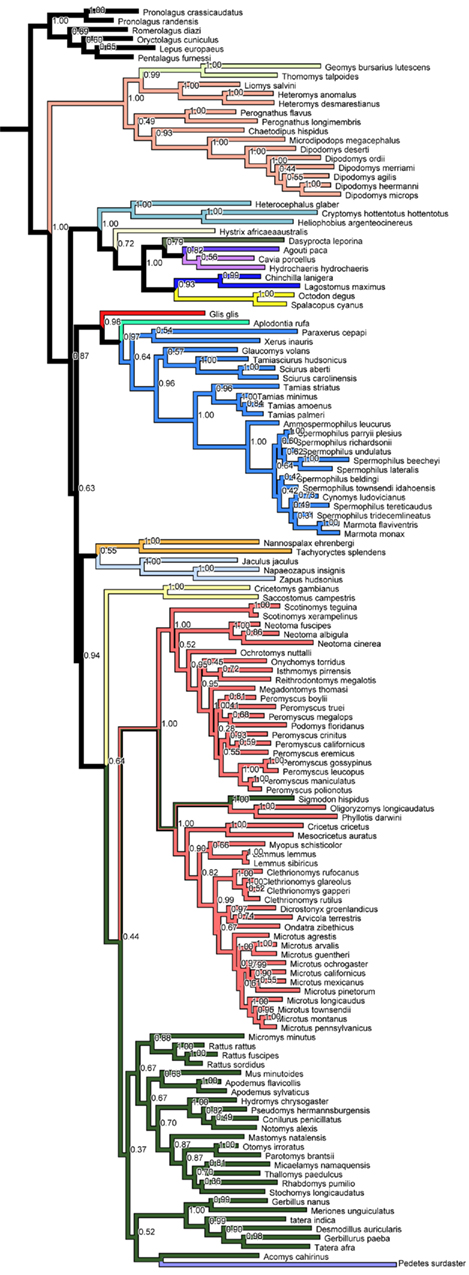
Figure A1. Majority rule consensus tree of the Bayesian analyses for Rodentia. Number at nodes represent the posterior probabilities values.
References
Arends, A., and McNab, B. K. (2001). The comparative energetics of “caviomorph” rodents. Comp. Biochem. Physiol. A 130, 105–122.
Baudinette, R. V. (1972). Energy metabolism and evaporative water loss in the California ground squirrel: effects of burrow temperature and water vapor pressure. J. Comp. Physiol. 81, 57–72.
Benedict, F. G. (1938). Vital Energetics: A Study in Comparative Basal Metabolism. Washington, D.C.: Carnegie Institution of Washington.
Bolls, N. J., and Perfect, J. R. (1972). Summer resting metabolic rate of the gray squirrel. Physiol. Zool. 45, 54–59.
Bowers, J. R. (1971). Resting metabolic rate in the cotton rat Sigmodon. Physiol. Zool. 44, 137>–147
Bozinovic, F., and Rosenmann, M. (1988). Comparative energetics of South American cricetid rodents. Comp. Biochem. Physiol. A 91, 195–202.
Bradley, W. G., and Yousef, M. K. (1975). Thermoregulatory responses of the plains pocket gopher, Geomys bursaris. Comp. Biochem. Physiol. A 52, 35–38.
Brower, J. E., and Cade, T. J. (1966). Ecology and physiology of Napaeozapus insignis (Miller) and other woodland mice. Ecology 47, 46–63.
Casey, T. M., Withers, P. C., and Casey, K. K. (1979). Metabolic and respiratory responses of Arctic mammals to ambient temperature during summer. Comp. Biochem. Physiol. A 64, 331–341.
Chappell, M. A., and Bartholomew, G. A. (1981a). Activity and thermoregulation of the antelope ground squirrel, Ammospermophilus leucurus, in winter and summer. Physiol. Zool. 54, 215–223.
Chappell, M. A., and Bartholomew, G. A. (1981b). Standard operative temperature and thermal energetics of the antelope ground squirrel Ammospermophilus leucurus. Physiol. Zool. 54, 81–93.
Collins, B. G. (1973). The ecological significance of thermoregulatory responses to heat stress shown by two populations of an Australian murid, RattusJuscipes. Comp. Biochem. Physiol. A 44, 1129–1140.
Collins, B. G., and Bradshaw, S. D. (1973). Studies on the metabolism, thermoregulation and evaporative water losses of two species of Australian rats, Rattus villosissimus and Rattus rattus. Physiol. Zool. 46, 1–21.
Dawson, T. J., and Fanning, F. D. (1981). Thermal and energetic problems of semiaquatic mammals: a study of the Australian water rat (Hydromys chrysogaster), including comparisons with the platypus (Ornithorhynchus anatinus). Physiol. Zool. 54, 285–296.
Downs, C. T., and Perrin, M. R. (1990). Thermal parameters of four species of Gerbillurus. J. Therm. Biol. 15, 291–300.
Downs, C. T., and Perrin, M. R. (1994). Comparative aspects of the thermal biology of the short-tailed gerbil, Desmodillus auricularis, and the bushveld gerbil, Tatera leucogaster. J. Therm. Biol. 19, 385–392.
Du Plessis, A., Erasmus, T., and Kerley, G. I. H. (1989). Thermoregulatory patterns of two sympatric rodents: Otomys unisulcatus and Parotomys brantsii. Comp. Biochem. Physiol. A 94, 215–220.
Duxbury, K. J., and Perrin, M. R. (1992). Thermal biology and water turnover rate in the Cape gerbil, Tatera afra (Gerbillidae). J. Therm. Biol. 17, 199–208.
Geiser, F. (1988). Reduction of metabolism during hibernation and daily torpor in mammals and birds: temperature effect or physiological inhibition? J. Comp. Physiol. B 158, 25–38.
Glenn, M. E. (1970). Water relations in three species of deer mice (Peromyscus). Comp. Biochem. Physiol. 33, 231–248.
Golightly, R. T., and Ohmart, R. D. (1978). Heterothermy in free-ranging Abert’s squirrels (Sciurus aberti). Ecology 59, 897–909.
Goyal, S. P., Ghosh, P. K., and Prakash, I. (1981). Energetic aspects of adaptation in the Indian desert gerbil Meriones hurrianaeijerdon. J. Arid Environ. 5, 69–75.
Haim, A. (1987). Metabolism and thermoregulation in rodents: are these adaptations to habitat and food quality. S. Afr. J. Anim. Sci. 83, 639–642.
Haim, A., and Fourie, F. L. R. (1980). Heat production in nocturnal (Praomys natalensis) and diurnal (Rhabdomys pumilio) South African murids. S. Afr. J. Anim. Zool. 15, 91–94.
Haim, A., and Izhaki, I. (1993). The ecological significance of resting metabolic rate and non-shivering thermogenesis for rodents. J. Therm. Biol. 18, 71–81.
Haim, A., Racey, P. A., Speakman, J. R., Ellison, G. T. H., and Skinner, J. D. (1991). Seasonal acclimatization and thermoregulation in the pouched mouse Saccostamus canestris. J. Therm. Biol. 16, 13–17.
Haim, A., van Aarde, R. J., and Skinner, J. D. (1990). Metabolism and thermoregulation in the Cape porcupine, Hystrix africaeaustralis. Physiol. Zool. 63, 795–802.
Hart, J. S. (1971). “Rodents,” in Comparative Physiology of Thermoregulation, Vol. II, ed. G. C. Whittow (New York: Academic Press), 1–149.
Hill, R. W. (1975). Metabolism, thermal conductance, and body temperature in one of the largest species of Peromyscus, P. pirrensis. J. Therm. Biol. 1, 109–112.
Hill, R. W., and Hooper, E. T. (1971). Temperature regulation in mice of the genus Scotionomys. J. Mammal. 52, 806–816.
Hinds, D. S., and MacMillen, R. E. (1985). Scaling of energy metabolism and evaporative water loss in heteromyid rodents. Physiol. Zool. 58, 282–298.
Hinds, D. S., and Rice-Warner, C. N. (1992). Maximum metabolism and aerobic capacity in heteromyid and other rodents. Physiol. Zool. 65, 188–214.
Hissa, R. (1970). Calorigenic effect of noradrenaline in Norwegian lemmings, Lemmus lemmus (L.). Experientia 26, 266–267.
Hooper, E. T., and Hilali, M. E. (1972). Temperature regulation and habits in two species of jerboa, genus Jaculus. J. Mammal. 53, 574–593.
Hudson, J. W., Deavers, D. R., and Bradley, S. R. (1972). A comparative study of temperature regulation in ground squirrels with special reference to the desert species. Symp. Zool. Soc. Lond. 31, 191–213.
Ishii, K., Kuwahara, M., Tsubone, H., and Sugano, S. (1996). The telemetric monitoring of heart rate, locomotor activity, and body temperature in mice and voles (Microtus arvalis) during ambient temperature changes. Lab. Anim. 30, 7–12.
Jones, D. L., and Wang, L. C. H. (1976). Metabolic and cardiovascular adaptations in western chipmunks, genus Eutamias. J. Comp. Physiol. 105, 219–231.
Kenagy, G. J., and Vleck, D. (1982). “Daily temporal organization of metabolism in small mammals: adaptation and diversity,” in Vertebrate Circadian Systems: Structure and Physiology, eds J. Aschoff, S. Daan, and G. A. Groos (Berlin: Springer-Verlag), 322–338.
Layne, J. N., and Dolan, P. G. (1975). Thermoregulation, metabolism, and water economy in the golden mouse (Ochrotomys nuttalli). Comp. Biochem. Physiol. A 52, 153–163.
Lovegrove, B. G. (2003). The influence of climate on the basal metabolic rate of small mammals: a slow-fast metabolic continuum. J. Comp. Physiol. B 173, 87–112.
Lovegrove, B. G., Heldmaier, G., and Knight, M. (1991). Seasonal and circadian energetic patterns in an arboreal rodent, Thallomys paedulcus, and a burrow-dwelling rodent, Aethomys namaquensis, from the Kalahari Desert (South Africa). J. Therm. Biol. 16, 199–210.
MacMillen, R. E., Baudinette, R. V., and Lee, A. K. (1972). Water economy and energy metabolism of the sandy inland mouse, Leggadina hermannsbergensis. J. Mammal. 53, 529–539.
MacMillen, R. E., and Lee, A. K. (1970). Energy metabolism and pulmocutaneous water loss of Australian hopping mice. Comp. Biochem. Physiol. A 35, 355–369.
Mazen, W. S., and Rudd, R. L. (1980). Comparative energetics in two sympatric species of Peromyscus. J. Mammal. 61, 573–574.
McDevitt, R. M., and Speakman, J. R. (1996). Summer acclimatization in the short-tailed field vole, Microtus agrestis. J. Comp. Physiol. B 166, 286–293.
McNab, B. K. (1970). Body weight and the energetics of temperature regulation. J. Exp. Biol. 53, 329–348.
McNab, B. K. (1979a). Climatic adaptation in the energetics of heteromyid rodents. Comp. Biochem. Physiol. A 62, 813–820.
McNab, B. K. (1979b). The influence of body size on the energetics and distribution of fossorial and burrowing mammals. Ecology 60, 1010–1021.
McNab, B. K. (1986). The influence of food habits on the energetics of eutherian mammals. Ecol. Monogr. 56, 1–20.
McNab, B. K. (1988). Complications inherent in scaling the basal rate of metabolism in mammals. Q. Rev. Biol. 63, 25–54.
McNab, B. K. (1992). The comparative energetics of rigid endothermy: the Arvicolidae. J. Zool. 227, 585–606.
Pagel, M. (1994). Detecting correlated evolution on phylogenies: a general method for the comparative analysis of discrete characters. Proc. R. Soc. Lond., B. 255, 37–45.
Pagel, M. (2002). “Modeling the evolution of continuously varying characters on phylogenetic tree. The case of hominid cranial capacity,” in Morphology, Shape and Phylogeny, Chapter 13, eds , (London: Taylor and Francis), 64, 268–286.
Pauls, R. W. (1981). Energetics of the red squirrel: a laboratory study of the effects of temperature, seasonal acclimation, use of the nest and exercise. J. Therm. Biol. 6, 79–86.
Pearson, O. P. (1960). The oxygen consumption and bioenergetics or harvest mice. Physiol. Zool. 33, 152–160.
Reinking, L. N., Kilgore, D. L. Jr., Fairbanks, E. S., and Hamilton, J. D. (1977). Temperature regulation in normothermic black–tailed prairie dogs, Cynomys ludovicianus. Comp. Biochem. Physiol. A 57, 161–165.
Rosenmann, M., Morrison, P. R., and Feist, P. (1975). Seasonal changes in the metabolic capacity of red-backed voles. Physiol. Zool. 48, SOS-SIS.
Saarela, S., and Hissa, R. (1993). Metabolism, thermogenesis and daily rhythm of body temperature in the wood lemming, Myopus schisticolor. J. Comp. Physiol. B 163, 546–555.
Scheck, S. H. (1982). A comparison of thermoregulation and evaporative water loss in the hispid cotton rat, Sigmodon hispidus texianus, from northern Kansas and south-central Texas. Ecology 63, 361–369.
Shkolnik, A., and Borut, A. (1969). Temperature and water relations in two species of spiny mice (Acomys). J. Mammal. 50, 245–255.
Tannenbaum, M. G., and Pivorun, E. B. (1988). Seasonal study of daily torpor in southeastern Peromyscus maniculatus and Peromyscus leucopus from mountains and foothills. Physiol. Zool. 61, 10–16.
Tomasi, T. E. (1985). Basal metabolic rates and thermoregulatory abilities in 4 small mammals. Can. J. Zool. 63, 2534–2537.
Viljoen, S. (1985). Comparative thermoregulatory adaptations of southern African tree squirrels from four different habitats. S. Afr. J. Zool. 20, 28–32.
Wang, L. C., and Hudson, J. W. (1971). Temperature regulation in normothermic and hibernating eastern chipmunk, Tamias striatus. Comp. Biochem. Physiol. A 31, 59–90.
Weiner, J., and Gorecki, A. (1981). Standard metabolic rate and thermoregulation in 5 species of Mongolian small mammals. J. Comp. Physiol. B 145, 127–132.
Whitford, W. G., and Conley, M. I. (1971). Oxygen consumption and water metabolism in a carnivorous mouse. Comp. Biochem. Physiol. A 40, 797–803.
Willems, N. J., and Armitage, K. B. (1975). Thermoregulation and water requirements in semiarid and montane populations of the least chipmunk Eutamias minimus. Comp. Biochem. Physiol. A 51, 717–722.
Yousef, M. K., Johnson, H. D., Bradley, W. G., and Seif, S. M. (1974). Tritiated water-turnover rate in rodents: desert and mountain. Physiol. Zool. 47, 153–162.
Keywords: Rodentia, Bayesian inference, correlated evolution
Citation: Sobrero R, May-Collado LJ, Agnarsson I and Hernández CE (2011) Expensive brains: “brainy” rodents have higher metabolic rate. Front. Evol. Neurosci. 3:2. doi: 10.3389/fnevo.2011.00002
Received: 15 February 2011; Accepted: 15 June 2011;
Published online: 18 July 2011.
Edited by:
Lisa M. Renzi, The University of Georgia, USAReviewed by:
Andrew C. Gallup, Princeton University, USAEdwin M. Nemoto, University of New Mexico, USA
Copyright: © 2011 Sobrero, May-Collado, Agnarsson and Hernández. This is an open-access article subject to a non-exclusive license between the authors and Frontiers Media SA, which permits use, distribution and reproduction in other forums, provided the original authors and source are credited and other Frontiers conditions are complied with.
*Correspondence: Raúl Sobrero, Departamento de Ecología, Pontificia Universidad Católica de Chile, Casilla 114-D, Santiago, Chile. e-mail: rsobrero@bio.puc.cl