1
Brain Research Unit, Low Temperature Laboratory, Aalto University School of Science and Technology, Espoo, Finland
2
Department of Biomedical Engineering and Computational Science, Aalto University School of Science and Technology, Espoo, Finland
3
Department of Clinical Neurophysiology, Helsinki University Central Hospital, Helsinki, Finland
To take a step towards real-life-like experimental setups, we simultaneously recorded magnetoencephalographic (MEG) signals and subject’s gaze direction during audiovisual speech perception. The stimuli were utterances of /apa/ dubbed onto two side-by-side female faces articulating /apa/ (congruent) and /aka/ (incongruent) in synchrony, repeated once every 3 s. Subjects (N = 10) were free to decide which face they viewed, and responses were averaged to two categories according to the gaze direction. The right-hemisphere 100-ms response to the onset of the second vowel (N100m’) was a fifth smaller to incongruent than congruent stimuli. The results demonstrate the feasibility of realistic viewing conditions with gaze-based averaging of MEG signals.
Rapid development of noninvasive brain imaging now allows to progress towards natural experimental setups that mimic real-life conditions. One challenge in using such complex settings is to pick up and average responses with respect to relevant stimuli. The measured brain signals can be analyzed with blind-source-separation techniques that do not require previous information about stimulus timing; for example, independent component analysis (ICA) discriminates patterns of brain activity that can then be correlated with the actual stimuli (Malinen et al., 2007
). Moreover, reverse correlation has been applied in functional magnetic resonance imaging (fMRI) studies with natural visual stimuli, e.g. a movie: activations of a brain area of interest were continuously monitored, and when the signal exceeded a certain threshold, the preceding event in the movie was examined (Hasson et al., 2004
). In addition to the classification methods that are based on recorded brain activity, the subject’s gaze during free viewing can be tracked and used for selective averaging of brain responses according to the sites that the subject is gazing at, and therefore most likely paying attention to.
In animal studies, gaze direction has been measured simultaneously with neural responses to ensure that the animal is fixating to a target (see e.g. Motter and Poggio, 1990
; Werner-Reiss et al., 2003
); many of these studies applied magnetic search-coil technique. In human fMRI studies, eye tracking devices have been utilized to detect pupil size (Sterpenich et al., 2006
), anti-saccades (Manoach et al., 2007
), and fixation (Heinen et al., 2006
). Both electroencephalographic (EEG) and magnetoencephalographic (MEG) signals have previously been averaged time-locked to saccades detected with electro-oculogram (EOG) (see e.g. Jousmäki et al., 1996
; Evdokimidis et al., 2001
), but response categorization on the basis of gaze direction during free viewing requires more accurate eye tracking than is possible to reach with EOG only (as in Graupner et al., 2007
). Our current aim was to introduce a novel free-viewing paradigm to MEG, by using eye tracking to average responses to stimuli of interest. Such a combination would be useful in many brain imaging studies that use naturalistic stimuli.
To test the feasibility of gaze-direction-based selective averaging of MEG signals, we monitored the subject’s gaze direction with an MEG-compatible eye tracker system. As test material we used the well-known McGurk illusion (McGurk and MacDonald, 1976
): viewing incongruent articulatory movements with synchronized speech sounds result in a modified percept that the subjects refer to occur in the auditory modality. Audiovisual integration is important in language and communication, e.g. visual information lets the subjects identify syllables faster (Besle et al., 2004
) and in a noisy environment to better comprehend speech (Sumby and Pollack, 1954
). Many types of visual information can affect sound-related activity of the auditory areas, as has been shown both in animals and humans (Bulkin and Groh, 2006
; Stekelenburg and Vroomen, 2007
). In a previous MEG study, incongruent audiovisual stimuli (acoustic /pa/ +visual /ka/, perceived as /ta/ or /ka/) presented among more frequent congruent stimuli (acoustic /pa/ +visual /pa/) elicited a mismatch response in the auditory cortex (Sams et al., 1991
) as an indication of the access of the visual speech to the auditory cortex. These early results have been confirmed in other MEG and EEG recordings (Colin et al., 2002
, 2004
; Saint-Amour et al., 2007
). Differences have been demonstrated between EEG responses to congruent and incongruent audiovisual stimuli at about 50 and 155 ms (Klucharev et al., 2003
; Lebib et al., 2003
). fMRI studies have shown that silent lip-reading can activate the auditory cortex in the absence of voice (Calvert et al., 1997
; Pekkola et al., 2005
).
In the present study, audiovisual stimuli evoking the McGurk illusion were used to demonstrate the feasibility of the gaze-direction-based MEG averaging. The setup enabled testing of the gaze-direction-based selective averaging in a well-controlled environment before introducing more complex natural stimuli. We expected differences between responses to the congruent and incongruent stimuli after the perceptual conflict in the auditory and visual inputs. Any such differences between the conditions would show that natural viewing, combined with gaze-direction-based selective averaging, is feasible in MEG recordings.
Subjects
Ten Finnish-speaking volunteers (four females, six males; aged 21–29 years, mean 24.5) with normal or corrected-to-normal vision and normal self-reported hearing participated in the experiments. These subjects were selected after behavioural screening, by excluding subjects whose percepts did not differ between congruent and incongruent stimuli. Nine subjects were right-handed [mean ± SEM 74 ± 4; range 50–90 on the Edinburgh Handedness Inventory (Oldfield, 1971
)] and one was ambidextrous (score −40). Informed consent was obtained from each subject after a full explanation of the study. The MEG recordings had prior approval by the Ethics Committee of Hospital District of Helsinki and Uusimaa.
Stimuli
Auditory and visual speech stimuli in auditory, visual, and audiovisual conditions were delivered with Presentation™ (www.neurobs.com
; version 11.0) software once every 3 s. The auditory stimulus (duration 594 ms) was always /apa/ spoken by a female voice and presented through plastic tubes and earpieces to both ears (see Figure 1
). The sound intensity was adjusted individually to the highest comfortable listening level and balanced between ears. The visual stimuli were presented with a VistaPro 1300 DLP projector (Electrohome/Christie Digital Systems Inc., Cypress, California, USA) on a back-projection screen placed at 117-cm distance in front of the subject. The visual stimuli consisted of two adjacent 4 deg × 7 deg (width × height) images of the same female face; the centers of the images were 11 deg apart from each other. One of the faces articulated /apa/ and the other articulated /aka/ (see Figure 1
). Between the stimulus presentations, the same faces, now still, stayed on the screen. The moving stimuli followed the still images smoothly without any pause.
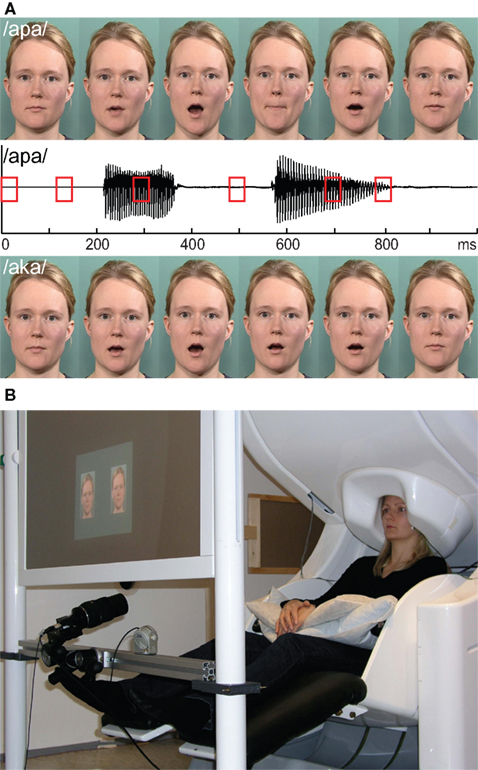
Figure 1. Stimuli and measurement. (A) Auditory /apa/ waveform, and six frames of the corresponding congruent /apa/ and incongruent /aka/ visual stimuli. Red squares on the auditory waveform indicate the time of the corresponding frame shown in the video sequence. (B) An example of the experimental setup. The subject is sitting under the MEG sensor helmet and the visual stimulus is reflected on the back-projection screen; the eye tracker system is attached to the stand below the screen.
The stimuli were presented in four about 10-min blocks. Two of these blocks comprised the /apa/-articulating face on the left and the /aka/-articulating face on the right, and vice versa in the two other blocks. The order of the blocks was counterbalanced across subjects.
Each block contained three stimulus conditions. In the auditory condition, the voice /apa/ was presented while the faces stayed still. In the visual (control) condition, the faces, one articulating /apa/ and the other /aka/, were presented without the voice. In the audiovisual condition, the voice /apa/ was presented, so that the face articulating /apa/ was congruent and the face articulating /aka/ was incongruent with the auditory stimulus. Within each of the four blocks, the three conditions (auditory, visual, audiovisual) were presented in a random order.
The auditory and visual stimuli were synchronized: the voice started 134 ms after the first mouth movement, and the second vowel started at 486 ms. A pause of 202 ms, corresponding to the consonant /p/, separated these sounds (see Figure 1
). The proportion of incongruent stimuli, depending on the gaze pattern of the subject, varied from 43% to 56% (mean 51%).
The subjects were instructed to view the mouth areas of the faces, and at the same time to concentrate on what they heard. They were asked to view both faces for about the same amount of time, but were free to decide where to gaze at. Subjects were asked to avoid changing the gaze direction during the stimuli. At the end of the experiment, they were interviewed about their percepts.
MEG Recordings
Cortical responses were recorded with a 306-channel neuromagnetometer (Vectorview, Elekta-Neuromag Oy; Helsinki, Finland) in a magnetically shielded room (MSR) (Euroshield Oy, Eura, Finland) at the Brain Research Unit of the Low Temperature Laboratory, Aalto University School of Science and Technology. Each of the 102 sensor units of the device, arranged in a helmet-shaped array, comprises two orthogonal planar gradiometers and one magnetometer.
The locations of the four head position indicator coils in relation to anatomic landmarks, i.e. the preauricular points and the nasion, were determined with a three-dimensional digitizer. The head position was measured before each block of the experiment by leading current to the coils and measuring the resulting magnetic fields with the MEG sensor helmet.
The subjects were asked to avoid head movements during the whole experiment and to prefer blinking during the intervals rather than during the stimuli. Diagonal EOG, from electrodes over the right eyebrow and under the left eye, was recorded to monitor eye blinks and eye movements, to be used in off-line EOG-based rejection of single traces with a threshold of 150 μV. Averaged EOGs were also examined to detect any systematic eye movements that could have contaminated the averaged MEG responses.
The MEG and EOG signals were band-pass filtered through 0.03–167 Hz and digitized at 600 Hz. Interference originating outside the sensor helmet was suppressed with spatiotemporal signal space separation method (tSSS; Taulu and Simola, 2006
) by using MaxFilter software (Elekta-Neuromag Oy; Helsinki, Finland).
Eye Tracking
An iView X™ MEG eye tracker (SMI; Berlin, Germany) was used to detect the direction of the gaze to indicate which of the two faces the subject was viewing. The device comprises an infrared camera with an infrared light source and the iView X™ software, and it allows gaze direction to be detected with 0.5–1° accuracy. The gaze was tracked with video-oculography based on dark-pupil–corneal-reflection method. The eye tracker was calibrated by asking the subjects first to fixate at nine points that covered the stimulus area; the calibration was checked before each block. The eye tracking signals were sampled at 50 Hz.
During the recordings, the eye tracker generated two TTL-level output signals, one indicating when the subject’s gaze was inside one of the two regions of interest (ROIs) and another one when the subject’s gaze was inside the other ROI (see Figure 2
). These output signals were used for gaze-direction based MEG averaging. A separate trigger pulse, sent before the stimulus presentation, served as the exact timer for MEG averaging. Thus MEG signals were averaged selectively according to the gaze position, and time-locked to the stimuli.
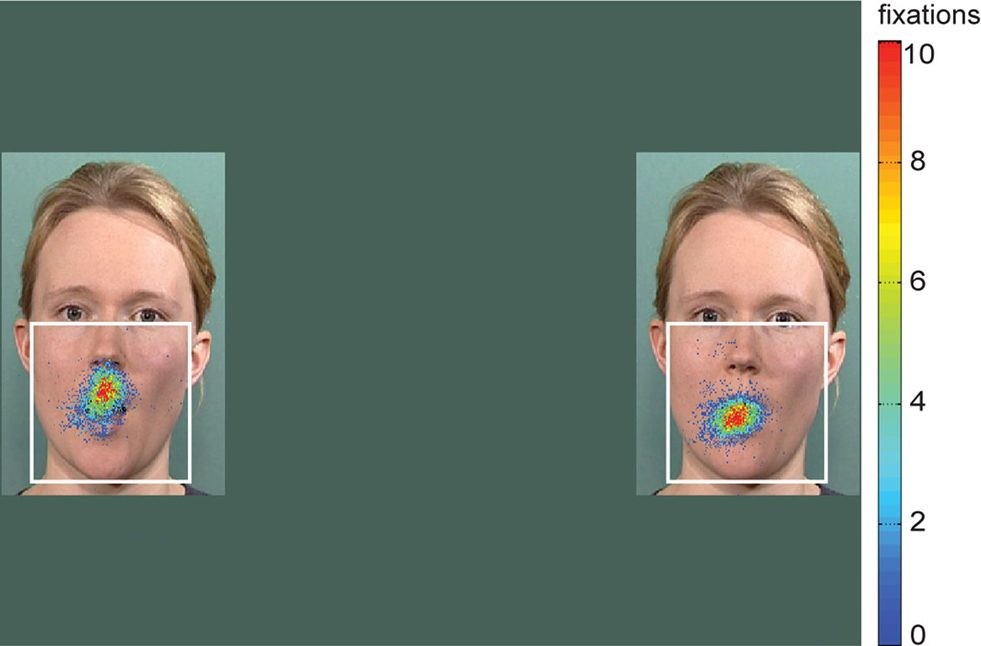
Figure 2. A typical gaze map. Colours represent the number of fixations to a given point, red colour showing the areas with most fixations. ROIs are marked with white squares.
Magnetic noise originating from the eye tracker was measured before the actual experiment. The amplitude spectra of MEG signals collected from the empty MSR were compared with those recorded when the eye tracker was inside the MSR and with power on. Noise-free distance for the eye tracker was defined by recording MEG signals with the eye tracker placed at different distances from the MEG sensor helmet.
Data Analysis
For the auditory and visual conditions, a minimum of 60 MEG responses were averaged, and for the audiovisual conditions, at least 100 responses, within a time window from −200 ms to 1000 ms with respect to the onset of the visual stimulus video sequence. All responses in the auditory condition were collected into one average. In the audiovisual and visual conditions, responses were collected into two separate bins based on the subject’s gaze direction and thus based on the articulation that subject saw.
The MEG signals were analyzed according to a commonly used approach (for a review, see Hämäläinen et al., 1993
; Hari, 2004
): the averaged responses were digitally low-pass filtered at 40 Hz, and a 200-ms pre-stimulus baseline was applied for amplitude measurements. The signal distributions obtained by the 204 gradiometers were modelled with two current dipoles that were identified by a least-squares-fit around the peak of the 100-ms onset response (N100m) in the auditory condition, using a subselection of about 24 MEG channels over each hemisphere. At the N100m peak, the goodness-of-fit of the two-dipole model was 90–97% in all subjects for the subselection of 2 × 24 channels that were used for modelling. These dipoles were then used as spatial filters to explain the measured signals originating from auditory cortex in the audiovisual and visual conditions, and the resulting source waveforms were compared between the conditions. The peak latencies and amplitudes of the N100m response (about 100-ms after the first vowel onset) and N100m’, denoting the N100m response to the second vowel onset, as well as the integral from 50 to 250 ms after second vowel onset, were measured from the source waveforms. Student’s paired t-test was used to assess the statistical significance of differences between the conditions.
Percepts
Eight out of ten subjects experienced the McGurk illusion during the audiovisual condition. The subjects’ descriptions of the incongruent audiovisual stimuli ranged from /ata/ (3/10 subjects) through a mixed or changing percept (5/10) to only a small difference in the hardness of the middle consonant (2/10). The audiovisual effect, i.e. replacements of the middle consonant partly or fully, was strong in five subjects. Although the number of subjects is too small for statistical comparisons between subgroups, we did not note any systematic relationship between the viewing behaviour and the strength of the perceived illusion.
Gaze Maps
Eye tracking was successful in all ten subjects during MEG measurements and thus the gaze direction could be used to average MEG signals. Figure 2
shows the gaze map of a typical subject. The selected 3 deg × 3 deg ROIs, used for detection of gaze direction and thereby for classification of the brain responses, covered the mouth areas of the faces, i.e. about a third of the whole face area (see Figure 2
). The fixations concentrated on the mouth areas. Gaze maps of the other nine subjects were similar.
Responses
Figure 3
A shows the spatial distribution of the responses of a typical subject in the auditory condition. The responses are strongest over the temporal lobes of both hemispheres, and they comprise two transient deflections, N100m about 100 ms after the onset of the first vowel and N100m’ about 100 ms after the onset of the second vowel. The spatial and temporal patterns of the responses were very similar in the audiovisual and auditory conditions (see the enlarged responses, Figure 3
B). The responses in the visual condition differ clearly from the responses in the auditory and audiovisual conditions, comprising a transient deflection about 135 ms after the first mouth movement, with strongest amplitudes over the right occipital lobe.
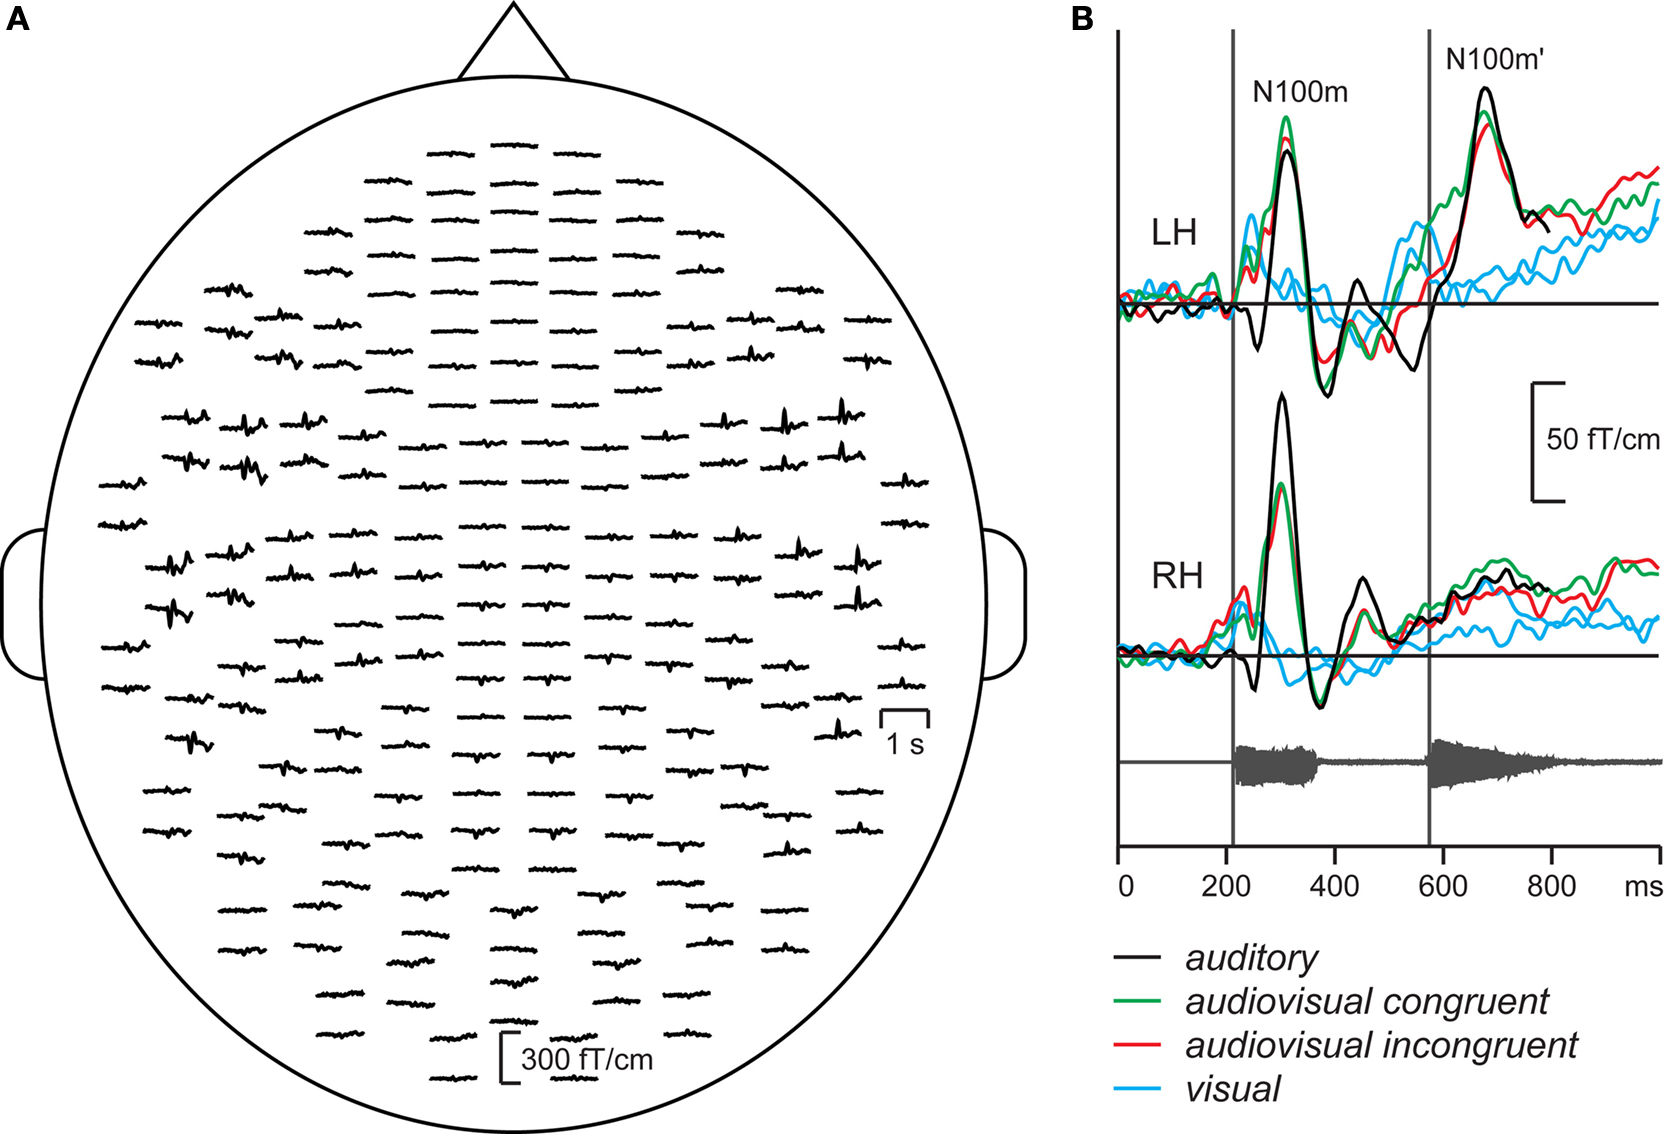
Figure 3. (A) MEG responses of a typical subject to the auditory stimulus, measured with 204 planar gradiometers of the sensor helmet. (B) The strongest responses in auditory condition in left (LH) and right (RH) hemisphere (black lines), and responses in audiovisual congruent, audiovisual incongruent and visual conditions (green, red, and blue lines). The waveform of the auditory stimulus is shown below. The grey vertical lines illustrate the vowel onsets.
Source Waveforms
The estimated sources of N100m, located bilaterally in the supratemporal auditory cortices, were used to explain the whole time course of the auditory responses in all conditions.
Figure 4
A illustrates the mean signal strength from 50 to 250 ms after the second vowel onset, i.e. around the N100m’ response in the incongruent vs. congruent audiovisual conditions (vertical vs. horizontal axis, respectively). In the right hemisphere (RH) of 9 out of the 10 subjects (P = 0.021, binomial test), N100m’ was weaker in the incongruent than the congruent audiovisual condition; the mean ± SEM difference was 19 ± 7% (P = 0.018). In the left hemisphere, no systematic reduction was observed. Figure 4
B shows that mean signal strengths did not differ depending whether the stimuli were presented on the left or on the right side of the screen (differences in peak amplitudes in LH 6 ± 4%, P = 0.15; RH 11 ± 8%, P = 0.19).
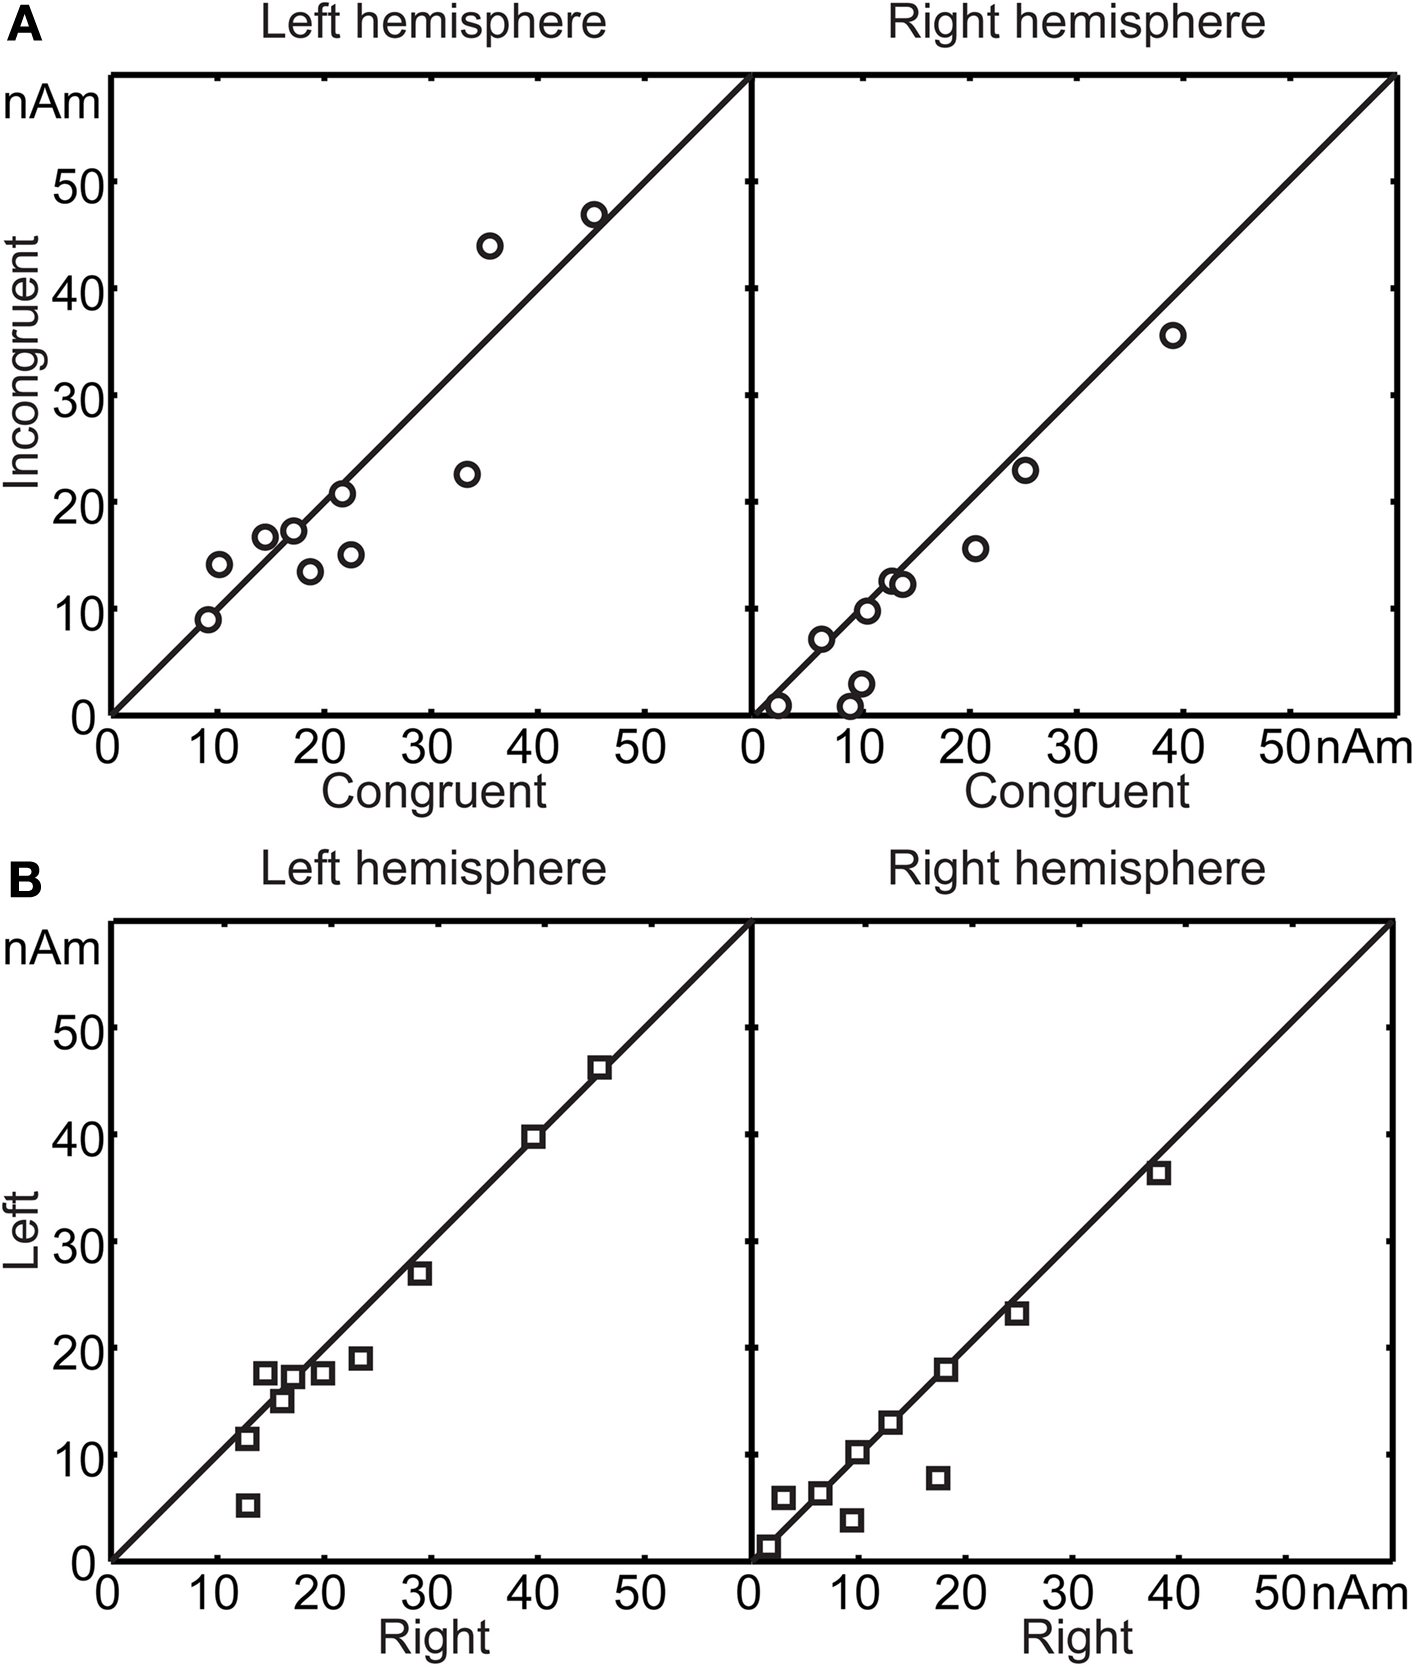
Figure 4. (A) Mean source strengths from 50 to 250 ms after the second vowel onset of each subject in incongruent audiovisual condition, plotted against mean source strengths in congruent audiovisual condition. (B) Similar comparison, with mean source strengths in left viewing plotted against mean source strengths in right viewing.
MEG Artifacts Elicited by Eye Tracker and Free-Viewing Condition
To find out whether the eye tracker would cause some artifacts to the MEG recording, we measured noise levels of the neuromagnetometer with the eye-tracking equipment at different distances from the MEG sensor helmet. At distances larger than 100 cm the eye tracker produced no changes to the amplitude spectra of the MEG signals. The solid lines in Figure 5
show that the spectra with and without the eye tracker are inseparable, and in all cases the noise levels without the subject are far below the “noise” (brain activity) of the subject (dashed line). The distance of 117 cm of the eye tracking device from the MEG sensor helmet in our experiments can thus be considered totally safe.
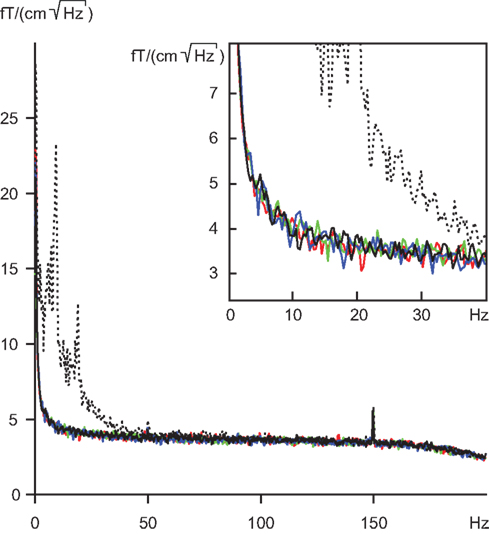
Figure 5. Amplitude spectra of noise; means of 204 gradiometers. Solid lines represent measurements without subject, and dashed line measurement with subject. Black, no eye tracker; blue, green and red lines, eye tracker at 100, 117 and 140 cm distance from the measurement helmet. Insert focuses on the frequency range of 0–40 Hz.
The variation of subjects’ head position with respect to the MEG sensor helmet between the four blocks was at maximum 1.4 ± 0.2 mm (mean ± SEM), 1.3 ± 0.3 mm and 3.7 ± 0.9 mm in x, y, and z directions, respectively.
Feasibility and Applicability of Gaze-Direction-Based Averaging in MEG
Our results indicate the feasibility of eye tracking as a tool for gaze-direction-based MEG averaging. With higher sampling frequency than the 50 Hz applied in our current device, eye tracking will enable more detailed classification of the brain responses and provide a promising means to be used with natural stimuli, such as movies.
Although accurately controlled sensory stimuli are necessary for sophisticated studies of sensory systems, it would be important to validate and complement the obtained results by using more naturalistic stimuli. In such complex conditions, tracking the gaze direction would increase controllability as some brain responses can be related to the viewed area of the visual stimulus. Free viewing would be beneficial in many studies of the neural basis of social interaction and other higher cognitive functions.
McGurk Illusion as a Proof of Concept
We selected the McGurk-illusion-eliciting audiovisual stimuli to show the feasibility of gaze-direction-based MEG averaging. Although still quite limited, our experimental design is rather similar to watching a movie, in which the auditory input originating from fixed locations in space is combined with visual input that depends on the subjects gaze.
The main effect was the reduction of the N100m’ response by 19% in the right auditory cortex to incongruent audiovisual stimuli, compared with congruent audiovisual stimuli. This difference supports the previously shown results about the access of the visual information to the human auditory cortex. Differences between responses to incongruent and congruent auditory and visual vowels have been previously shown at the latency of 50 and 155 ms from the sound onset (Klucharev et al., 2003
; Lebib et al., 2003
). Preceding visual information, i.e. a viseme, has been suggested to provide the context in which the auditory input, a phoneme, is evaluated, and thus to constrain the interactions of auditory and visual speech inputs (van Wassenhove et al., 2005
). The suppression of N100m’ to incongruent, compared with congruent, stimuli could reflect facilitation of auditory processing by visual input: articulation movements could pre-activate cell population in auditory cortex responding to corresponding phoneme. In case of incongruent stimuli, facilitation would be directed to different cell population than the one activated by auditory stimulus, leading to suppressed activation compared with response to congruent stimuli.
In our experimental setting, the differences between responses to the two audiovisual stimuli could, in some subjects, have been contributed by the two visual stimuli as such. Because the silent visual control stimuli were presented in-between the auditory and audiovisual stimuli they may have led the subjects to imagine the voices during the seen articulations. Another possibility is that some other brain area close to the auditory cortex, e.g. the supratemporal sulcus (STS) region, would have reacted differentially to the two visual stimuli, so that the activity was in part explained by dipoles in the auditory cortex. Independently whether the visual input as such would, or would not, affect the responses of the auditory cortex, our main result remains valid: by using the gaze-direction-based MEG averaging we were able to detect differences in brain responses to two congruent and incongruent audiovisual stimuli that differed by articulation movements only.
Analysis and Removal of Artifacts
The eye trackers used in monitoring gaze direction during free viewing need to be specifically designed and tested to fit the requirements of MEG: to avoid artifacts at low, mains, and radio frequencies. Most eye trackers need additional shielding. Our noise measurements indicated that the overall noise level, mainly dominated by ambient noise, did not increase when the eye tracker was in use at about 1-m distance from the sensor helmet. Thus introducing a well-designed eye tracker does not affect the quality of the MEG signals.
In a free-viewing condition, artifacts might arise from head and eye movements. However, the MEG sensor helmet largely restricts an adult subject’s head position, and the required 11 deg changes in the gaze direction between the two faces were easily made without moving the head. A continuous head-tracking system, which was not available for us at the time of the measurements, could be applied in future free-viewing MEG experiments.
Serious contamination might arise from the moving eye balls and eye blinks which both produce strong MEG artifacts (Antervo et al., 1985
). Fortunately, the spatial distributions of visual and auditory responses differ clearly from those of eye movements and blinks, thereby facilitating separation of brain signals and eye-related artifacts. Apparently, gaze-direction-based MEG averaging is best suited for studies in which the response of interest occurs during fixation rather than saccade. As visual information is mostly gathered during fixations (Jonides et al., 1982
), the most artifact-prone saccade periods can be rejected from the analysis, either on the basis of EOG or fast eye-tracking.
In our control analysis responses did not differ during fixation to the left vs. the right face separated by 11 degrees. Eye tracking recordings thus allowed reliable MEG averaging according to gaze direction, and thereby according to the site of the subject’s visual attention.
The research was conducted in the absence of any commercial or financial relationships that could be construed as a potential conflict of interest.
This study was financially supported by the Academy of Finland (National Centers of Excellence Programme 2006–2011), European Union (NEST Programme PERCEPT, Perceptual Consciousness – Explication and Testing, 043261), UI-ART project of the TKK MIDE research programme (Finland), Jenny and Antti Wihuri Foundation and the ERC Advanced Grant (#232946). We thank Jari Kainulainen for expert help in MEG recordings.
Hari, R. (2004). Magnetoencephalography in clinical neurophysiological assessment of human cortical functions. In Electroencephalography. Basic Principles, Clinical Applications and Related Fields, E. Niedermeyer and F. Lopes da Silva, eds. (Philadelphia, Lippincott Williams & Wilkins), pp. 1165–1197.