An automated method for segmenting white matter lesions through multi-level morphometric feature classification with application to lupus
1
The Mind Research Network, Albuquerque, NM, USA
2
Department of Computer Science, The University of New Mexico, Albuquerque, NM, USA
3
Advanced Biomedical Informatics Group LLC, Iowa City, IA, USA
4
Department of Psychology, The University of New Mexico, Albuquerque, NM, USA
5
Radiology Department, Carver School of Medicine, The University of Iowa, Iowa City, IA, USA
6
Rheumatology, Department of Internal Medicine, School of Medicine, The University of New Mexico, Albuquerque, NM, USA
7
Cardiology, Department of Internal Medicine, School of Medicine, The University of New Mexico, Albuquerque, NM, USA
8
Surgical Planning Laboratory, Brigham and Women’s Hospital, Harvard School of Medicine, Boston, MA, USA
We demonstrate an automated, multi-level method to segment white matter brain lesions and apply it to lupus. The method makes use of local morphometric features based on multiple MR sequences, including T1-weighted, T2-weighted, and fluid attenuated inversion recovery. After preprocessing, including co-registration, brain extraction, bias correction, and intensity standardization, 49 features are calculated for each brain voxel based on local morphometry. At each level of segmentation a supervised classifier takes advantage of a different subset of the features to conservatively segment lesion voxels, passing on more difficult voxels to the next classifier. This multi-level approach allows for a fast lesion classification method with tunable trade-offs between sensitivity and specificity producing accuracy comparable to a human rater.
Systemic lupus erythematosus (SLE) is an autoimmune disease affecting multiple tissues, including the brain. Neurologic and psychiatric complications in SLE, subsumed by the term neuropsychiatric SLE (NPSLE), occurs in up to 95% of SLE patients. While MRI often reveals distinct white matter abnormalities in active NPSLE, the pathologic processes underlying these lesions, whether involving autoimmune mechanisms or purely vascular in nature (e.g., hemostasis), are unknown. Nonetheless, accurately measuring brain lesions can contribute substantially to understanding the pathology causing NPSLE. The traditional method of lesion identification in NPSLE involves the expensive and time-intensive manual rating of each image slice by a radiologist. An accurate automated lesion analysis method would reduce the time and costs associated with SLE brain lesion measurement and, hence, facilitate both research studies and the diagnosis of this prevalent disease.
There exists a large body of work focused on segmenting white matter lesions in various disorders such as multiple sclerosis (Van Leemput et al., 2001
; Lao et al., 2006
; Khayati et al., 2008
; Morra et al., 2008
), vascular dementia (Yamashita et al., 2008
), and leukoaraiosis (Kruggel et al., 2008
; Schwarz et al., 2009
), but seldom have these methods been applied to NPSLE. Though white matter lesions appear in the above disorders as hyperintensities in T2-weighted (T2w) MRI images, their etiology differs from NPSLE substantially (Rovaris et al., 2000
; Brey, 2007
). Particularly, MS lesions arise from the autoimmune-mediated disruption of myelin and have an evolution characterized by an early “active” stage [T1-weighted (T1w) MRI contrast enhancing] and later either resolving or chronic (non-enhancing) stages (Rovaris et al., 2000
). While NPSLE is also an autoimmune disease affecting multiple organs, the brain lesions in NPSLE patients appear to arise primarily from thrombotic or embolic infarction, perhaps secondary to vasculitis or heart valve vegetations respectively (Brey, 2007
).
Among the multiple approaches to white matter lesion segmentation that have been tried, multivariate classifiers have shown good agreement with expert manual tracing. Lao et al. (2006)
used a multivariate spotlight approach that included multi-protocol intensities of all voxels in a cube, centered on the voxel in question, as input to support vector machines (SVM). Schwarz et al. (2009)
used Markov random fields to combine spatial distribution and neighborhood intensities. Anbeek et al. (2005)
employed k- nearest-neighbor to incorporate spatial and intensity information. Morra et al. (2008)
attempted to take more of a gestalt approach by generating numerous features including the “intensity, mean filters, standard deviation filters, curvature filters, and haar filters of various shapes” (Morra et al., 2008
) based on the surrounding tissue and then performing feature selection and classification using AdaBoost. Our work attempts to build on these approaches by combining a greater variety of morphometric features that are guided by human rater procedures with a multivariate-classifier to achieve high accuracy.
Overview
Figure 1
outlines the general lesion segmentation protocol from raw data through segmentation.
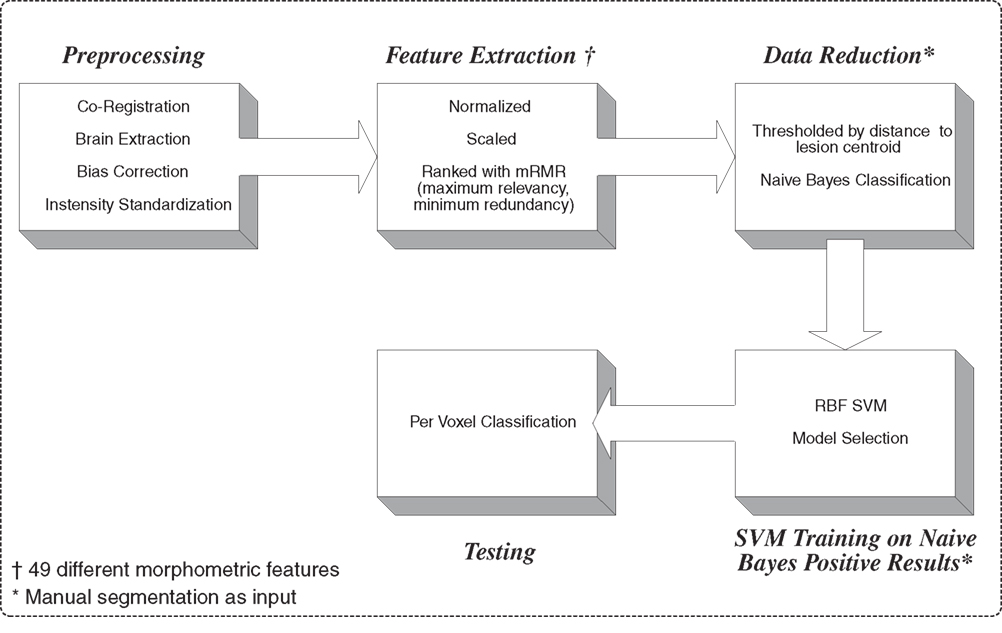
Figure 1. Overview of lesion segmentation protocol.
Data Acquisition
T1w, T2w, and fluid attenuated inversion recovery (FLAIR) images were acquired for 27 subjects with a diagnosis of SLE on a Siemens Sonata 1.5T scanner at The Mind Research Network with sequence parameters as shown in Table 1
. This protocol was selected for compatibility with a standard clinical sequence in use at the University of New Mexico Hospital (UNMH) and clinics where it was originally used for the qualitative analysis of lesion load. The method in this paper was developed to be applied on a standard clinical sequence such as the one employed at UNMH.
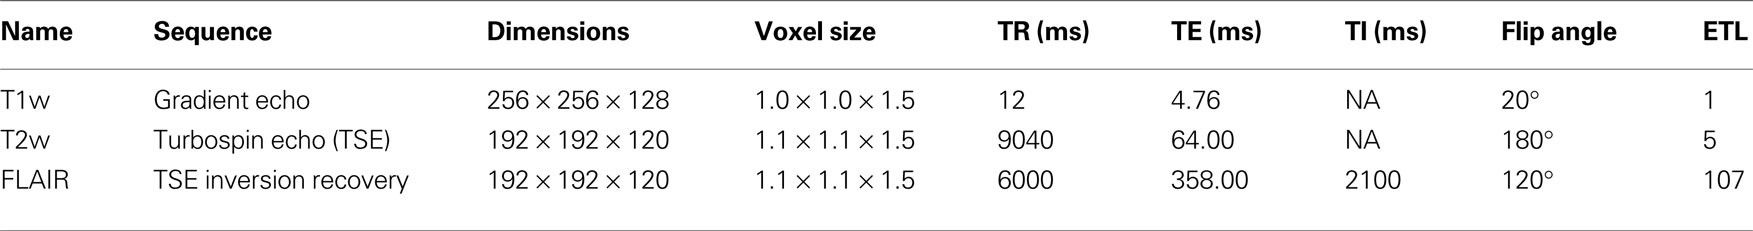
Table 1. Data acquisition details.
Of the 27 subjects collected, 10 subjects were used for training and 17 subjects were reserved for testing. Each subject was evaluated by a neuroradiologist and found to have white matter lesions consistent with SLE with no other obvious neurological issues. All subject data was collected with human subject consent and appropriate approval from the Internal Review Board at the University of New Mexico.
The gold standard lesion segmentation was created via manual tracing of white matter lesions performed by an experienced rater. Raters were requested to review the axial FLAIR images from inferior to superior for visual hyperintensities in the white matter regions. All FLAIR hyperintensities that are regionally bright relative to the surrounding tissue and distant from the ventricles were considered lesions. Lesions that were greater in size than three contiguous voxels were traced by the expert rater. During the identification of the lesion, the rater had the opportunity to refer to the co-registered T1w and T2w images. This was helpful because of the decreased partial volume artifact in the T1w images. For FLAIR hyperintensites that were adjacent to the ventricles, hyperintensities that were significantly hemispherically asymmetric were considered lesion, while hemispherically symmetric hyperintensities were considered to be periventricular artifact. Symmetry was evaluated in a qualitative manner.
Preprocessing
Consistent voxel location and size is required when combining multiple image intensities into a single feature vector. To achieve this all images were resampled to 1mm isotropic resolution using trilinear interpolation. Each subject’s T2w and FLAIR were then registered to the T1w using Matte’s Mutual registration (Ibanez et al., 2005
).
Multiple studies have shown that voxel-based lesion classification is sensitive to B1-field inhomogeneity (Madabhushi and Udupa, 2005
; Jäger et al., 2007
; Jäger and Hornegger, 2009
) within each series acquired on a single subject and between individuals. Multiple solutions have been examined in the literature, but some form of bias correction and intensity standardization is normally employed (Madabhushi and Udupa, 2005
). Bias correction was performed using an implementation of Van Leemput et al.’s (1999)
method due to its ability to incorporate information from multiple MR sequences. After performing bias correction, brain extraction was performed using (Pierson et al., 2009
). Intensity standardization through linear histogram matching, as presented by Nyul et al. (2000)
, was used to separately match each sequence to a reference image to reduce inter-subject intensity variability.
Feature Creation/Ranking
Human raters do not judge lesions solely on intensities, on a voxel-by-voxel basis, independent of their neighbors. The obvious reason is that much of the information that differentiates lesion from non-lesion tissue is contained in the spatial position of the voxel in question, the intensities of its neighbors, the proximity of gray matter, white matter, or CSF tissue, and often the hemispheric symmetry/asymmetry. In order to quantify and incorporate this type of information, 49 different morphometric features were calculated for each voxel. Figure 2
shows a single axial slice, from a single subject, of a subset of the features used.
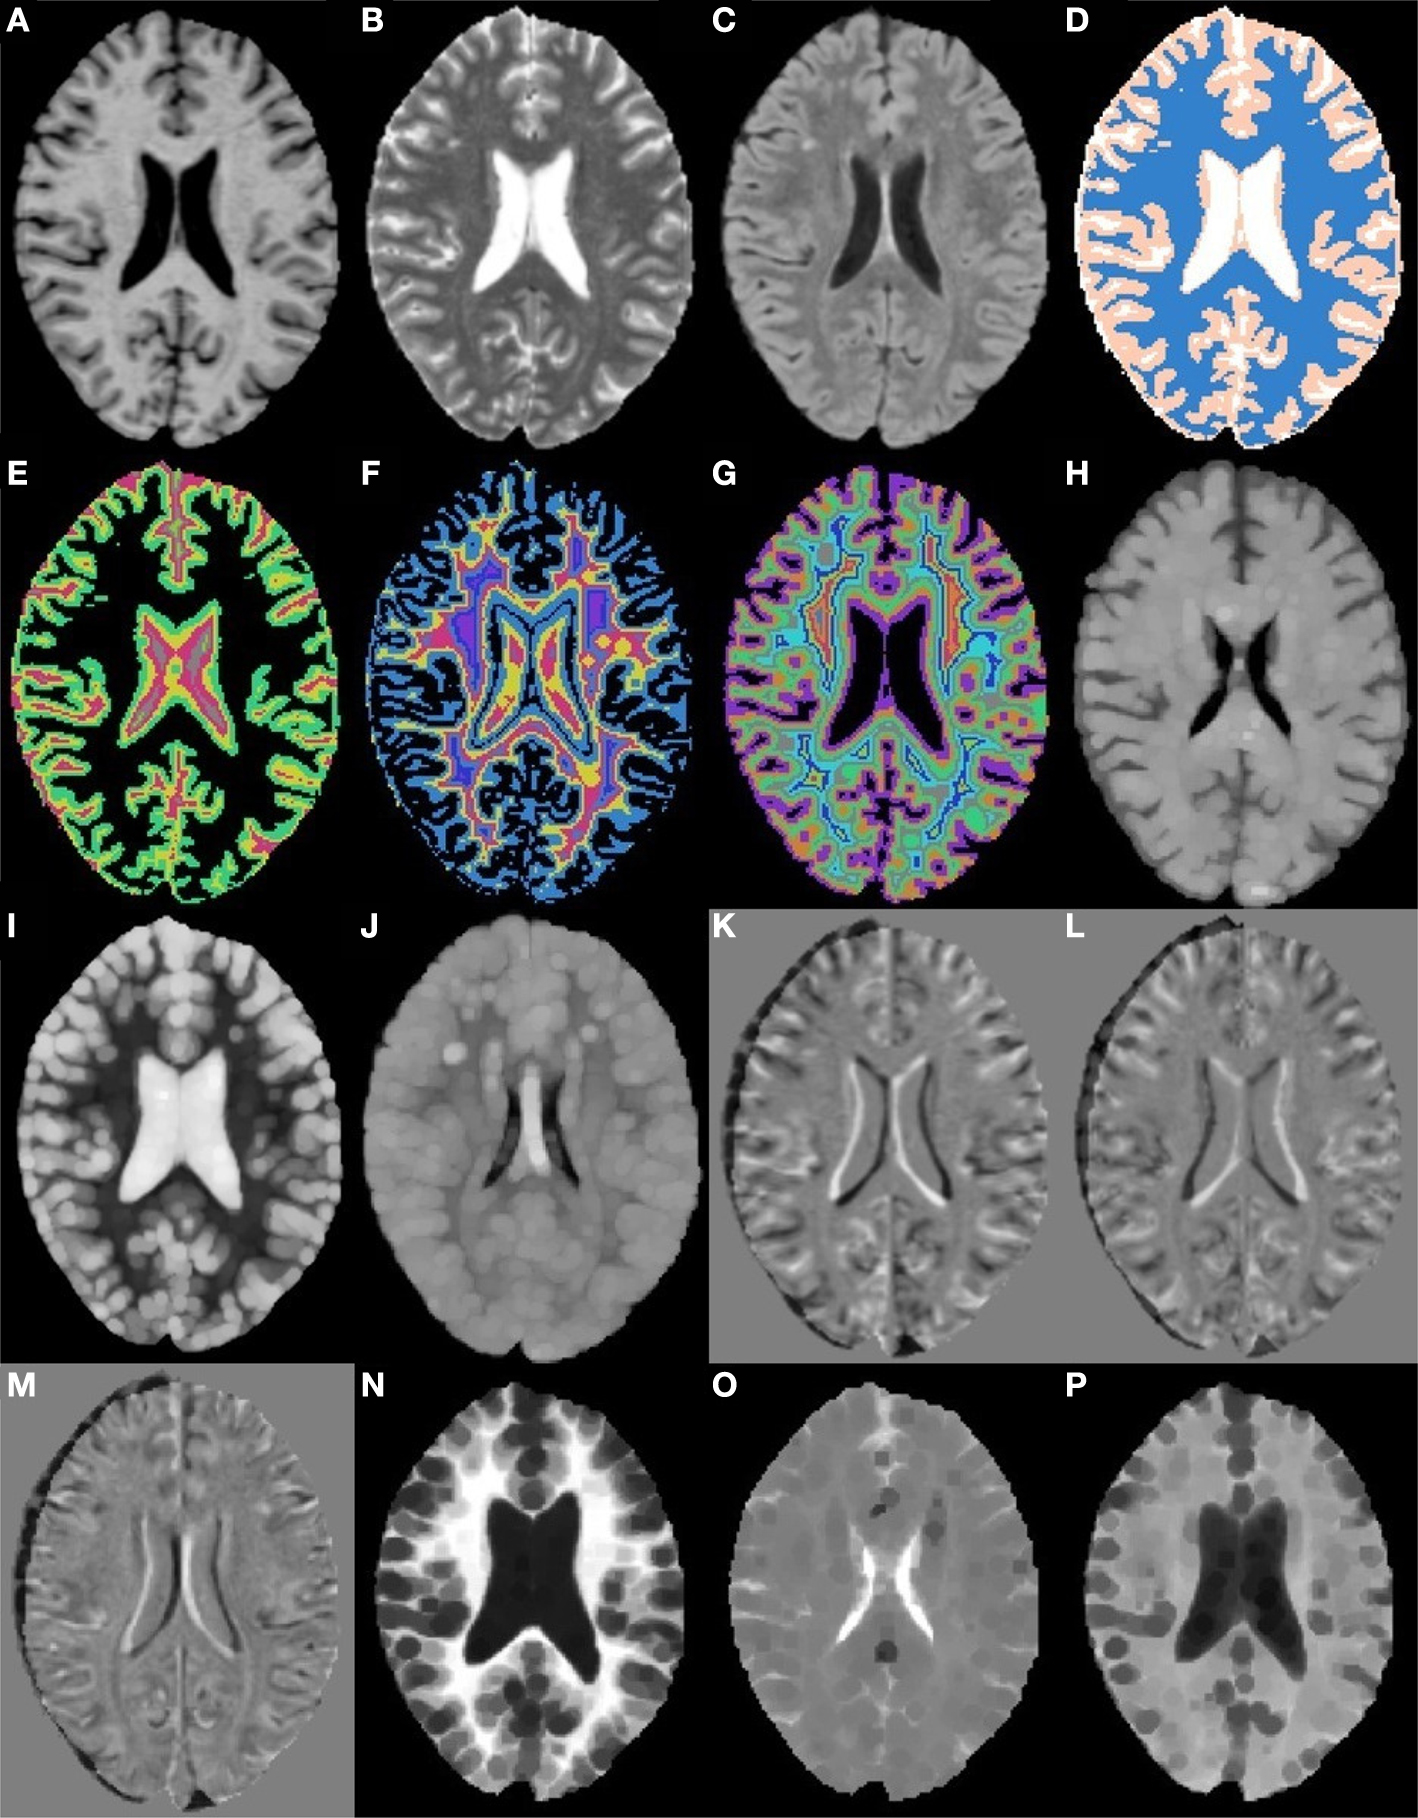
Figure 2. Axial slices from a subset of the 49 morphometric features. (A) T1w. (B) T2w. (C) FLAIR. (D) k-Means segmentation. (E) Distance to white matter. (F) Distance to gray matter. (G) Distance to CSF. (H) T1w grayscale dilation radius 2. (I) T2w grayscale dilation radius 2. (J) FLAIR grayscale dilation radius 2. (K) T1w flipped difference. (L) T2w flipped difference. (M) FLAIR flipped difference. (N) T1w grayscale erosion radius 3. (O) T2w grayscale erosion radius 3. (P) FLAIR grayscale erosion radius 3.
To incorporate some higher level spatial information the first feature calculated was an estimate of the tissue type (gray, white, or CSF), using k-means seeded with appropriate initial means (Figure 2
D). Next, distance maps were calculated for each tissue type, giving a distance from a voxel to the nearest voxel for each tissue type (Figures 2
E–G). The distance maps are meant to incorporate information about tissue type boundaries, such as the transition from white matter to gray matter, as these can affect classification. Since hemispheres are generally sagittally symmetric and lesions are generally hemispherically asymmetric, each image was left–right flipped and subtracted from itself (Combès and Prima, 2008)
(Figures 2
K–M). The purpose of the flipped difference is not to indicate the symmetry of the brain, but to enhance lesion locations which are known to be hemispherically asymmetric. This approach runs the risk of noise at tissue boundaries or near physical abnormalities. Neighborhood means and medians were calculated for neighborhoods with radius 1, 2, and 3 voxels
1
in order to capture some of the surrounding tissues characteristics (not shown). For the final features, dilation and erosion with radius 1, 2, and 3 were performed on each image to quantify information about voxels that may be on the boundaries of lesions (Figures 2
H–P). Finally, to capture some idea of global location the normalized x, y, and z location of each voxel was calculated (not shown). The spatial normalization involved independently calculating the mean and standard deviation of the x, y, and z values for all voxels within the brain, then subtracting the mean and dividing by the standard deviation. Since all brains were AC–PC aligned this form of spatial normalization provides a means of usefully comparing voxel indexes between subjects without registering to a standard space.
All features were quantized and then ranked using maximum relevance, minimum redundancy (mRMR) (Peng et al., 2005
). This method computes the mutual information between each feature and its target, then adds features that are maximally related to the target classification while being minimally related to the features already present. Thus each additional feature should include the greatest amount of new information. Since SVMs are being used to perform the segmentation step, it is not the features themselves that are important but the areas of the feature space defined by the combination of features. The results of ranking the features using mRMR are presented in Table 2
.
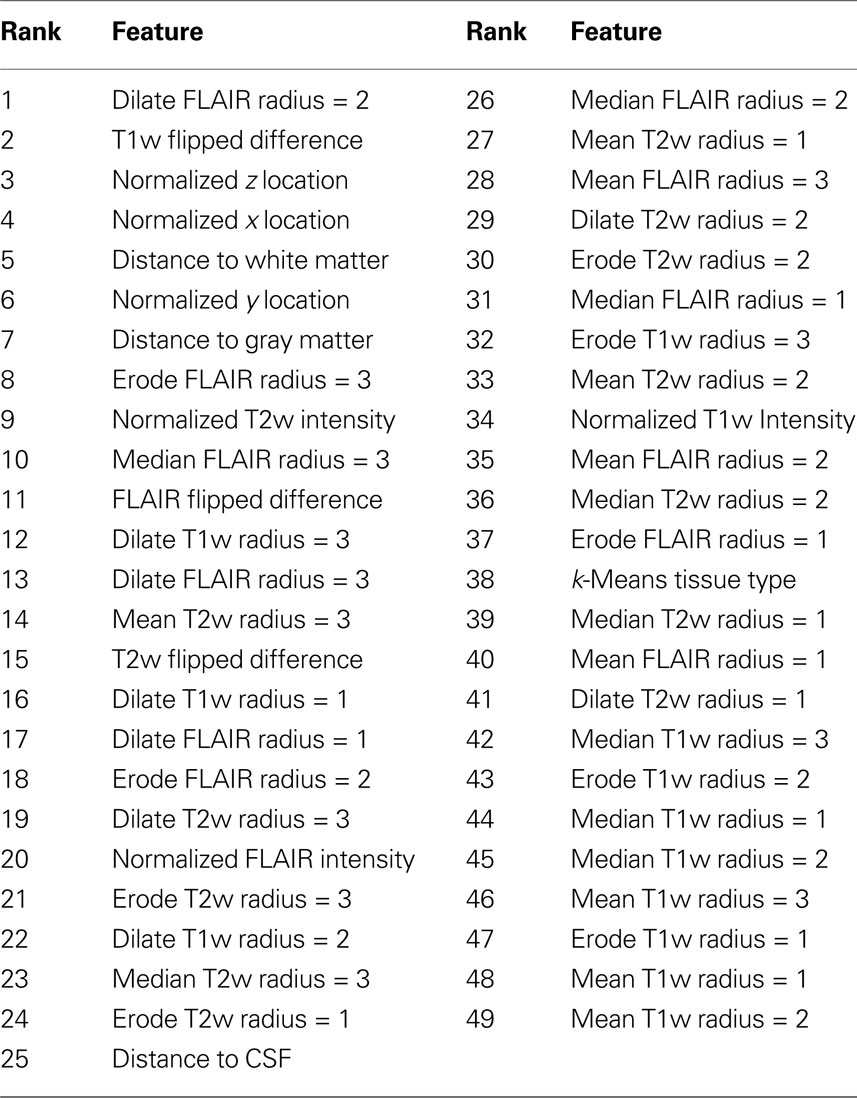
Table 2. Maximum relevance, minimum redundancy feature ranking.
According to the mRMR ranking shown in Table 2
, the FLAIR after grayscale dilation of radius two (Figure 2
J), and the T1w flipped difference (Figure 2
K) are the two most relevant features. The dilation of the FLAIR image is important because it essentially makes the entire lesion cluster match the intensity of the center of the lesion and pushes boundary voxels outside the original lesion dimensions. The T1w flipped difference is relevant because lesions are generally hypo-intense on T1w; so, after subtracting the lesion from the healthy tissue on the opposite side of the brain, the lesion becomes hyper-intense. Since most radiologists use the T1w, the FLAIR, or both when performing their manual segmentations, it is encouraging that features from these two sequences provide the most mutually independent information according to mRMR. The following five most relevant features include the normalized x, y, and z location and the distance to white and gray matter. The presence of the x, y, and z values so high in the rankings demonstrates that the spatial location of lesions is quite informative, and the distance to white and gray matter shows that the location within tissue types is very relevant. Another very interesting property of the ranked features is that the T1w, T2w, and FLAIR intensities provide much less relevant, non-redundant information than many of the calculated morphometric features, implying that the morphometric features enhance the local features providing additional information that improves the ability of the automated algorithm to detect the lesions.
Data Reduction
After brain extraction, the entire training data set comprised of 10 subjects contained over 12 million voxels. Since most nonlinear classifiers have time complexity between O(n log n) and O(n2), reducing the number of samples is required to make the problem computationally tractable. The data is also extremely unbalanced with over 1000 non-lesion voxels to 1 lesion voxel. The problem is thus one of selecting the non-lesion samples that are the most difficult to classify, and then training using those and the lesion samples. To achieve this we created a multi-level elimination process.
Distance threshold
The first reduction step is something of a single class clustering approach. The mean of each feature was calculated for all lesion voxels, and then the maximum distance from any lesion feature vector to the lesion center was found. All non-lesion voxels that were farther from the lesion centroid than this max distance were labeled non-lesion and removed from consideration.
Leave-one-out (LOO) error was calculated for all sets of features numbering 1:49, in mRMR order. The optimum performance was achieved with five features with no false negatives and the highest number of true negatives based on the manual tracing as the gold standard. The reduction at this step was between 2 and 5% which, while not substantial, was shown empirically to improve the performance of the Naive Bayes classifier.
Naive bayesian classifier
After distance thresholding the data, a Naive Bayesian classifier was employed. The number of features used was selected by calculating the LOO rate for an increasing number of features in mRMR order. The best performance was achieved with 34 features. After eliminating any non-lesion voxels that had been correctly classified, only 5% of the data remained. The training set for the SVMs was then composed of all non-lesion voxels incorrectly classified as lesion and all true lesion voxels.
Model Selection
The performance of SVMs is heavily dependent on the kernel selected and the parameters used (Hsu et al., 2003)
. In order to capture non-linearities in the data, the radial basis function kernel was selected. This kernel has two parameters affecting its performance, the Gaussian radius, γ, and the cost, C. Often a grid search is used to exhaustively search the parameter space (Hsu et al., 2003)
. Due to the size of our data set and the difficulty of the decision boundary, an exhaustive search proved too computationally taxing. Instead, a two level, uniform design (Huang et al., 2007)
based search was performed with 13 points in the first level and 9 in the second. The best values for C and γ were selected from the second search level.
While the data reduction stage did bring the lesion and non-lesion classes closer to being balanced, there were still approximately 40 non-lesion voxels for every lesion voxel. To overcome this imbalance, the lesion class was given higher weight while training. This makes mis-classifying a lesion voxel more costly and essentially decreases false negatives at the expense of increased false positives (Yang et al., 2005)
. After the best parameters were identified the SVMs were trained on the data and configured to provide probability estimates. All SVM tasks were performed using libSVM (Chang and Lin, 2001)
.
Figure 3
is the receiver operating characteristic (ROC) curve (Obuchowski, 2003
) which represents the trade-off between sensitivity
2
and specificity
3
that occurs by varying the threshold at which a voxel should be labeled as lesion. The first line in red shows the results based on LOO error, generated by training on 9 subjects and testing on the 10th, repeated for all 10 subjects. The line in green shows the results for the entire hold-out set of 17 subjects. The lowest threshold, 0.001, on the right side of the graph, has a sensitivity of 94.3% and a specificity of 93.1% in the training set and a sensitivity of 94.3% and a specificity of 93.9% on the hold-out set. The highest threshold of 0.99 is on the left side of the graph with a sensitivity of 4.2% and a specificity of 100% on the training set and a sensitivity of 2.6% and a specificity of 100% in the hold-out set. Figure 4
A shows an axial slice of the probability mask for a single subject, overlaid on that subjects FLAIR. Figure 4
B shows the probability mask after thresholding, and Figure 4
C shows the expert tracings on the same slice.
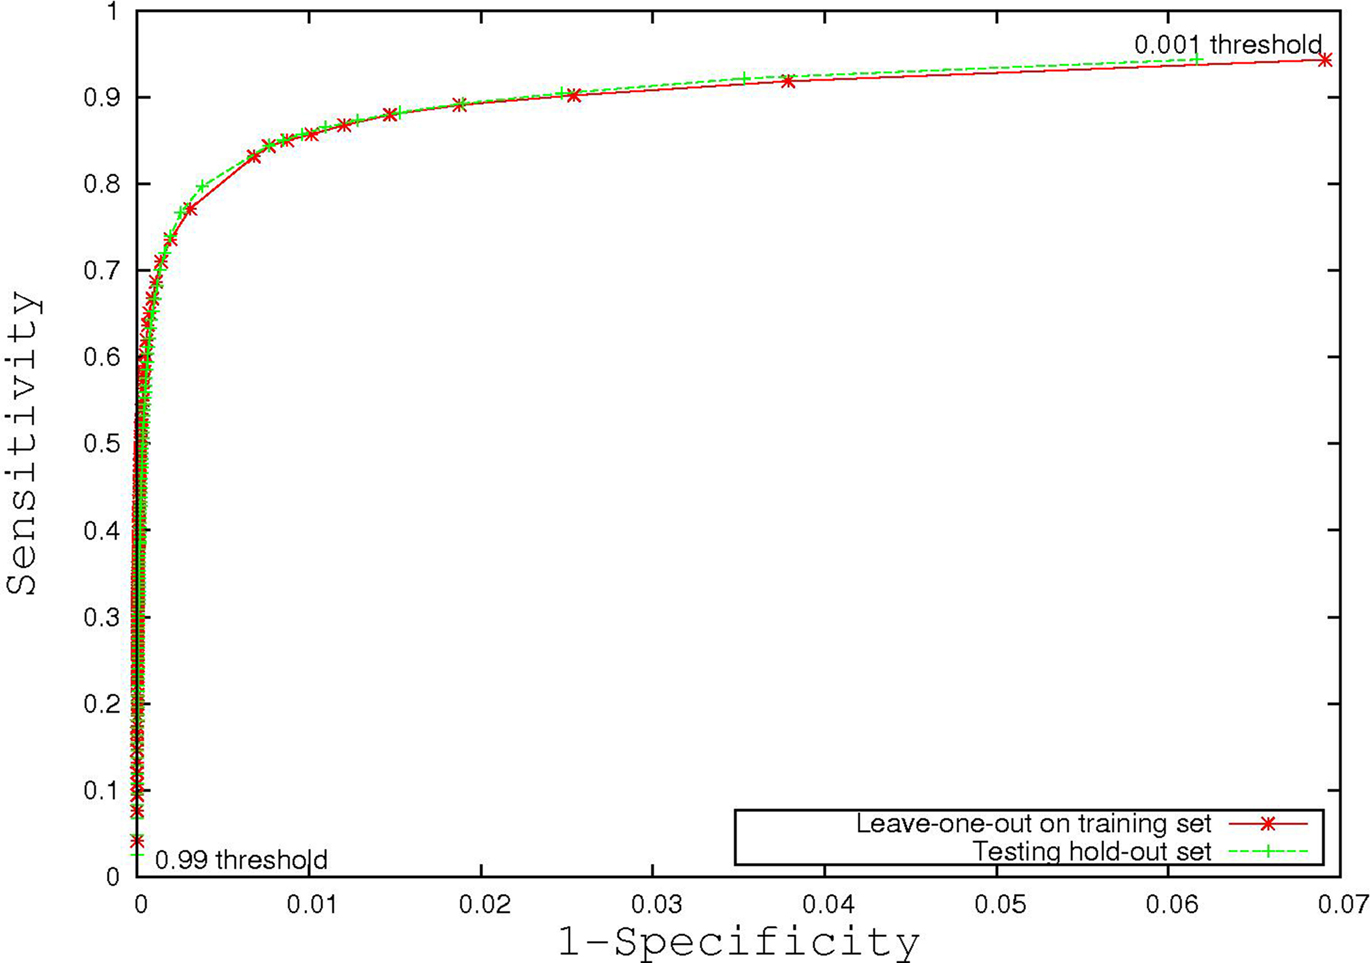
Figure 3. Receiver operating characteristic curve.
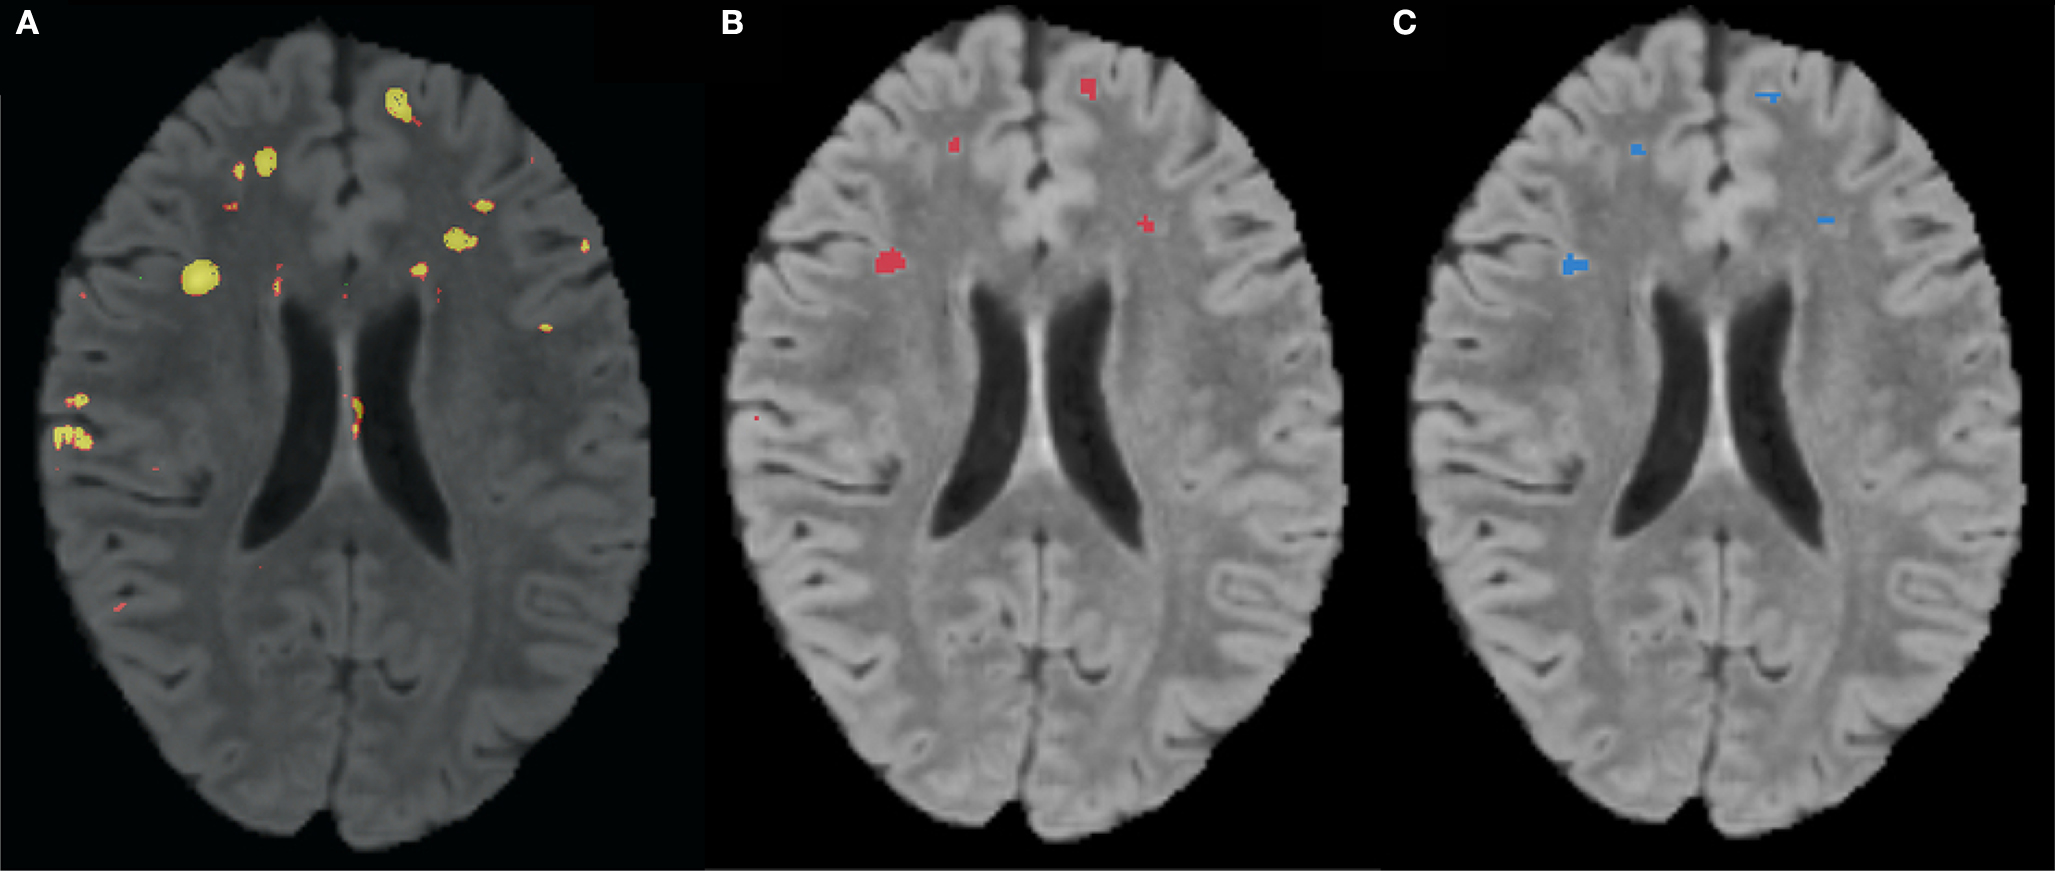
Figure 4. (A) FLAIR overlaid with predicted probability that a voxel is lesion, where brighter colors are higher probability. (B) Predicted probability mask after thresholding. (C) Manual expert tracing of lesions.
The majority of the false positives present in the predictions are on the boundaries of lesion clusters. Disagreement over boundaries is common between human raters often because precise boundaries do not matter to radiologists. Since this approach was based on the work of a single human expert, it is difficult to determine how much the boundary differences are due to misclassification and how much the differences are due to valid disagreement. An additional difficulty comes from the possibility that an automated approach may be more sensitive to lesion tissue in general. Determining where the automated method truly fails will require the ratings of more radiologists on the same subjects, more back-and-forth with the current radiologist, or both.
While overall the results are very good, the unbalanced nature of the data makes the specificity more important than it may seem since a specificity of 99.9% could be achieved simply by labeling all tissue non-lesion. In order to improve the specificity it may be worthwhile to implement some form of false positive reduction similar to that used by Lao et al. (2006)
. This would allow for a lower threshold, resulting in a higher sensitivity while improving the specificity over the current performance.
Additionally, the current results could likely be improved by reducing noise present in the features. One source of noise is the inter-subject intensity variation, which could be reduced by using a better intensity standardization method. Since the classification method presented is highly dependent on the relationships between images, a method that preserves these relationships, such as that presented by Jäger and Hornegger (2009)
, would likely improve accuracy.
Another source of noise in a subset of the features is the initial k-means tissue segmentation which is known to be sensitive to the intensity variations caused by lesions. A more robust tissue segmenter, using expectation maximization for instance, would help provide more accurate tissue types. Multiple features rely on the tissue segmentation, some of which were well ranked by mRMR, meaning any improvement should result in improved lesion segmentation.
Very little of the SVM kernel parameter space was searched which strongly implies the parameters used were non-optimal (Chang and Lin, 2001
; Huang et al., 2007
). Thus the current method could be improved by implementing a more thorough parameter search, although such a search would be computationally prohibitive.
While the model trained here is specific to NPSLE, the framework of features, ranking methods, and classifiers could be applied to any brain lesion type. Since there exists a number of disorders that produce brain lesions, there are many opportunities for further applications. Performance on more common disorders would also allow for better confidence due to larger sample sizes.
The authors declare that the research was conducted in the absence of any commercial or financial relationships that could be construed as a potential conflict of interest.
This work is part of the National Alliance for Medical Image Computing (NAMIC), funded by the National Institutes of Health through the NIH Roadmap for Medical Research, Grant U54 EB005149. Information on the National Centers for Biomedical Computing can be obtained from http://nihroadmap.nih.gov/bioinformatics
. This work was also funded in part by DOE DE-FG02-99ER6274, NIH 5R01HL077422-02, NIH P41-RR13218, NIH U24-RR021992, NIH/NINDS R01NS050568.


Chang, C.-C., and Lin, C.-J. (2001). LIBSVM: a library for support vector machines. Software available at http://www.csie.ntu.edu.tw/∼cjlin/libsvm
Hsu, C. W., Chang, C. C., and Lin, C. J. (2003). A practical Guide to Support Vector Classification. Technical Report. Taipei: National Taiwan University. http://www.csie.ntu.edu.tw/∼cjlin/papers/guide/guide.pdf
Huang, C.-M., Lee, Y.-J., Lin, D. K., and Huang, S.-Y. (2007). Model selection for support vector machines via uniform design. Comput. Stat. Data Anal. 52, 335–346. http://ideas.repec.org/a/eee/csdana/v52y2007i1p335-346.html
Ibanez, L., Schroeder, W., Ng, L., and Cates, J. (2005). The ITK Software Guide, 2nd Edn. Clifton Park, NY: Kitware, Inc. ISBN 1-930934-15-7, http://www.itk.org/ItkSoftwareGuide.pdf
Jäger, F., Nyúl, L., Frericks, B., Wacker, F., and Hornegger, J. (2007). “Whole body MRI intersity standardization,” in Bildverarbeitung für die Medizin 2007, eds A. Horsch, T. M. Deserno, H. Handels, H.-P. Meinzer and T. Tolxdorff (Berlin: Springer), 459–463. http://www5.informatik.uni-erlangen.de/Forschung/Publikationen/2007/Jaeger07-WBM.pdf
Lao, Z., Shen, D., Jawad, A., Karacali, B., Liu, D., Melhem, E., Bryan, R., and Davatzikos, C. (2006). “Automated segmentation of white matter lesions in 3d brain MR images, using multivariate pattern classification,” in 3rd IEEE International Symposium on Biomedical Imaging: Nano to Macro, 2006 (Arlington, VA: IEEE), 307–310.
Morra, J., Tu, Z., Toga, A., and Thompson, P. (2008). Automatic segmentation of ms lesions using a contextual model for the miccai grand challenge. http://hdl.handle.net/1926/1444
Rovaris, M., Viti, B., Ciboddo, G., Gerevini, S., Capra, R., Iannucci, G., Comi, G., and Filippi, M. (2000). Brain involvement in systemic immune mediated diseases: magnetic resonance and magnetisation transfer imaging study. J. Neurol. Neurosurg. Psychiatr. 68, 170–177. http://jnnp.bmj.com/cgi/content/abstract/jnnp;68/2/170
Yang, X., Song, Q., and Cao, A. (2005). “Weighted support vector machine for data classification,” in Proceedings of the 2005 IEEE International Joint Conference on Neural Networks, 2005. IJCNN’05, Vol. 2, pp. 859–864. http://ieeexplore.ieee.org/xpls/abs\_all.jsp?arnumber=1555965