Striatal BOLD response reflects the impact of herd information on financial decisions
- 1 Department of Physiology, Development and Neuroscience, University of Cambridge, Cambridge, UK
- 2 Faculty of Economics, University of Cambridge, Cambridge, UK
Like other species, humans are sensitive to the decisions and actions of conspecifics, which can lead to herd behavior and undesirable outcomes such as stock market bubbles and bank runs. However, how the brain processes this socially derived influence is only poorly understood. Using functional magnetic resonance imaging (fMRI), we scanned participants as they made decisions on whether to buy stocks after observing others’ buying decisions. We demonstrate that activity in the ventral striatum, an area heavily implicated in reward processing, tracked the degree of influence on participants’ decisions arising from the observation of other peoples’ decisions. The signal did not track non-human, non-social control decisions. These findings lend weight to the notion that the ventral striatum is involved in the processing of complex social aspects of decision making and identify a possible neural basis for herd behavior.
Introduction
When faced with a difficult choice, people rarely make decisions in a social vacuum but use the information provided by the actions of other people who made the same choice previously. Consider the example of choosing between two restaurants to dine at in a foreign city. Your travel guide recommends both, but when you go to check them out, one is very busy and the other is empty. The previous actions of the other diners might bias you towards choosing the busier restaurant. Social information is fundamental and can combine with, or even substitute for, individually acquired information about options to guide our decisions.
The informational value of others’ actions can be high, as when rats observe conspecifics die after consuming a particular food. However, once a herd has formed it may become difficult to glean any information from the actions of others. In the restaurant example above, you might be unsure as to whether the other diners actually know something you do not, or just followed the first few people to go in. It is in this manner that a sound choice on the individual level can give rise to inefficient or detrimental behavior on the aggregate level (Camerer and Weigelt, 1991 ; Banerjee, 1992 ; Bikhchandani et al., 1992 ; Anderson and Holt, 1997 ). Indeed, herd behavior may contribute to bubbles in financial and housing markets (Baddeley 2005 ; Dale et al., 2005 ), online consumer preferences (Hansen and Putler, 1996 ) and conforming to a group in perceptual decision tasks, despite clear sensory evidence against it (Bond and Smith, 1996 ). The critical feature of economic and psychological accounts of herding is that observing the actions of others, and not the outcomes of those actions, exerts a measurable difference on the individual’s choice.
If the behavior of others would change the value of options, one would expect to detect such an effect in value coding regions of the brain. A core region of the value system is the ventral striatum. It processes economic value parameters such as the mean and the variance of choice options (Preuschoff et al., 2006 ). Here we tested the hypothesis that it would also be sensitive to the actions of others in the context of an economic decision making (stock buying) task. To do this, we first asked whether the ventral striatum is sensitive to the actions of others (social information) in the absence of economic information. Secondly, we asked if the same regions were sensitive to economic information (the mean and variance of various stock return data) in the absence of social information. Thirdly, if the ventral striatum was sensitive to both social and stock information, we investigated how this combined information is represented in the brain. For example, do the actions of others change the processing of objective stock value or variance or do they modulate subjective preferences for different options? Methodologically, we were in a position to answer these three questions by having trial types with only social, only stock, or with both kinds of information. For the fist two questions, we hypothesized that participants would make more “buy” decisions as more of the herd bought, even in the absence of any stock information. In addition to this, there would be an increase in ventral striatum activity inline with behavior. This reflection of behavior in ventral striatum activity would also be observed in response to stock information when social information was absent. For the third question, we hypothesized that social information would modulate the processing of stock parameters directly. For example, activity in the ventral striatum relating to a stock value signal would be increased if participants subsequently became aware that others had bought that particular stock. In agreement with our first and second hypotheses, we found that activity in the ventral striatum tracks social information (actions of others), and economic information (stock parameters). However, in contrast to the third hypothesis, social information influenced ventral striatum activity through participants’ subjective preferences for different stock types rather than by modulating the objective stock properties.
Materials and Methods
Participants
Nineteen right-handed healthy participants were originally recruited through advertisements on the University campus and on a local community website. Two participants were excluded for excessive head motion in the scanner. Of the seventeen scanned and retained participants, nine were female and the mean age was 24.3 years (range 18–32). All were native speakers of English and had normal or corrected-to-normal vision in the scanner. Participants were pre-assessed to exclude previous histories of neurological or psychiatric illness. Finance, economics, psychology, and mathematics students were excluded from the experiment and all reported having no previous stock investment experience. All participants gave informed consent, and the Local Research Ethics Committee of the Cambridgeshire Health Authority approved the study. To minimize error trials during scanning, participants learned the timings and sequence of task events for 20 training trials no more than 7 days prior to scanning.
Stimuli
Stock information consisted of artificially generated time series of return data, displayed as charts with height of previous returns on the y axis and time on the x axis. The return of a stock can be roughly thought of as the performance of a stock over a particular time. Some days, a stock will perform well and generate a positive return, or profit, while other days it may perform poorly. As such, the returns chart does not show the price of a stock but rather a distribution of “performance” over a period of time, with value (in £s) on the y axis and time (days) on the x axis. In the task, each returns chart was characterized by a predefined high/low mean return value (£4 and £2, respectively) and a high/low variance (±£2 and ±£1, respectively, on average, giving four “stock types” in total). There was no significant trend in the returns and the skewness and kurtosis were held constant. In addition to the four main stock types (two mean return values, two levels of return variance), a scrambled stock image with no discernable return value or variance was used for control trials where no stock information was available. The scrambled image was created by jumbling the pixels from the other stock images, controlling for total visual stimulation while removing informational value. Examples of the five stock types used in the experiment can be seen in Figure S1 in Supplementary Material.
The social information consisted of either four human faces or four chimpanzee faces. Four faces (as opposed to fewer or more) were used in the social information stage to present a reasonably sized, gender-neutral group to participants. Participants received no information about the economic expertise of the four individuals that were depicted in the human condition. We employed four different social conditions (according to the decisions associated with the faces). Check marks and cross marks were used to denote decisions. Two social conditions were unanimous, with four check marks meaning everybody buys and four cross marks meaning nobody buys. A third, split, condition was denoted by two check marks and two cross marks, in randomized order. In addition there was a “no social information’ condition, where scrambled check and cross marks were shown above the faces, preventing the participant from knowing what the decisions of the herd were. The human face stimuli consisted of two females and two males and were rated by a separate group of participants (n = 34) as being of average attractiveness. The face stimuli were kindly provided by Bruno Rossion of the Cognition and Development Research Unit, Université Catholique de Louvain, Belgium.
To control for the social nature of the information provided by the group of humans without introducing strong visual confounds, we used a control condition with a group of four chimpanzees. Participants were told that the chimps had no understanding of returns distributions and did not care about money as a reward. Again, four conditions were employed (two unanimous, one split, one non-social). The main function of the chimpanzee controls was to prevent participants from simply following the number of checkmarks and crosses on a screen, a problem naturally arising from the portrayal of others’ actions visually in an fMRI task. To prevent participants from learning about the quality of the social information and from forming superstitions, we did not display decision outcomes at the end of a trial. The different human social information stimuli can be seen in Figure S2 in Supplementary Material.
In total, there were 40 trial types according to the combination of stock and social stimuli. These were the five types of stock returns chart (two means, two variances and the scrambled image) * the four social conditions (all buy, all reject, the split condition (2−2) and the no-social condition) * the two types of social information (human and chimpanzee control). Every combination of stock type and social condition was used as a trial type, including combinations where scrambled stock information and/or scrambled social information was displayed.
Behavioral Task
The task consisted of participants choosing whether to “buy” or “reject” different types of stocks. Each trial of the task started with a variable inter-trial interval (ITI) during which a fixation cross was presented (Figure 1 ). The ITI varied according to a truncated Poisson distribution with a mean of 3 s. Over the course of each trial, participants viewed a stock stimulus for 1.5 s. Although 1.5 s may appear as relatively short time to appreciate stock information, it is considerably longer than the average reaction time (0.4 s) of human traders (Broyon and Duka, 2006 ). In addition, participants were familiarized with the stock returns charts and task timings in an initial training session outside the scanner. Post-scanning interviews confirmed that all participants could discriminate between all stock types within the 1.5 s, and revealed that some participants preferred the low to the high mean stock because they believed that the low mean stock would subsequently increase in value more than the high mean stock. After the stock information, social information was displayed for 1.5 s, followed by a fixation period lasting 2–4 s. This allowed the decision phase to be temporally de-correlated from the stock and social information phase. The decision phase was signaled by a circle around the fixation cross. Participants had a 1s time window in which to make a response while the fixation cross was circled. If they failed to make any response during this time window, the trial was considered an error and was repeated later within the same run. Participants made their responses by using the index and middle fingers to press one of two buttons (to “buy” or “reject” the stock) on the button box. Assignment of “buy” and “reject” buttons to index and middle fingers was counterbalanced across participants to account for any motor confounds associated with middle and index finger differences. Importantly, subjects made a motor response in every trial, regardless of their decision to buy or reject the stock in order to control for any brain activity proximal to motor output. The task was split into three runs of approximately 20 min each, depending on participant errors. The participants completed four trials per trial type per run (160 trials per run), giving 12 trials per trial type over the experiment. Stimulus presentation employed Cogent Graphics (Wellcome Department of Imaging Neuroscience, London, United Kingdom) and Matlab (Mathworks, Natick, USA).
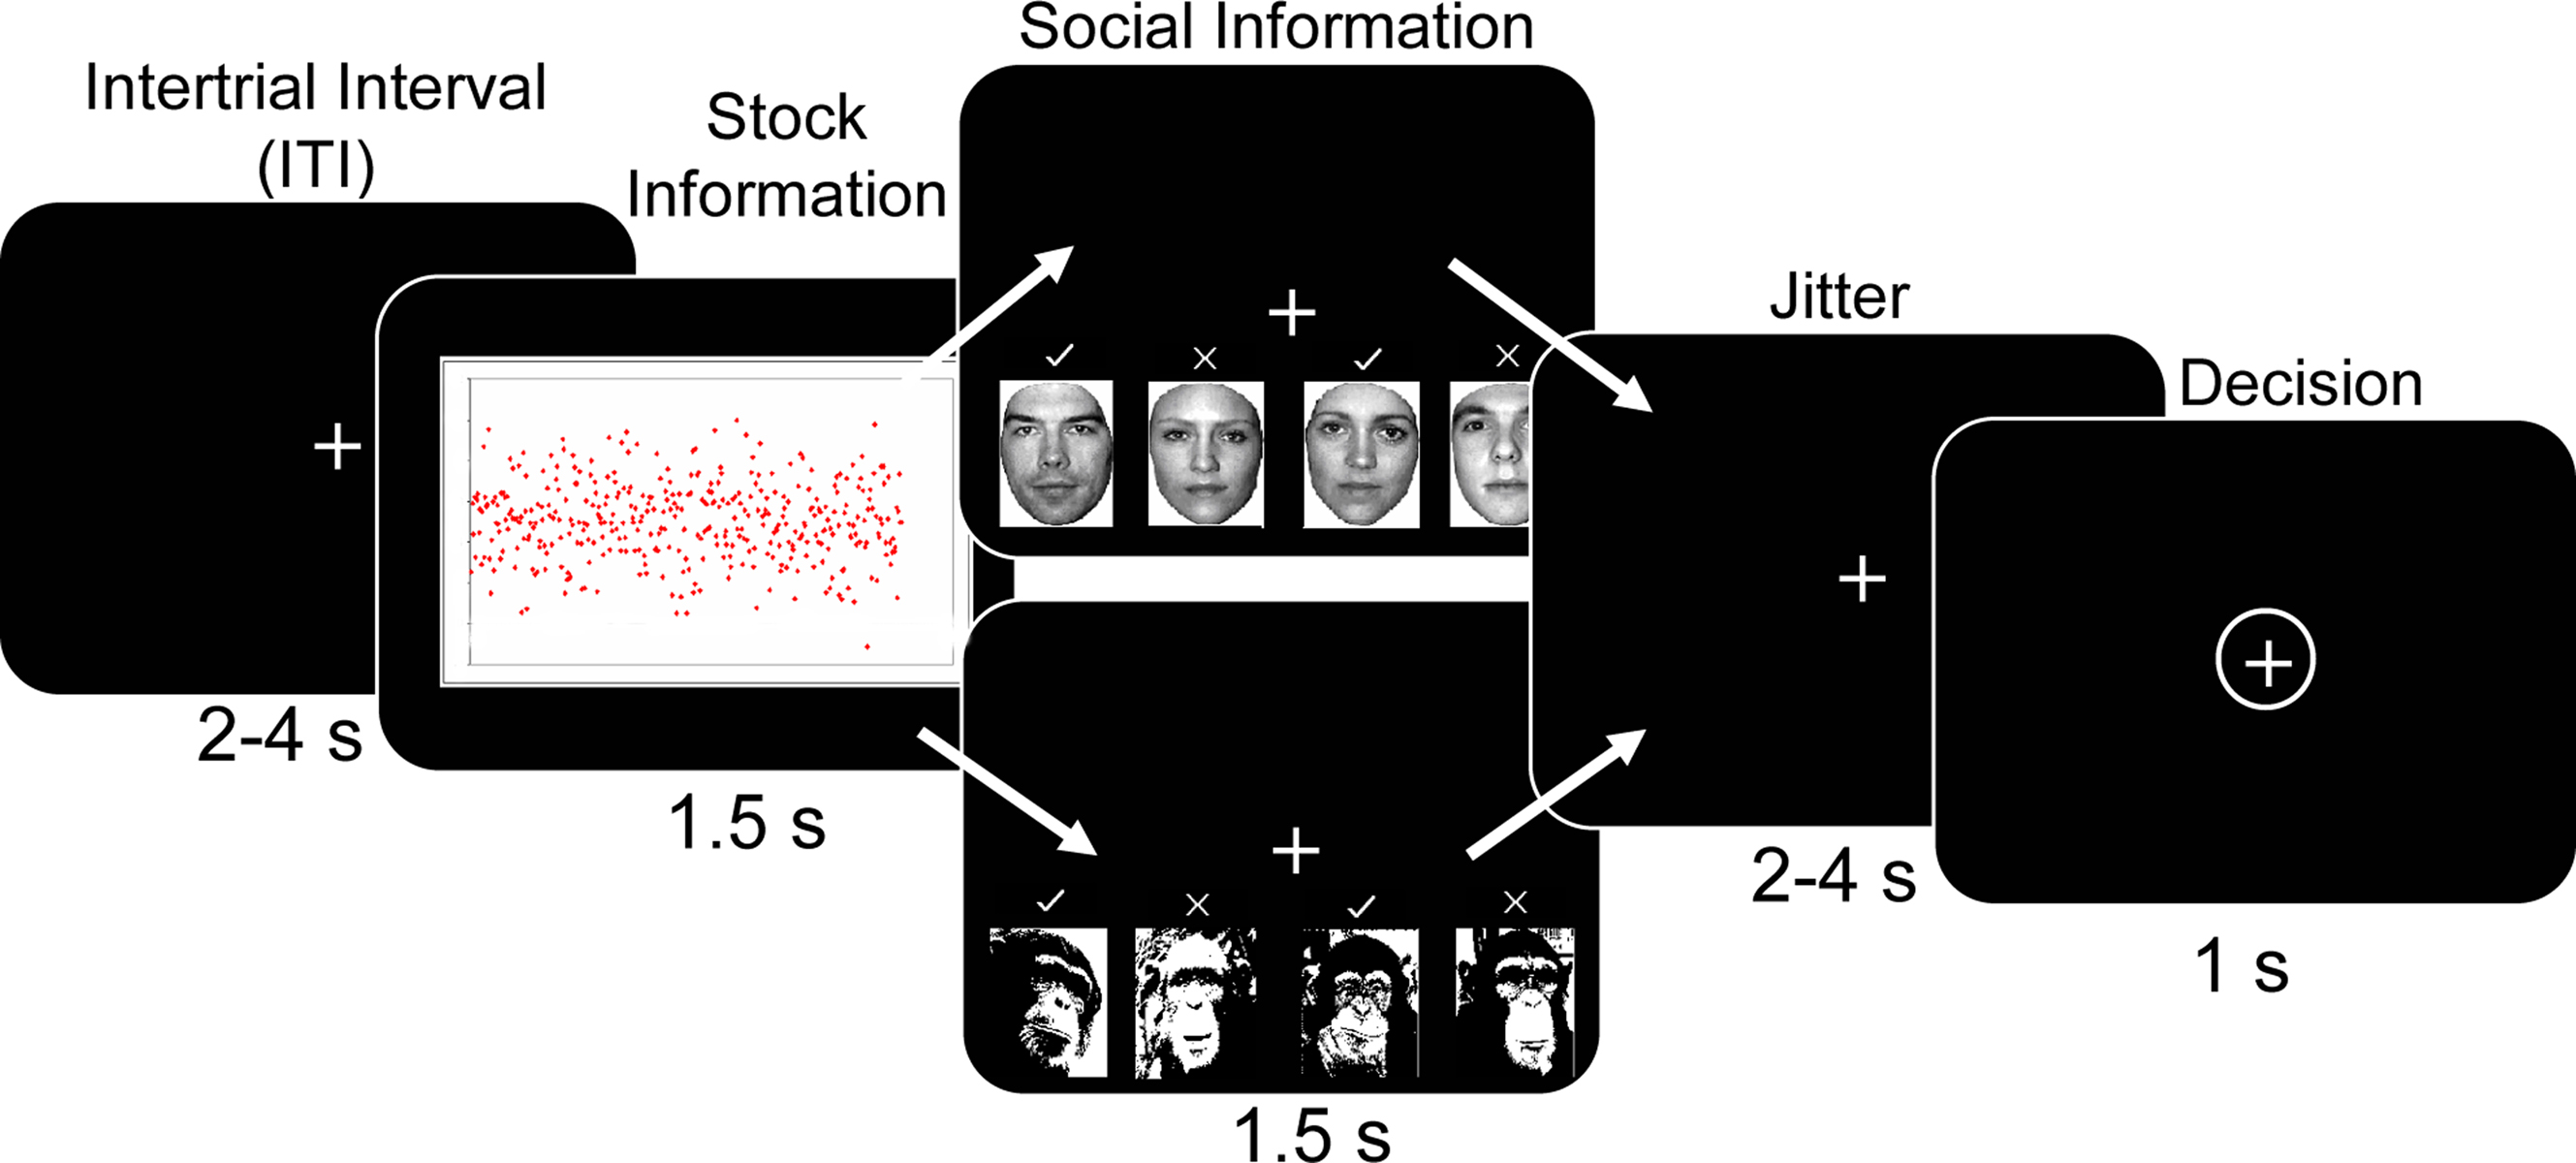
Figure 1. Behavioral task. After a variable inter-trial interval (ITI) participants were presented with artificially generated stock return data for 1.5 s. Five different distributions (high mean, high variance; high mean, low variance; low mean high variance; low mean low variance; scrambled image with no discernable mean or variance) of returns were randomly presented. This was followed by social information consisting of human faces with previous decisions for the presently viewed stock. Decisions were denoted by checkmarks or x-marks above the faces. Four different social conditions were used; everyone buys (“+4”), a split group (2−2), everyone does not buy (“−4”) and a scrambled decision with no discernable information (no social, “NS”). On half the trials chimpanzee faces were presented with the same social conditions as a non-human, non-social control situation. After a jittered interval of 2–4 s the participant made a decision to “adopt” or “reject” the stock using the button box when the fixation cross was circled.
Participant Payment
Participants were given no feedback after “buying” or “rejecting” a stock, to avoid any learning, cumulative wealth, and superstition effects. All the data points in the stock stimuli displayed to participants were positive (Figure S1 in Supplementary Material). Participants were instructed that they had an initial endowment in the task and that they were able to purchase the stocks for their mean values of £2 and £4. After a purchase, the computer would randomly select a point from the distribution (without displaying the result of the selection to participants). If this point was below (above) the mean return, the participant would lose (win) money. The money received by the participant for a particular buy decision depended on how far the randomly chosen point was from the mean return. Although the participant believed they could incur losses if the randomly chosen point was below the mean, it was not taken into consideration with regards to participant payment (only those decisions that resulted in a monetary gain were totaled at the end of the experiment). The participants were instructed that if they lost more than their initial endowment (the show-up fee of £20), then the task would terminate. For ethical reasons, the participants did not suffer any losses and the payment was always positive. Initial behavioral piloting revealed that this incentive scheme helped participants carefully consider their decisions and not simply buy every stock presented to them. It also had the benefit of causing participants to distribute their choices somewhat across the different stock returns and variances, instead of purchasing only one particular type, and forcing participants to consider each decision in isolation. The totals earned by each subject were divided by 100 to convert to pounds and displayed to them at the end of the experiment (after scanning had stopped). Participants earned £32.50 (S.D. £5.36) on average, including a £20 show-up fee. The amount of money participants received for buying any particular stock in any given trial was in no way dependent on the social information appearing in that trial.
fMRI Data Acquisition
Scanning took place at the Wolfson Brain Imaging Center, Cambridge. The task was projected on a display, which participants viewed through a mirror fitted on top of the head coil. We acquired gradient echo T2*-weighted echo-planar images (EPIs) with blood oxygen level dependent (BOLD) contrast on a Siemens Trio 3 Tesla scanner (slices/volume, 33; repetition time, 2 s). Signal dropout in basal frontal and medial temporal structures resulting from susceptibility artifact was reduced by using a tilted plane of acquisition (30° to the anterior commissure-posterior commissure line, rostral > caudal). Imaging parameters were the following: echo time, 50 ms; field-of-view, 192 mm; in-plane resolution, 3 × 3 mm, with a slice thickness of 2 mm and an interslice gap of 1 mm. The experiment was split into three runs, each lasting approximately 22 min. Depending on performance of participants, 600–700 volumes were collected in each run of the experiment, together with five “dummy” volumes at the start and end of each scanning run. Scan onset times varied randomly relative to stimulus onset times. A T1-weighted MP-RAGE structural image was also acquired for each participant. These high-resolution T1-weighted structural scans were coregistered to their mean EPIs and averaged together to permit anatomical localization of the functional activations at the group level.
Image Analysis
Statistical Parametric Mapping (SPM5; Functional Imaging Laboratory, UCL) served to spatially realign functional data, normalize them to a standard EPI template and smooth them using an isometric Gaussian kernel with a full-width at half-maximum of 10 mm. We used a standard rapid event-related fMRI approach in which evoked hemodynamic responses to each event type are estimated separately by convolving a canonical hemodynamic response function (HRF) with the onsets for each event and regressing these against the measured fMRI signal (Dale and Bruckner, 1997 ; Josephs and Henson, 1999 ). This approach makes use of the fact that the HRF summates in an approximately linear manner over time (Boynton et al., 1996 ). By presenting trials in strictly random order and using randomly varying inter-trial intervals, it is possible to separate out fMRI responses to rapidly presented events without waiting for the hemodynamic response to reach baseline after each single trial.
Functional data were analyzed by constructing a set of stick functions at the event onset times for each of the 40 trial types (five types of stock information * four types of social information * two types of species) in a first model. This model was categorized according to trial type in order to investigate the BOLD response to the presentation of stock information and social information, with the decision phase of each trial modeled as a regressor of no interest. To investigate the BOLD response at the decision phase, we constructed a second model that was categorized according to whether behavioral choice went with or against human and chimp herds. This model collapsed across trial type, with stock onset and social information onset modeled as regressors of no interest. Error trials were modeled separately. The stick function regressors were convolved with a canonical HRF. Participant-specific movement parameters were modeled as regressors of no interest.
Using random-effects analysis, the relevant contrasts of parameter estimates (contrast estimates) were entered into a series of t tests or ANOVAs with non-sphericity correction where appropriate. We used small volume correction for multiple comparisons (p < 0.05; FWE). The ventral striatum ROI includes the nucleus accumbens, ventral caudate nucleus and putamen rostral to the anterior commissure as defined in previous studies (Murray et al., 2008 ). Other reported brain regions were identified neuroanatomically with the Pickatlas Toolbox (Maldjian et al., 2003 ). For time course plots, we used MarsBaR (Brett et al., 2002 ), making no assumptions about the shape of activations, and applying eight finite impulse responses per trial, each impulse separated from the next by one scan (2 s). The dependent measure in time course plots is percentage signal change measured within a 10 mm sphere around the peak voxel. Reported voxels conform to Montreal Neurological Institute (MNI) coordinate space, with the right side of the image corresponding to the right side of the brain.
Results
Behavioral Results
We first analyzed choice behavior by conducting a two-way ANOVA with social information (+4, 2–2, –4, and scrambled social information trials) and social information type (human/chimp) as factors. There was a significant main effect of social information (i.e., when + 4, 2–2, –4 and scrambled social information was displayed) on behavior with participants more likely to buy a stock when the group bought and less likely to do so when the group did not buy (two-way ANOVA, F(3,17) = 62.78, p < 0.001) (Figure 2 A). Further investigation revealed that both human and chimp social information had significant main effects on the number of buy decisions (human social information, one-way ANOVA F(3,17) = 67.14, p < 0.001; chimp social information, one-way ANOVA F(3,17) = 10.48, p < 0.001). A similar effect occurred in the absence of stock information, in that human social information nevertheless had an effect on the number of buy decisions (F(3,17) = 18.24, p < 0.001, Figure 3 A). Thus, participants made significantly more “buy” or “reject” decisions when the herd bought or rejected the stock. However, in order to verify that human social information had a significantly bigger impact on choice behavior than chimp social information, we investigated the interaction between social information (i.e., +4, 2–2, –4 and scrambled conditions) and social information type (i.e., whether those decisions came from chimps or humans). This analysis revealed that human social information had a larger impact on the number of “buy” or “reject” decisions than chimp information, with a significant interaction of social information and social information type (F(3,17) = 9.95, p < 0.001).
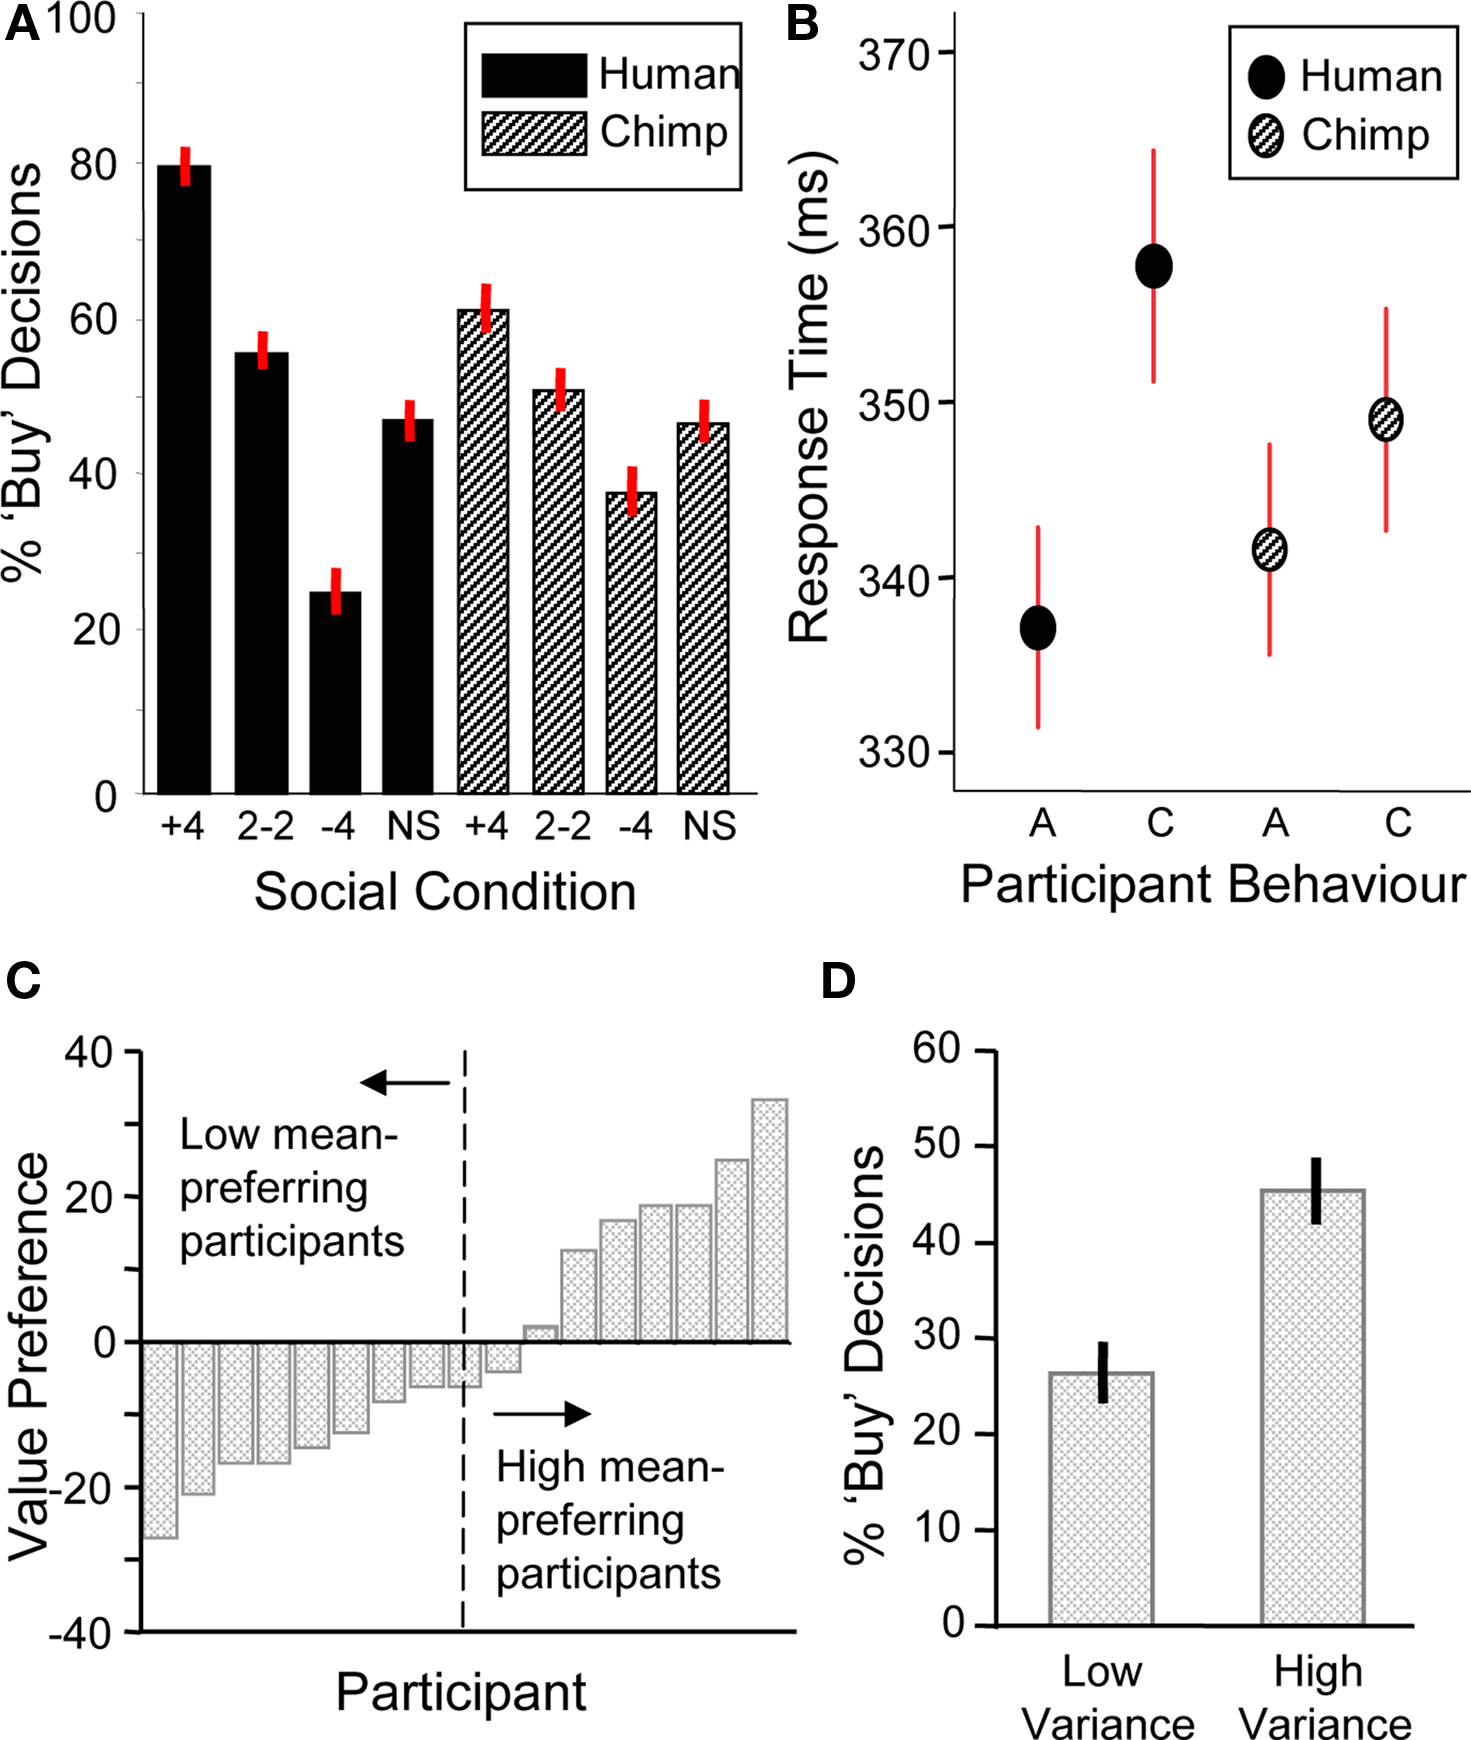
Figure 2. Behavioral data (n = 17). (A) Participants were sensitive to social information (one-way ANOVA, F(3,17) = 67.14, p < 0.001) and choice behavior was modulated significantly more by human social information (two-way ANOVA, F(3,17) = 9.95, p < 0.001). (B) Response time data. Participants had significantly longer response times for contrarian decisions ‘C’ than aligning decisions ‘A’ during human information trials (student’s t-test, t = 1.86, p < 0.05). There was no significant difference for chimpanzee information trials (student’s t-test, t = 0.84, p = 0.40). (C) Behavioral stock value preference for each participant (arranged in ascending order of mean preference). The individual stock value preference was calculated by subtracting the percentage of buy decisions for the low mean stock from the percentage of buy decisions for the high mean stock. A median split of the participants produced high and low mean-preferring groups used in subsequent mean preference contrasts. (D) Behavioral preferences for stock variance. Participants chose the high variance stocks more often than low variance stocks (student’s t-test, t = 4.1, p < 0.001).
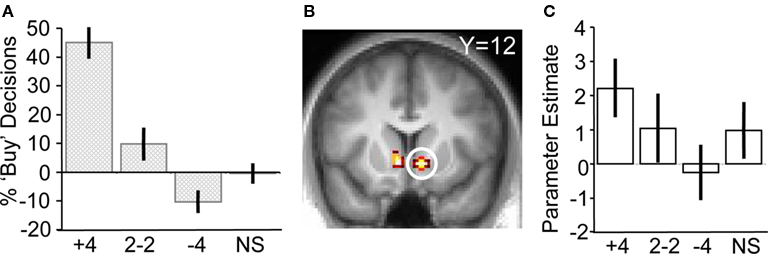
Figure 3. Responses to social information in the absence of stock information. (A) Behavioral changes in buy decisions for the scrambled stock as a function of human social information (one-way ANOVA, F(3,17) = 18.24, p < 0.001). (B) Activity in ventral striatum tracking social information after presentation of the scrambled stock (peak at 10, 12, −6; p < 0.05; z = 2.5). (C) Parameter estimates showing ventral striatum tracking human social information.
Next, we investigated participants’ choice behavior as a function of stock information. Preference for stock mean was assessed as the probability of buying a low or high mean stock on trials when no social information was provided. Participants had varying preferences for stock value, with about half of them preferring the low mean stock and the other half preferring the high mean stock (Figure 2 C; post-behavior questioning revealed that low mean-preferring participants expected low mean stocks to show larger increases in future value than high mean stocks). In contrast to the varying individual responses to stock value, participants consistently preferred high variance stocks (collapsing across means) (Figure 2 D). Thus, both stock mean and variance information influenced choice behavior.
In order to provide regressors for subsequent fMRI data analysis, a further analysis was conducted on the choice data using logistic estimation techniques. The logistic function used was the log of the ratio of the probability of buying over the probability of not buying (see Supplementary Material). This revealed that while the average probability of a “buy” decision was 50.3%, the conditional probability of buy decisions increased significantly (to 73.4%) when participants were informed that a human herd had decided unanimously (i.e., when “ + 4” social information was displayed) to buy (Table 1 ). Both the human and chimp “herd buys” parameter was highly significant (p < 0.001), confirming that decisions to buy were strongly and positively associated with a herd’s unanimous decision to buy. However, the results also suggest that information about herd decisions is being processed differentially, depending on whether the herd is human or not: the conditional probability of a buy decision given the decision of a chimp herd to buy was strongly and significantly lower (p < 0.001) than the conditional probability of a buy decision averaged over both types of herd (chimps and human). These results suggest that a human herd of stock buyers may increase the probability of individual stock buying (irrespective of stock type).
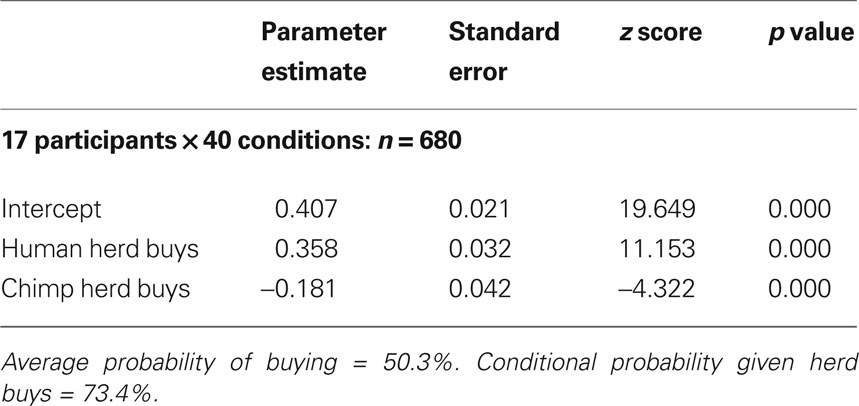
Table 1. Logistic estimation results (standard normal distribution).
Analysis of response times showed that decisions to go against the group (contrarian behavior) were characterized by increased response times compared to decisions that aligned with the group (student’s two-tailed t-test, t = 1.86, p < 0.05, Figure 2 B). There was no such difference in alignment versus contrarian response times for decisions following chimp information (student’s two-tailed t-test, t = 0.84, p = 0.40). Thus, both choice and response time data suggest that participants processed human and chimp information differentially.
Main Effect of Herd Information on Activation of the Ventral Striatum
To test the hypothesis that herd information influences activity in the core valuation region of the brain, we investigated the main effect of social information on ventral striatum activity when no stock information was shown to participants (i.e., trials when a scrambled stock image was shown, but social information followed as normal). Ventral striatal activity increased with more members of the herd having bought the stock (ROI analysis for [+4 > 2−2 > NS > −4] contrast for scrambled stock trials, peak at 10, 12, −6; p < 0.05; z = 2.5, corrected for ventral striatum; Figures 3 B,C). Thus, just like choice behavior, ventral striatum activity was sensitive to the actions of others even though no stock information (such as mean or variance) was perceivable by the participants. It may be entirely reasonable for a person with poor or non-existent stock information to follow others if they believe others have better information. Indeed, such behavior would be compatible with the notion of rational herding under asymmetric information (Noth and Weber, 2003 ), where the individual infers that the crowd is making an informed choice through observation of their actions.
Effects of Stock Information on Activation of the Ventral Striatum
To verify that the ventral striatum was coding not only socially transmitted changes in the number of “buy” decisions but also those induced by stock properties, we investigated striatal BOLD responses to the stocks in the absence of social information (i.e., on trials where stocks were displayed but the following social information was scrambled). We accounted for the individual differences in mean preference (see Behavioral Results) by splitting the participant pool into two groups, collapsing across the two variances (high mean-preferring and low mean-preferring). High mean-preferring participants showed higher activity in the ventral striatum when presented with the high mean versus low mean stock whereas the opposite was true for the low mean-preferring participants (ROI analysis for conjunction of contrasts [high mean > low mean] for high mean-preferring participants and [low mean > high mean] for low mean-preferring participants, peak at 9, 18, −9; p < 0.005, z = 4.2, corrected for ventral striatum; Figures 4 A,B). Additional activations in a whole-brain analysis were found in the medial orbitofrontal cortex, superior temporal sulcus and hippocampus (Table 2 ).
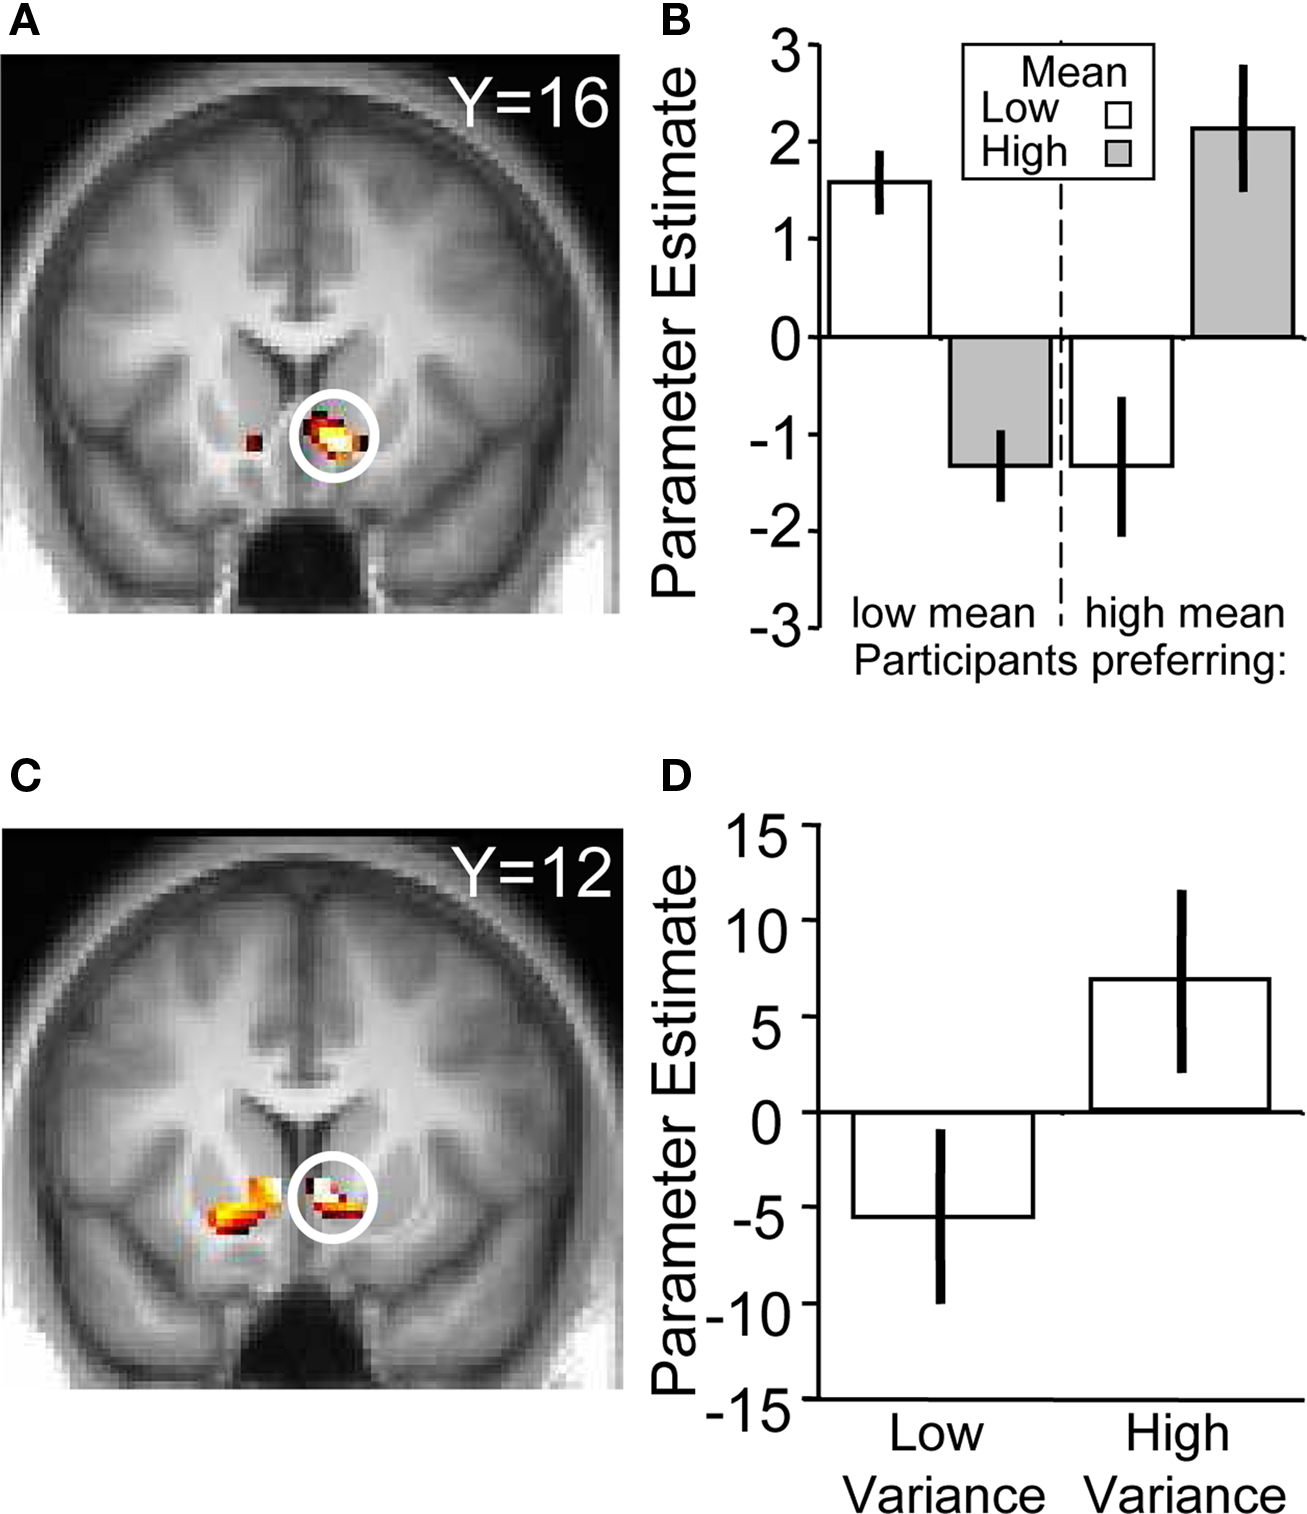
Figure 4. BOLD responses to stock information. (A) Activation in ventral striatum reflecting subjective preference for the stock mean (peak at 9, 18, −9; z = 4.2; p < 0.005). (B) Parameter estimates for the two groups. The left hand side of the chart displays the parameter estimates from the low mean-preferring group whereas the right shows the high mean-preferring group. (C) Activation in ventral striatum corresponding to stock variance (peak at 9, 12, −3; z = 3.2; p < 0.05). (D) Parameter estimates for the high–low variance contrast.
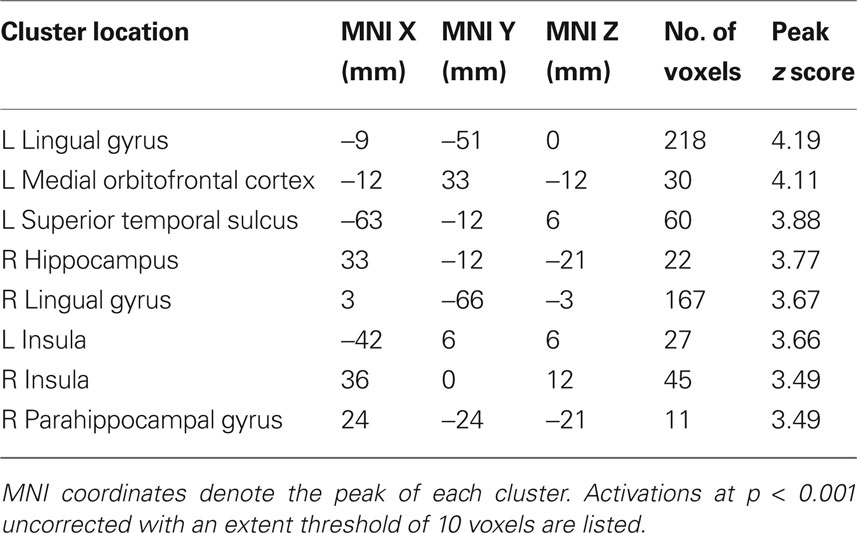
Table 2. Locations of significant activation clusters for the value-preference contrast in a whole-brain analysis (Figure 3 A).
In the absence of social information, participants preferred the high variance over the low variance stocks. The contrast of (high variance > low variance) identified a number of regions in the brain, including the ventral striatum (ROI analysis, peak at 9, 12, −3; p < 0.05, z = 3.2, corrected for ventral striatum; Figures 4 C,D), medial prefrontal cortex and anterior cingulate cortex (whole-brain analysis; other activations are listed in Table 3 ). Taken together, these results suggest that the ventral striatum coded not only social but also stock information reflecting individual preferences. In the next section we investigate how social and stock information combined are represented in the striatum.
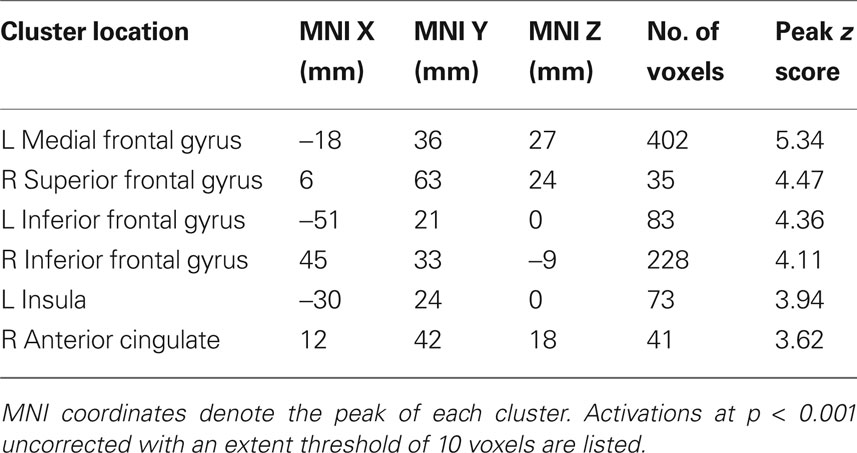
Table 3. Locations of significant activation clusters for the high variance > low variance contrast in a whole-brain analysis (Figure 3 B).
The Impact of Herd Information on Individual Decisions
We first tested our original hypothesis that actions of others change the perceived value or variance of the stock which people are viewing. If this were true, one would expect to see separate value and variance signals in the striatum that were subsequently boosted or reduced when participants perceived the actions of others. To test for this possibility, we used contrasts that tested for increases in signal from the “−4” to “+4” social conditions for the high mean versus low mean stock (collapsing across variance) and the high variance versus low variance stock (collapsing across mean). However, we did not find any evidence of this in the ventral striatum, even at a lenient threshold of p = 0.05, suggesting the actions of others have a modulatory effect on general preference for the different stock types.
An alternative hypothesis maintains that the actions of others influence ventral striatal activity directly and separately of stock information. To assess this possibility, we looked for covariation between individual ventral striatal BOLD responses and the impact of herd information on individual decisions. In particular, we constructed individualized contrasts by weighting each condition with the participant-specific conditional probabilities of buying provided by the logistic estimation applied to the behavior. These conditional probabilities capture the degree to which “buy” and “no buy” decisions by the herd change the proportion of “buy” and “no buy” decisions in individuals in a given trial type. To ensure a stronger relation of brain activation to human than chimp information, we gave negative weights to conditional probabilities in chimp trials and positive weights to human trials. This contrast therefore looked for changes in the BOLD response of the ventral striatum reflecting the relative changes in the conditional probabilities of “buy” decisions in each participant as a function of the herd information. In other words, we looked for a match of brain activity and behavior such that behavioral sensitivity to herd information was reflected by sensitivity in brain responses. Note that participants with increased sensitivity to human herds showed a steeper slope across the +4, 2−2 and −4 social conditions (i.e., a large increase or decrease in the number of buy decisions or in brain activation in the +4 and −4 social conditions relative to the 2−2 or non-social condition). Thus, this contrast showed the subjective impact of herd information on participant’s brain activity. Since the behavioral slopes arising from chimpanzee information were subtracted in this contrast, any resulting activity would be significantly more related to the impact of human social information.
We found that activity in the ventral striatum tracked such individual conditional probabilities of buying upon presentation of human social information (ROI analysis, peak at 6, 15, −6, p < 0.05, z = 3.7, corrected for ventral striatum; Figure 5 A). Ventral striatal responses to all four humans buying (“+4” human social information) increased most in participants most likely to buy due to the herd, with an average peak increase of 43% compared to the 2-buy, 2-no buy (“2−2”) conditions. Conversely, ventral striatal responses to a “no buy” herd increased least in participants most likely not to buy due to the herd with an average decrease of 60% compared with the peak of the “2−2” condition. The gradient for the human slope minus the gradient for the chimpanzee slope gave us a number for each participant that corresponded to the influence of human social information on buying probabilities. This “herding sensitivity” coefficient significantly correlated with the contrast estimate for activity in the ventral striatum (Pearson’s r = 0.544, p = 0.024; the relation was also significant when captured by the outlier-resistant, non-parametric Kendall’s tau: τ = 0.356, p = 0.048; Figure 5 C). Thus, activity in the ventral striatum reflected the direct impact human herd information had on changing the probability of a participant making a buy or reject decision. This activity is not simply reflecting the motor output associated with motor preparation, as participants were required to press a button to reject or buy a stock on every trial. In other words, the ventral striatum activity in response to a given social condition covaries with the participant’s likelihood to follow the herd in that situation.
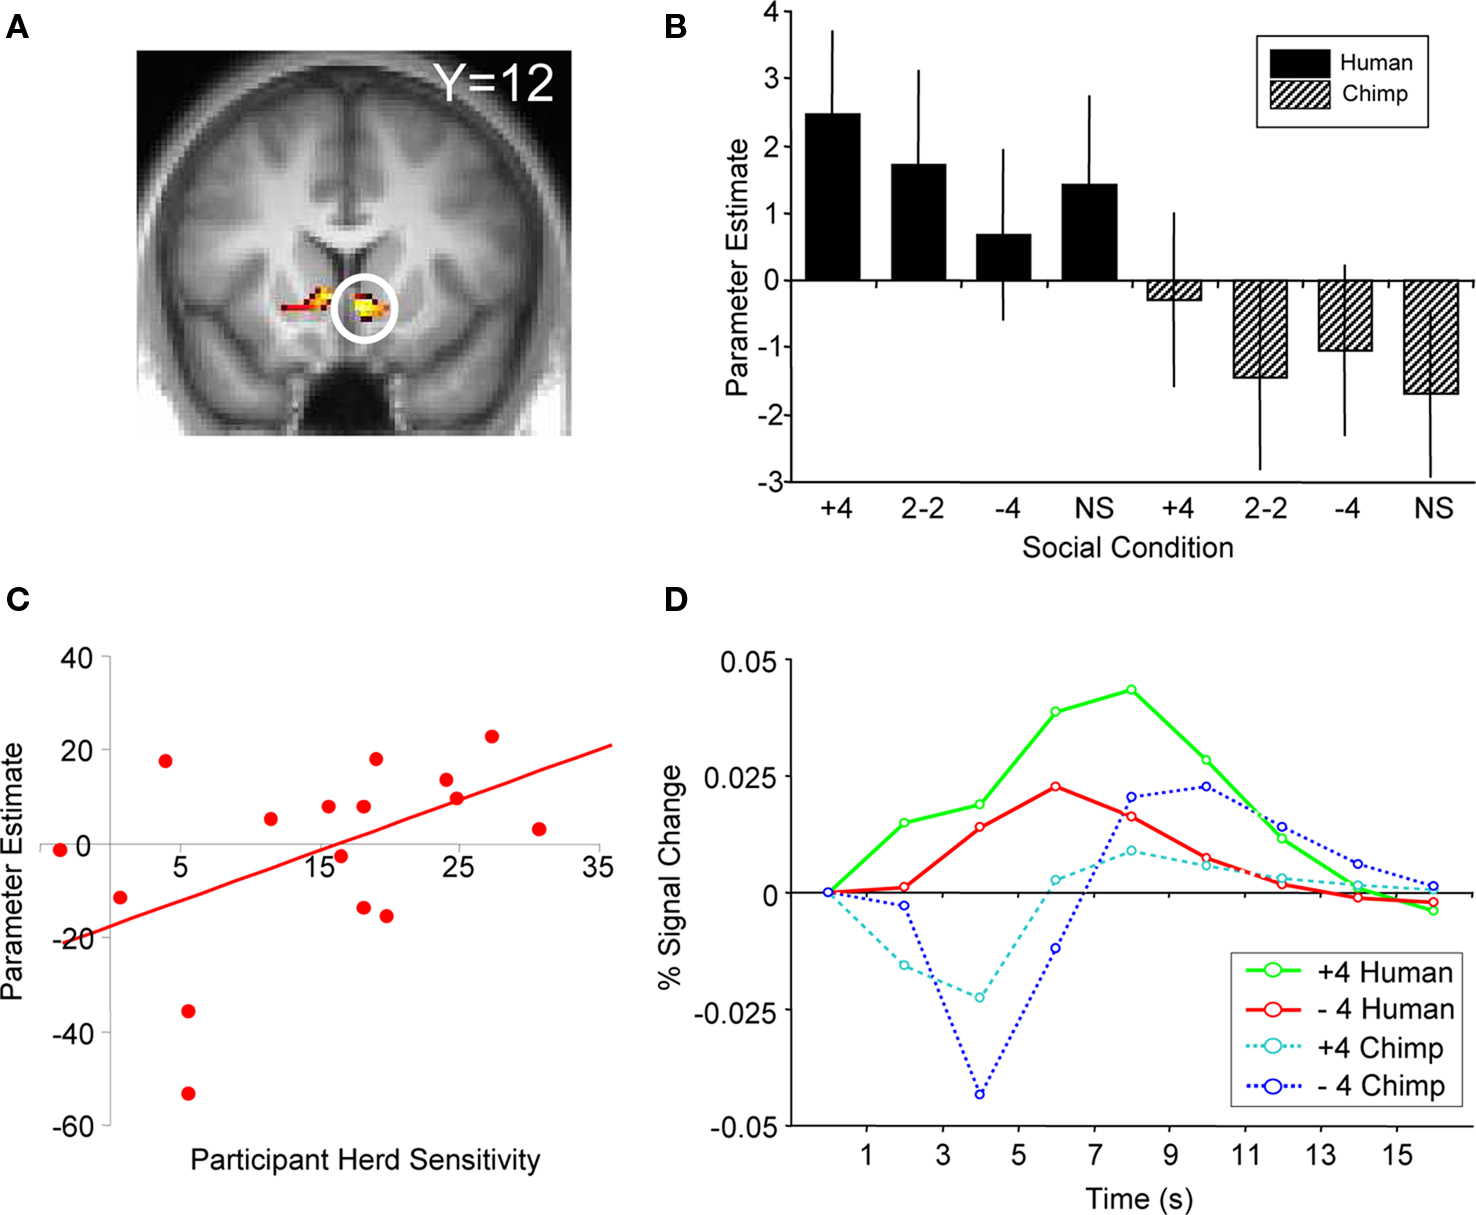
Figure 5. BOLD response reflecting average participant behavior. (A) Activation in ventral striatum covaried with herd influence (peak at 6, 15, −6; p < 0.05 FDR, small volume correction; z = 3.7). This corresponds to the change in behavior as a function of human social information minus the change in behavior as a function of chimp information. (B) Correlation of first-level parameter estimates from individualized herd influence contrasts and participant herding coefficients. Ventral striatum activity covaried significantly with the subjective degree of herd influence (Pearson’s r = 0.544, p = 0.024; Kendall tau = 0.356, p = 0.048). (C) Comparison of second-level parameter estimates (betasGLM) for each social condition from the same analysis and region of activation shown in (A). (D) Adjusted BOLD time courses in right ventral striatum time-locked to the presentation of social information. The behavioral relationship is evident between 3 and 7 s after the onset of social information.
One further point is worth noting with respect to these data: the presence of stock information resulted in participants making more “buy” decisions overall than in trials where no stock information was displayed. However, similar activation levels and patterns in both situations despite differences in overall behavior suggest that the ventral striatum did not simply reflect the number of buy decisions.
The ventral striatal responses reflecting herding with humans were significantly stronger than activity tracking the degree to which non-social chimp information changed choice behavior. As the average number of buy and reject decisions was not significantly different in human and chimp information trials (t test, p = 0.2), the negative contrast weights used for the chimp control trials confirmed that the signal was representative of the behavioral changes induced by human social information and not overall propensity to buy (Figures 5 B,D). One possible explanation for the generally stronger striatal activity for humans than chimps could be that it reflected the higher attractiveness of human compared to chimp faces. After the experiment, participants were asked to rate the attractiveness of the human and chimpanzee face stimuli used in the task. Participants rated the human faces as being significantly more attractive than the chimpanzee faces (t test, p < 0.001). However, attractiveness differences cannot explain the specific, graded effects of the social information because the same faces recommended to “buy” or “reject” in different trials. A second explanation could be that participants viewed chimpanzee social information as less useful compared to human social information. However, we believe that the incorporation of a non-social control introduces this possibility by default. For example, the common non-social control of displaying decisions or actions made by computers would suffer from the same argument, that is, that computers provide less useful information than humans because they do not have any intrinsic interest in money.
Since the conditional probabilities of “buy” decisions were correlated with the number of check or cross marks on the screen, a further possible interpretation could be that the ventral striatal activity described above is due to a simple social “recommendation signal” and not necessarily a social influence signal. With this interpretation of an objective recommendation signal, the ventral striatal activity would simply track the presence and quantity of the social information. To show that the activity was indeed related to the impact the herd had on behavior, we took up the objective recommendation and the individualized herding contrasts from the first level and compared them directly on the second level with a paired t-test. The test for an objective recommendation signal consisted of simple “+4” > “2−2” > “−4” contrasts for each subject (i.e., a contrast looking for activity that simply increases with the number of check marks in the social information). Conversely, the individualized herding contrasts weighted each of these social conditions with the participants’ conditional probabilities of buying in each condition. Activity in the ventral striatum reflected subjective human herd influence significantly better than an objective social recommendation signal (ROI analysis, peak at 5, 13, −4, p < 0.05, corrected for ventral striatum). Thus, instead of simply detecting others’ recommendations, ventral striatal responses depended significantly on whether these recommendations had an impact on individual choice behavior.
Responses to Alignment and Contrarian Decisions
With unanimous herds (four “buy” or four “reject”), participants’ choices could either coincide with the herd (alignment) or go against the herd (contrarian behavior). In accordance with herding theory, the behavioral results indicated that social influence leads individuals to align with the group’s decisions. For example, when the herds were unanimous (i.e., on trials where + 4 or –4 social information was displayed) 73% of participants’ decisions aligned with the herd. To address the possible interpretation that the ventral striatum is encoding the degree of alignment and not the social information from the herd, we used a second model to analyze the responses during the decision phase, specifically in trials in which there was a unanimous herd. In this model, the decision onset was modeled as the time when the participant pressed the button on the response box (thus equating for primary motor effects), with decisions on trials with mixed (i.e., 2−2) social information modeled as events of no interest. We found no significant activity in the ventral striatum for the “buy”–“reject” contrast, suggesting that the responses to the subjective influence from social information were independent of the behavioral output.
Next, we contrasted participants’ alignment and contrarian decisions and again found no significant activation differences in the ventral striatum. Incidentally, the strongest significant difference for this contrast occurred in the left amygdala which showed higher activity when participants’ decisions were aligned with human social information than when going against such information; the amygdala showed no differential response when aligning with, or going against, chimpanzee information (whole-brain analysis for [alignment > contrarian] contrast, peak at 18, 0, −21; p < 0.05, z = 3.5, corrected for amygdala anatomical mask; Figure 6 A). Conversely, contrarian decisions elicited higher activity in the anterior cingulate cortex than aligning decisions (whole-brain analysis for [contrarian > alignment] contrast, peak at 0, 45, 15; p < 0.005, z = 4.2, corrected for anterior cingulate anatomical mask; Figure 6 B). While there was inter-subject variability in the proportion of alignment and contrarian decisions, all participants made at least one decision of each type. However, it should be noted that we did not have any a priori hypotheses about the role of these regions during alignment contrarian decisions, and these exploratory results would require independent replication.
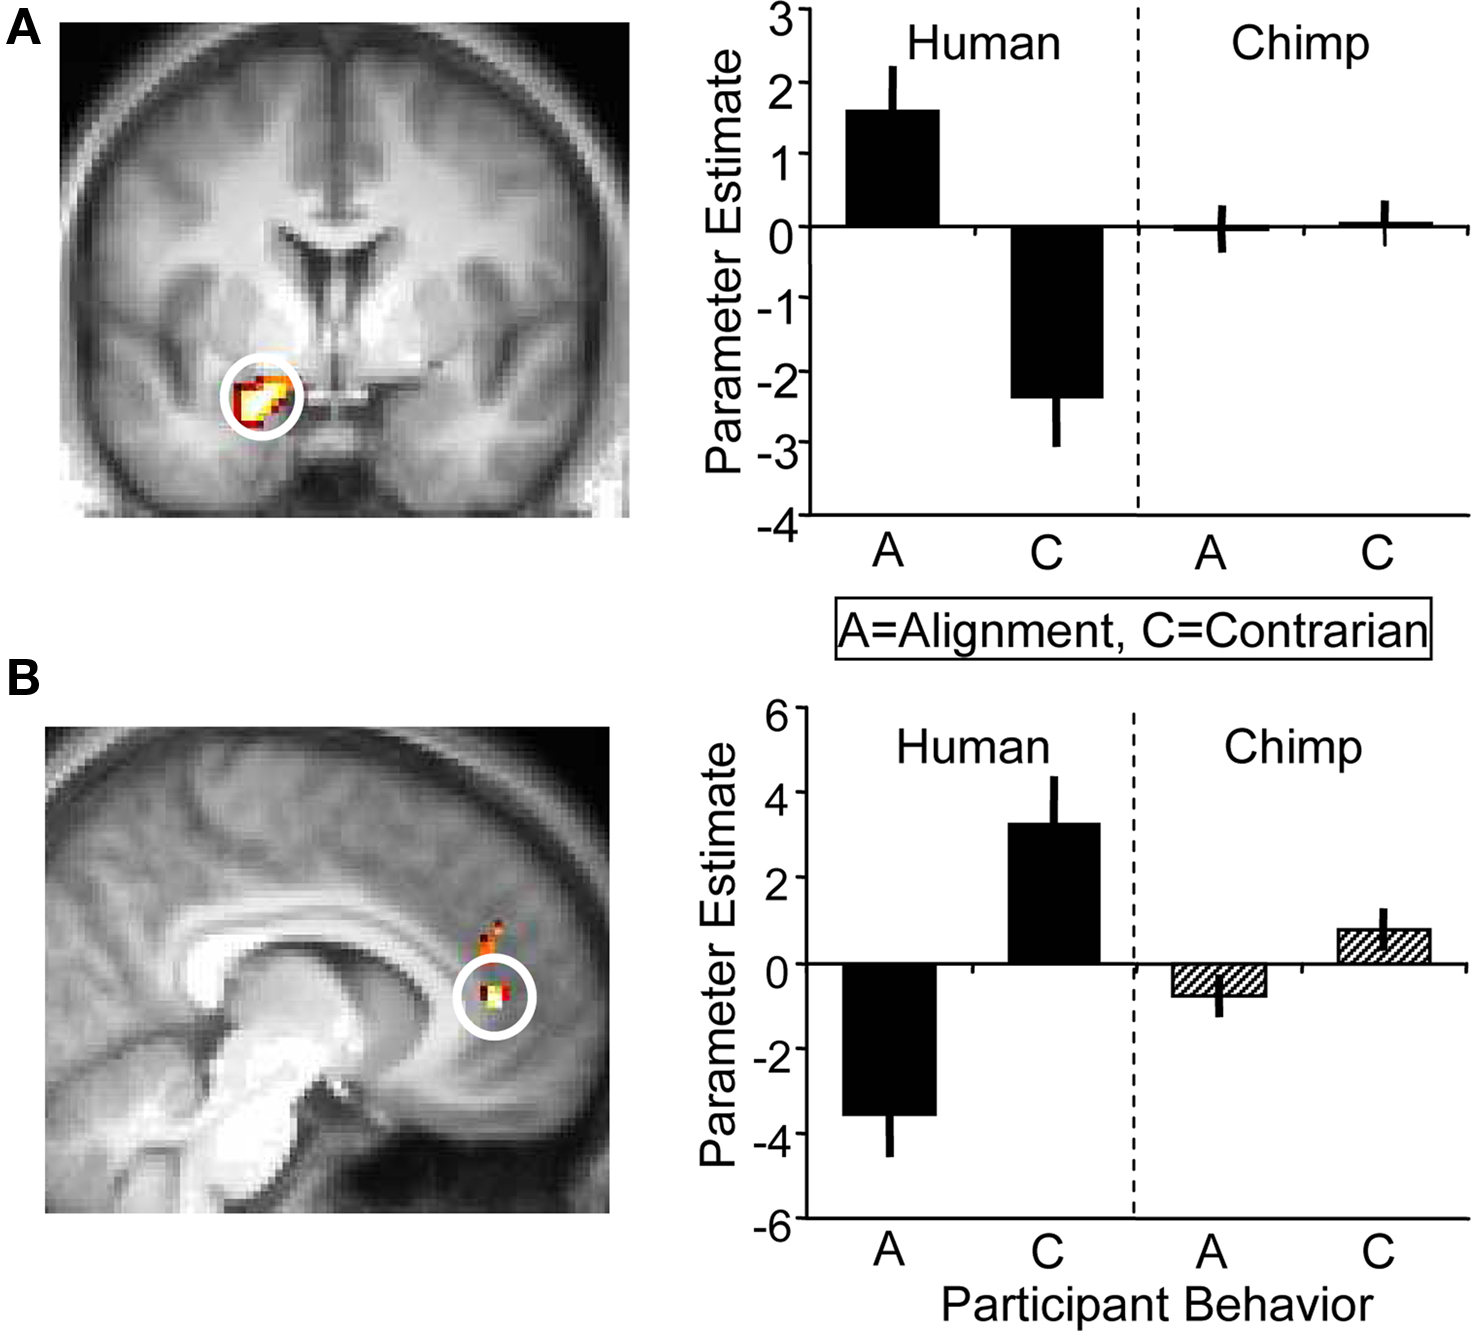
Figure 6. BOLD responses at the time of decision. (A) (Left) Activation in left amygdala (peak at 18, 0, −21; z = 3.5; p < 0.05) corresponding to an alignment decision. Alignment decisions were defined as choices that coincided with the social information of the present trial. (Right) Parameter estimates for left amygdala corresponding to alignment ‘A’ and contrarian ‘C’ decisions for human and chimp information. (B) (Left) Anterior cingulate cortex (peak at 0, 45, 15; z = 4.2; p < 0.005) was more active during contrarian decisions following human information, but showed no differential response to alignment/contrarian decisions following chimp information (right).
Discussion
In this study we demonstrate the impact of herd information on the activity of key reward structures in the human brain. The BOLD response in the ventral striatum reflected the degree of behavioral influence of the herd, as evident in the changes in the number of buy decisions. Our task implemented a number of controls to allow us to conclude that the ventral striatum is involved in herding behavior. In social tasks it is necessary to contrast social with non-social conditions to categorically claim that a signal is social- and human-specific (Berns et al., 2005 ). Usually non-social conditions are depicted as the product of a computer decision, which may not be a sufficient visual and experimental control. To address this, we used two types of group information, human and chimpanzee. The ventral striatum responded differently to the two types of information, suggesting it is not simply tracking “buy” or “reject” decisions, but tracking the influence brought about by human-specific actions. Further, the observed signal was human-specific, as the overall propensity to make a “buy” or “reject” decision did not differ between the human and chimp information conditions. Moreover, at the time of decisions within human conditions, ventral striatal activity did not differ between “buy” and “reject” trials. Finally, the social herd signals in the ventral striatum coincided with its coding of stock economic parameters, suggesting that it may combine social and non-social factors during economic decision making.
One possible interpretation of the difference in ventral striatum activity between social and non-social conditions is that human social information was more relevant and salient than chimpanzee social information. The observed differences may also be dependent on lower-level visual differences between the two types of social information. The present study cannot completely exclude a role of all these factors in explaining herding and thus leaves this issue for further research. However, it is also worth to bear in mind that such explanations could conceivably be applied to almost any non-social control condition and that they would not easily account for the behaviorally matched gradation of ventral striatum activity across the social conditions, as demonstrated in Figures 3 and 4 . The main function of the chimpanzee conditions here was to exclude explanations in terms of a simple recommendation signal as conveyed by the number of ticks and cross marks in a manner that avoided obvious confounds such as the animate versus inanimate distinction and the use of face versus non-face stimuli.
In the animal kingdom the foraging and mating behavior of conspecifics can provide vital clues about the location and quality of outcomes in the natural environment, often leading to behavioral convergence and herding (Heyes, 1994 ; Danchin et al., 2004 ; Galef and Laland, 2005 ). As a result, herding itself may be socially rewarding. Social reward can be a strong reinforcer and macaques choose to receive less primary reward in order to view socially important images (Deaner et al., 2005 ). The ventral striatum codes not only primary and monetary rewards but responds to both simple and complex social rewards such as beautiful faces, photos of romantic partners, advantageous social comparison, social hierarchy and reputation (Aharon et al., 2001 ; Delgado et al., 2005 ; Fisher et al., 2005 ; Fliessbach et al., 2007 ; Izuma et al., 2008 ; Zink et al., 2008 ). Our data lend further weight to the notion that reward and decision-related activity in the ventral striatum is sensitive to social context. The mere observation of others engaging in approach behavior may increase the observing individual’s likelihood of behaving in a similar manner (Hoppitt and Laland, 2008 ). The present results suggest that the ventral striatum may contribute to such behavior in the context of stock buying.
Activity in the amygdala and anterior cingulate at the time of the decision depended on the human-specific social context of the participant’s decisions, regardless of a buy or reject action. When making decisions in a social environment it is intuitive that the brain should keep track of one’s relation to the group (in this case whether the decision maker happened to align or go against the crowd). It is generally assumed that going with the crowd is more appetitive than going against it. Because the amygdala has largely been implicated in the processing of aversive stimuli, the present finding of amygdala activity in response to an alignment decision may be particularly surprising. However, a number of studies have shown the amygdala to play an important part in social judgments (Adolphs et al., 1998 ) and in appetitive situations (Ambroggi et al., 2008 ).
The role of the anterior cingulate in contrarian decisions may be understood in relation to its well-investigated contribution to error-detection and conflict (Botvinick et al., 1999 ), as well as its implication in the tracking of social values (Behrens et al., 2008 ). We found responses in the anterior cingulate when participants went against human social information, lending weight to the idea that a variety of conflict types activate the cingulate. Previous research has shown the anterior cingulate cortex to be involved in the resolution of complex social situations such as moral dilemmas (Greene et al., 2004 ) and the representation of agency during social interactions (Tomlin et al., 2006 ). A recent study suggests that the cingulate cortex computes the absolute difference of participants’ opinions from group opinions, which supports the idea that this region plays a role in monitoring the social outcome of group-based decisions (Klucharev et al., 2009 ). Taken together, the anterior cingulate appears to be particularly sensitive to social information when our actions diverge from those of others.
The idea that other peoples’ actions can bias individual choice by generating herd behavior is not new but the neural mechanisms of how this happens have not been well understood. Herd behavior does not only apply in financial contexts, but has been implicated in the adoption of fashions, fads, and even voting. The contagion that can arise through herd behavior can be problematic in leading to short-term misjudgments of the value of available options in the environment. Herding might arise through the simple (but sometimes erroneous) belief that many people taking the same action are unlikely to be wrong (Shiller, 1995 ). In agreement with this notion, our participants readily utilized the behavior of others to inform their decisions, even in the absence of stock information. Moreover, the present data suggest that the ventral striatum encodes a signal that is sensitive to herd information and the anterior cingulate and amygdala respond differently depending on the participant’s alignment with the group. These signals could combine with, or be compared to, other decision-related brain activity to inform and guide choice, providing a possible neural account of herding in humans.
Conflict of Interest Statement
The authors declare that the research was conducted in the absence of any commercial or financial relationships that could be construed as a potential conflict of interest.
Acknowledgments
We thank George Christopoulos and Krishna Miyapuram for helpful comments and advice. This work was supported by the Leverhulme Trust (Michelle Baddeley and Christopher J. Burke), the Wellcome Trust (Wolfram Schultz and Philippe N. Tobler) and the University of Cambridge Behavioural and Clinical Neuroscience Institute.
Supplementary Material
The Supplementary Material for this article can be found online at http://www.frontiersin.org/neuroscience/humanneuroscience/paper/10.3389/fnhum.2010.00048/
References
Adolphs, R., Tranel, D., and Damasio, A. R. (1998). The human amygdala in social judgment. Nature 393, 470–474.
Aharon, I., Etcoff, N., Ariely, D., Chabris, C. F., O’Connor, E., and Breiter, H. C. (2001). Beautiful faces have variable reward value: fMRI and behavioral evidence. Neuron 32, 537–551.
Ambroggi, F., Ishikawa, A., Fields, H. L., and Nicola, S. M. (2008). Basolateral amygdala neurons facilitate reward-seeking behavior by exciting nucleus accumbens neurons. Neuron 59, 648–661.
Anderson, L. R., and Holt, C. A. (1997). Information cascades in the laboratory. Am. Econ. Rev. 87, 847–862.
Baddeley, M. (2005). Housing bubbles, herds and frenzies: evidence from British housing markets. CCEPP Policy Brief No. 02-05, Cambridge Centre for Economic and Public Policy, Cambridge, UK.
Behrens, T. E., Hunt, L. T., Woolrich, M. W., and Rushworth, M. F. (2008). Associative learning of social value. Nature 456, 245–249.
Berns, G. S., Chappelow, J., Zink, C. F., Pagnoni, G., Martin-Skurski, M. E., and Richards, J. (2005). Neurobiological correlates of social conformity and independence during mental rotation. Biol. Psychiatry 58, 245–253.
Bikhchandani, S., Hirshleifer, D., and Welch, I. (1992). A theory of fads, fashion, custom, and cultural-change as informational cascades. J. Polit. Econ. 100, 992–1026.
Bond, R., and Smith, P. B. (1996). Culture and conformity: a meta-analysis of studies using Asch’s (1952b, 1956) line judgment task. Psychol. Bull. 119, 111–137.
Botvinick, M., Nystrom, L. E., Fissell, K., Carter, C. S., and Cohen, J. D. (1999). Conflict monitoring versus selection-for-action in anterior cingulate cortex. Nature 402, 179–181.
Boynton, G. M., Engel, S. A., Glover, G. H., and Heeger, D. J. (1996). Linear systems analysis of functional magnetic resonance imaging in human V1. J. Neurosci. 16, 4207–4221.
Brett, M., Anton, J. L., Valabregue, R., and Poline, J. B. (2002). Region of Interest Analysis Using an SPM Toolbox [abstract]. Presented at the 8th International Conference on Functional Mapping of the Human Brain, June 2–6, 2002, Sendai. Available on CD-ROM in Neuroimage 16.
Broyon, A., and Duka, A. (2006). One-Click Trading and the Global Liquidity Structure. e-Forex, October, 35–37. Bath: ASP Media.
Camerer, C., and Weigelt, K. (1991). Information mirages in experimental asset markets. J. Bus. 64, 463–493.
Dale, A. M., and Bruckner, R. L. (1997). Selective averaging of rapidly presented individual trials using fMRI. Hum. Brain Mapp. 5, 329–340.
Dale, R. S., Johnson, J. E. V., and Tang, L. (2005). Financial markets can go mad: evidence of irrational behaviour during the South Sea Bubble. Econ. Hist. Rev. 58, 233–271.
Danchin, E., Giraldeau, L. A., Valone, T. J., and Wagner, R. H. (2004). Public information: from nosy neighbors to cultural evolution. Science 305, 487–491.
Deaner, R. O., Khera, A. V., and Platt, M. L. (2005). Monkeys pay per view: adaptive valuation of social images by rhesus macaques. Curr. Biol. 15, 543–548.
Delgado, M. R., Frank, R. H., and Phelps, E. A. (2005). Perceptions of moral character modulate the neural systems of reward during the trust game. Nat. Neurosci. 8, 1611–1618.
Fisher, H., Aron, A., and Brown, L. L. (2005). Romantic love: an fMRI study of a neural mechanism for mate choice. J. Comp. Neurol. 493, 58–62.
Fliessbach, K., Weber, B., Trautner, P., Dohmen, T., Sunde, U., Elger, C. E., and Falk, A. (2007). Social comparison affects reward-related brain activity in the human ventral striatum. Science 318, 1305–1308.
Galef, B. G., and Laland, K. N. (2005). Social learning in animals: Empirical studies and theoretical models. Bioscience 55, 489–499.
Greene, J. D., Nystrom, L. E., Engell, A. D., Darley, J. M., and Cohen, J. D. (2004). The neural bases of cognitive conflict and control in moral judgment. Neuron 44, 389–400.
Hansen, W., and Putler, D. (1996). Hits and misses: herd behavior and online product popularity. Market. Lett. 7, 297–305.
Heyes, C. M. (1994). Social-learning in animals – categories and mechanisms. Biol. Rev. Camb. Philos. Soc. 69, 207–231.
Hoppitt, W., and Laland, K. N. (2008). Social processes influencing learning in animals: a review of the evidence. Adv. Study Behav. 38, 105–165.
Izuma, K., Saito, D. N., and Sadato, N. (2008). Processing of social and monetary rewards in the human striatum. Neuron 58, 284–294.
Josephs, O., and Henson, R. N. (1999). Event-related functional magnetic resonance imaging: modelling, inference and optimization. Philos. Trans. R. Soc. Lond., B, Biol. Sci. 354, 1215–1228.
Klucharev, V., Hytonen, K., Rijpkema, M., Smidts, A., and Fernandez, G. (2009). Reinforcement learning signal predicts social conformity. Neuron 61, 140–151.
Maldjian, J. A., Laurienti, P. J., Kraft, R. A., and Burdette, J. H. (2003). An automated method for neuroanatomic and cytoarchitectonic atlas-based interrogation of fMRI data sets. Neuroimage 19, 1233–1239.
Murray, G. K., Corlett, P. R., Clark, L., Pessiglione, M., Blackwell, A. D., Honey, G., Jones, P. B., Bullmore, E. T., Robbins, T. W., and Fletcher, P. C. (2008). Substantia nigra/ventral tegmental reward prediction error disruption in psychosis. Mol. Psychiatry 13:239, 267–276.
Noth, M., and Weber, M. (2003). Information aggregation with random ordering: cascades and overconfidence. Econ. J. 113, 166–189.
Preuschoff, K., Bossaerts, P., and Quartz, S. R. (2006). Neural differentiation of expected reward and risk in human subcortical structures. Neuron 51, 381–390.
Tomlin, D., Kayali, M. A., King-Casas, B., Anen, C., Camerer, C. F., Quartz, S. R., and Montague, P. R. (2006). Agent-specific responses in the cingulate cortex during economic exchanges. Science 312, 1047–1050.
Keywords: herd behavior, decision making, neuroeconomics, ventral striatum, anterior cingulate, amygdala
Citation: Burke CJ, Tobler PN, Schultz W and Baddeley M (2010) Striatal BOLD response reflects the impact of herd information on financial decisions. Front. Hum. Neurosci. 4:48. doi: 10.3389/fnhum.2010.00048
Received: 19 August 2009;
Paper pending published: 22 January 2010;
Accepted: 16 May 2010;
Published online: 07 June 2010
Edited by:
Tor Wager, Columbia University, USAReviewed by:
Mauricio R. Delgado, Rutgers University, USAKarin Foerde, Columbia University in the City of New York, USA
Copyright: © 2010 Burke, Tobler, Schultz and Baddeley. This is an open-access article subject to an exclusive license agreement between the authors and the Frontiers Research Foundation, which permits unrestricted use, distribution, and reproduction in any medium, provided the original authors and source are credited.
*Correspondence: Christopher J. Burke, Department of Physiology, Development and Neuroscience, University of Cambridge, Downing Street, Cambridge CB2 3DY, UK. e-mail: c.j.burke.03@cantab.net