Fast optical imaging of human brain function
- 1 Department of Psychology, University of Illinois at Urbana-Champaign, Urbana, IL, USA
- 2 Beckman Institute, University of Illinois at Urbana-Champaign, Urbana, IL, USA
Great advancements in brain imaging during the last few decades have opened a large number of new possibilities for neuroscientists. The most dominant methodologies (electrophysiological and magnetic resonance-based methods) emphasize temporal and spatial information, respectively. However, theorizing about brain function has recently emphasized the importance of rapid (within 100 ms or so) interactions between different elements of complex neuronal networks. Fast optical imaging, and in particular the event-related optical signal (EROS, a technology that has emerged over the last 15 years) may provide descriptions of localized (to sub-cm level) brain activity with a temporal resolution of less than 100 ms. The main limitations of EROS are its limited penetration, which allows us to image cortical structures not deeper than 3 cm from the surface of the head, and its low signal-to-noise ratio. Advantages include the fact that EROS is compatible with most other imaging methods, including electrophysiological, magnetic resonance, and trans-cranial magnetic stimulation techniques, with which can be recorded concurrently. In this paper we present a summary of the research that has been conducted so far on fast optical imaging, including evidence for the possibility of recording neuronal signals with this method, the properties of the signals, and various examples of applications to the study of human cognitive neuroscience. Extant issues, controversies, and possible future developments are also discussed.
Introduction
The last few decades have seen an enormous increase in the number of studies about human brain function (Barinaga, 1997 ; Bandettini, 2009 ). This meteoric increase has been in large part due to the introduction of a series of new methodologies for the non-invasive measurement of brain physiological parameters, which we collectively label “brain imaging methods”. These non-invasive techniques have generated a new paradigm, which emphasizes mass activity as a useful level for theorizing about human brain function. The basic assumption is that it is possible to describe the human brain as a collection of macroscopic structures with sizes measurable from a few mm’s to several cm’s range, performing specialized functions over times ranging between tenths of ms to seconds or even longer, and whose synergistic interactions result in the emergence of overall brain states and behavioral outcomes. Ideally, therefore, brain imaging methods should be capable of describing brain activity with a level of spatial and temporal resolution consistent with these temporal and spatial parameters (mm and ms, respectively). In practice, however, the most commonly used techniques (functional magnetic resonance imaging, or fMRI, and the event-related brain potential, or ERP) only reach this level of resolution in one dimension (respectively, space and time) but not the other. To obviate this problem, researchers have proposed combining these two techniques, which however leads to a number of practical problems (e.g., Luck, 1999 ). Alternatively, the problem can be addressed by other methods, capable of reaching target values of both spatial and temporal resolution. In this paper we describe the use of fast optical signals, and in particular of a methodology called the Event-Related Optical Signal (or EROS, Gratton et al., 1995 ; Gratton and Fabiani, 2009 ) to achieve this result.
Fast optical signals refer to changes in optical scattering that occur in neural tissue when the tissue is active (depolarized or hyperpolarized), compared to when it is not. They were first described in the 1940’s (Hill and Keynes, 1949 ) in isolated nerves, and subsequently reported in hippocampal (Frostig et al., 1990 ; MacVicar and Hochman, 1991 ; Andrew and MacVicar, 1994 ) and brainstem slices (Momose-Sato et al., 1998 ), as well as integral brain preparations in both invertebrates (Stepnoski et al., 1991 ) and vertebrates (Rector et al., 1997 , 2005 ). As the response is blocked by tetrodoxin (Lee and Kim, 2010 ), it appears that opening and closing of ion channels is critical for its presence. Current research (Foust and Rector, 2007 ) suggests that the biological basis of the phenomenon is swelling (in the case of depolarization, Buchheim et al., 1999 ; Lee and Kim, 2010 ) or shrinking (in the case of hyperpolarization, Momose-Sato et al., 1998 ) of neurites (mostly dendrites) due to movement of water across the membrane associated with ion transport (see also Lee and Kim, 2010 for a biophysical model of scattering phenomena associated with neural function).
Because of their association with neuronal activity (rather than hemodynamic responses, which follow several seconds later), fast optical signals can potentially yield measures of brain activity with high (ms-level) temporal resolution, comparable to those of electrophysiological methods (as demonstrated by the work of Stepnoski et al., 1991 ; Rector et al., 1997 , 2005 ). In the last several years our lab and others have worked to determine whether (a) fast optical signals can be recorded non-invasively in humans; and (b) whether the data can provide the combination of spatial and temporal resolution required for research in cognitive neuroscience.
Although recording of optical changes in exposed cortex has been carried out for several decades yielding images with exquisite spatial resolution (e.g., Grinvald et al., 1986 ), non-invasive measurement presents some challenges, which clearly limit the spatial resolution that can be achieved. Head tissues, such as the skin, skull, and meninges both absorb (mostly in the visible range) and scatter light. Light absorption is mostly due to the hemoglobin present in the blood, and can be minimized by using light in the far red and near-infrared (NIR) spectrum (Frostig et al., 1990 ). At these wavelengths, the major limitation to cortical imaging is due to scattering, which is mostly due to mitochondria, membranes, and other vesicles present in the tissue (Beauvoit et al., 1995 ). To image deep tissues a successful approach has been diffusive optical imaging (Jobsis, 1977 ; Gratton et al., 1997 ). Although initially this approach produced images with low spatial resolution, current methodology (based on the use of a large density of recording channels and of particular measurement procedures described in the section Materials and Methods) has pushed the spatial resolution to a sub-cm level (Gratton and Fabiani, 2003 ). With this methodology, our group (Gratton et al., 1995 ; for a review, see Gratton and Fabiani, 2009 ), as well as others (e.g., Steinbrink et al., 2000 ; Wolf et al., 2002 ; Franceschini and Boas, 2004 ; Lebid et al., 2005 ; Tse et al., 2006 ; Kubota et al., 2008 ; Medvedev et al., 2008 ) have shown that fast optical signals can be recorded consistently, with a combination of spatial and temporal resolution that is adequate for the type of neuroimaging research considered above. However, other groups have questioned this possibility (Steinbrink et al., 2005 ; Radakrishnan et al., 2009 ). In the remainder of this paper we present our methodology for recording fast optical signals (EROS) (see Materials and Methods) and review the evidence in favor and against the non-invasive recording of fast optical signals and current data about its spatial and temporal resolution (see Results). In the Discussion we evaluate the current status of the research and possible future directions.
Materials and Methods
Propagation of Light Through Tissue
Using light to generate images of brain function is a well-tested approach (Frostig, 2009 ). However, with diffuse illumination (as in normal lighting situations), penetration is reduced to a few mm, because of the strongly scattering and absorption properties of head tissues. To circumvent this problem and obtain images of cortical activity without opening the skull and/or lesioning the brain, it is necessary to use a different approach, called diffusive optical imaging. This approach is based on separating the locations from which light is inserted into the tissue (sources) from those at which it is measured (detectors) (see Figure 1 ). Point sources of NIR light are positioned at various locations on the surface of the head. Because of the scattering properties of the tissue, the light propagates in a random fashion around the source. A detector located at some distance will pick up some of this light. The combination of sources and detectors identifies spindles through which photons are likely to travel during their random motion. As the head is bounded by a non-scattering surface, photons that reach the surface in their random motion will penetrate a non-scattering medium, and therefore move in a straight line and permanently exit the head. Therefore photons that travel too close to the surface of the medium are not likely to reach distant detectors. This determines a “curvature” of the statistical spindles describing the motion of the photons. The maximum spindle depth is located approximately half-way between the source and the detector; the actual penetration depends, among other factors, on the source-detector distance. In practice, source-detector distances varying between 3–5 cm afford depths of the central portion of the spindle varying between 1–3 cm; this range of depths is sufficient to explore large areas of the cortical surface (such as large parts of the occipital, parietal, temporal, and frontal cortex), although some areas (such as medial temporal cortex, basal ganglia, the ventral surface of the cortex and deep regions inside sulci) are not accessible to this type measurement.
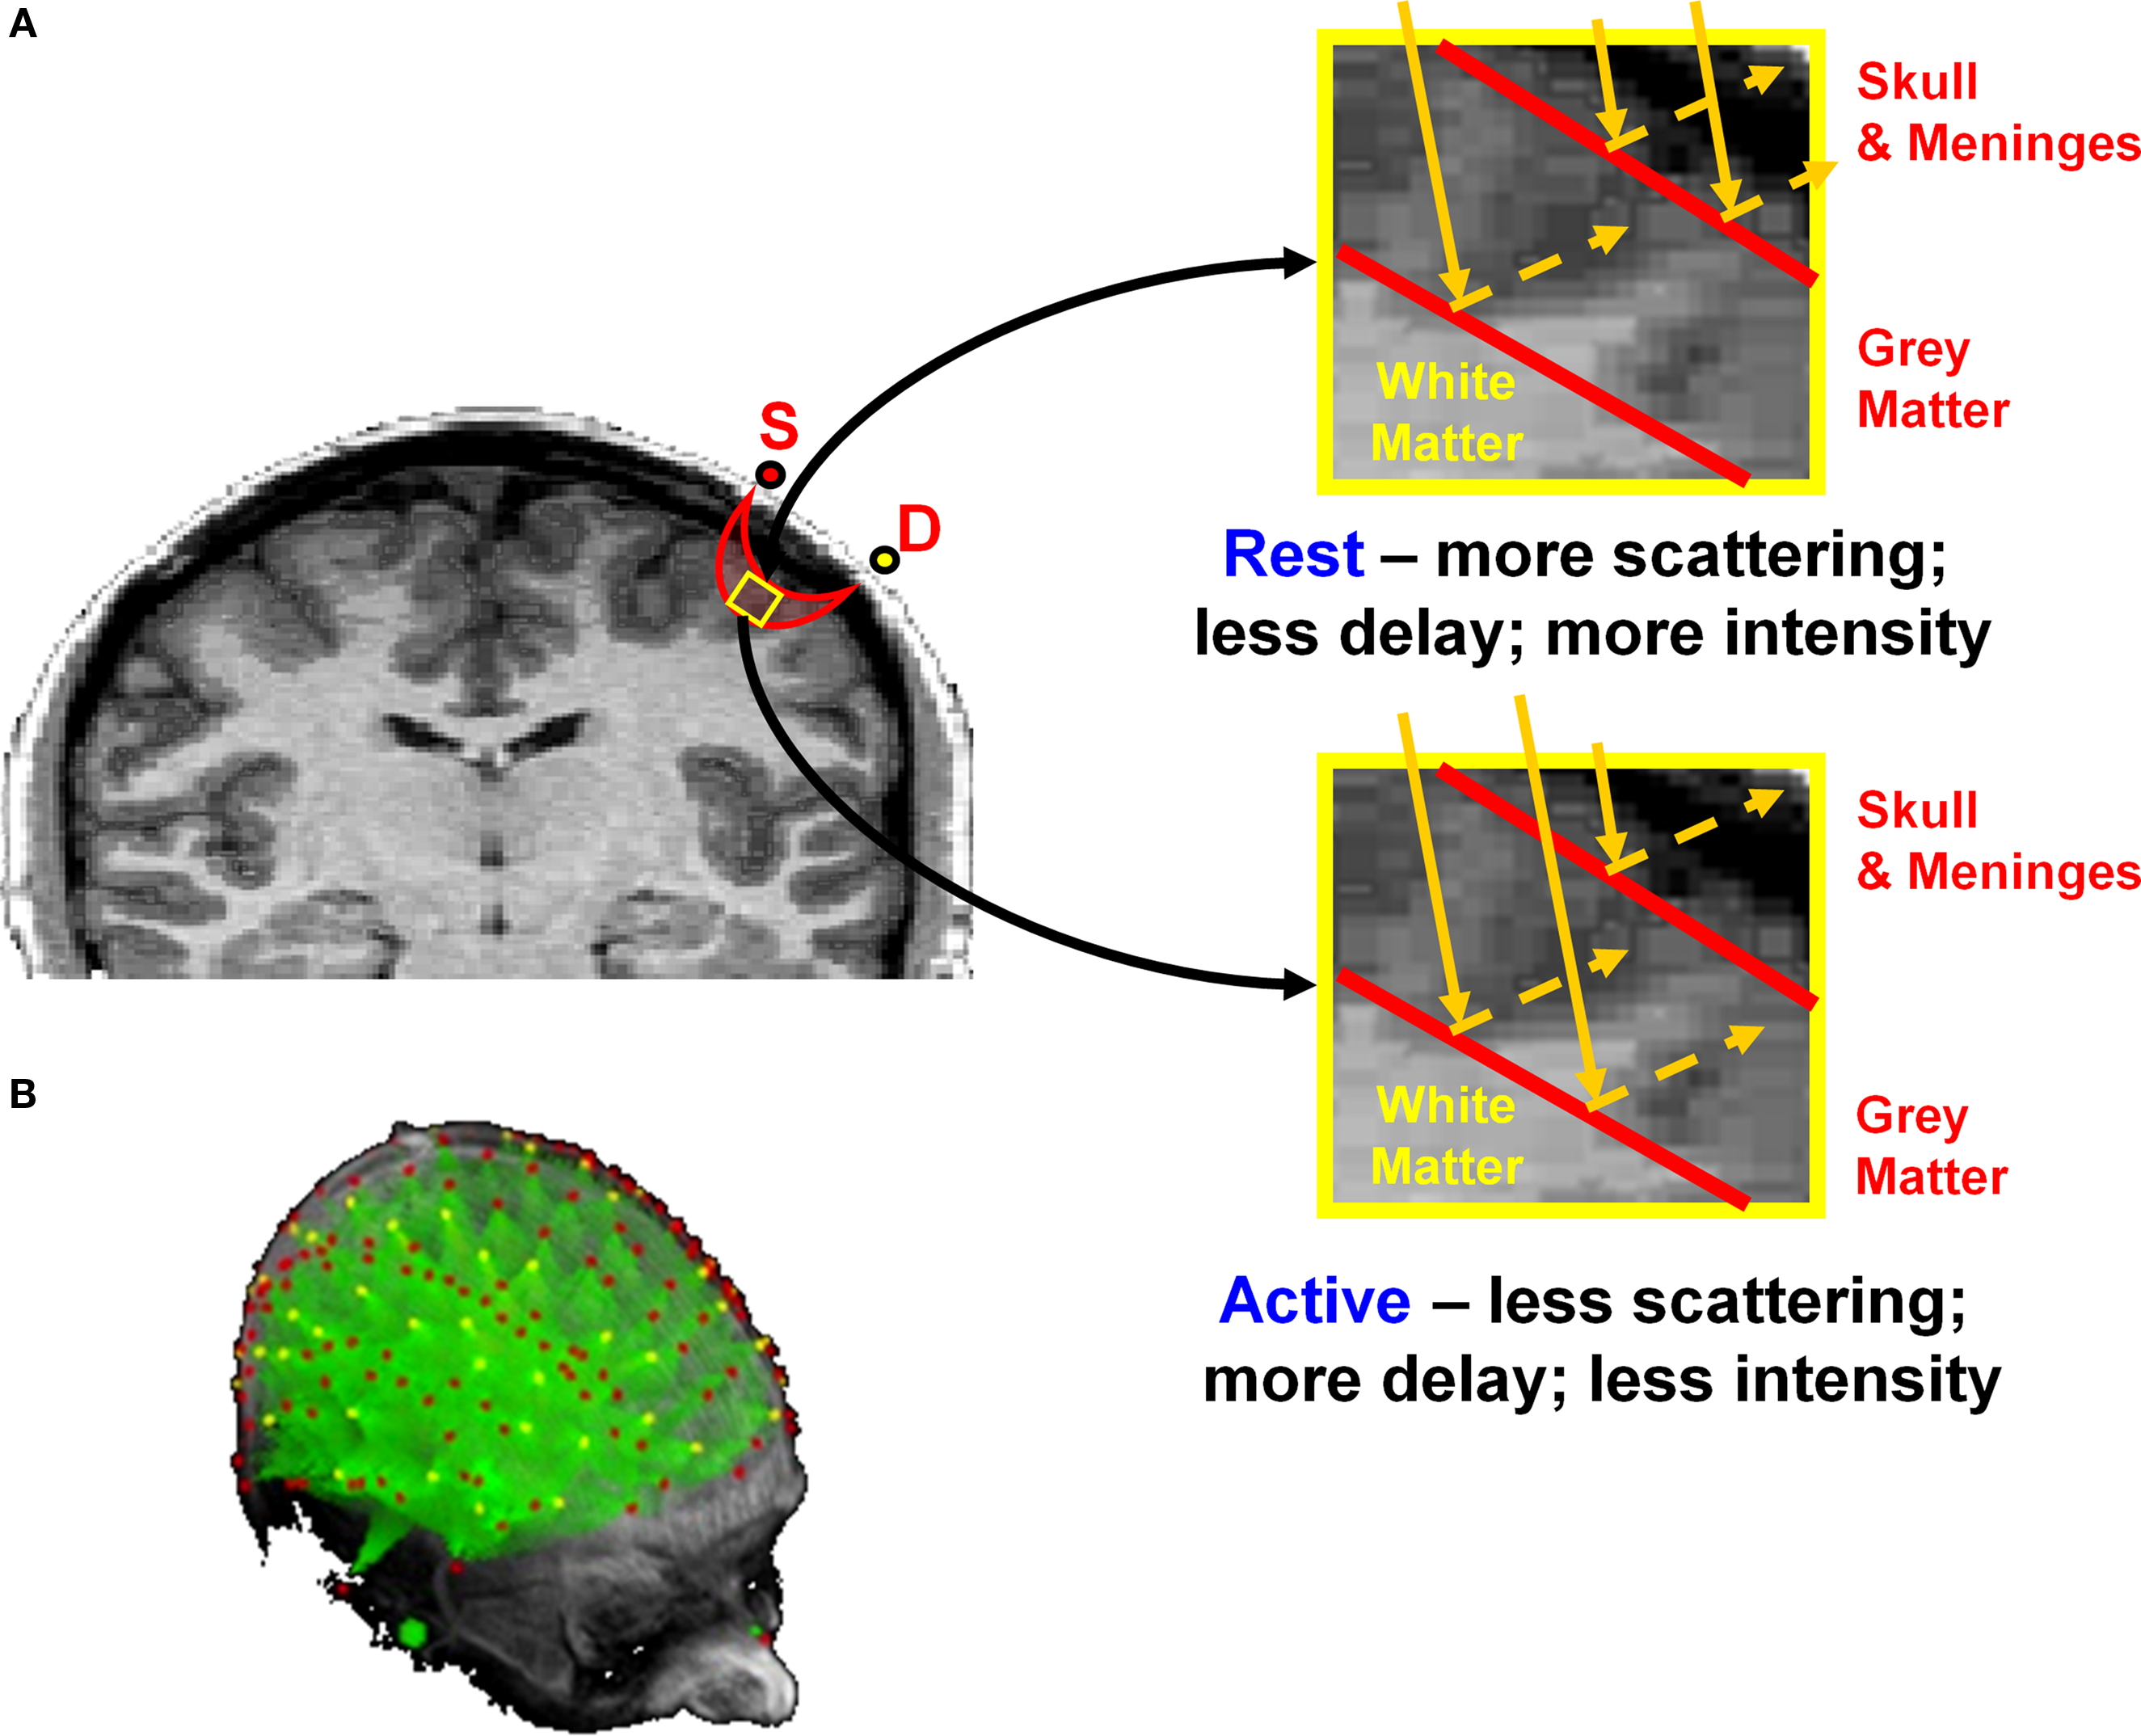
Figure 1. (A) Schematic representation of the back-scattering of photons under conditions of rest and activity in the cortex. S = Source (red dot); D = detector (yellow dot). As shown in the right panels, changes in transparency of the cortex are associated with changes in photon penetration and path length. Adapted from Figure 7 in Gratton and Fabiani (2003) . (B) Projections (in green) of the areas investigated by a large number of optical sources (red dots) and detectors (yellow dots) onto 3D renditions of an MR anatomical image.
Measurement of Light Parameters
Two basic technologies for diffusive optical imaging are currently available. The first technology, called continuous-wave (or CW) method, is based on constant (or slowly oscillating, <10 kHz) sources of light. With this approach, only the total amount of light emitted by sources and reaching the detector can be measured (intensity or DC intensity). In contrast, the other technology uses rapidly varying sources of light, which afford measurement not only of the amount of variations in light intensity, but also of the time required by photons to move between a source and a detector (time of flight). Because of the diffusive nature of the photon movement and of the high refraction index of tissue, this time is in the ps or ns range. Photons’ time of flight is most conveniently measured in the frequency domain (FD), as the phase delay of a photon density wave moving between the source and the detector. Currently, commercially available FD devices use sources that are modulated at frequencies ranging between 100 and 300 MHz. They can be used to derive three types of measures: average (or DC) intensity, amplitude of the intensity changes at the modulation frequency (AC intensity), and phase delay. In principle, even more information about the distribution of time-of-flight of individual photons can be obtained by time-resolved (or TR) method, which use pulsating time-sources, but these devices are more expensive and difficult to use.
Continuous-wave and frequency domain methods each offer advantages and disadvantages. CW methods are typically less expensive. However, phase delay measures may provide important data that are not available using intensity data alone. For example, phase data can be used to compute absolute absorption and scattering coefficients for a particular region. Although this may be very important for clinical studies, this measurement is complex, and is rarely conducted in fast signal studies. It is very important to understand that intensity and phase data are fundamentally different. Intensity measures are essentially counts of the photons reaching the detector. Phase delay data instead measure the average arrival time of photons. This implies that photons are weighted by their time-of-arrival, with increments or decrements in the number of photons that have times-of-flight shorter than the mean producing opposite effects than increments or decrements in the number of photons that have times-of-flight longer than the mean. Photons traveling deep inside the head typically travel longer distances (and have therefore longer times-of-flights) than photons traveling more superficially. As a consequence, variations in the number of photons traveling deep will have an opposite effect on the phase delay parameter than variations in the number of photons traveling superficially. In other words, the net effects of absorption or scattering changes on the photon delay parameter are critically dependent on where the changes occur. This has three critical consequences for fast optical imaging: (a) phase delay measures have a very different depth-sensitivity compared to intensity measures, with greater sensitivity for deeper locations (this is due to the fact that photons traveling a very long path have very long times-of-flight, and greater influence on the mean value measured by phase delay)); (b) phase delay measures have a greater spatial resolution than intensity measures (this is because even small changes in the relative number of photons traveling long or short paths may have a large effect on the phase value); and (c) phase delay measures are largely insensitive to the total amount of light (and variations thereof) injected into the tissue, or picked up at the detector (this because these changes will equally influence photons traveling long and short paths, and therefore have no net effect on the phase parameter). This makes phase delay measures largely insensitive to movements (Schneider-Garces et al., 2009 ), which cause changes at the interface between the sources and detectors and the head. These movement-related changes instead cause large artifacts on intensity measures, which need to be dealt with appropriate procedures (Sato et al., 2006 ; Medvedev et al., 2008 ; Huppert et al., 2009 ; Schneider-Garces et al., 2009 ; Robertson et al., 2010 ). These three factors make the phase delay parameter particularly interesting for deriving images of brain activity with high spatial and temporal resolution.
Co-Registration and Image Reconstruction
Optical data provide little anatomical information. As a consequence, to determine the area of the brain to which measurements relate it is important to provide an anatomical frame of reference. In initial studies, this frame of reference was based on surface scalp measures (e.g., inion, vertex, e.g., Gratton et al., 1995 ). However, this frame of reference is very approximate. Therefore, we now routinely co-register the locations of sources and detectors to structural MR images obtained on the same subjects, using both fiducial alignment and fitting methods (Whalen et al., 2008 ). These co-registration methods lead to errors of less than 3–4 mm.
To produce images, it is necessary to obtain measurements from a number of locations. CW and FD systems allowing for concurrent recording from multiple locations are currently commercially available. In general, because of the scattering and absorption properties of tissue, a detector can only pick up light emitted from source less than 5–6 cm away. In addition, even much closer sources can be separated from each other if they are time-, frequency- or wavelength-multiplexed. This permits to achieve a very high spatial sampling, with a channel (defined as a combination of a source and a detector) every few squares cm. Wolf et al. (2000) showed that using a high spatial sampling and multiple channels with overlapping “curved spindles” may result in large increases in the spatial resolution of optical imaging data. According to our computations (e.g., Gratton and Fabiani, 2003 ), the spatial resolution thus obtained can be as high as 15–20 mm for intensity measures and 5–10 mm for phase delay measures (which, as mentioned above, have a greater spatial resolution than intensity measures). This spatial resolution is comparable to that of most fMRI studies.
The majority of the fast optical imaging studies reported so far are based on surface-projected images. These images are typically obtained by back-projection, a technique in which the values obtained from a particular channel are represented as changes occurring at particular locations (or areas) on the brain surface in between the source and the detector. If the same location lies in between multiple combinations of sources and detectors, the corresponding values are combined (typically by arithmetic averaging for phase measures or geometric averaging for intensity measures; Wolf et al., 2000 ; Gratton and Fabiani, 2009 ). Statistical analysis can then be conducted pixel-wise in a manner analogous to what is done for fMRI, using appropriate corrections for multiple comparisons (Kiebel et al., 1999 ). Three-dimensional reconstruction algorithms for intensity data have also been proposed (Roggan et al., 1994 ; Zhu et al., 1997 ; Boas et al., 2001 ; Intes et al., 2002 , 2004 ; Fukui et al., 2003 ). We have recently developed three-dimensional reconstruction algorithms that can be used for both intensity and phase data; these methods are currently under evaluation.
Artifact Treatment and Noise Reduction
Fast signals are very small (of the order of 1/1000 for intensity measures and ps or fractions thereof for phase delay measures). These signals need to be separated from noise that may be several orders of magnitude larger. Two types of noise are important: large, non-random noise, which occurs sporadically or it is clearly of non-brain origin (artifacts), and small, random noise, which occurs continuously and it may be generated by a host of factors including brain and other physiological phenomena (background noise).
There are two major sources of artifacts in fast optical imaging: movements and changes related to hemodynamics. As mentioned above, intensity data are particularly sensitive to changes in the interface between the optical instrumentation and the head surface, which may occur during large head movements. These changes are particularly significant when the connection between the instruments and the head is not very tight. Therefore, use of appropriate holders for the optical devices may greatly reduce this type of artifact. In addition, investigators have proposed a number of approaches for dealing with this artifact, including discarding trials with evidence of movement artifact (using algorithms for identifying such artifacts on regular channels – Sato et al., 2006 ; Huppert et al., 2009 ; Schneider-Garces et al., 2009 ; Robertson et al., 2010 ), or correcting the estimated effect of artifact either using regression methods (this requires estimating the occurrence of movements through specialized channels with source-detector distances so short to not be likely to be influenced by brain effects – e.g., Medvedev et al., 2008 ) or statistically-based methods (in which the principal components of data are assumed to be due to movements and discarded from the data – Huppert et al., 2009 ; Robertson et al., 2010 ). In any case, for the reasons explained earlier, phase data appear largely impervious from movement artifacts (Schneider-Garces et al., 2009 ), so that movement correction does not appear necessary in this case. The second source of artifacts is related to hemodynamic effects, which cause changes in absorption that may overlap with the fast effects. Some of these changes, such as those due to the vasodilation effects that form the basis of the fMRI Blood-Oxygenation-Level-Dependent (BOLD) signal, are very slow and can be easily separated from fast signals through frequency filtering. Others, due to the oscillations occurring during a cardiac cycle, are very rapid (about 1 Hz). To eliminate these artifacts we (Gratton and Corballis, 1995 ) developed an adaptive filtering algorithm that is effective in greatly reducing the pulse artifact.
Background noise can be reduced significantly using signal averaging. This procedure, however, introduces the problem of having to record a large number of trials, which may impose limits in the experimental design. Another approach that is often used in combination with averaging is filtering. Three types of filters have been most commonly used: frequency filters (Maclin et al., 2003 ), spatial filters and statistically-based adaptive filtering (e.g., application of independent component analysis, or ICA, Morren et al., 2004 ; Medvedev et al., 2008 ). The first two approaches have the limitation of reducing the temporal or spatial resolution of data. The third requires making specific assumptions about what constitutes signal and what should be considered as noise. In any case, large improvements in signal-to-noise ratio (SNR) have been obtained using these approaches (Maclin et al., 2003 ; Medvedev et al., 2008 ).
Finally, a practical problem in most brain optical imaging studies is the presence of hair, which, depending on the color, may absorb a large proportion of the light used for the measurement, thus greatly limiting our ability to image brain activity. It is therefore essential to comb the hair away from sources and detectors. This greatly improves the ability to record optical data without participants’ exclusion. Note that similar procedures are also routinely applied for EEG recording.
Results
Detection of the Fast Optical Signal
To demonstrate the existence of the fast optical signal, our lab and others have shown that (a) a fast response with latency compatible with a known signal is consistently present in optical data (e.g., Gratton et al., 1997 , 2001 ; Rinne et al., 1999 ; DeSoto et al., 2001 ; Tse et al., 2006 , 2007 ); (b) this response does not occur in appropriately selected control conditions (e.g., Gratton et al., 1995 , 2000 , 2009 ; DeSoto et al., 2001 ; Wolf et al., 2002 ; Franceschini and Boas, 2004 ; Tse et al., 2006 ; Medvedev et al., 2008 ). These control conditions need to be chosen so as to eliminate any account that is not due to neural function.
There are now a large number (>30) of published studies that satisfy these requirements (see Gratton and Fabiani, 2009 for a recent review). These studies come from several different laboratories, involve both intensity and phase delay measures, and are based on a number of different paradigms. For example, in the study providing the first description of the fast optical signal (Gratton et al., 1995 ), four different visual stimulation conditions (one for each quadrant of the visual field) were used. Recordings were made from 12 locations over the occipital area chosen so as to yield a retinotopic map of primary visual cortex (V1). Thus, for each of the four stimulation conditions, a different quadrant of V1 was expected to be stimulated, with the control condition provided by the same quadrant of V1 when other visual field quadrants were stimulated. In this fashion each area provided a control for itself. The results indicated that the response (an increase of the phase delay with a latency of 50–100 ms from stimulation consistent with the initial response in V1 measured with electrophysiological methods) occurred only in the stimulated condition but not in the others, for each of the four quadrants of V1. Although the original study was based on a small N, this finding was replicated in a subsequent study with a larger N, a higher sampling rate (20 ms), and a higher spatial sampling (Gratton and Fabiani, 2003 ). This study showed a response characterized by an increase in phase delay peaking at a latency of approximately 80 ms from stimulation. Results from this replication study are reported in Figure 2 . Similarly, Gratton et al. (2000) presented stimuli varying in stimulus eccentricity (1, 2, 4, and 8 degrees). According to the known retinotopic organization of primary visual cortex, it was predicted that the location of the response in V1 should occur at progressively deeper locations depending on the eccentricity of the visual stimulus (this was controlled using an fMRI study on the same subjects). In this case, the prediction was that the response should occur in optical channels with progressively greater source-detector distance, reflecting their change in penetration inside the head. As for the previous study, each set of channels with different source-detector distance would serve as both the one in which the response should be observed and as a control when it should not. The results were consistent with the predictions: the source-detector distance of channels showing the maximum response (as in the other studies, an increase in phase delay with a latency of 80 ms from stimulation) varied systematically as a function of stimulus eccentricity. As in the previous example, in this case the finding was replicated in a recent study (see Figure 3 , Maclin et al., 2008 ).

Figure 2. Adapted from Gratton et al. (2003) . The left panel depicts the stimulation conditions used and the cortical regions that are predicted to carry the response. The right panel indicated the EROS time course from the predicted location averaged across the four stimulation conditions (thick lines), and the responses from the same locations when the other stimulation conditions where presented (thin lines). Error bars are based on the standard error of the mean (N = 8).
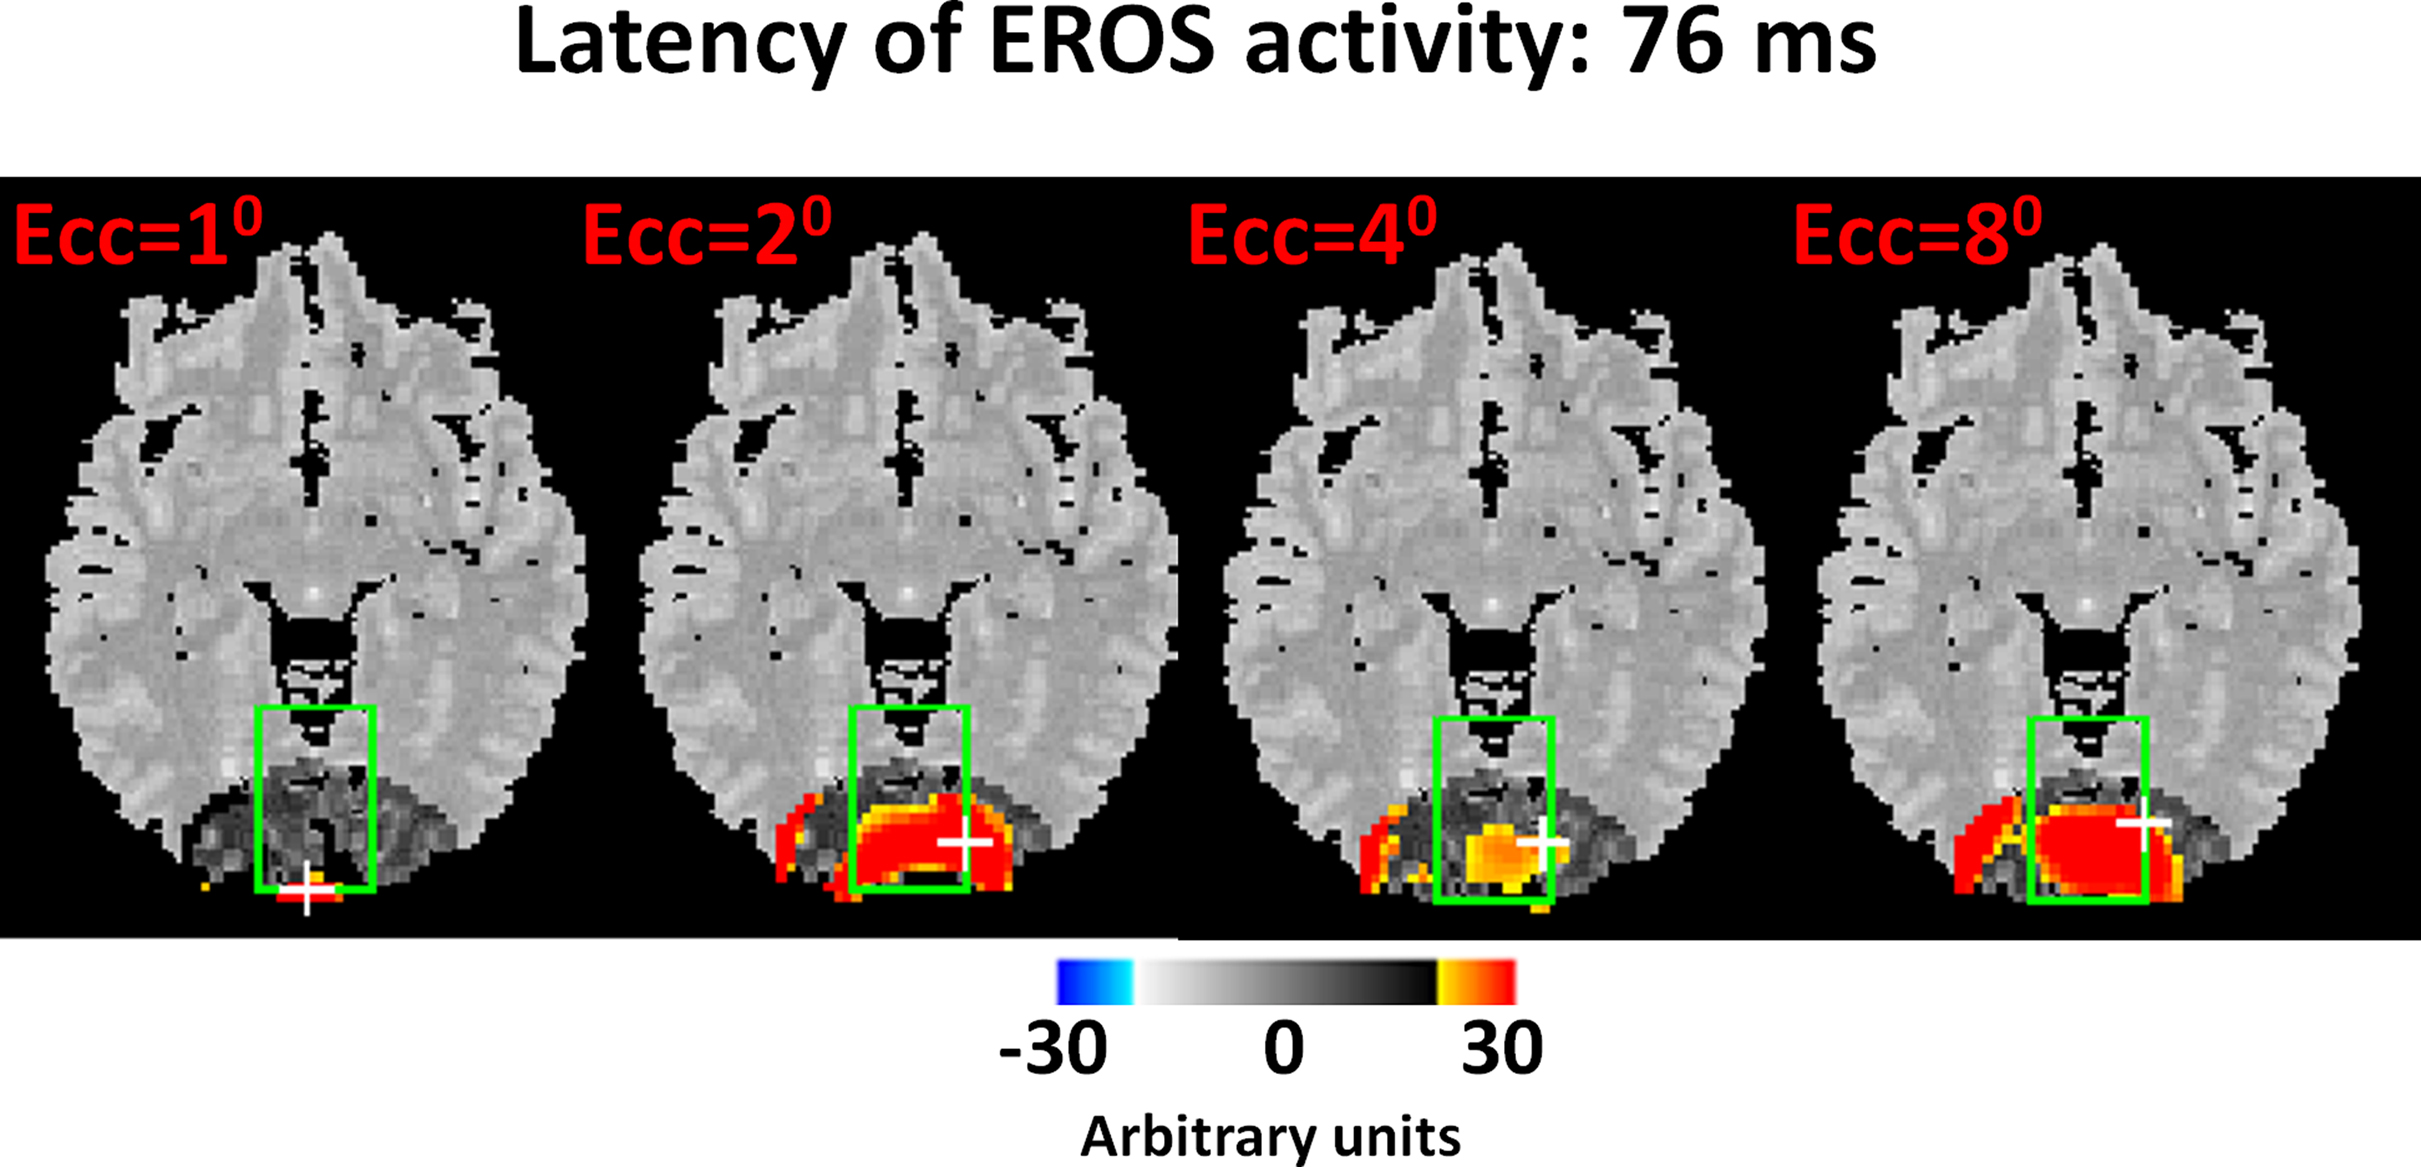
Figure 3. From Maclin et al. (2008) . Three-dimensional reconstruction of EROS phase delay data for each stimulus eccentricity condition (Ecc = stimulus eccentricity). The data are grand average maps (N = 14) of an axial slice (z = –10 in MNI space) obtained at a latency of 76 ms from stimulation (sampling rate was 25.6 ms). The white crosses indicate the peak points. The data are displayed in arbitrary phase units.
Notwithstanding the large number of controlled studies supporting the detection of an optical response, there have been a handful of studies that have presented apparently contrasting results. Of these studies, all based on intensity measures, one was conducted in humans (Steinbrink et al., 2005 ) and one intradurally in monkeys (Radakrishnan et al., 2009 ). The Steinbrink et al. (2005) is based on somatosensory stimulation. The authors reported the occurrence of a significant fast optical response only when the stimulation was above threshold for motor response: this led them to consider likely that the observed response was based on movement artifacts, thus contradicting an earlier report from the same group (Steinbrink et al., 2000 ). However, it should be noted that movements of the head were not monitored, and a reduction of the neuronal response as a function of a weaker stimulation could have been predicted on the basis of extant knowledge. The authors also reported failure to identify responses in the case of visual stimulation, but the recording conditions appear to vary significantly across subjects. In both the somatosensory and visual conditions, very few recording channels were used (1 or 2), which is clearly sub-optimal, and no alignment with anatomical structures was used. The Radakrishnan et al. (2009) study reports absence of a fast optical response in the primary visual cortex of a macaque monkey, thus apparently contradicting not only the human studies, but also the animal studies reviewed earlier in this paper. A problem with this study is that the sources and detectors were located at a distance of approximately 1 cm from each other, in very close proximity to the surface of the visual cortex. As the thickness of V1 in macaque is less than 2 mm, it is quite possible that the curved spindles describing the optical sensitivity would have overshot the active area of the brain. Although they report the occurrence of slow, hemodynamic responses with CW methods, these responses are known to have a lower spatial resolution (see Frostig et al., 1990 for a demonstration of the spread of the slow hemodynamic responses), and thus they may originate in different areas, not investigated with fast responses. If this proved to be the case, it would suggest that fast optical signals need dense and extended spatial sampling for appropriate recording. The Radakrishnan et al. (2009) paper also reports FD measurements, but neither fast nor slow responses were reliably observed with these methods, suggesting the occurrence of methodological problems. Both studies also report Monte Carlo simulations indicating that, if existent, the fast optical response should have been observable, but only with intensity and not with phase measures. However, the results of these simulations contradict other simulations presented previously by one of the two groups (Franceschini and Boas, 2004 ). Further, these simulations only explore a relatively small set of conditions, not necessarily covering real life situations.
In summary, the vast majority of the published studies support the detection of fast optical responses in a variety of different paradigms. The fast optical response is typically characterized by a reduction in light intensity and an increase in phase delay at a latency corresponding to the expected time of cortical activation for each paradigm. Fast optical responses have been reported in visual (e.g., Gratton et al., 1995 , 2000 , 2001 , 2003 , 2006 ), auditory (Rinne et al., 1999 ; Fabiani et al., 2006 ; Tse et al., 2006 ; Tse and Penney, 2007 , 2008 ;), somatosensory (Steinbrink et al., 2000 ; Maclin et al., 2004 ; Franceschini and Boas, 2004 ) and motor cortex (DeSoto et al., 2001 ; Wolf et al., 2002 ; Morren et al., 2004 ), under appropriate modality-specific conditions. Further, fast optical responses have been observed in higher-order cortical regions including prefrontal and parietal cortex (Low et al., 2006 , 2009 ; Tse et al., 2006 , 2007 ; Medvedev et al., 2008 ; Gratton et al. 2009 ) in various paradigms using cognitive manipulations.
Spatial and Temporal Resolution of Fast Optical Imaging
The spatial resolution of fast optical imaging is partly dependent on the methods used for its measurement. Three sets of studies have specifically investigated this issue, all using tasks involving the activation of different segments of functionally organized cortical regions. They include the two visual stimulation experiments described above (Gratton et al., 1995 ; Gratton and Fabiani, 2003 ), and a study using finger tapping by Wolf et al. (2002) . All these studies have shown that fast optical imaging of phase data can distinguish between the activities of areas as close as 5–10 mm from each other, provided that sufficient spatial sampling is attained (at least 1 channel/square cm). However, the latter study also compared the spatial resolution of phase and intensity data, showing that phase data are much more localized than intensity data. An alternative approach is based on the statistical computation of the size of “resels” (volumes with uncorrelated error terms) obtained using the random field theory (Worsley et al., 1992 ; Kiebel et al., 1999 ). The results of this analysis are consistent with the spatial resolution estimates obtained with functional manipulations (5–10 mm spatial resolution for phase data, 10–20 mm for intensity data). The temporal resolution of optical data also appears to depend on the sampling rate adopted, at least for frequencies up to 100 Hz. In a series of studies in which ERPs and EROS were recorded simultaneously, the timing of the optical response appears to coincide with that of ERP responses, at least at the level of the sampling rate adopted (e.g., Tse et al., 2007 ). Note that current limits in the temporal and spatial resolution of EROS could be improved with hardware and software development. For example, current equipment requires multiplexing, thus limiting the temporal resolution of the technique. Recording hardware updates allowing for more parallel data collection would bring the temporal resolution on par with that obtained with ERPs and MEG.
Discussion
Taken together, the work published so far provides a strong support for the idea that fast optical signals (EROS) can be detected from surface recording, providing a tool for studying rapid changes in brain activity. The temporal and spatial resolutions of EROS depend in part on the methods used. However, when phase measures and high spatial sampling are adopted, the spatial resolution can be as high as 5–10 mm, in the range of most published fMRI work in cognitive neuroscience. The temporal resolution appears approximately similar to that obtained with EEG and ERPs, and again depends on the sampling rate.
When compared to other brain imaging methods, EROS has several advantages and some limitations. The major limitations include the restricted depth of penetration (a few cm from the head surface), and the low SNR, which renders it necessary to accrue data across a number of trials 1 . The major advantages are contained cost and relative portability (when compared to MRI, positron emission tomography – PET, and magnetoencephalography – MEG) and ease of concurrent recording with other measures. In fact, EROS can and has been recorded simultaneously with ERPs (e.g., DeSoto et al., 2001 ; Gratton et al., 2001 ), fMRI (Toronov et al., 2005 ; Zhang et al., 2005 ), and, in a current pilot study in our lab, Transcranial Magnetic Stimulation (TMS) without any evidence of interference in either direction. This is potentially a great asset as fast optical data may make an ideal bridge technology for neuroimaging data fusion (Barinaga, 1997 ).
The types of data obtained with EROS allow for different types of analyses, including study of the rapid interaction of different cortical regions. For example, Rykhlevskaia et al. (2006) showed that EROS can be used to identify the flow of information across cortical regions, as well as excitation and inhibition between cortical regions. They also showed that this interaction may be related to the anatomical connections between the areas (see also Gratton et al., 2009 ). These types of data may be critical for our theorizing about how different regions of the brain cooperate to perform cognitive functions.
Other methods can also be used to generate dynamic images of brain activity. For instance, MEG can be used to derive images combining spatial and temporal resolution comparable to those obtained with EROS (Hari et al., 2000 ). However, this is predicated on the use of complex analytical methods to address the inverse problem. These methods typically require simplifying assumptions about the properties of the signal to be modeled (cortical activity). Reliance on these simplifying assumptions is much less critical for EROS. Further, MEG is more expensive than EROS.
Another approach to achieve dynamic imaging of brain activity is to combine data from different imaging modalities (e.g., ERPs and fMRI, Luck, 1999 ). A problem with this approach is that this relationship is not well understood and probably subject to many variations. As mentioned earlier, because of its temporal similarity with ERPs and spatial affinity with fMRI, EROS can provide a bridge between these two modalities (e.g., Gratton et al., 1997 ), and serve to test and/or validate the presumed relationship between them. The combined recording of different modalities can also afford new intriguing views into brain function. For example, the combined use of EROS and source-localized ERP measures may help distinguish between the activity of inter-neurons and pyramidal cells. This may be possible because EROS is likely sensitive to both inter-neuron and pyramidal cell activity, whereas ERPs are selective for pyramidal neurons only, albeit with limited spatial resolution.
At present, EROS is still in its infancy. Applications to various areas of cognitive neuroscience, such as attention (Gratton, 1997 ; DeSoto et al., 2001 ), sensory (Rinne et al., 1999 ; Fabiani et al., 2006 ; Tse et al., 2006 ; Tse and Penney, 2007 , 2008 ) and working (Low et al., 2006 ; Medvedev et al., 2008 ) memory, executive and preparatory (Gratton et al., 2008 ) processes, and language (Tse et al., 2007 ; Kubota et al., 2008 ) are beginning to appear in the last few years, as well as applications involving not only young adults but also older adults (Fabiani et al., 2006 ; Gratton et al., 2009 ). However, the methodology is still evolving. Current methodological research includes work on the development of more efficient hardware and data collection software (including both acquisition systems that are faster, allow for the recording from a larger number of channels, and have higher SNR and, more suitable devices for securely connecting the measurement system to the head), three-dimensional reconstruction algorithms for both intensity and phase data, filtering and data extraction systems, more efficient procedures to deal with artifact, and so on. It is likely that application of these methodological advancements will result in significant improvement in the quality of the data, including higher spatial and temporal resolution and higher SNR. Hopefully these advancements will lead to a new level of analysis of human brain function.
Conflict of Interest Statement
The authors declare no conflict of interest. Specifically, they have no ownership or financial interests in ISS, Inc.
Acknowledgments
The work presented in this paper was supported by NIA grant 1RC1AG035927 to Monica Fabiani and NIMH grant # MH080182 to Gabriele Gratton.
Footnote
- ^ Typical recordings aim at obtaining at least 50–100 trial per condition per subject. However, the exact number needed depends on the size of the signal, which varies somewhat in different cortical regions and as a function of task conditions. For example, visual experiments with repeated stimulation may require many more trials (several hundreds) than recordings from frontal cortex during attention-demanding tasks (a few dozen).
References
Andrew, R. D., and MacVicar, B. A. (1994). Imaging cell volume changes and neuronal excitation in the hippocampal slice. Neuroscience 62, 371–383.
Barinaga, M. (1997). New imaging methods provide a better view into the brain. Science 276, 1974–1976.
Beauvoit, B., Evans, S. M., Jenkins,T. W., Miller, E. E., and Chance, B. (1995). Correlation between the light scattering and the mitochondrial content of normal tissues and transplantable rodent tumors. Anal. Biochem. 226, 167–174.
Boas, D. A., Culver, J. P., Stot, J. J., and Dunn, A. K. (2001). Three dimensional Monte Carlo code for photon migration through complex heterogeneous media including the adult human head. Opt. Express 10, 159–170.
Buchheim, K., Schuchmann, S., Siegmund, H., Gabriel, H. J., Heinemann, U., and Meierkord, H. (1999). Intrinsic optical signal measurements reveal characteristic features during different forms of spontaneous neuronal hyperactivity associated with ECS shrinkage in vitro. Eur. J. Neurosci. 11, 1877–1882.
DeSoto, M. C., Fabiani, M., Geary, D. L., and Gratton, G. (2001). When in doubt, do it both ways: Brain evidence of the simultaneous activation of conflicting responses in a spatial Stroop task. J. Cogn. Neurosci. 13, 523–536.
Fabiani, M., Low, K. A., Wee, E., Sable, J. J., and Gratton, G. (2006). Reduced suppression or labile memory? Mechanisms of inefficient filtering of irrelevant information in older adults. J. Cogn. Neurosci. 18, 637–650.
Foust, A. J., and Rector, D. M. (2007). Optically teasing apart neural swelling and depolarization. Neuroscience 145, 887–899.
Franceschini, M. A., and Boas, D. A. (2004). Noninvasive measurement of neuronal activity with near-infrared optical imaging. Neuroimage 21, 372–386.
Frostig, R. D. (Ed.) (2009). In Vivo Optical Imaging of Brain Function, 2nd edn. (Boca Raton, FL: CRC Press).
Frostig, R. D., Lieke, E. E., Ts’o, D. Y., and Grinvald, A. (1990). Cortical functional architecture and local coupling between neuronal activity and the microcirculation revealed by in vivo high- resolution optical imaging of intrinsic signals. Proc. Natl. Acad. Sci. U.S.A. 87, 6082–6086.
Fukui, Y., Ajichi, Y., and Okada, E. (2003). Monte Carlo prediction of near-infrared light propagation in realistic adult and neonatal head models. Appl. Opt. 42, 2881–2887.
Gratton, E., Fantini, S., Franceschini, M. A., Gratton, G., and Fabiani, M. (1997). Measurements of scattering and absorption changes in muscle and brain. Philos. Trans. R. Soc. Lond., B, Biol. Sci. 352, 727–735.
Gratton, G. (1997). Attention and probability effects in the human occipital cortex: an optical imaging study. Neuroreport 8, 1749–1753.
Gratton, G., Brumback, C. R., Gordon, B.A., Pearson, M.A., Low, K. A., and Fabiani, M. (2006). Effects of measurement method, wavelength, and source-detector distance on the fast optical signal. Neuroimage, 32, 1576–1590.
Gratton, G., and Corballis, P. M. (1995). Removing the heart from the brain: compensation for the pulse artifact in the photon migration signal. Psychophysiology 32, 292–299.
Gratton, G., Corballis, P. M., Cho, E., Fabiani, M., and Hood, D. (1995). Shades of gray matter: Noninvasive optical images of human brain responses during visual stimulation. Psychophysiology 32, 505–509.
Gratton, G., Goodman-Wood, M. R., and Fabiani, M. (2001). Comparison of neuronal and hemodynamic measures of the brain response to visual stimulation: an optical imaging study. Human Brain Mapping 13, 13–25.
Gratton, G., and Fabiani, M. (2003). The event-related optical signal (EROS) in visual cortex: replicability, consistency, localization and resolution. Psychophysiology 40, 561–571.
Gratton, G., and Fabiani, M. (2009). “Fast optical signals: Principles, methods, and experimental results,” in In Vivo Optical imaging of Brain Function, 2nd edn, ed. R. D. Frostig (Boca Raton, FL: CRC Press), 435–460.
Gratton, G., Low, K. A., and Fabiani, M. (2008). “Time course of executive processes: data from the event-related optical signal (EROS),” in Perspectives on Rule-Guided Behavior, eds S. A. Bunge and J. D. Wallis (New York, NY: Oxford University Press) 197–223.
Gratton, G., Rykhlevskaia, E., Wee, E., Leaver, E., and Fabiani, M. (2009). Does white matter matter? Spatiotemporal dynamics of task switching in aging. J. Cogn. Neurosci. 21, 1380–1395.
Gratton, G., Sarno, A. J., Maclin, E., Corballis, P. M., and Fabiani, M. (2000). Toward non-invasive 3-D imaging of the time course of cortical activity: Investigation of the depth of the event-related optical signal (EROS). Neuroimage 11, 491–504.
Grinvald, A., Lieke, E., Frostig, R. D., Gilbert, C. D., and Wiesel, T. N. (1986). Functional architecture of cortex revealed by optical imaging of intrinsic signals. Nature 324, 361–364.
Hari, R., Levänen, S., and Raij, T. (2000). Timing of human cortical functions during cognition: role of MEG. Trends Cogn. Sci. 4, 455–462.
Hill, D. K., and Keynes, R. D. (1949). Opacity changes in stimulated nerve. J. Physiol. 108, 278–281.
Huppert, T. J., Diamond, S. G., Franceschini, M. A., and Boas, D. A. (2009). HomER: A review of time-series analysis methods for near-infrared spectroscopy of the brain. Appl. Opt. 48, 280–298.
Intes, X., Maloux, C., Guven, M., Yazici, M., and Chance, B. (2004). Diffuse optical tomography with physiological and spatial a priori constraints. Phys. Med. Biol. 49, 155–163.
Intes, X., Ntziachristos, V., Culver, J. P., Yodh, A., and Chance, B. (2002). Projection access order in algebraic reconstruction technique for diffuse optical tomography. Phys. Med. Biol. 47, 1–10.
Jobsis, F. F. (1977). Noninvasive, infrared monitoring of cerebral and myocardial oxygen sufficiency and circulatory parameters. Science 198, 1264.
Kiebel, S. J., Poline, J.-B., Friston, K. J., Holmes, A. P., and Worsley, K. J. (1999). Robust smoothness estimation in statistical parametric maps using standardized residuals from the general linear model. Neuroimage 10, 756–766.
Kubota, M., Inouchi, M., Dan, I., Tsuzuki, D., Ishikawa, A., and Scovel, T. (2008). Fast (100–175 ms) components elicited bilaterally by language production as measured by three-wavelength optical imaging. Brain Res. 1226, 124–133.
Lebid, S., O’Neill, R. O., Markham, C., Ward, T., and Cole, S. (2005). “Multi-timescale measurements of brain responses in visual cortex during stimulation using time-resolved spectroscopy,” in Proceedings of the SPIE conference, Bruges, Belgium.
Lee, J., and Kim, S. J. (2010). Spectrum measurement of fast optical signal of neural activity in brain tissue and its theoretical origin. Neuroimage 51, 713–722.
Low, K. A., Leaver, E., Kramer, A. F., Fabiani, M., and Gratton, G. (2006). Fast optical imaging of frontal cortex during active and passive oddball tasks. Psychophysiology 43, 127–136.
Low, K. A., Leaver, E., Kramer, A. F., Fabiani, M., and Gratton, G. (2009). Share or compete? Load-dependent recruitment of prefrontal cortex during dual-task performance. Psychophysiology 46, 1–11.
Luck, S. J. (1999). Direct and indirect integration of event-related potentials, functional magnetic resonance images, and single-unit recordings. Hum. Brain Mapp. 8, 115–120.
Maclin, E. L., Gratton, G., and Fabiani, M. (2003). Optimum filtering for EROS measurements. Psychophysiology 40, 542–547.
Maclin, E. L., Low, K. A., Sable, J. J., Fabiani, M., and Gratton, G. (2004). The Event Related Optical Signal (EROS) to electrical stimulation of the median nerve. Neuroimage 21, 1798–1804.
Maclin, E. L., Tse, C.-Y., Fabiani, M., and Gratton, G. (2008). Probing the depth of optical signals: a visual eccentricity study. Psychophysiology 45, S93.
MacVicar, B. A., and Hochman, D. (1991). Imaging of synaptically evoked intrinsic optical signals in hippocampal slices. J. Neurosci. 11, 1458–1469.
Medvedev, A. V., Kainerstorfer, J., Borisov, S. V., Barbour, R. L., and VanMeter, J. (2008). Event-related fast optical signal in a rapid object recognition task: Improving detection by the independent component analysis. Brain Res. 1236, 145–158.
Momose-Sato, Y., Sato, K., Hirota, A., and Kamino, K. (1998). GABA-Induced intrinsic light-scattering changes associated with voltage-sensitive dye signals in embryonic brain stem slices: coupling of depolarization and cell shrinkage. J. Neurophysiol. 79, 2208–2217
Morren, G., Wolf, M., Lemmerling, P., Wolf, U., Choi, J. H., Gratton, E., De Lathauwer, L., and Van Huffel, S. (2004). Detection of fast neuronal signals in the motor cortex from functional near infrared spectroscopy measurements using independent component analysis. Med. Biol. Eng. Comput. 42, 92–99.
Radakrishnan, H., Vanduffel, W., Deng, H. P., Ekstrom, L., Boas, D. A., and Franceschini, M. A. (2009). Fast optical signal not detected in awake behaving monkeys. Neuroimage 45, 419–419.
Rector, D. M., Carter, K. M., Volegov, P. L., and George, J. S. (2005). Spatio-temporal mapping of rat whisker barrels with fast scattered light signals. Neuroimage 26, 619–627.
Rector, D. M., Poe, G. R., Kristensen, M. P., and Harper, R. M. (1997). Light scattering changes follow evoked potentials from hippocampal Schaeffer collateral stimulation. J. Neurophysiol. 78, 1707–1713.
Rinne, T., Gratton, G., Fabiani, M., Cowan, N., Maclin, E., Stinard, A., Sinkkonen, J., Alho, K., and Näätänen, R. (1999). Scalp-recorded optical signals make sound processing from the auditory cortex visible. Neuroimage 10, 620–624.
Robertson, F., Douglas, T., and Meintjes, E. (2010). Motion artefact removal for functional near infrared spectroscopy: a comparison of methods. IEEE Trans. Biomed. Eng. 57, 1377–1387.
Roggan, A., Minet, O. Schroeder, C., and Mueller, G. (1994). Determination of optical tissue properties with double integrating sphere technique and Monte Carlo simulations. Proc. SPIE 2100, 42–56.
Rykhlevskaia, E., Fabiani, M., and Gratton, G. (2006). Lagged covariance structure models for studying functional connectivity in the brain. Neuroimage 30, 1203–1218.
Sato, H., Tanaka, N., Uchida, M., Hirabayashi, Y., Kanai, M., Ashida, T., Konishi, I., and Maki, A. (2006). Wavelet analysis for detecting body-movement artifacts in optical topography signals. Neuroimage 33, 580–587.
Schneider-Garces, N., Maclin, E., Gratton, G., and Fabiani, M. (2009). Movement correction in optical data: comparison between feature-based and principal component-based approaches. Psychophysiology 46, S108.
Steinbrink, J., Kempf, F. C., Villringer, A., and Obrig, H. (2005). The fast optical signal – robust or elusive when non-invasively measured in the human adult? Neuroimage 26, 996–1008.
Steinbrink, J., Kohl, M., Obrig, H., Curio, G., Syré, F., Thomas, F., Wabnitz, H., Rinneberg, H., and Villringer, A. (2000). Somatosensory evoked fast optical intensity changes detected non-invasively in the adult human head. Neurosci. Lett. 291, 105–108.
Stepnoski, R. A., LaPorta, A., Raccuia-Behling, F., Blonder, G. E., Slusher, R. E., and Kleinfeld, D. (1991). Noninvasive detection of changes in membrane potential in cultured neurons by light scattering. Proc. Natl. Acad. Sci. U.S.A. 88, 9382–9386.
Toronov V. Y., Zhang, X., Fabiani, M., Gratton, G., and Webb, A. G. (2005). “Signal and image processing techniques for functional near-infrared imaging of the human brain,” in Complex Dynamics and Fluctuations in Biomedical Photonics II, ed. V. V. Tuchin (Proc. SPIE Vol. 5696), San Jose, California, USA.
Tse, C.-Y., Lee, C.-L., Sullivan, J., Garnsey, S., Dell, G. S., Fabiani, M., and Gratton, G. (2007). Imaging the cortical dynamics of language processing with the event-related optical signal. Proc. Natl. Acad. Sci. U.S.A. 104, 17157–17162.
Tse, C. Y., and Penney, T. B. (2007). Preattentive change detection using the event-related optical signal. IEEE Eng. Med. Biol. Mag. 26, 52–58.
Tse, C. Y., and Penney, T. B. (2008). On the functional role of temporal and frontal cortex activation in passive detection of auditory deviance. Neuroimage 41, 1462–1470.
Tse, C. Y., Tien, K. R., and Penney, T. B. (2006). Event-related optical imaging reveals the temporal dynamics of right temporal and frontal cortex activation in pre-attentive change detection. Neuroimage 29, 314–320.
Whalen, C., Maclin, E. L., Fabiani, M., and Gratton, G. (2008). Validation of a method for coregistering scalp recording locations with 3D structural MR images. Hum. Brain Mapp. 29, 1288–1301.
Wolf, M., Wolf, U., Choi, J. H., Gupta, R., Safonova, L. P., Paunescu, L. A., Michalos, A., and Gratton, E. (2002). Functional frequency-domain near-infrared spectroscopy detects fast neuronal signal in the motor cortex. Neuroimage 17, 1868–1875.
Wolf, U., Wolf, M., Toronov, V., Michalos, A., Paunescu, L. A., and Gratton, E. (2000). “Detecting cerebral functional slow and fast signals by frequency-domain near-infrared spectroscopy using two different sensors,” in Paper Presented at OSA Meeting in Optical Spectroscopy and Imaging and Photon Migration, Miami, April 2–5, 2000.
Worsley, K. J., Evans, A. C., Marrett, S., and Neelin, P. (1992). A three-dimensional statistical analysis for CBF activation studies in human brain. J. Cereb. Blood Flow Metab. 12, 900–918.
Zhang, X., Toronov V. Y., Fabiani, M., Gratton, G., and Webb, A. G. (2005). The study of cerebral hemodynamic and neuronal response to visual stimulation using simultaneous NIR optical tomography and BOLD fMRI in humans. In K. E. Bartels, L. S. Bass, W.T. de Riese, K. W. Gregory, H. Hirschberg, A. Katzir, N. Kollias, S. J. Madsen, R. S. Malek, K. M. McNally-Heintzelman, L. P. Tate, Jr., E. A. Trowers, B. J.-F. Wong (Eds.). Proc. SPIE Vol. 5686, Photonic Therapeutics and Diagnostics (pp. 566–572),San Jose, California.
Keywords: event-related optical signal, non-invasive optical imaging, near-infrared spectroscopy, diffusive optical imaging, diffusive optical tomography, cognitive neuroscience
Citation: Gratton G and Fabiani M (2010) Fast optical imaging of human brain function. Front. Hum. Neurosci. 4:52. doi: 10.3389/fnhum.2010.00052
Received: 28 April 2010;
Paper pending published: 19 May 2010;
Accepted: 02 June 2010;
Published online: 23 June 2010
Edited by:
Michael X. Cohen, University of Amsterdam, NetherlandsReviewed by:
Trevor B. Penney, National University of Singapore, SingaporeRon Frostig, University of California, USA
Copyright: © 2010 Gratton and Fabiani. This is an open-access article subject to an exclusive license agreement between the authors and the Frontiers Research Foundation, which permits unrestricted use, distribution, and reproduction in any medium, provided the original authors and source are credited.
*Correspondence: Gabriele Gratton, Beckman Institute, University of Illinois, 405 N. Mathews Avenue, Urbana, IL 61801, USA. e-mail: grattong@illinois.edu