Shifts in gamma phase–amplitude coupling frequency from theta to alpha over posterior cortex during visual tasks
- 1 Helen Wills Neuroscience Institute, University of California Berkeley, Berkeley, CA, USA
- 2 Department of Electrical Engineering and Computer Sciences, University of California Berkeley, Berkeley, CA, USA
- 3 Department of Neurology, The Johns Hopkins Hospital, Baltimore, MD, USA
- 4 Department of Neurology and Neurological Sciences, Stanford University School of Medicine, Stanford, CA, USA
- 5 Department of Psychology, University of California Berkeley, Berkeley, CA, USA
The phase of ongoing theta (4–8 Hz) and alpha (8–12 Hz) electrophysiological oscillations is coupled to high gamma (80–150 Hz) amplitude, which suggests that low-frequency oscillations modulate local cortical activity. While this phase–amplitude coupling (PAC) has been demonstrated in a variety of tasks and cortical regions, it has not been shown whether task demands differentially affect the regional distribution of the preferred low-frequency coupling to high gamma. To address this issue we investigated multiple-rhythm theta/alpha to high gamma PAC in two subjects with implanted subdural electrocorticographic grids. We show that high gamma amplitude couples to the theta and alpha troughs and demonstrate that, during visual tasks, alpha/high gamma coupling preferentially increases in visual cortical regions. These results suggest that low-frequency phase to high-frequency amplitude coupling is modulated by behavioral task and may reflect a mechanism for selection between communicating neuronal networks.
Introduction
Ongoing neuronal oscillations play an important role in perception (Schürmann and Basşar, 1994), attention (Fries et al., 2001; Lakatos et al., 2008), and memory (Jensen and Tesche, 2002; Jensen et al., 2002; Pesaran et al., 2002; Buzsáki and Draguhn, 2004; Colgin et al., 2009; Siegel et al., 2009). Recent evidence from human intracranial electrocorticography (ECoG) shows that the amplitude of ongoing high gamma (80–150 Hz) oscillations is modulated by the phase of low-frequency theta (4–8 Hz) (Mormann et al., 2005; Canolty et al., 2006; He et al., 2010) and alpha (8–12 Hz) (Osipova et al., 2008) oscillations within and between (Bruns and Eckhorn, 2004) electrodes. Such cross-frequency coupling is intriguing given current hypotheses about the functional roles of different brain rhythms. Low-frequency oscillations may coordinate long-range communication between different brain regions (von Stein and Sarnthein, 2000) whereas high frequency high gamma activity is more spatially restricted and reflects local cortical processing (Crone et al., 1998; Fries et al., 2001; Canolty et al., 2007). High gamma amplitude is correlated with both local neuronal spiking activity (Mukamel et al., 2005) and the fMRI BOLD signal (Logothetis et al., 2001; Mukamel et al., 2005). Phase–amplitude coupling (PAC) may reflect the means through which multiple overlapping long-range networks can communicate by statistically biasing the extracellular membrane potential in local cortical regions such that neurons will be more likely to fire during particular phases or phase network ensembles of low-frequency oscillations (Klausberger et al., 2003; Haider and McCormick, 2009; Canolty and Knight, in press; Canolty et al., 2010). Such a selection mechanism would support complex behaviors such as top-down attentional modulation in a physiologically plausible manner.
Theta and alpha rhythms are anatomically and functionally distinct as evidenced by their different spatial distributions in scalp electroencephalography (EEG) and magnetoencephalography (MEG) (see Onton et al., 2005; Palva and Palva, 2007) and their differential elicitation in event-related behavioral designs (Klimesch, 1999). In humans, theta amplitude has a characteristic frontocentral distribution (see Figure 3A) and may be related to recurrent coactivation between frontal cortex and the anterior cingulate (Asada et al., 1999) and/or the hippocampus (Siapas et al., 2005; Mitchell et al., 2008). In contrast, alpha amplitude has a more posterior focus over visual cortical areas (see Figure 3B). Previous EEG/MEG research has found that theta amplitude increases over frontocentral regions during cognitively demanding tasks (e.g., working memory) that scales with cognitive load (Jensen and Tesche, 2002; Meltzer et al., 2007) whereas alpha amplitude is greater over visual areas during visual tasks (Schürmann and Basşar, 1994) and may be affected by the loss of top-down facilitation from frontal regions including the basal ganglia and prefrontal cortex (Voytek et al., in press). While alpha amplitude over visual cortex indexes memory load (Jensen et al., 2002), posterior alpha phase influences visual attention such that subjects make fewer attention errors to targets that appear during specific alpha phases (Busch et al., 2009; Mathewson et al., 2009).
We sought to extend these findings by examining whether a subject’s behavioral state affected the preferred high gamma amplitude coupling frequency. Although previous research has shown that high gamma activity is modulated by the phase of theta or alpha rhythms, it has not been shown whether the low coupling frequency for PAC phase changes in a task-dependent manner. To examine this we tested two patients with implanted subdural electrodes covering visual cortical areas (see Figure 1). Both subjects performed visual and non-visual tasks. We hypothesized that during non-visual tasks, theta/high gamma PAC (hereafter referred to as “theta PAC”) would be strongest across all electrodes in accordance with previous findings. However, during visual tasks, we hypothesized that alpha/high gamma PAC (“alpha PAC”) would increase over visual cortical regions, reflecting a shift in network processing to potentiate visual cortex for task-relevant behavior.
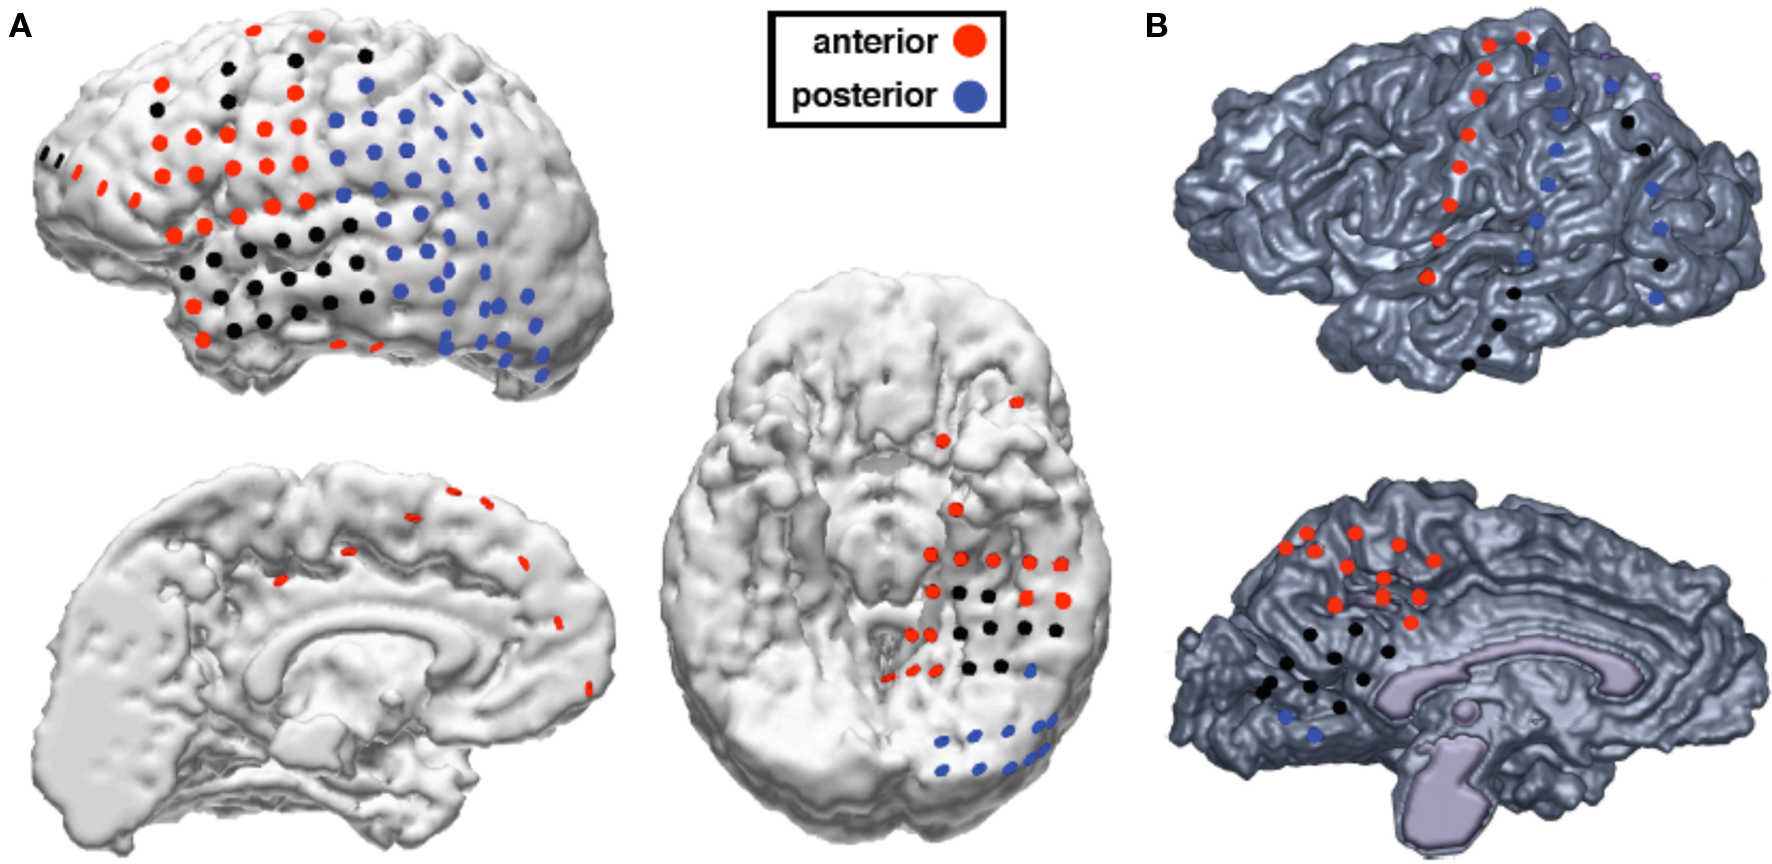
Figure 1. Electrode locations and anterior/posterior classification for both subjects. (A) Electrode locations for subject JH. (B) Electrode locations for subject ST. Black electrodes are electrodes excluded from analyses because they were located over tissue that was later surgically resected or contained epileptic activity.
Materials and Methods
ECoG Participants and Recording
Electrocorticography recordings were obtained from two patients with intractable epilepsy who were implanted with chronic subdural electrodes for approximately 1 week as part of a pre-operative procedure to localize the epileptogenic focus. Data were recorded at two hospitals: the Johns Hopkins School of Medicine (subject JH) and the Stanford School of Medicine (subject ST). Both subjects gave informed consent in accordance with the Johns Hopkins Medicine or Stanford Institutional Review Boards. ECoG data were recorded from 115 electrodes at 1000 Hz using a Stellate Harmonie amplifier (Stellate Systems, Inc., Montreal, Canada) in subject JH and from 51 electrodes at 3051 Hz using a TDT amplifier (Tucker-Davis Technologies, Inc., Alachua, FL, USA) in subject ST. Signals were digitized for further analysis and, for subject ST, were resampled offline at 1017 Hz. ECoG data were referenced offline to the average potential of the electrodes included in analysis for each subject separately. For all PAC analyses 5-min of continuous data were used from each task.
Electrode Grouping and Selection
Electrodes free of epileptic activity as identified by an epileptologist or neurologist and that were not over cortical tissue that was later surgically resected were included in analyses (see Figure 1). Using these criteria we excluded a total of 31 electrodes from subject JH and 17 from subject ST. This left a total of 118 clean electrodes to include in our analyses (84 for subject JH and 34 for subject ST). Electrodes were classified as either “anterior” or “posterior”. We classified all lateral cortical frontal electrodes anterior to the central sulcus as “anterior”. Because of the relationship between frontal theta with hippocampal and anterior cingulate theta, we also classified any temporal pole and medial temporal electrodes or any supercallosal electrodes on the medial surface as “anterior”. All other electrodes, which consisted of occipital, posterior temporal, and parietal electrodes were classified as “posterior”, due to their putative role in the visual processing as part of visual cortex or the dorsal and ventral visual processing streams. This classification scheme yielded a total of 65 anterior electrodes and 53 posterior electrodes across both subjects. For scalp EEG analyses, we classified electrodes anterior to the Cz/T7/T8 axis as “anterior” and the remainder as “posterior”.
Behavioral Tasks
Subject JH
Subject JH performed two non-visual and two visual tasks. The non-visual tasks consisted of verb generation (see Edwards et al., 2010 for details), phoneme and word repetition, and phoneme and word target detection (see Flinker et al., in press for details). The visual tasks consisted of a lateralized visual target detection task (see Voytek et al., in press, for details) and a visual context task (see Fogelson et al., 2009 for details). In the target detection task the subject was presented with a stream of visual stimuli in either the left or right visual hemifield randomly. Stimuli were presented for 107 ms at 5° to the left or right of the central fixation cross along the midline of the vertical. There was either a variable interstimulus interval (ISI) of 800 or 1000 ms. Stimuli consisted of standard non-target triangles (p = 0.7), target inverted triangles (p = 0.2), and neutral novel stimuli (p = 0.1). When the subject saw an inverted triangle in the attended hemifield they manually responded. Two targets were never presented sequentially. In the visual context task, the subject was centrally presented with triangles pointing in one of the cardinal directions; when an inverted triangle (target; p = 0.15) appeared the subject manually responded. In some cases the progression of the orientation changes were predictable and informative of the appearance of a target stimulus. Stimuli were presented for 100 ms with a 1000-ms ISI.
Subject ST
For subject ST, data were analyzed from a self-referential categorization task conducted separately in auditory and visual modalities. For the visual self-referential task, word stimuli were presented in black on a white background for 400 ms with a 4500-ms ISI. For the auditory self-referential task, pre-recorded word stimuli were presented through speakers with a 4500-ms ISI (stimulus duration ranged from 500 to 1500 ms). In both tasks, the subject was asked to respond verbally (saying only “yes” or “no”) whether each word could be used to describe them, in general, or not. Word stimuli in both tasks were identical (matched on valence, arousal, word length, and frequency).
EEG Recording
We collected 64-channel scalp EEG from 12 young controls performing a lateralized visual task similar to that used by Voytek and Knight (in press). All subjects gave informed consent approved by the UC Berkeley Committee on Human Research. Subjects were tested in a sound-attenuated EEG recording room using a 64 + 8 channel BioSemi ActiveTwo amplifier (Metting van Rijn et al., 1990) sampled at 1024 Hz. EEG data were referenced offline to the average potential of two earlobe electrodes.
Data Analysis
All electrophysiological data were analyzed in MATLAB® (R2009b, Natick, MA, USA) using custom scripts and SPSS® (Rel. 18, SPSS Inc., Chicago, IL, USA). Data from both ECoG subjects were combined in all analyses unless otherwise stated such that for ANOVAs, frequency band was included as the within-subjects factor and electrode location (anterior or posterior) as the between-subjects factor. For all figures, error bars represent SEM across electrodes. For all analyses we used a notch filter at 55–65 Hz to remove line noise. MATLAB code used to calculate PAC are available online at http://darb.ketyov.com/professional/publications/PAC.m.
Frequency band power analyses
For both the scalp EEG and ECoG power spectral analyses as seen in Figures 3 and 4A we calculated mean power across theta, alpha, and – for ECoG analyses – high gamma bands for each electrode across the entire time series of every task. Because of the focused spatial topography of high gamma activity (Crone et al., 1998), the susceptibility of scalp EEG to high-frequency noise (Yuval-Greenberg et al., 2008; Voytek et al., 2010), and the inverse power-law relationship between frequency and signal power (Miller et al., 2009), detecting high gamma power and high gamma PAC at the level of the scalp can be difficult (but see Ball et al., 2008; Lenz et al., 2008). Thus we did not calculate high gamma power for scalp EEG analyses.
We used Welch’s method to estimate power spectral density using 50% overlapping sliding window FFTs convolved with a Hamming window. These windowed segments were averaged to give a mean power spectral estimate across frequencies for each electrode. We then log-transformed mean power estimates and calculated the mean of the log spectrum for theta and alpha bands, as well as for the high gamma band in the ECoG analysis. Statistical analyses for testing the spatial distribution of low-frequency (theta and alpha) power as seen in Figure 3 were performed using a repeated measures 2 × 2 ANOVA with the frequency band as the within-subjects factor and electrode location (anterior or posterior) as the between-subjects factor. For analysis of the spatial distribution of high gamma power (Figure 4A), we compared anterior and posterior ECoG high gamma power using a two-way independent samples t-test with electrode location as the grouping variable.
Peak-trough high gamma amplitude analysis
In order to calculate the degree to which theta and alpha phases differentially modulate high gamma ECoG amplitude (Figures 4 and 5), data for each channel was first filtered in multiple pass bands using a two-way, zero phase-lag, finite impulse response filter [eegfilt.m function in EEGLAB toolbox (Delorme and Makeig, 2004) in MATLAB] to prevent phase distortion. Data from each electrode, therefore, was decomposed into theta (xθ), alpha (xα), and high gamma (xγ) bands. We then applied a Hilbert transform to each of these time series (hilbert.m function) giving a complex time series,

where ax[n] and φx[n] are the instantaneous amplitudes and phases, respectively. The phase time series φx assumes values within (−π, π] radians with a cosine phase such that π radians corresponds to the trough and 0 radians to the peak. This method yields results equivalent to sliding window FFT and wavelet approaches given appropriately set parameters (Bruns, 2004).
Theta and alpha troughs were identified from φθ and φα respectively as local minima of φx; peaks were identified as zero-crossings of φx. We used these phases as time-locking events to extract the average high gamma amplitude across these time points for each electrode by taking the mean high gamma amplitude around the phase events using a window of ±5% of the cycle of the low frequency of interest, which resulted in the mean high gamma amplitude around the theta and alpha peaks and troughs. For Figure 4B we calculated the degree of high gamma amplitude modulation by theta and alpha peaks versus troughs (collapsed across tasks and electrodes) using paired-samples t-tests (trough minus peak for each electrode). For Figure 5 we calculated the mean trough-locked theta and alpha oscillations from ongoing band-passed ECoG data for an anterior and posterior electrode in subject JH (for visualization purposes) using a 1000-ms time window around the low-frequency troughs. We then calculated mean amplitude across these events for 45 logarithmically-spaced frequency bands to generate phase-locked spectral perturbation plots (comodulograms).
Phase–amplitude coupling
Phase–amplitude coupling was calculated for each channel separately. In order to compute PAC between theta phase and high gamma amplitude we first extracted theta, alpha, and high gamma phase and amplitudes from Eq. 1. We then applied a band-pass filter to aγ using the same filter parameters used to extract xθ, giving a new time series, aγθ. A second Hilbert transform was then used to extract the phases of the theta-filtered gamma amplitude envelope (Figure 2),

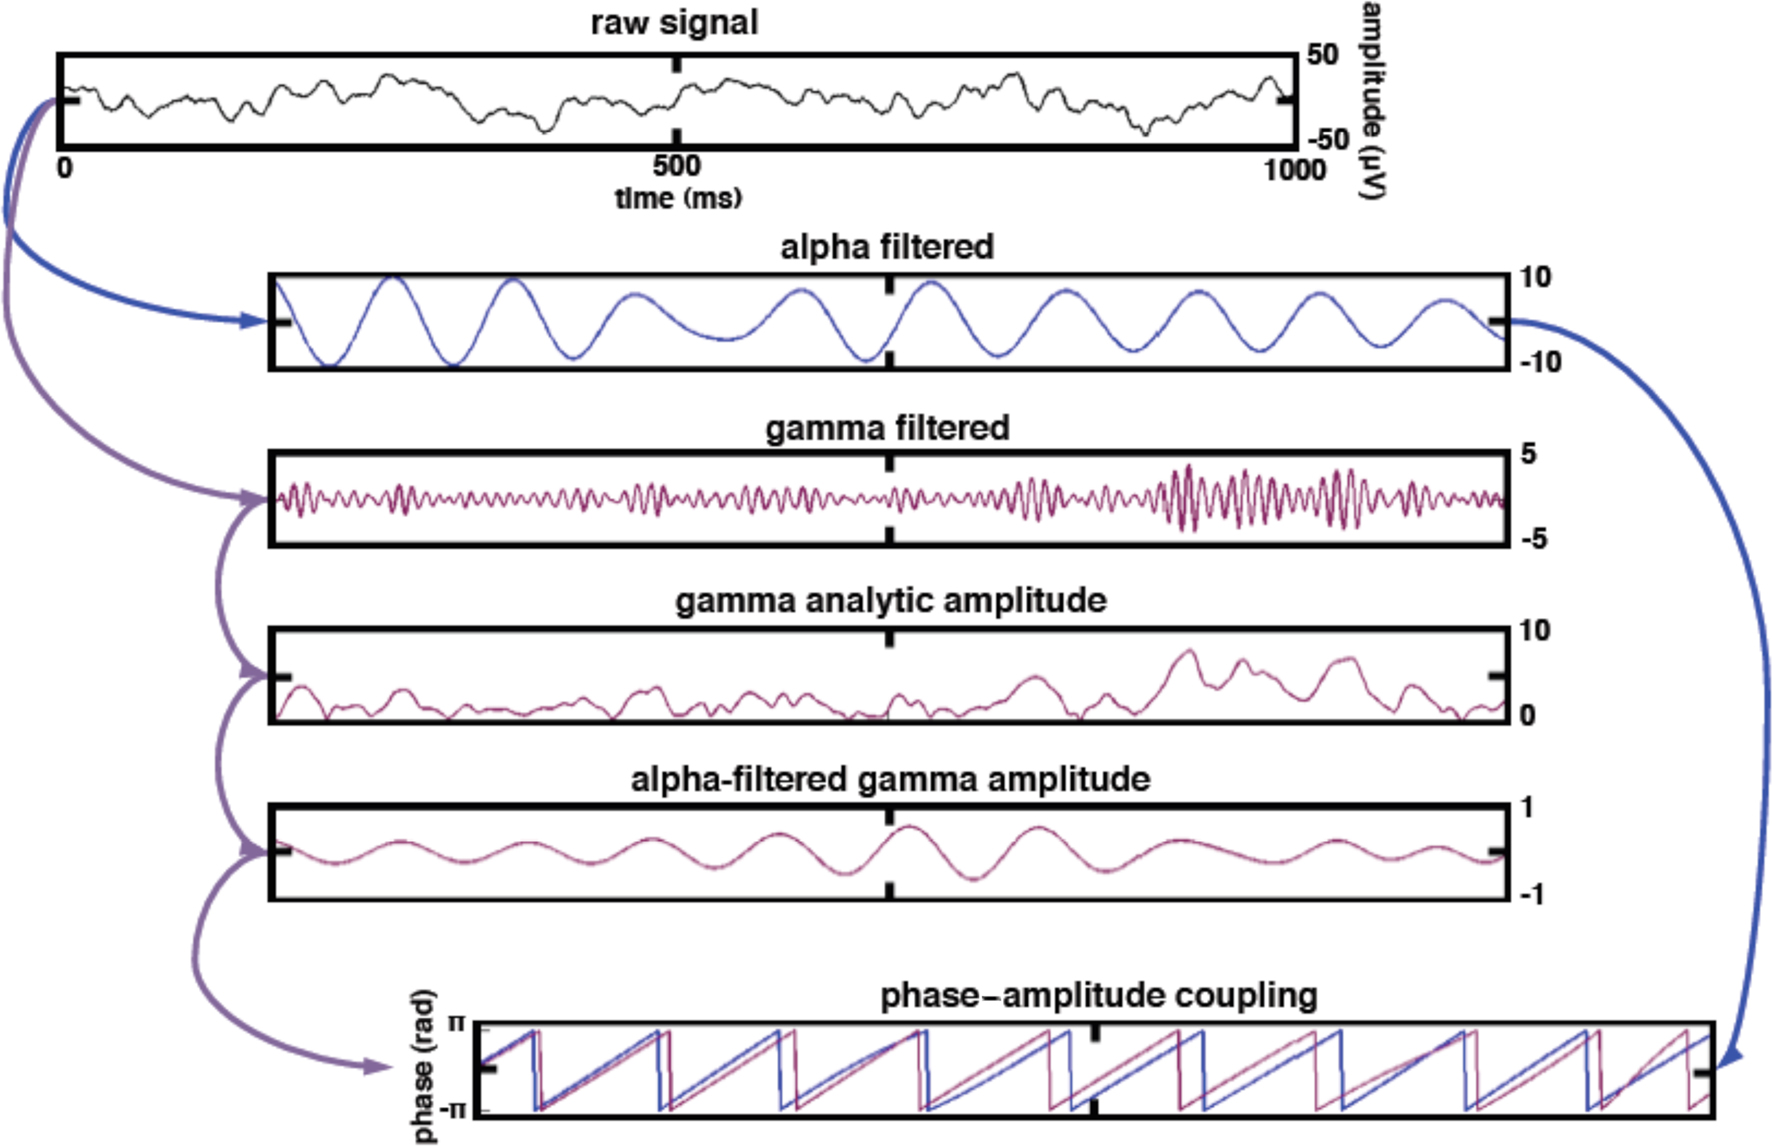
Figure 2. Data processing schematic for calculating phase–amplitude coupling. To estimate alpha PAC, the raw signal was band-pass filtered into both a low-frequency alpha (8–12 Hz) component as well as a high-frequency gamma (80–150 Hz) component. We then extracted the amplitude of the band-passed high gamma and filtered this amplitude time series at the same frequency as alpha, giving us the alpha modulation in high gamma amplitude. We then extracted the phase of both the alpha-filtered signal and the alpha-filtered high gamma amplitude and computed the phase-locking between these two signals. This phase-locking represents the degree to which the high gamma amplitude is comodulated with the alpha phase. The same procedure was applied to the theta (4–8 Hz) phase.
Phase–amplitude coupling between theta and high gamma is defined as the length of the mean vector between φθ and  using the following method (see Penny et al., 2008, phase-locking value technique):
where a Pθγ of unity reflects perfect phase-locking between the ongoing theta phase and the phase of the ongoing high gamma amplitude. That is, Pθγ represents the modulation of high gamma amplitude by theta phase. Because PAC values are constrained between 0 and 1 we applied Fisher’s z-transform to normalize the data into an approximately Gaussian distribution for ANOVA and t-test statistics,

In order to calculate PAC between alpha and high gamma the same process was used as above except that aγ was filtered using the same filter parameters used to extract xα, giving a new time series, aγα after Eq. 2. Pαγ is defined then as the mean length of the vector between φα and  after Eq. 3. This method of estimating PAC differs from earlier PAC estimation methods (e.g., the modulation index used by Canolty et al., 2006), but has been shown to have a higher sensitivity to PAC (Penny et al., 2008).
Results
Modulation of Power
Scalp EEG
The differences in scalp distributions of theta and alpha EEG power are shown in Figure 3. As can be seen in Figure 3B, theta power is greater at frontal sites while alpha power is stronger at posterior sites (frequency band × electrode location interaction, F1,62 = 69.89, p < 0.0005). At anterior sites only, theta is stronger than alpha (anterior: t33 = 13.25, p < 0.0005; posterior: t29 = 0.71, p = 0.48). While theta power is not different between anterior and posterior sites (t62 = 1.51, p = 0.14), alpha power is greater over posterior relative to anterior electrodes (t62 = 5.57, p < 0.0005).
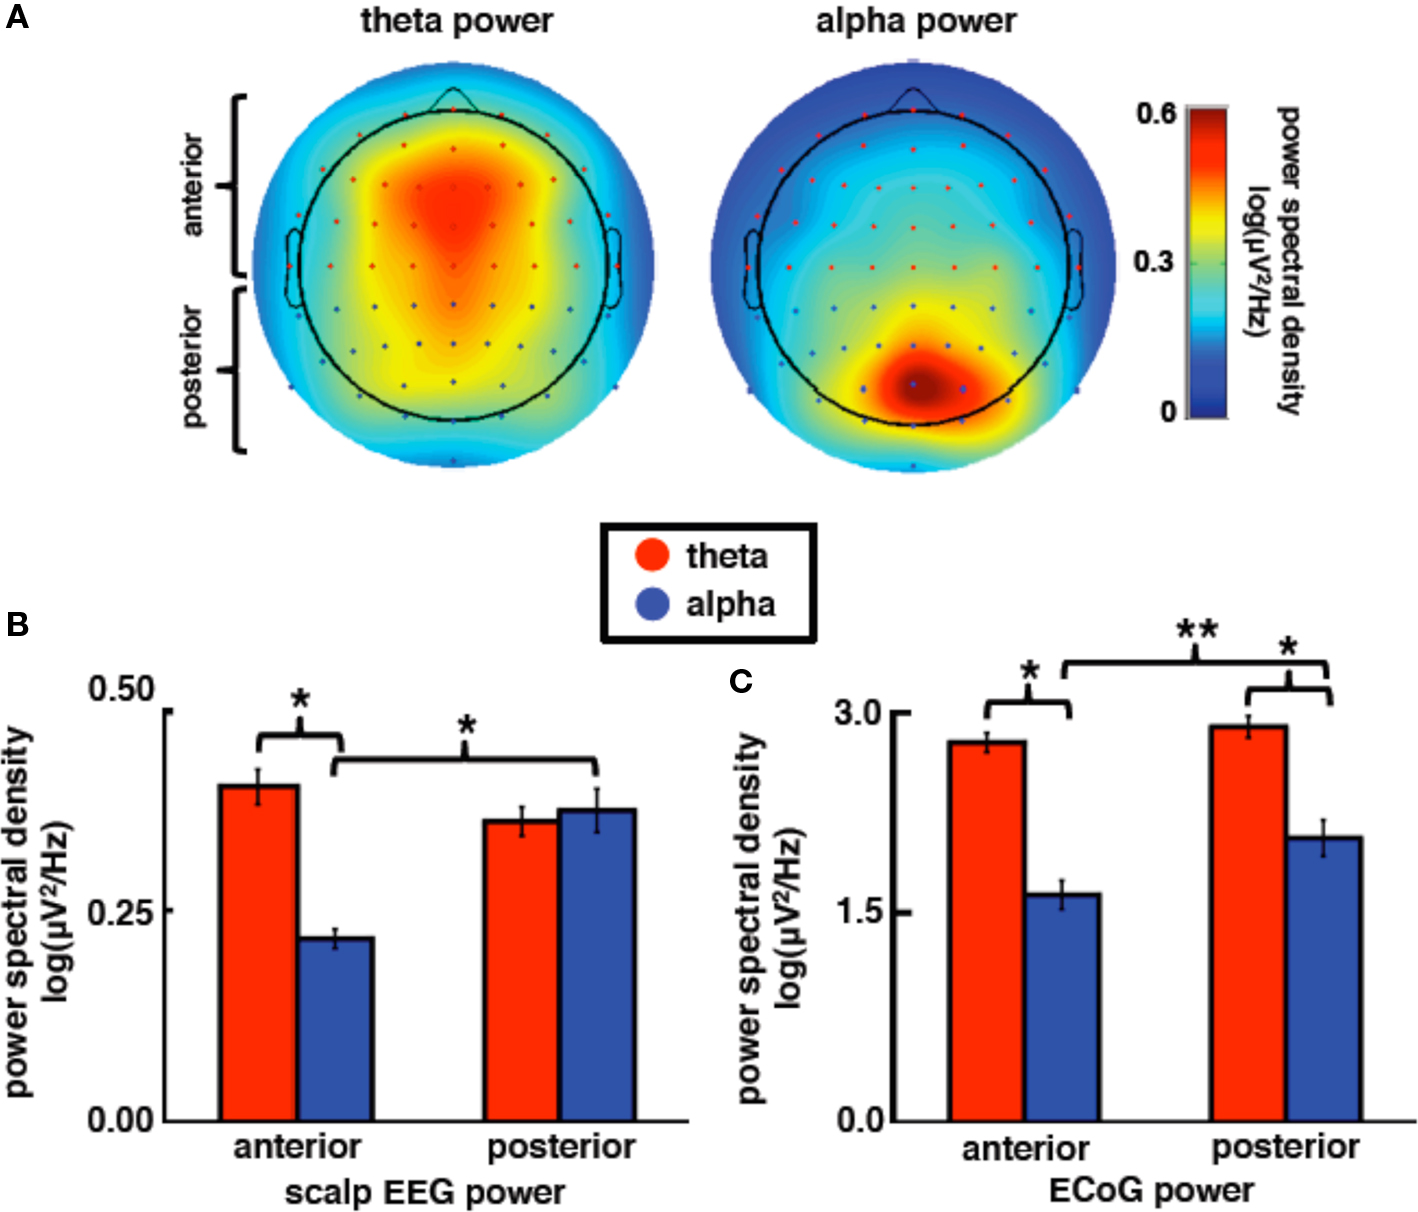
Figure 3. Theta and alpha power are differentially distributed across the cortex. (A) Scalp topography of average EEG theta and alpha power in 12 young controls performing a visual memory task highlighting the normal topological distribution of band-specific power. (B) Scalp EEG theta power is larger than alpha power at frontal sites whereas alpha power is higher over posterior compared to anterior sites. (C) ECoG subjects exhibited a similar pattern of power distribution by topography where alpha power increases over posterior electrode sites relative to anterior alpha power (combined data). All power values are shown as log(power) across frequency bands. *p < 0.0005, **p = 0.019 (t-tests).
Electrocorticography
We find a similar pattern of results in subjects JH and ST (Figure 3C; frequency band × electrode location interaction, F1,116 = 5.68, p = 0.019), which suggests that our anterior/posterior classification scheme in ECoG cases corresponds to the typically observed scalp EEG power distribution. It is important to note that, although ECoG theta power is overall stronger than alpha (main effect of frequency band, F1,116 = 232.16, p < 0.0005), alpha power is greater over posterior sites relative to anterior sites (t117 = 2.44, p = 0.016) while theta power is equal across both sites (t117 = 1.05, p = 0.39). In contrast to the alpha modulation by brain region, high gamma power is equal across both sites (Figure 4A; t117 = 0.094, p = 0.93).
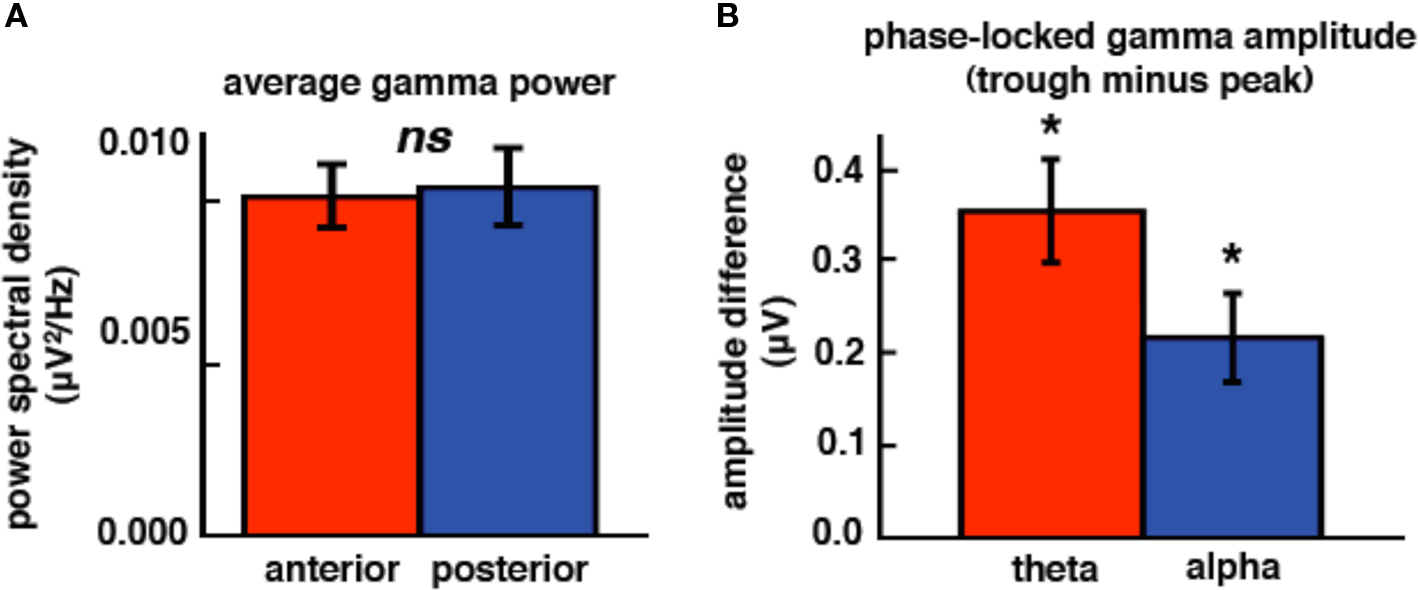
Figure 4. High gamma is modulated by low-frequency phase but not topography. (A) High gamma power is equal across anterior and posterior ECoG electrode sites. (B) High gamma amplitude is a function of theta and alpha phase such that high gamma amplitude is greater at the troughs of low frequencies compared to the peaks. *p < 0.0005 (paired-samples t-tests). ns, not significant. Error bars represent SEM.
We also find a task × electrode interaction for theta power (F1,116 = 22.18, p < 0.0005) such that theta power does not change across sites for visual tasks (t117 < 1.0), but increases at posterior sites for auditory tasks (t117 = 1.96, p = 0.027). We also find that alpha power is greater for visual compared to auditory tasks, though there is no task × electrode interaction (F1,116 = 31.96, p < 0.0005). There are no effects of task or electrode location on gamma power.
We confirmed previous results that have shown that high gamma amplitude is modulated by theta and/or alpha phase. We find that for both theta and alpha bands, high gamma amplitude is greater during the trough compared to the peak (Figures 4B and 5; theta: t116 = 4.65, p < 0.0005; alpha: t116 = 3.32, p < 0.0005).
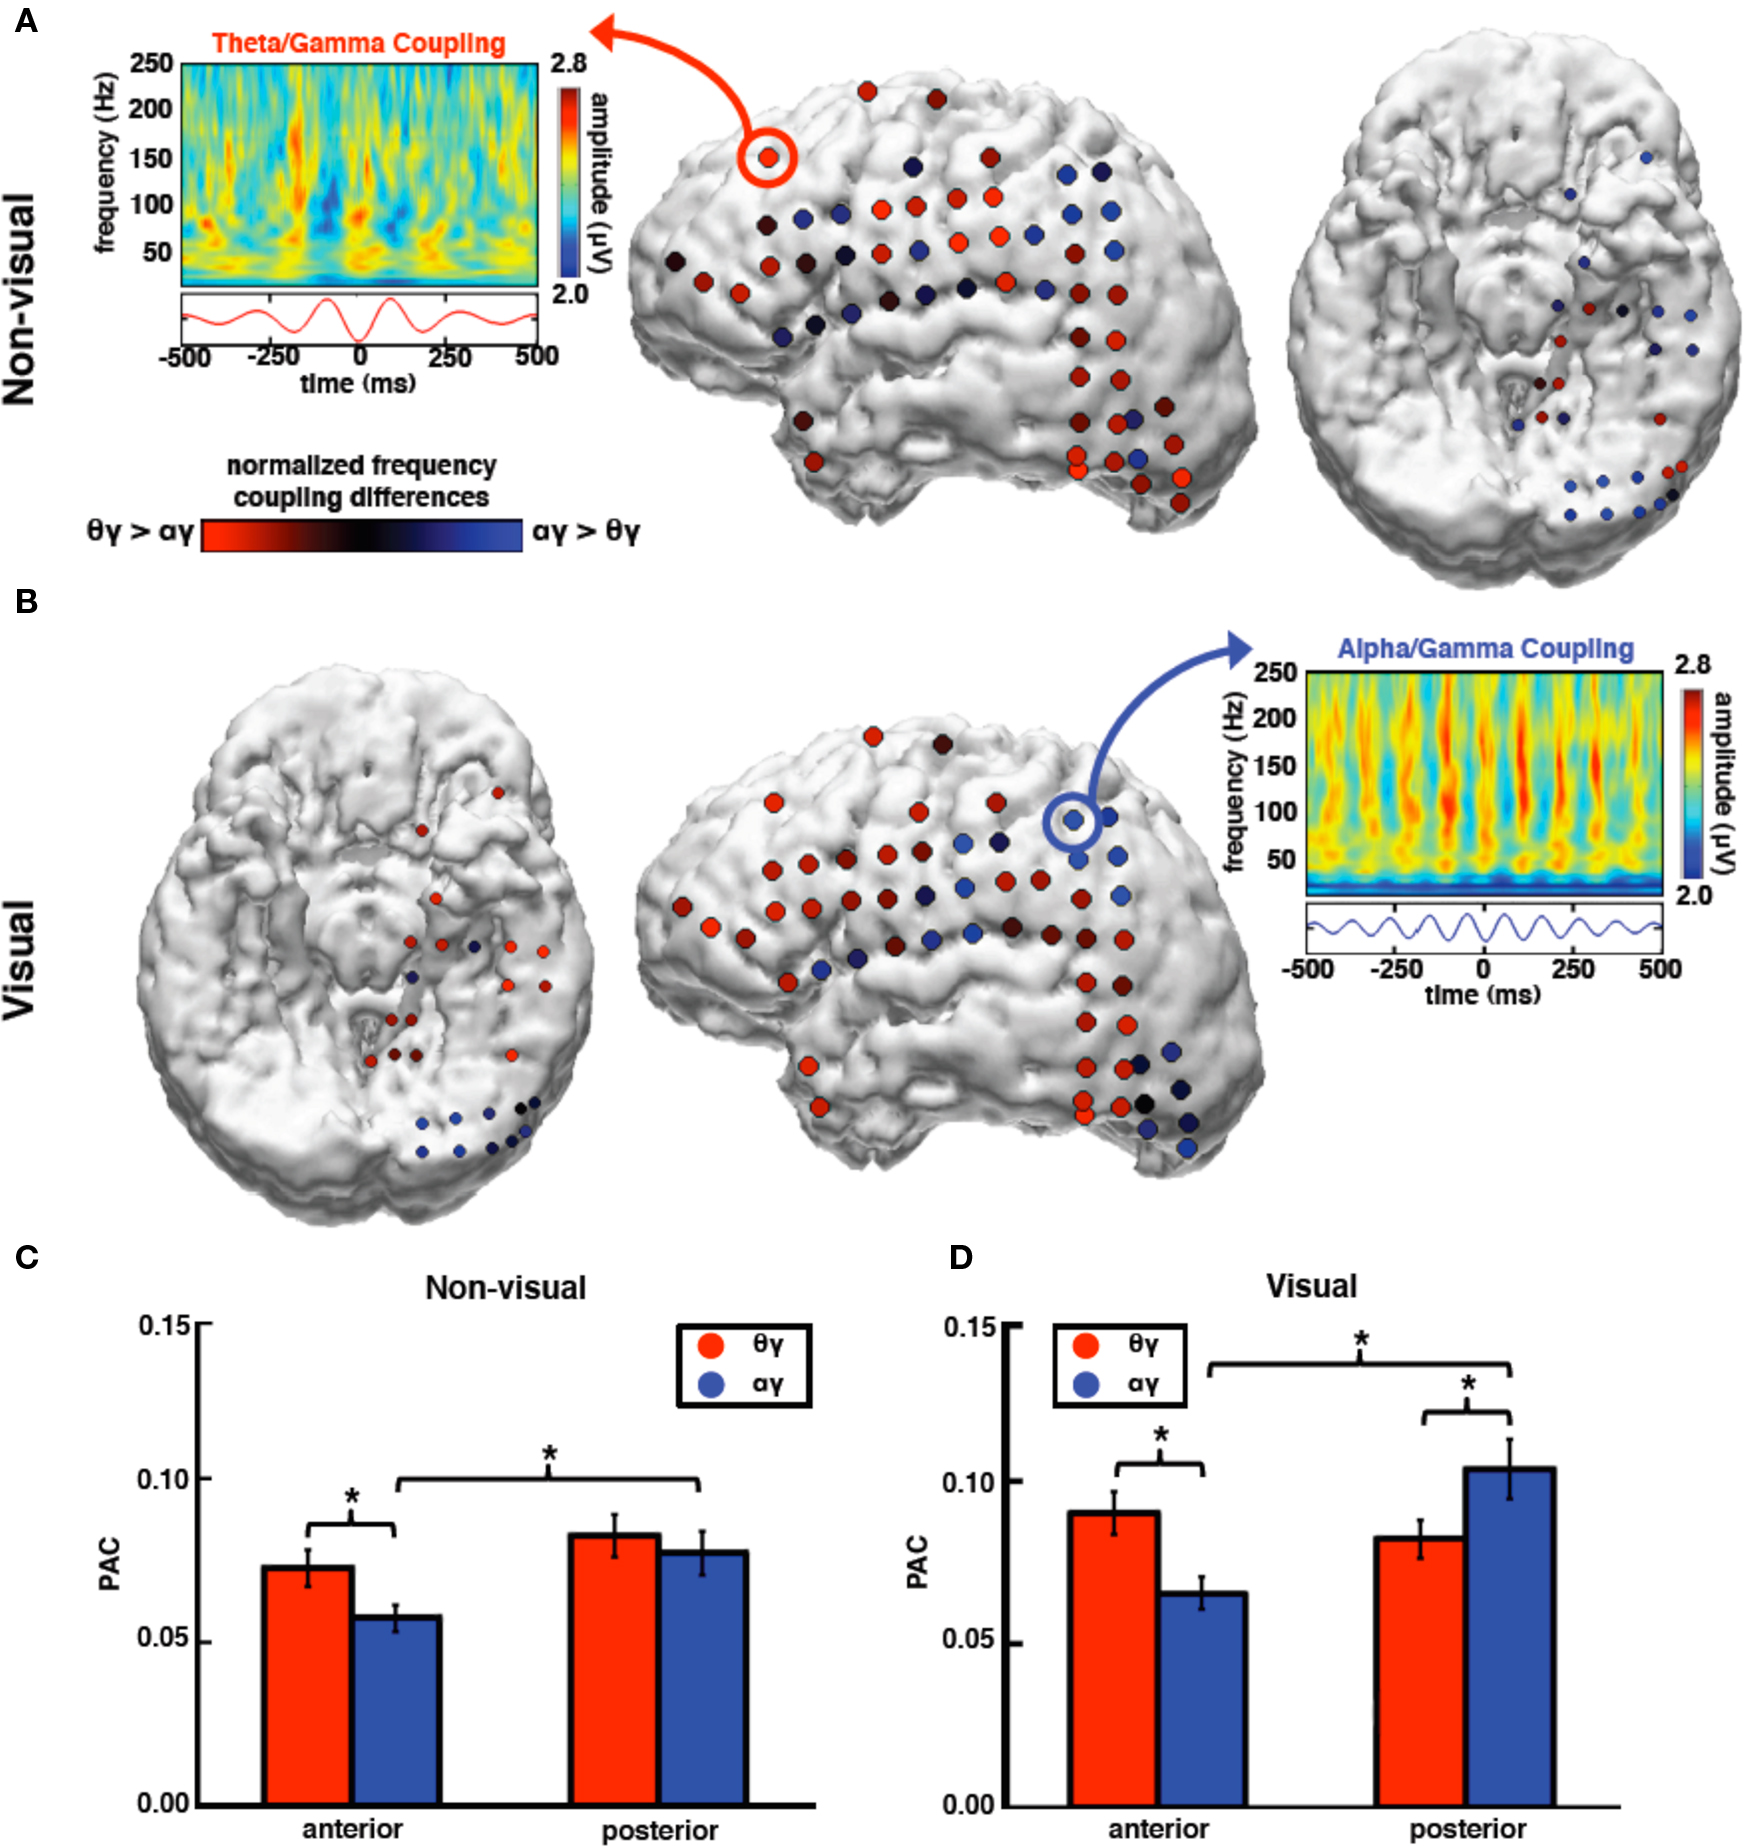
Figure 5. During non-visual tasks, high gamma amplitude couples preferentially to theta rather than alpha phase over anterior sites with no preferential coupling between theta and alpha over posterior sites. In contrast, during visual tasks, high gamma amplitude couples most strongly to alpha phase over visual cortical regions. (A) During non-visual tasks, theta PAC is stronger than alpha PAC over anterior sites. Theta PAC is equal across the cortex whereas posterior alpha PAC is larger than anterior alpha PAC. (B) During visual tasks, alpha coupling is stronger on average at posterior electrode sites and is greater than theta PAC. (A,B) Electrode color signifies the low-frequency bias in coupling with high gamma amplitude; red indicates greater theta PAC compared to alpha PAC; blue indicates greater alpha PAC compared to theta PAC. Feature plots are comodulograms at representative electrodes. (C) There is a significant interaction between task, frequency, and topography such that anterior theta PAC is stronger than alpha PAC during non-visual tasks. (D) During visual tasks, however, theta PAC is stronger at anterior electrodes while alpha PAC is stronger at posterior sites. *p < 0.0005, **p < 0.01 (t-tests). Error bars represent SEM.
Modulation of PAC
We found that there was a main effect of task modality, such that visual tasks had stronger PAC than non-visual (F1,116 = 13.32, p < 0.0005), and a main effect of electrode location such that PAC was stronger at posterior compared to anterior sites (F1,116 = 4.53, p = 0.036). These main effects might reflect increased task demands during visual compared to non-visual tasks wherein a large visual cortical network is also recruited to perform the visual tasks. There was a significant three-way interaction between task modality, frequency band, and electrode location (F1,116 = 19.88, p < 0.0005).
In a series of post hoc t-tests we found that, for anterior electrodes for both tasks, high gamma amplitude was more strongly coupled to theta phase than alpha (non-visual: t64 = 3.49, p = 0.001; visual: t64 = 5.74, p < 0.0005). Furthermore, anterior theta PAC is larger during visual compared to non-visual tasks, whereas anterior alpha PAC remains relatively unchanged (theta: t64 = 3.13, p = 0.003; alpha: t64 = 1.98, p = 0.052). However at posterior electrode sites high gamma amplitude is more strongly coupled to alpha than theta phase only during the visual task (visual: t52 = 2.80, p = 0.007; non-visual: t52 = 0.80, p = 0.43), and that posterior alpha PAC increases during visual compared to non-visual tasks whereas posterior theta PAC remains unchanged (alpha: t52 = 3.99, p < 0.0005; theta: t52 = 0.08, p = 0.94). These results show that task modality shifts the preferred low frequency that modulates high gamma amplitude such that during visual tasks only, alpha PAC is larger than theta PAC only over posterior visual cortical areas (Figure 5).
Because alpha power is also greater over posterior sites during visual compared to non-visual tasks, we were concerned that the task differences in PAC might potentially be dependent upon changes in low-frequency power. Even though power and phase are not necessarily interdependent, the estimation of instantaneous phase can be affected by low signal-to-noise. We included alpha and theta power as covariates in our repeated measures ANOVA, which did not affect the main three-way interaction (F1,114 = 18.45, p < 0.0005). Furthermore, electrodes that showed the greatest modulation in alpha PAC by task modality (alpha PAC, visual minus non-visual) were not correlated with modulation of alpha power by task modality (visual minus non-visual; r = −0.079, p = 0.40). We also examined theta/alpha phase–phase coupling using the PAC calculations as above to examine whether theta/alpha phase–phase coupling is task- or topographically dependent; we found no such interaction (F1,116 < 1.0).
Discussion
Here we show that the preferred low-frequency brain rhythm modulating high gamma amplitude is dependent on the task-specific modality. Importantly, we show this dynamic switch between theta/high gamma and alpha/high gamma PAC in two subjects using direct cortical recordings. Previous research has shown that endogenous oscillations play an important role in neural communication, and changes in the strength of cross-frequency coupling are associated with learning (Tort et al., 2009), memory (Bruns and Eckhorn, 2004; Axmacher et al., 2010), and reward (Cohen et al., 2009). However, this is the first evidence that the preferred low-frequency coupling rhythm modulating high gamma amplitude can be altered by task demands. Because different PAC calculations may give different results when compared against each other (Tort et al., 2010), we note that a supplementary analysis looking at the differences in gamma power in the troughs compared to peaks of theta and alpha, broken down by electrode site and task, show no effect of task (F1,116 < 1.0). This suggests that the PAC effects we see reflect a phase consistency between the gamma amplitude envelope and low-frequency phase rather than the modulation of the gamma amplitude within just the low-frequency peaks and troughs. Models of the role of theta and alpha activity in EEG/MEG suggest that theta/gamma interactions may play a more prominent role in memory functions whereas alpha/gamma interactions are important for attention processes (Ward, 2003).
The question of how the cortex can integrate information at different temporal and spatial scales is important in understanding cortical functioning. In particular, multiple discrete brain rhythms interacting in a coordinated fashion may underlie computation and communication in large-scale brain networks (Buzsáki and Draguhn, 2004; Jensen and Colgin, 2007; Kramer et al., 2008; Roopun et al., 2008a,b; Schroeder and Lakatos, 2008). While functional neuroimaging studies generally highlight correlations between brain regions and behavior or cognition, understanding how these regions work in concert to give rise to perception, cognition, and action is a critical concern in systems neuroscience (Bressler, 1995; Knight, 2007). We propose that fluctuations in the local and global extracellular membrane potential bias the statistics of local neuronal firing rates, analogous to Up and Down states, which can influence cortical processing (Holcman and Tsodyks, 2006; Frölich and McCormick, 2010). These low-frequency fluctuations would coordinate multiple brain regions and allow for parallel processing by overlapping neuronal networks with the distributed pattern of low-frequency phase regulating information flow within and between networks (Engel et al., 2001; Sejnowski and Paulsen, 2006) acting as a type of switch or router.
In our study we observe that high gamma amplitude is modulated by both the theta and alpha phase. We note that there is a topographic separation of preferred coupling such that theta PAC is larger than alpha PAC over anterior brain regions, regardless of behavioral task. However we demonstrate that visual attention tasks increase alpha PAC over visual cortices. This observation suggests that PAC dynamics can switch between frequencies depending on task demands and supports the contention that multiple overlapping neuronal oscillations are important for cortical functioning.
Conflict of Interest Statement
The authors declare that the research was conducted in the absence of any commercial or financial relationships that could be construed as a potential conflict of interest.
Acknowledgments
This work was supported by the American Psychological Association Diversity Program in Neuroscience grant 5-T32-MH18882 and the National Institute of Neurological Disorders and Stroke grants NS21135, NS21135-22S1, and PO40813. We would like to thank Adeen Flinker for useful discussions.
References
Asada, H., Fukudas Y., Tsunoda, S., Yamaguchi, M., and Tonoike, M. (1999). Frontal midline theta rhythms reflect alternative activation of prefrontal cortex and anterior cingulate cortex in humans. Neurosci. Lett. 274, 29–32.
Axmacher, N., Henseler, M. M., Jensen, O., Weinreich, I., Elger, C., and Fell, J. (2010). Cross-frequency coupling supports multi-item working memory in the human hippocampus. Proc. Natl. Acad. Sci. U.S.A. 107, 3228–3233.
Ball, T., Demandt, E., Mutschler, I., Neitzel, E., Mehring, C., Vogt, K., Aertsen, A., and Schulzebonhage, A. (2008). Movement related activity in the high gamma range of the human EEG. Neuroimage 41, 302–310.
Bressler, S. L. (1995). Large-scale cortical networks and cognition. Brain Res. Brain Res. Rev. 20, 288–304.
Bruns, A. (2004). Fourier-, Hilbert- and wavelet-based signal analysis: are they really different approaches? J. Neurosci. Methods 137, 321–332.
Bruns, A., and Eckhorn, R. (2004). Task-related coupling from high- to low-frequency signals among visual cortical areas in human subdural recordings. Int. J. Psychophysiol. 51, 97–116.
Busch, N., Dubois, J., and Vanrullen, R. (2009). The phase of ongoing EEG oscillations predicts visual perception. J. Neurosci. 29, 7869–7876.
Buzsáki, G., and Draguhn, A. (2004). Neuronal oscillations in cortical networks. Science 304, 1926–1929.
Canolty, R. T., Edwards, E., Dalal, S. S., Soltani, M., Nagarajan, S. S., Kirsch, H. E., Berger, M. S., Barbaro, N. M., and Knight, R. T. (2006). High gamma power is phase-locked to theta oscillations in human neocortex. Science 313, 1626–1628.
Canolty, R. T., Ganguly, K., Kennerley, S. W., Cadieu, C. F., Koepsell, K., Wallis, J. D., and Carmena, J. M. (2010). Oscillatory phase coupling coordinates anatomically-dispersed functional cell assemblies. Proc. Natl. Acad. Sci. U.S.A. 107, 17356–17361.
Canolty, R. T., and Knight R. T. (in press). The functional role of cross-frequency coupling. Trends Cogn. Neurosci. doi: 10.1016/j.tics.2010.09.001.
Canolty, R. T., Soltani, M., Dalal, S. S., Edwards, E., Dronkers, N., Nagarajan, S. S., Kirsch, H. E., Barbaro, N. M., and Knight, R. T. (2007). Spatiotemporal dynamics of word processing in the human brain. Front. Neurosci. 1, 185–196.
Cohen, M. X., Axmacher, N., Lenartz, D., Elger, C. E., Sturm, V., and Schlaepfer, T. E. (2009). Good vibrations: cross-frequency coupling in the human nucleus accumbens during reward processing. J. Cogn. Neurosci. 21, 875–889.
Colgin, L. L., Denninger, T., Fyhn, M., Hafting, T., Bonnevie, T., Jensen, O., Moser, M., and Moser, E. I. (2009). Frequency of gamma oscillations routes flow of information in the hippocampus. Nature 462, 353–357.
Crone, N. E., Miglioretti, D. L., Gordon, B., and Lesser, R. P. (1998). Functional mapping of human sensorimotor cortex with electrocorticographic spectral analysis. II. Event-related synchronization in the gamma band. Brain 121, 2301–2315.
Delorme, A., and Makeig, S. (2004). EEGLAB: an open source toolbox for analysis of single-trial EEG dynamics including independent component analysis. J. Neurosci. Methods 134, 9–21.
Edwards, E., Nagarajan, S. S., Dalal, S. S., Canolty, R. T., Kirsch, H., Barbaro, N. M., and Knight, R. T. (2010). Spatiotemporal imaging of cortical activation during verb generation and picture naming. Neuroimage 50, 291–301.
Engel, A. K., Fries, P., and Singer, W. (2001). Dynamic predictions: oscillations and synchrony in top-down processing. Nat. Rev. Neurosci. 2, 704–716.
Flinker, A., Chang, E. F., Barbaro, N. M., Berger, M. S., and Knight, R. T. (in press). Sub-centimeter language organization in the human temporal lobe. Brain Lang. doi: 10.1016/j.bandl.2010.09.009.
Fogelson, N., Shah, M., Bonnet-Brilhault, F., and Knight, R. T. (2009). Electrophysiological evidence for aging effects on local contextual processing. Cortex 46, 498–506.
Fries, P., Reynolds, J. H., Rorie, A. E., and Desimone, R. (2001). Modulation of oscillatory neuronal synchronization by selective visual attention. Science 291, 1560–1563.
Frölich, F., and McCormick, D. A. (2010). Endogenous electric fields may guide neocortical network activity. Neuron 67, 129–143.
Haider, B., and McCormick, D. (2009). Rapid neocortical dynamics: cellular and network mechanisms. Neuron 62, 171–189.
He, B. J., Zempel, J. M., Snyder, A., and Raichle, M. E. (2010). The temporal structures and functional significance of scale-free brain activity. Neuron 66, 353–369.
Holcman, D., and Tsodyks, M. (2006). The emergence of up and down states in cortical networks. PLoS Comput. Biol. 2, 0171–0181. doi: 10.1371/journal.pcbi.0020023.
Jensen, O., and Colgin, L. (2007). Cross-frequency coupling between neuronal oscillations. Trends Cogn. Sci. 11, 267–269.
Jensen, O., Gelfand, J., Kounios, J., and Lisman, J. E. (2002). Oscillations in the alpha band (9–12 Hz) increase with memory load during retention in a short-term memory task. Cereb. Cortex 12, 877–882.
Jensen, O., and Tesche, C. D. (2002). Frontal theta activity in humans increases with memory load in a working memory task. Eur. J. Neurosci. 15, 1395–1399.
Klausberger, T., Magill, P., Márton, L. F., Roberts, J. D., Cobden, P. M., Buzsáki, G., and Somogyi, P. (2003). Brain-state- and cell-type-specific firing of hippocampal interneurons in vivo. Nature 421, 844–848.
Klimesch, W. (1999). EEG alpha and theta oscillations reflect cognitive and memory performance: a review and analysis. Brain Res. Brain Res. Rev. 29, 169–195.
Kramer, M. A., Roopun, A., Carracedo, L. M., Traub, R. D., Whittington, M. A., and Kopell, N. J. (2008). Rhythm generation through period concatenation in rat somatosensory cortex. PLoS Comput. Biol. 4, 1–16. doi: 10.1371/journal.pcbi.1000169.
Lakatos, P., Karmos, G., Mehta, A., Ulbert, I., and Schroeder, C. (2008). Entrainment of neuronal oscillations as a mechanism of attentional selection. Science 320, 110–113.
Lenz, D., Jeschke, M., Schadow, J., Naue, N., Ohl, F., and Herrmann, C. (2008). Human EEG very high frequency oscillations reflect the number of matches with a template in auditory short-term memory. Brain Res. 1220, 81–92.
Logothetis, N. K., Pauls, J., Augath, M., Trinath, T., and Oeltermann, A. (2001). Neurophysiological investigation of the basis of the fMRI signal. Nature 412, 150–157.
Mathewson, K., Gratton, G., Fabiani, M., Beck, D., and Ro, T. (2009). To see or not to see: prestimulus α phase predicts visual awareness. J. Neurosci. 29, 2725–2732.
Meltzer, J., Zaveri, H., Goncharova, I., Distasio, M., Papademertris, X., Spencer, S., Spencer, D., and Constable, R. (2007). Effects of working memory load on oscillatory power in human intracranial EEG. Cereb. Cortex 18, 1843–1855.
Metting van Rijn A. C., Peper A., and Grimbergen C. A. (1990). High-quality recording of bioelectric events. Part 1. Interference reduction, theory and practice. Med. Biol. Eng. Comput. 28, 389–397.
Miller, K. J., Sorensen, L. B., Ojemann, J., and den Nijs, M. (2009). Power-law scaling in the brain surface electric potential. PLoS Comput. Biol. 5, 1–10. doi: 10.1371/journal.pcbi.1000609.
Mitchell, D. J., McNaughton, N., Flanagan, D., and Kirk, I. J. (2008). Frontal-midline theta from the perspective of hippocampal “theta”. Prog. Neurobiol. 86, 156–185.
Mormann, F., Fell, J., Axmacher, N., Weber, B., Lehnertz, K., Elger, C. E., and Fernández, G. (2005). Phase/amplitude reset and theta-gamma interaction in the human medial temporal lobe during a continuous word recognition memory task. Hippocampus 15, 890–900.
Mukamel, R., Gelbard, H., Arieli, A., Hasson, U., Fried, I., and Malach, R. (2005). Coupling between neuronal firing, field potentials, and FMRI in human auditory cortex. Science 309, 951–954.
Onton, J., Delorme, A., and Makeig, S. (2005). Frontal midline EEG dynamics during working memory. Neuroimage 27, 341–356.
Osipova, D., Hermes, D., Jensen, O., and Rustichini, A. (2008). Gamma power is phase-locked to posterior alpha activity. PLoS ONE 3, 1–7. doi: 10.1371/journal.pone.0003990.
Palva, S., and Palva, J. (2007). New vistas for α-frequency band oscillations. Trends Neurosci. 30, 150–158.
Penny, W. D., Duzel, E., Miller, K., and Ojemann, J. (2008). Testing for nested oscillation. J. Neurosci. Methods 174, 50–61.
Pesaran, B., Pezaris, J. S., Sahani, M., Mitra, P., and Andersen, R. A. (2002). Temporal structure in neuronal activity during working memory in macaque parietal cortex. Nat. Neurosci. 5, 805–811.
Roopun, A., Kramer, M. A., Carracedo, L. M., Kaiser, M., Davies, C. H., Traub, R. D, Kopell, N. J., and Whittington, M. A. (2008a). Temporal interactions between cortical rhythms. Front. Neurosci. 2, 145–154. doi: 10.3389/neuro.01.034.2008.
Roopun, A., Kramer, M. A., Carracedo, L. M., Kaiser, M., Davies, C. H., Traub, R. D, Kopell, N. J., and Whittington, M. A. (2008b). Period concatenation underlies interactions between gamma and beta rhythms in neocortex. Front. Cell. Neurosci. 2, 1–8. doi: 10.3389/neuro.03.001.2008.
Schroeder, C. E., and Lakatos, P. (2008). Low-frequency neuronal oscillations as instruments of sensory selection. Trends Neurosci. 32, 9–18.
Schürmann, M., and Basşar, E. (1994). Topography of alpha and theta oscillatory responses upon auditory and visual stimuli in humans. Biol. Cybern. 72, 161–174.
Sejnowski, T., and Paulsen, O. (2006). Network oscillations: emerging computational principles. J. Neurosci. 26, 1673–1676.
Siapas, A., Lubenov, E., and Wilson, M. (2005). Prefrontal phase locking to hippocampal theta oscillations. Neuron 46, 141–151.
Siegel, M., Warden, M. R., and Miller, E. K. (2009). Phase-dependent neuronal coding of objects in short-term memory. Proc. Natl. Acad. Sci. U.S.A. 106, 21341–21346.
Tort, A. B., Komorowski, R. W., Manns, J. R., Kopell, N. J., and Eichenbaum, H. (2009). Theta-gamma coupling increases during the learning of item-context associations. Proc. Natl. Acad. Sci. U.S.A. 106, 20942–20947.
Tort, A. B. L., Komorowski, R., Eichenbaum, H., and Kopell, N. (2010). Measuring phase–amplitude coupling between neuronal oscillations of different frequencies. J. Neurophysiol. 104, 1195–1210.
von Stein, A., and Sarnthein, J. (2000). Different frequencies for different scales of cortical integration: from local gamma to long range alpha/theta synchronization. Int. J. Psychophysiol. 38, 301–313.
Voytek, B., Davis, M., Yago, E., Barceló, F., Vogel, E. K., and Knight, R. T. (in press). Dynamic neuroplasticity after human prefrontal cortex damage. Neuron doi: 10.1016/j.neuron.2010.09.108.
Voytek, B., and Knight, R.T. (in press). Prefrontal cortex and basal ganglia contributions to visual working memory. Proc. Natl. Acad. Sci. U.S.A. doi: 10.1073/pnas.1007277107.
Voytek, B., Secundo, L., Bidet-Caulet, A., Scabini, D., Stiver, S. I., Gean, A. D., Manley, G. T., and Knight, R. T. (2010). Hemicraniectomy: a new model for human electrophysiology with high spatio-temporal resolution. J. Cogn. Neurosci. 22, 2491–2502.
Ward, L. M. (2003). Synchronous neural oscillations and cognitive processes. Trends Cogn. Sci. 7, 553–559.
Keywords: electrocorticogram, oscillations, cross-frequency coupling, phase–amplitude coupling, gamma, alpha, theta
Citation: Voytek B, Canolty RT, Shestyuk A, Crone NE, Parvizi J and Knight RT (2010) Shifts in gamma phase–amplitude coupling frequency from theta to alpha over posterior cortex during visual tasks. Front. Hum. Neurosci. 4:191. doi: 10.3389/fnhum.2010.00191
Received: 31 May 2010;
Accepted: 22 September 2010;
Published online: 19 October 2010
Edited by:
Kai J. Miller, University of Washington, USAReviewed by:
Adriano B. L. Tort, Edmond and Lily Safra International Institute of Neuroscience of Natal, BrazilKai J. Miller, University of Washington, USA
Copyright: © 2010 Voytek, Canolty, Shestyuk, Crone, Parvizi and Knight. This is an open-access article subject to an exclusive license agreement between the authors and the Frontiers Research Foundation, which permits unrestricted use, distribution, and reproduction in any medium, provided the original authors and source are credited.
*Correspondence: Bradley Voytek, Helen Wills Neuroscience Institute, University of California Berkeley, 132 Barker Hall, Berkeley, CA 94720-3190, USA. e-mail: bradley.voytek@gmail.com