Mechanisms for phase shifting in cortical networks and their role in communication through coherence
- 1Donders Institute for Brain, Cognition and Behavior, Radboud University Nijmegen, Nijmegen, Netherlands
- 2Physics and Astronomy Department, University of North Carolina, Chapel Hill, NC, USA
- 3Howard Hughes Medical Institute, Salk Institute for Biological Studies, La Jolla, CA, USA
- 4Division of Biological Studies, University of California at San Diego, La Jolla, CA, USA
In the primate visual cortex, the phase of spikes relative to oscillations in the local field potential (LFP) in the gamma frequency range (30–80 Hz) can be shifted by stimulus features such as orientation and thus the phase may carry information about stimulus identity. According to the principle of communication through coherence (CTC), the relative LFP phase between the LFPs in the sending and receiving circuits affects the effectiveness of the transmission. CTC predicts that phase shifting can be used for stimulus selection. We review and investigate phase shifting in models of periodically driven single neurons and compare it with phase shifting in models of cortical networks. In a single neuron, as the driving current is increased, the spike phase varies systematically while the firing rate remains constant. In a network model of reciprocally connected excitatory (E) and inhibitory (I) cells phase shifting occurs in response to both injection of constant depolarizing currents and to brief pulses to I cells. These simple models provide an account for phase-shifting observed experimentally and suggest a mechanism for implementing CTC. We discuss how this hypothesis can be tested experimentally using optogenetic techniques.
Introduction
The firing rates of many neurons in the visual cortex are sensitive to the orientation of stimuli in their receptive field (Hubel and Wiesel, 1968; Ferster and Miller, 2000), but this response can also be modulated by changes in brain state, such as those induced by selective attention (Desimone and Duncan, 1995). Attention affected the strength of gamma oscillations (30–80 Hz) in the local field potential (LFP) and its coherence with spikes in single neurons (Reynolds and Chelazzi, 2004; Fries, 2009; Chalk et al., 2010).
The possible functional role of gamma oscillations in selective attention and stimulus selection has been explored in theoretical studies starting with Niebur and coworkers (Niebur et al., 1993; Niebur and Koch, 1994). In some studies increasing the amplitude of gamma oscillations not only increased the responsiveness of the network thereby accounting for experimentally observed increases in firing rate (Tiesinga et al., 2004; Borgers et al., 2005; Mishra et al., 2006; Tiesinga et al., 2008; Zeitler et al., 2008; Buehlmann and Deco, 2008; Buia and Tiesinga, 2008; Paik et al., 2009; Ardid et al., 2010; Gielen et al., 2010), but it could also improve behavioral response times by reducing response latencies (Buehlmann and Deco, 2008). However, gamma oscillations are typically weak and therefore have only a small effect on the firing rate, but they may be fundamental for interareal communication (Ardid et al., 2010).
Anatomical connectivity acts as a scaffold to give each neuron a stimulus preference (Hubel and Wiesel, 1968; Mooser et al., 2004), but behavioral goals often require more flexible modulation of connectivity, referred to as functional connectivity (Bullmore and Sporns, 2009; Ohiorhenuan et al., 2010). For example, a V4 neuron can respond to two stimuli at different locations in its receptive field (RF), for instance a circle and a rectangular bar (Figure 1A), because there is a projection from an upstream area (in V1 or V2) from local circuits that respond to these stimuli. However, if the subject is interested in only one of the two stimuli, the impact of the other stimulus should be reduced and/or the response to the attended stimulus should be strengthened. This can be achieved by increasing/reducing the activity in the corresponding upstream area of the cells responding to the attended/ignored stimulus, respectively, or by making the projection more or less effective. Although it is likely that a combination of the two processes is responsible for stimulus selection, we focus here on the latter.
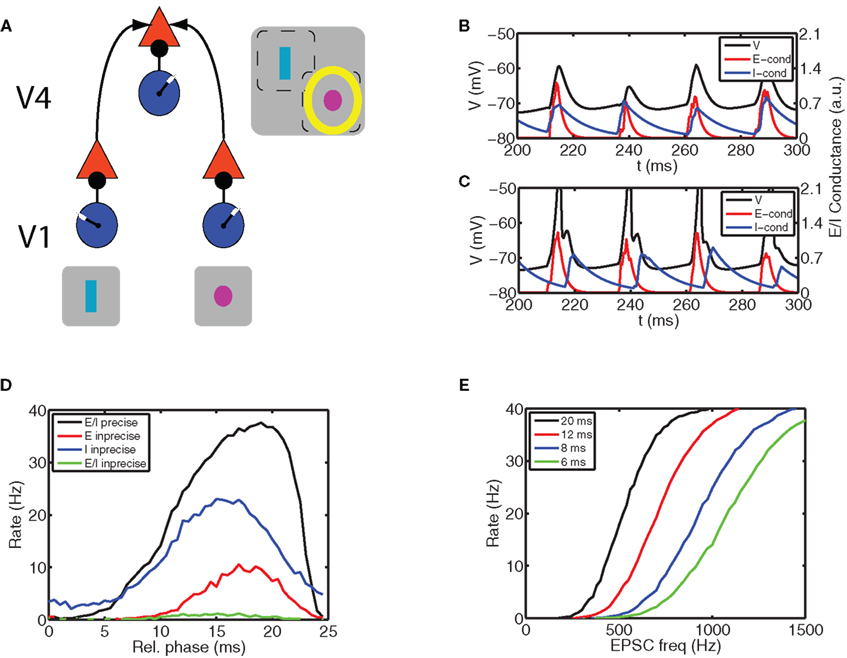
Figure 1. Communication through coherence (CTC) requires synchronous inhibition and excitation. (A) A possible mechanism for CTC (Fries, 2005; Tiesinga and Sejnowski, 2009). We consider three local circuits each comprised of a network of excitatory (E) and inhibitory (I) cells, with at least an inhibitory projection from the I to E cells. Two are in primary visual cortex (V1) and send an excitatory projection to the third one located in V4. The receptive field of each circuit is indicated by the gray squares that contain the schematic stimuli to which the V1 circuits respond: a rectangle for the left circuit and a circle for the right circuit. The V4 circuit responds to both stimuli. The yellow halo indicates that locus of spatial attention is at the circle stimulus. We explore how CTC can make the response of the circle preferring circuit in V1 become more effective in driving the neurons in the V4 circuit. The E cells in V4 receive local synchronized inhibition and two streams of synchronized E volleys. The following panels show that only the E stream arriving before inhibition can be effective in driving the neurons in V4. (B) When volleys of synchronized E activity arrive shortly after or at the same time as the I volley, the postsynaptic neuron does not spike, whereas (C) when the inhibition is delayed with respect to excitation the neuron does spike. We show (blue) I and (red) E conductance waveform (in arbitrary units, with the latter multiplied by a factor of five to illustrate the timing relationship more clearly) and (black) the membrane potential of the postsynaptic neuron receiving those synchronous synaptic drives. (D) The gating behavior is more clearly exposed by plotting the mean firing rate versus the delay between the E volley and I volley, here referred to as the relative phase. The firing rate is close to 0 when the E volley arrives just after the I volley and it is maximal when the E volley arrives just before. We show four different combinations of excitatory (σexc) and inhibitory precisions (σinh) expressed in terms of the standard deviation of spike times in the volley with units of ms: (σexc, σinh) is (black curve) (1,1), (red curve) (5,1), (blue curve) (1,5), and (green curve) (5,5). These curves show that relative phase operates most effectively as a gate when both inhibition and excitation are precisely synchronized. (E) Relative phase can gain modulate the input-to-output relationship of the neuron. We show the firing rate as a function of the rate with which E inputs arrive at the neuron for relative phases equal to (black curve) 20 ms, (red curve) 12 ms, (blue curve) 8 ms, and (green curve) 6 ms. (A) was adapted from Tiesinga, P., and Sejnowski, T. J. (2009). Cortical enlightenment: are attentional gamma oscillations driven by ING or PING? Neuron 63, 727–732 with permission.
In a previous study, we proposed a mechanism for selective attention (Tiesinga et al., 2004, 2008) based on the synchrony of inhibitory networks and found the conditions under which this mechanism could account for the experimentally observed multiplicative gain of orientation tuning curves (McAdams and Maunsell, 1999), increased LFP power in the gamma frequency range (Fries et al., 2001, 2008), and increased phase locking of spikes to the gamma oscillations in the LFP (Fries et al., 2001, 2008). In this model, neurons in the attention-modulated area produced spike trains that are phase-locked to the periodic inhibitory conductance. The model predicts that neurons in downstream cortical areas receive phase-locked excitatory inputs, referred to as non-local because they come from outside this cortical area, together with inputs from local inhibitory neurons, which could also be synchronized in the gamma frequency range. Our goal is to review and further investigate the functional consequences of these periodic synchronous volleys of excitatory (E) and inhibitory (I) inputs and to determine how these inputs are generated by networks.
Here we review four results: First, we show how the relative phase between periodic excitatory and inhibitory inputs is a mechanism for gain modulation and signal gating (Jose et al., 2001, 2002; Tiesinga et al., 2004; Buia and Tiesinga, 2006; Mishra et al., 2006), thereby concluding that modulation of the relative phase can be a mechanism for the communication through coherence (CTC) principle (Fries, 2005; Womelsdorf et al., 2007); Second, we analyze whether a neuron receiving periodic excitatory and inhibitory inputs can encode information about the excitatory inputs in the phase of its spikes (Tiesinga et al., 2002b); Third, we investigate how periodic and synchronous excitatory and inhibitory activity emerge from network dynamics and how the internal phase, global phase and oscillation frequency can be modulated by external inputs (Buia and Tiesinga, 2006; Tiesinga and Sejnowski, 2009); Fourth, we determine how stimulus preference and spike phase interact in a hypercolumn model for the visual cortex (Tiesinga and Buia, 2007). We conclude by relating these results to Arnold Tongues in dynamical systems theory; to recent experimental results on phase-shifting and to experimental tests of the CTC principle.
Results
Modulation of Single Neuron Activity by the Relative Phase between Periodic Excitatory and Inhibitory Inputs
Consider two local circuits, both projecting to a third circuit (Figure 1A), each comprised of E and I cells, with at least a projection from the local I cells to the E cells. When an input network is synchronized it produces periodic E cell activity at a specific global phase set by its local I cells. These two sources of E volleys together with the local inhibition drive the E cells in the receiving circuit. Here we are interested in modeling the impact of E and I streams that are out of phase.
We studied the effect of synchronized E and I inputs on a model neuron with Hodgkin–Huxley-type channels (Wang and Buzsaki, 1996; Tiesinga et al., 2004). Periodic and synchronous activity was modeled as a Poisson process with a time-varying firing rate comprised of a periodic sequence of Gaussian peaks. Each Gaussian peak generated a so-called volley: a set of input spike times tightly centered on the location of the peak. The period, which is the distance between consecutive peaks, was 25 ms and the width of the peak was parameterized by the standard deviation of the underlying Gaussian distribution, σ, which had a default value of 1 ms, corresponding to highly synchronous volleys. The E and I streams were phase-locked to each other with the I phase shifted relative to E. The simulations were based on the model in Tiesinga et al. (2004); the simulations in Figures 1B–D were presented previously in abstract form (Jose et al., 2001, 2002) and new simulations were performed for Figure 1E. See the Methods section in Tiesinga et al. (2004) and the key parameter values in section “Parameter Settings for Figure 1”.
The phase of an event is defined relative to an underlying (periodic) oscillation as

where tevent is the time of the event, tref is the reference time for which the phase is defined to be 0, T is the period of the oscillation, and the mod is the modulo operation, which removes the integer part of the ratio, yielding phases between 0 and 2π (360°, expressed in radians). The value of tref varied and was chosen for convenience, as stated for each calculation. By relative phase we mean the phase difference between periodic and synchronous E and I inputs, where the E and I phases were calculated using Eq. 1 for the mean phase of inputs across a volley. When the E and I inputs come from the same local network, the relative phase is referred to as the internal phase. When they come from different networks, their relative phase is the difference between global phases of the relevant local networks, usually taken to be the phase of the local E cells because these are thought to contribute most to the LFP.
The Relative Phase between Synchronous Excitatory and Inhibitory Inputs Acts as a Gate
In general, inhibitory inputs to a neuron lower its firing rate. However, since synchronous periodic inhibition creates windows during which the neuron can spike, the overall effect in combination with a constant depolarization could either be an increase or a decrease in the firing rate (Lytton and Sejnowski, 1991; Tiesinga et al., 2004). In contrast, excitatory inputs increase the neuronal firing rate and because some neurons act as coincidence detectors, synchronous excitatory inputs can increase the rate beyond that resulting from asynchronous inputs (Bernander et al., 1994; Murthy and Fetz, 1994). Model simulations show that the impact of the combined periodic inhibition and excitation (with the same oscillation frequency) was governed by a simple rule (Figures 1B,C): If inhibition preceded or arrived at approximately the same time as the excitation, the E volley was not effective in driving the postsynaptic neuron, but when the E volley preceded the I volley, there was an output spike. Hence, the firing rate depended on the relative phase of these two inputs, which can be used for stimulus selection.
In the context of Figure 1A, two sources of E volleys together with the local inhibition at a specific phase drive the E cells in the receiving circuit. Hence, by setting the corresponding global phase appropriately, and taking into account axonal transmission delays, the input stream from one local circuit can fall inside the window where inputs to the receiving cells are effective, whereas the input from the other local circuit falls outside this window and will be ignored, thereby selecting the stimulus.
The mechanism hypothesized to underlie stimulus selection was robust, as we observed it in many simulations with different parameter settings, of which we discuss some representative examples (Figure 1D). The effectiveness of sensory gating depends on the degree of synchronization. For highly synchronous volleys with a precision σ = 1 ms, there was a plateau with close to maximal firing rate for relative phases between 20 and 23 ms. The phase delay is given in ms because the oscillation period was kept constant at 25 ms. Thus, the E volleys arrived approximately 20 ms after the I volleys, or, equivalently, they arrived 5 ms before the next I volley for the given constant oscillation period. The onset of this plateau was not as sharp as the offset, since the onset represents the recovery of the postsynaptic cell from inhibition and was determined by the decay time constant (on the order of 10 ms) of the inhibitory conductance. The offset was related to the precision of the E volley as follows: Although the centroid of the E volley was before that of the I volley, a fraction of the E inputs arrived after the earliest I inputs because of the spike time dispersion in the volleys, which sometimes prevented an output spike on that cycle. Hence the firing rate started falling when the E volleys preceded the I volleys by an interval less than on the order of the sum of the standard deviation of the E and I volleys. When the E volleys were made imprecise the firing rate was much reduced and the peak of the firing rate shifted to an earlier relative phase (Figure 1D, red curve). When the I volleys were imprecise, the gate was less effective because the output neuron spiked at a low rate even for E volleys arriving just after the I volley (Figure 1D, blue curve), during which time interval the gate should be closed to implement CTC. When both E and I streams were imprecise, the firing rate was close to 0 (Figure 1D, green curve).
The observed effects occurred over a range of parameter values, and may be applicable to a wider class of models than presented here. First, by modulating the output firing rate, the inhibitory conductance defines a window for spiking. This requires a minimum inhibitory synaptic strength relative to the excitatory conductance, and the sum of the precision and inhibitory decay constants should be commensurate with the oscillation period. Hence, for 40 Hz gamma oscillations, the decay constant should be less than 10 ms and σ should be less than 5 ms. Second, the excitatory conductance should have a phasic component sufficiently strong and have enough precision to reliably elicit spikes within the window. This requires a strong enough excitatory conductance and for 40 Hz gamma oscillations a precision better than 5 ms and a synaptic time constant less than 5 ms.
Overall, the E–I gate was most effective for precise E and I volleys and could tolerate reduced precision of one source without degrading too much, but it was not effective when both sources were imprecise.
Relative Phase between E and I Volleys Modulates the Gain of the Input–Output Relationship
The spike train from a neuron contains information about the sensory stimulus and the brain state, such as the focus of spatial attention. Within the context of an oscillatory brain state, the two information channels available at the single neuron level are the presence of a spike on a given cycle and the spike phase if it occurs. The information content of the spike phase will be discussed in the section “Phase Coding and Shifting in Single Neuron Models”. The firing probability of a neuron on a cycle is equivalent to its mean firing rate across cycles up to a proportionality factor. To quantify this type of information transmission we studied the relation between stimulus-related inputs, here taken as the number of E spikes in the input volley and the output firing rate for different values of the phase of E relative to I (Figure 1E). The resulting curves had sigmoidal shapes. As the relative phase increased the midpoint shifted to the left because the level of inhibition at the arrival time of the E volley was less, thus yielding higher firing rates for the same input. The transition between non-spiking and spiking also became steeper as reflected in the derivative at the midpoint of the sigmoid. This cannot be described as a pure multiplicative gain change (Chance et al., 2002), but modulating the relative phase can nevertheless be used to select information.
Phase Coding and Shifting in Single Neuron Models
The same model neuron in the section “Modulation of Single Neuron Activity by the Relative Phase between Periodic Excitatory and Inhibitory Inputs” was again driven by E and I volleys in the gamma frequency range (40 Hz, period of 25 ms), with the E volleys preceding the I volleys by 5 ms and each volley having a precision of 1 ms, as illustrated schematically in Figure 2A. The number of incoming I and E spikes varied from cycle to cycle because the E and I inputs were generated as Poisson processes with a spike density comprised of a periodic sequence of Gaussian peaks. This caused variability in the spike phase and thus represented a possible information channel, as characterized below. The spike phase is defined as before using Eq. (1) by taking as the event time the spike time. The phase here was designated to be 0 at tref = 0 ms, relative to which the E volley arrived at a delay of 7.5 ms on each cycle and the I volley at 12.5 ms. The general framework was identical to that in Tiesinga et al. (2002b), except for the additional E volley input in the new simulations performed for this paper. See the section “Parameter Settings for Figure 2” for the values of the key parameters and the Methods section in the original paper (Tiesinga et al., 2002b).
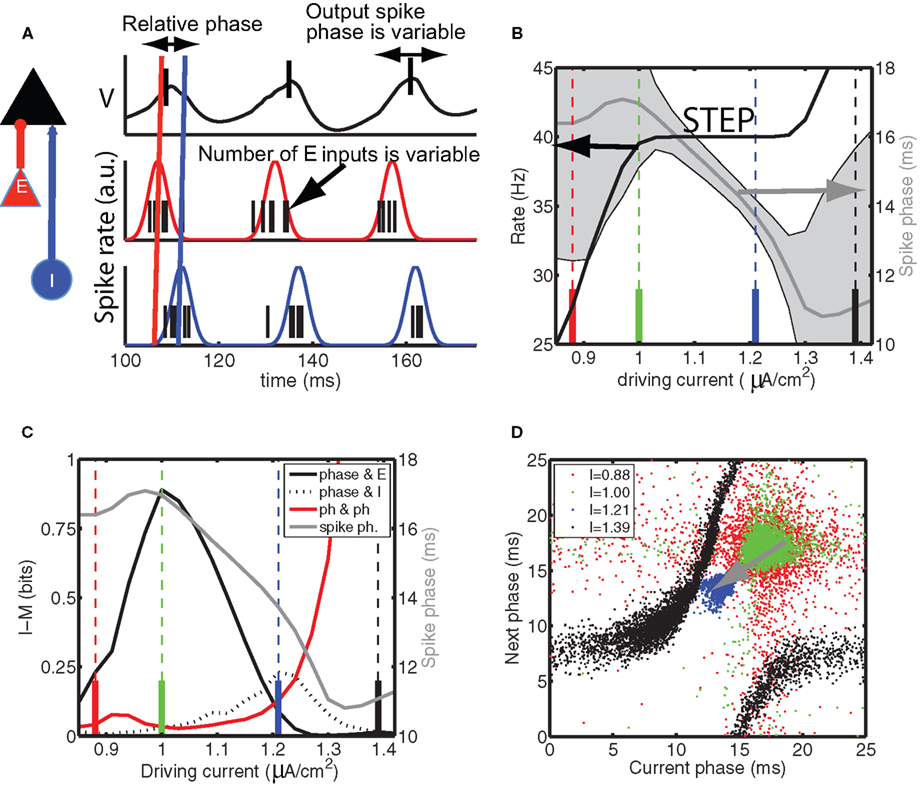
Figure 2. The information content of the spike times depends on the mean spike phase. (A) Diagram of model setup, the model neuron (black) is driven by synchronous, periodic excitatory inputs (red) that precede the synchronous, periodic inhibitory inputs (blue). We sketch the (black) membrane potential oscillations in response to (red) E and (blue) I periodic Gaussian spike densities, which are drawn together with spike times drawn from them. The output spike phase (black ticks in top panel) relative to the oscillation is variable because the number of E inputs varies from cycle to cycle. The mutual information is used to quantify the information in the spike phase about the number of E inputs in the volley that generated the spike. (B) The neuron phase-locks in the range of driving currents between approximately 1.0 and 1.3 (expressed in μA/cm2) because (black line, left hand-side axis) its firing rate is constant and equal to the oscillation frequency of the E and I inputs. During phase locking, the standard deviation in the spike phase – indicated by the half height of gray shading – becomes minimal and (gray curve, right hand-side axis) the mean spike phase is a function of driving current. Specifically, for higher current values the spikes appeared earlier in the cycle. (C), black curve, left hand-side axis) The mutual information IM, between the number of E inputs on a given cycle and the resulting spike phase, attained its maximum at the low current value of the step and decreased when the driving current was increased. In contrast (dashed black curve), the mutual information between the number of I inputs and spike phase and (red curve) mutual information between consecutivespikes phases increased with driving current. For comparison, the mean phase is re-plotted from (B) as the gray curve. The colored vertical lines indicate the current values for which the return map is shown in (D). (D) The spike phase varies from cycle to cycle because of the variation in the number of E and I inputs on a cycle and the state of the neuron, the latter of which is partially reflected in the value of the previous spike phase. The return map shows the correlation between consecutive phases. The color of the dots corresponds to the current value indicated by the colored vertical lines in (B,C).
Phase-Shifting is Possible on Phase-Locking Steps
We first kept the properties of the synaptic input fixed and varied the amount of constant depolarizing current injected into the model neuron (Figure 2B). A prominent feature in the firing rate versus input drive curve was a step on which the firing rate stayed constant for a range of input current values. This step was related to the one in Figure 1E of which only the start for higher rates of E inputs is visible, but for Figure 2 we kept the number of E inputs constant and instead varied the level of driving current to the model neuron. The spike phase was precise on this step: its standard deviation was equal to the half width of the gray shading in Figure 2B. On the step the spike phase varied from late in the cycle, just before the arrival of the I volley at the start of the step, to earlier in the cycle, just after the arrival of the E volley at the end of the step (Figure 2B). This shows how phase shifts occur in response to changes in driving current.
Spike Phase can Encode Stimulus Strength
We next considered the case where the (non-local) E inputs were feedforward stimulus-related inputs and (local) I inputs modulated the transmission of this information. The information channel transmitted information about the cycle-to-cycle variation in excitatory input, representing, for example, the strength or orientation of a visual stimulus, quantified as the mutual information between the number of E inputs and the output spike phase (Tiesinga et al., 2002b). One difference with Tiesinga et al. (2002b) was that we used a fixed number (5) of bins for each variable to minimize the bias in entropy estimation (Panzeri et al., 2007; Magri et al., 2009). The mutual information (IM) reached a maximum at the start of the step and then decreased to 0 at the end of the step (Figure 2C).
The correlation between consecutive spike phases, which can be visualized using the return map, in which the next spike phase is plotted as a function of the current spike phase (Figure 2D), can partially explain the behavior of the IM in terms of the mutual information between consecutive spike phases (Figure 2C). When the consecutive spike phases are independent (hence uncorrelated), the dots will fill out a spherically symmetric cloud, with the highest density of dots at the center, corresponding to a distribution which is the product of the two marginal distributions. The spike phase will generally depend on first, the preceding phase(s) since these reflect the neuron’s state in the current cycle, secondly on the E and I inputs received prior to the spike. If the E input contributes most to the spike phase variability, then the spike phase would convey the most information about the feedforward inputs (see Figure 2A). This requires minimization of the spike phase correlation and the effects of I, the latter could be accomplished by maximizing the E spike delay with respect to the I volley. The red cloud (Figure 2D), corresponding to a current value just before the onset of the step, was not spherical because of skipped spikes: On some cycles spikes drop out, which alters the phase of the spike on the next cycle, hence there were correlations between consecutive spike phases.
When the phase-lock step was reached, there was a broad green cloud, with little correlation and a reasonable spread, so that IM reached a maximum. When the current was further increased the mean spike phase decreased and the cloud shrunk (blue cloud in Figure 2D). The mutual information between spike phase and number of E inputs on a cycle is less than or equal to the entropy of the spike phase distribution (Cover and Thomas, 1991), which is related to the spread of the cloud. Hence, this lowered the amount of bandwidth in the channel and, furthermore, the effect of inhibition was increased. As a result, the amount of information in the spike phase about the E input was reduced, whereas the IM with the I input was increased (blue cloud in Figure 2D). When the neuron was off the phase-locking step (black cloud in Figure 2D), there were strong correlations because there were now additional spikes on some cycles, which led to spike-phase correlation reflected in the return map by a smeared curve, and corresponding to the rapid increase in the mutual information between consecutive phases (red curve in Figure 2C).
In summary, the spike phase shifts due to external activation (depolarizing current in Figure 2) during phase locking and the cycle-to-cycle variation in spike phase can be used to encode information about the input. The amount of information that can be recovered is reduced as the spike phase advances because of the effect of variability of inhibitory inputs on the spike phase.
Phase Shifting by External Inputs in Coupled Networks of E and I Cells
In the preceding analysis, a single neuron was driven by periodic streams of E and I inputs. We also investigated how the phases can be changed in networks. We performed new simulations of the model studied in Buia and Tiesinga (2006). The network was comprised of 400 E and 100 I cells coupled by inhibitory (GABA) and excitatory (AMPA) synapses. A description can be found in the section “Parameter Settings for Figure 3”, which together with the Methods section and Appendix in the original paper (Buia and Tiesinga, 2006) provides the necessary details.
Three phases can be changed: the internal phase between local E and local I in the sending circuit and the global phases of either the sending circuit or the receiving circuit. The latter two are equivalent because a positive shift in the sending circuit would have the same effect on the relative phase at the receiver as shifting the receiver by a negative phase. However, they are not equivalent when there are multiple senders, because shifting the phase of the receiver also alters the relative phase with the other senders.
The Internal Phase between E and I Volleys can be Shifted by a Constant Depolarizing Current to I Cells
In the PING mechanism (reviewed in Whittington et al., 2000; Tiesinga and Sejnowski, 2009) an E volley recruited an I volley at a certain latency, which halted E cell activity during the decay of the inhibitory conductance, after which the cycle started anew (Figure 3A). The sum of the latency and E cell recovery period determined the oscillation frequency (Figure 3B) and the latency normalized by the oscillation period (Figure 3C) is the relative phase between inhibition and excitation (Buia and Tiesinga, 2006). Increasing the depolarizing current injected into the I cells reduced the latency (and thus relative phase) (Figure 3Ca), without significantly affecting the oscillation frequency (Figure 3Ba). For these simulations, we first determine the time of E and I volleys using standard techniques to detect events, see Tiesinga et al. (2002c). The oscillation frequency was then determined using as the period the average time between two consecutive E volleys and the relative phase was calculated as the delay between consecutive I and E volleys, divided by the aforementioned period. In these examples, the oscillation frequency in the simulation varied from 28 to 32 Hz, and the phase varied from approximately 30 to 120°, corresponding to latencies of 3–11 ms. By contrast, depolarizing E cells had more effect on the oscillation frequency than on the phase (Figures 3Bb and Cb, respectively).
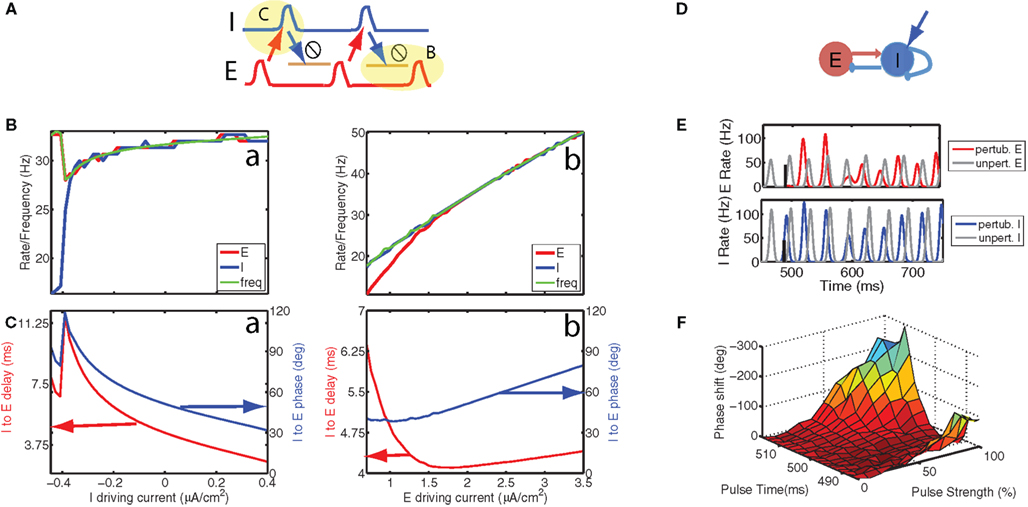
Figure 3. Stimulation of interneurons can alter internal phase as well as the global phase, thereby providing a means of manipulating information transmission according to the communication through coherence principle. (A) In the PING architecture, an excitatory (E) volley recruits an inhibitory (I) volley at a delay which depends on the level of depolarization of the I cells, whereas the E cells recover from inhibition with a time scale that depends on the time constant of inhibition and the level of depolarization. This predicts that increasing depolarization of the I cells will mostly reduce the I to E latency and will not strongly affect the oscillation frequency. Hence, a constant depolarizing current changes the relative phase between I and E. (B, green) Oscillation frequency, (red) E cell, and (blue) I cell firing rate as a function of the depolarizing current injected into the (a) I and (b) E cells. Because the curves are overlapping for higher current values, the green curve occludes the red and blue curves, thereby making them less visible. (C, red) delay between I and E volleys produced by the network and (blue) the corresponding relative phase as a function of the depolarizing current injected into the (a) I and (b) E cells. (D) Short excitatory pulses, such as those generated by optically stimulating channel rhodopsin-2 channels, can shift the global phase of a local circuit. We consider a network with reciprocal connections between E and I cells as well as mutual inhibition between I cells, which are also stimulated optically. (E, top) E-cell spike time histogram for (gray) the unperturbed network and (red) the network perturbed by a pulse to the I cells. (E, bottom) I-cell spike time histogram for (gray) the unperturbed network and (blue) the network perturbed by a pulse to the I cells. Because the pulse arrived before the I cell volley in the unperturbed case, it induced a weaker but earlier I cell volley, which resulted in a larger and later E cell volley. The effect of this was a forward shift (negative phase) that persisted in the stationary state of the oscillation to which the network returned in a few cycles. (F) We determined the phase shift as a function of pulse strength and pulse time (with reference to the unperturbed inhibitory volley, which was at approximately 500 ms). The most effective modulation was obtained when the pulse arrived about 10 ms after the I cell volley. In that case the shift increased (i.e., became more negative) with increasing pulse strength. The scale was inverted with negative phases plotted in the positive z direction. A was adapted from Tiesinga, P., and Sejnowski, T. J. (2009). Cortical enlightenment: are attentional gamma oscillations driven by ING or PING? Neuron 63, 727–732 with permission.
These network simulations were relevant to a postsynaptic neuron receiving input from E and I cells in the same local circuit (see for instance Buia and Tiesinga, 2006) as well as in the context of the diagram in Figure 1A, where a change in the internal phase of the sending circuit could alter the difference in global phase between the E cells in the receiving and sending circuit.
Pulsatile Inputs to I Cells Shift the Global Phase of Gamma Oscillations
As long-range projections between brain areas are predominantly excitatory, the relevant phase difference is that between non-local excitation and local inhibition, which can be changed by altering the global phase of either the sending or receiving local circuit. Our simulations show that changing the global phase of either local circuit does not require a constant depolarizing current, rather a short pulse to E or I cells is enough, as shown in Figure 3D. The network was oscillating in the gamma frequency range and a pulse arrived at the I cells a few milliseconds before they would have spiked in the unperturbed network (Figure 3E). This advanced the I cell volley, and reduced its size because the inhibitory conductance from the previous cycle had not fully decayed. The E volley was therefore delayed (it had preceded the I volley in the unperturbed oscillation), and was increased in amplitude because of the weaker inhibition. The overall effect was to advance the oscillation, which yielded a negative phase shift.
The size of the phase shift depended on when the pulse was applied and how strong the pulse was (Figure 3F). The largest shift was obtained for pulse arrivals about 10 ms after the I volley and there the size of the phase shift varied with pulse strength across almost 300°. This shows that a desired phase shift can be achieved by manipulating the pulse strength as long as the timing of the pulse is right. Simulations show that pulses to E cells also are effective in changing the global phase of the network (data not shown). We have not quantitatively compared the relative effectiveness of E versus I cell stimulation.
In summary, the global phase of a local circuit can be modulated by pulses, such as those mediated by a synchronized volley of synaptic inputs or optogenetic stimulation (Cardin et al., 2009; Sohal et al., 2009), whereas changing the internal phase between local E and I required a constant depolarization to be maintained for as long as the internal phase needs to have the altered value. Such slower time scale modulations could be mediated by neuromodulators (Buia and Tiesinga, 2006).
Phase-Shifting in a Hypercolumn Model of the Visual Cortex
Recent experiments have documented evidence for phase shifting of neurons in the visual cortex as a function of their firing rate, determined by their preferred orientation relative to that of the stimulus (Vinck et al., 2010). Although phase shifting in the periodically driven single neuron did not involve a change in firing rate, this might occur in the context of large-scale cortical networks. Gamma oscillations often occurred in networks containing inhibitory neurons, either according to an ING or PING mechanism (Whittington et al., 2000; Tiesinga et al., 2001; Tiesinga and Sejnowski, 2009). However, the neurons need to have relatively similar levels of activation (although this is not needed for a very large population with low firing rates; Brunel, 2000; Buia and Tiesinga, 2006). Within a hypercolumn, neurons fire at different rates, making synchrony harder to achieve. One way to solve this is to have a separate population of interneurons, which synchronize according to the ING mechanism (Tiesinga and Buia, 2007; Buia and Tiesinga, 2008). The alternative is to use the PING mechanism with interneurons that are less orientation selective.
We reran and reanalyzed a network model that oscillated with the PING mechanism corresponding to Figure 21.10B in Tiesinga and Buia (2007). The model had 21 columns each with 84 E cells and 21 I cells connected by inhibitory and excitatory synapses. A thalamocortical projection provided orientation selective input to cortical neurons. Each column had a different preferred orientation and the connection probability depended on the difference between the preferred orientation of pre- and postsynaptic cells, with the E connections being more orientation selective than the I connections. This is also referred to as a Mexican hat connectivity (Ben-Yishai et al., 1995) and sharpened the orientation selectivity of the network’s output relative to its input (Somers et al., 1995). Full details can be found in the Methods section and Appendix of Tiesinga and Buia (2007). The model was simulated a sufficiently long time to perform spectral analyses.
The overall population activity, averaged across 21 columns, each with a different preferred orientation, was synchronized at gamma frequencies, both in the interval during which the oriented stimulus was present and outside this interval, albeit that in the former the oscillation frequency was slightly higher (Figure 4A). When subpopulations were analyzed in terms of their preferred orientation, differences in firing rates emerged during the stimulus period (Figure 4A, with a close up in Figure 4B), which were absent outside the stimulus period (Figure 4A with a close up in Figure 4C). We compared five columns whose preferred orientation (P) was closest to the stimulus orientation and five columns of non-preferred orientation (NP) whose preferred orientation was furthest away. The P rate was higher than that of the overall population and the peak of the spike time histogram was ahead of the overall population, whereas the NP rate was lower and the peak lagged (Figure 4B). This observation was confirmed by calculating the coherence between the P and NP population and the overall population (Figure 4D), respectively, yielding a negative phase for the P population and a positive one for the NP population (Figure 4E). We determined whether this phase shifting was also present at the spike level (Figure 4F). For this analysis, the peak of inhibitory activity was defined to be at 0 phase and each spike was assigned a phase relative to this inhibitory activity. In response to the oriented stimulus, a neuron’s mean firing rate varied with its preferred orientation (Figure 4F, solid black line), and the mean phase varied with firing rate (and therefore also with preferred orientation, Figure 4F, solid gray line). For the highest rate, the spike occurred approximately 4 ms (60°) before the inhibitory peak, whereas for the lowest rate it occurred just before the inhibitory peak.
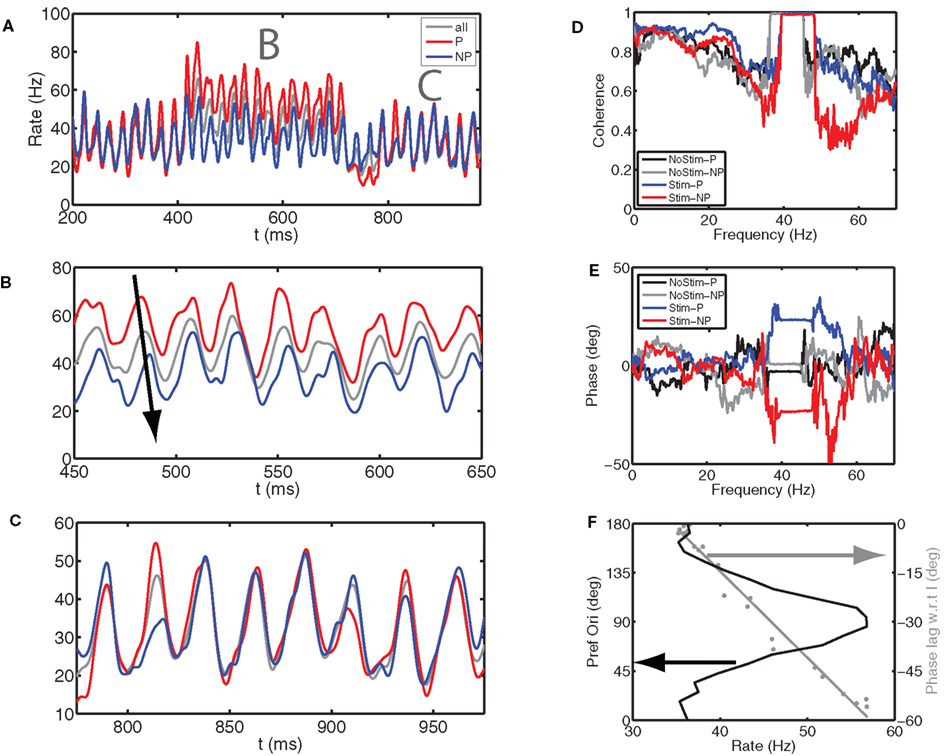
Figure 4. Gamma phase shifting emerges in a hypercolumn model of the visual cortex. We simulated a hypercolumn model where orientation selectivity was generated by a thalamocortical projection (Hubel and Wiesel, 1968) and where this selectivity was strengthened by recurrent circuitry (Somers et al., 1995). The firing rate of the E cells depended on the difference between their preferred orientation and the stimulus orientation. Parameters are as for Figure 21.10B in Tiesinga and Buia (2007). (A) We show the spike time histograms for (gray, “All”) all the E cells, (red, P population) five columns with preferred orientations closest and (blue, NP population) five columns with preferred orientations farthest from the stimulus orientation. The stimulus was present between 400 and 700 ms. (B,C) Close up of (A) during (B) the stimulus period and (C) after the stimulus. The arrow shows that E cells whose preferred orientation matches that of the stimulus fire ahead of the overall population and the E cells that prefer an orthogonal stimulus lag the population. After the stimulus both groups fire at the same time as the population. (D) The coherence between the overall E cell population and P and NP groups has a clear peak at gamma frequencies, which shifts to higher frequencies during stimulus presentation as compared to when there is no stimulus. We show (red) All-P coherence and (blue) All-NP coherence during the stimulus, whereas All-P and All-NP coherence after the stimulus is shown in black and gray, respectively. (E) The relative phase between entire E cell population and P and NP population with the same color code as for (D). During the stimulus period, the Ps have a negative phase indicating they are ahead of the population, whereas the NPs have a positive phase, indicating they are lagging the overall population. (F, black curve) The E-cell firing rate in a column as a function of its preferred orientation has a bell shaped curve. Furthermore (gray curve), the spike phase relative to the peak in I cell activity varied with mean firing rate and hence was a function of the preferred orientation. The cells with the highest firing rate fired approximately 60° before the I cells did, whereas those with the lowest firing rate fired just before the I cells.
The hypercolumn can be viewed as 21 strongly coupled PING models, each with a different driving current determined by its preferred orientation. From this viewpoint the observed phase shift would be expected based on the section “Phase-Shifting is Possible on Phase-Locking Steps”. However, the 21 networks synchronized at a common oscillation frequency, even though the mean firing rates across columns were different from the oscillation frequency; this was in contrast with phase shifting in the PING model shown in the section “Phase-Shifting is Possible on Phase-Locking Steps”.
In summary, within the context of this hypercolumn model phase shifting occurred with characteristics similar to those observed experimentally (Vinck et al., 2010). Specifically, in Figures 4 and 5A of that study, the phase varied with firing rate, with the earliest phase corresponding to the highest firing rate, as found for the results in Figure 4F. This is discussed further in the section “Phase Shifting is Possible on Arnold Tongues”.
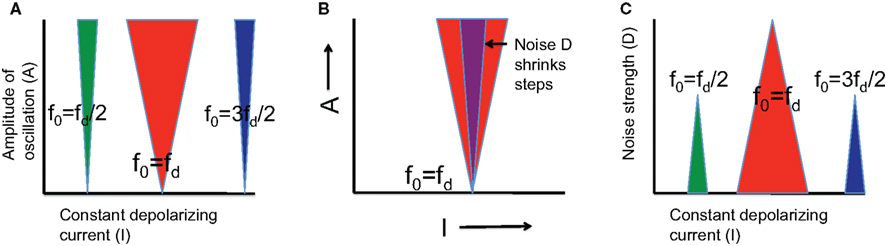
Figure 5. Schematic diagram of Arnold tongues. (A) Phase-locked solutions are labeled p:q, which means that the neuron produces p spikes on q cycles. We illustrate (green) the 1:2 step for which f0 = (1/2)fd; (red) the 1:1 step for which f0 = fd; and (blue) the 3:2 step for which f0 = (3/2)fd. The steps have 0 width (in the current I direction) when the amplitude A of the sinusoidal current is 0, but expand when A is increased, with the 1:1 step, the fundamental, being the broadest. (B) Noise (strength is indicated by D) destroys the phase-locked solutions at the edges, thereby reducing the width of the phase-locking steps. (C) The effect of noise is better illustrated by fixing the amplitude A and varying the noise strength D. Phase-locking steps shrink as D increases until they finally disappear. The 1:1 step is the most stable because it persists even when the other steps have already disappeared. The detailed description of these results can be found in Tiesinga (2002) for the case where fd is varied rather than f0 via I.
Discussion
Recent studies have linked fast brain oscillations, measured on the scalp or in the LFP, with cognitive processes and brain communication (Fries, 2009). To link structure to function, it is necessary to study how oscillations emerge in the cortical circuit and how these oscillations modulate the encoding of information at the single neuron level, with specific reference to the role of the spike phase. Here we discuss the mechanisms underlying phase shifting in models at the single neuron and network levels presented in the Results sections and relate them to recent experimental studies.
A Mathematical Mechanism for Phase Shifting
Phase shifting is a general phenomenon that occurs in a wide range of physical systems. Phase locking of a neuron occurs when it is driven by periodic synaptic inputs or current injection and becomes entrained. The phase of the periodic stimulus when the neuron responds can be influenced by tonic inputs, but not all phase-locked states are equally effective in being phase shifted. We briefly discuss here the mathematical background on Arnold tongues with regard to mechanisms for phase shifting by an external drive.
Phase Locking is Organized in Terms of Arnold Tongues
In response to a constant current I, after discarding a transient, a model neuron will fire at a constant rate which is denoted here by f0(I). This defines an intrinsic frequency (Schreiber et al., 2004). When in addition a periodic current with frequency fd (d stands for drive) and a very small amplitude A is injected, phase-locking is said to occur when the ratio of f0(I) and fd is a fraction: f0(I)/fd = p/q. This phase-locked state is denoted as p:q, which means that there are p spikes during q cycles, after which the sequence repeats itself (Tiesinga, 2002). For instance in the 1:1 state the neuron spikes once on every cycle.
There are two ways to cycle through different phase-locked states: keep fd fixed and vary I so that f0(I) changes, or keep I fixed and vary fd. We will only consider the former case as it relates directly to the results reported here, the latter case is discussed extensively in (Tiesinga, 2002; Tiesinga et al., 2002a). For A = 0, there is one current value I at which the p:q state is obtained: f0(I)/fd = p/q, but as A increases there is a range of current values for which the output rate fout is constant and equal to (p/q)fd. Hence, for finite A values, there are steps in the fout versus I curve just as in the one shown in Figure 2B. When each p:q phase-locked point in the I–A plane is colored in the same color according to its p:q value, tongue-like structures appear with their tip stuck at A = 0 (Figure 5A). These are called Arnold tongues.
Phase Shifting is Possible on Arnold Tongues
Even though fout is constant on a step, the spike phase varies from late in the cycle for low current values on the step, to earlier in the cycle for high current values on the step, similar to what is shown in Figure 2B. The spike phase reflects the phase shift in response to an external current applied to a single neuron driven by a periodic drive. For the leaky integrate-and-fire neuron the location of phase-locked solutions can be calculated analytically (Coombes and Bressloff, 1999).
Noise Destabilizes Arnold Tongues and Limits the Possibilities for Phase Shifting
The preceding discussion relates to neurons driven by a constant depolarizing current in combination with a periodic drive in the absence of noise. Here we discuss the effect of adding a 0-mean white noise current with a variance D to the input. For weak noise, phase locking is mostly stable: There will be jitter in the neuron’s spike time, and therefore also in its spike phase, but the spike phase variance is proportional to the noise variance and the mean phase will remain the same as it was without noise (Tiesinga, 2002). The spike phase variance is directly related to common measures of phase-locking strength (Vinck et al., 2010). However, phase-locked states at the edge of the step can disappear if the noise causes spikes to drop out at low current side of the step or if additional spikes can occur at high current side of the step. As a consequence, the spike phase variance is no longer linear in D (Figure 5B). Noise eats away the edges of the steps and they shrink in size as D increases. Simulations show that the 1:1 step is the most stable because it persists for the largest values of D (see Figure 5C and Tiesinga, 2002).
For strong noise, the spike time density is still periodic with frequency fd and the maximum spike density occurs at a specific phase. For low firing rates (less than fd) this state is driven by stochastic resonance (Collins et al., 1995). Without the membrane potential fluctuations caused by the noise the neuron does not fire because the neuron is subthreshold (Tiesinga et al., 2000). The noise fluctuations induce spikes to occur when the drive is near its peak, which leads to periodic modulation of the spike time density. When the level of depolarization is increased, the neuron is closer to threshold and the firing rate increases, but the mean phase at which these spikes occur does not necessarily change. Hence, within this context there is no phase shifting by external activation. However, phase shifting could still occur when the neuron is part of a synaptically coupled neural network, as demonstrated in Figure 4.
Experimental Results on Phase-Shifting and Phase-Locking
In Figure 2 we showed that neurons phase-lock and can under certain conditions phase shift in response to external inputs, a property that is extended to network models in Figure 3. We compare these results with related experimental results, to serve as the basis for making new predictions and designing experimental tests.
Phase Shifting and Phase Locking in vitro
Phase locking to injection of a periodic driving current has been studied extensively in vitro. McLelland and Paulsen (2009) found that CA1 pyramidal cells in rodent hippocampal slices can entrain to periodic drives in both the theta (5 Hz) as well as gamma frequency (40 Hz) range, but that phase shifting by increasing the level of depolarizing current is only possible for the theta frequency range (Figure 6A). The interpretation of this result in the context of the preceding discussion is that the intrinsic noise has pushed the neuron off the Arnold tongue for gamma frequency drives.
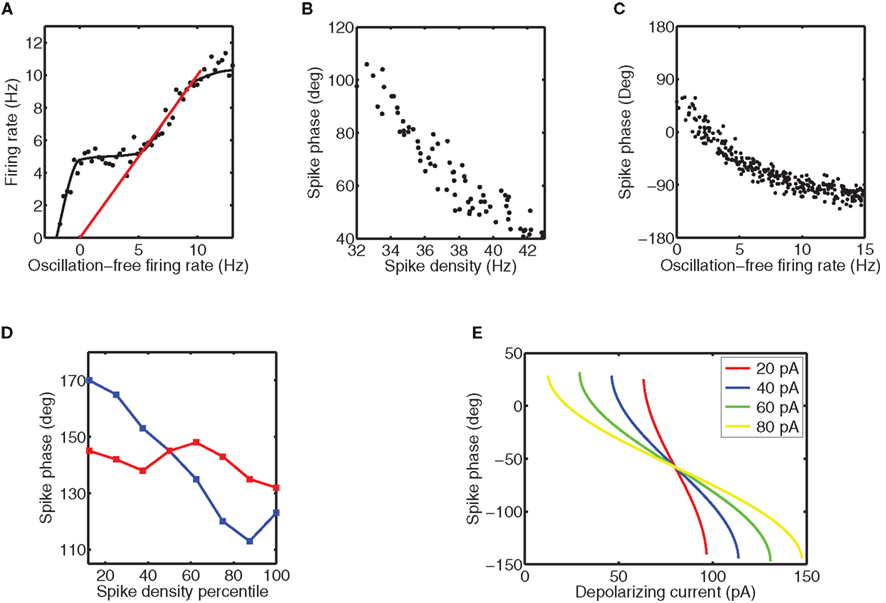
Figure 6. Phase-shifting is observed in vitro and in vivo. (A) The firing rate in response to a tonic depolarizing current and a 5 Hz sinusoidal current versus the firing rate without the sinusoidal current. The firing rate was systematically varied by increasing the strength of the tonic current. The step is visible as the location where the firing rate on the y axis is constant, whereas that on the x axis changes. The dots are typical data points, whereas the solid line is the smooth curve that follows these points. The red line represents y = x. For the data points on this line, the addition of oscillatory current does not alter the firing rate. This graph is a schematic representation of the data shown in Figure 1C of McLelland and Paulsen (2009). (B) Phase-shifting of neurons in the primary visual cortex of the macaque. For these data the phase is taken relative to the LFP and is plotted against the spike density calculated by convolving the spike train with a Gaussian of a standard deviation of 50 ms. The graph is a schematic representation of Figure 4C of Vinck et al. (2010). (C) The spike phase relative to the sinusoidal current versus the oscillation-free firing rate for the data shown in (A). This graph is a schematic representation of the data shown in Figure 1F of McLelland and Paulsen (2009). (D) The range across which can be phase-shifted in vivo does depend on the degree of phase locking. The red curve is for strong phase-locking and the blue curve is for weak phase-locking. This graph schematically represents the data shown in Figure 6D of Vinck et al. (2010). (E) Phase-shifting can be studied analytically by determining the spike phase as a function of the level and depolarizing current for the leaky integrate-and-fire neuron for different amplitudes of the sinusoidal current (each indicated by a different line color according to the legend shown as inset). Because the precision of a neuron is proportional to the time derivative of the membrane potential at spike threshold (Cecchi et al., 2000), a higher amplitude of the sinusoidal current will improve precision and hence the phase-locking strength. The noise-less analytical results shown here predict that the range across which the phase can be shifted is not altered by amplitude. This graph is based on Figure 4A of McLelland and Paulsen (2009) (we show the case where the spike threshold exceeds the reset potential by 20 mV).
In contrast, interneurons can phase shift to a gamma-frequency periodic drive (Tiesinga et al., 2002b). Otte et al. (2010) recently studied a related issue for three different types of pyramidal cells and three different types of inhibitory interneurons. They determined the cell types for which changes in the degree of gamma synchronization resulted in changes of the firing rate (Tiesinga et al., 2004). They found that fast spiking, parvalbumin-positive inhibitory cells (Markram et al., 2004) responded best, which they attributed to the faster membrane time constant compared to the pyramidal cells. They showed using model simulations that strong background activity, which would be present in vivo (Destexhe et al., 2003), sped up the membrane time scale of the pyramidal cells enough so they could respond to changes in gamma synchrony.
Phase Locking in vivo
In vivo experiments cannot directly study the mechanism of phase locking because there is no direct measurement of the synaptic inputs that generated the spike train, but the LFP is often used as a surrogate. In this context, a neuron is called phase locked when the firing rate is significantly modulated by the phase of the LFP in a particular frequency band. Phase locking of spikes with the LFP in various frequency bands has been observed in the human brain, with the distribution of phase-locking frequencies varying across cortical areas (Jacobs et al., 2007). For example, gamma phase locking was more prominent in the frontal areas, whereas in parietal and temporal cortices theta phase-locking was more prominent. In the visual cortex of non-human primates, phase locking in the gamma frequency band has been observed in some instances (Fries et al., 2001, 2008; Bichot et al., 2005). Phase locking has also been observed in rodent hippocampal neurons, with different cell types firing at different phases during theta oscillations (Klausberger et al., 2003; Klausberger and Somogyi, 2008). Furthermore, pyramidal cells in the rodent prefrontal cortex can also be locked to the theta rhythm in the hippocampus with a delay of 50 ms (Siapas et al., 2005).
Can the phase be shifted in vivo and what are the functional consequences? Phase shifting can affect the effectiveness of communication between different brain areas. Consistent with this idea, Womelsdorf et al. (2007) found that correlations in the power of oscillations between different brain areas varied with the relative phase between the LFPs in those areas. Similarly, synchronization between cortical areas varied with attention in non-human primates (Gregoriou et al., 2009) and in humans (Siegel et al., 2008), thereby suggesting that attention might be mediated via CTC.
Phase shifting has also been observed in primary visual cortex (Konig et al., 1995; Vinck et al., 2010): the gamma phase depended on the difference between the neuron’s preferred orientation and the stimulus orientation, with spikes appearing earlier in the cycle when the preferred orientation matched the stimulus orientation. This could also be formulated as a correlation between the phase and the spike density (with higher density leading to earlier spikes, see Figure 6B). When spike density was interpreted as the spike rate in the absence of a periodic drive as in McLelland and Paulsen (2009), here referred to as f0(I), this would be consistent with the phase-locking behavior of a single neuron to a periodic drive as discussed above (Figure 6C). However, Vinck et al. (2010) also show in their Figure 6 that the range within which the phase can be shifted increased with weaker phase locking (Figure 6D). This is not consistent with the simple model, where the range of possible phases is independent of stimulus amplitude (Figure 6E) and thus strength of phase locking (Figure 4 in McLelland and Paulsen, 2009) and the effective range is determined by the noise sensitivity, which is lower for higher amplitudes, yielding larger phase-shifting ranges. Phase precession in the rodent hippocampus is another example of phase shifting, relative to a theta rhythm (Mehta et al., 2002).
In the single neuron (Figure 2) and PING network model (Figure 3) the firing rate was approximately constant even though the spike phase varied, in contrast to the aforementioned experimental results (Vinck et al., 2010). However, within the context of the hypercolumn model, phase shifting was obtained even though the firing rates were not equal to the oscillation frequency. We can speculate that this is due to the fact that each column receives a set of excitatory and inhibitory volleys from a number of other columns at different phases, with the earliest and highest firing rate column being most efficient at outrunning the inhibition, but we have not ascertained quantitatively that this is true. Hence, it remains for future studies to determine what factors contribute to the range across which phases can be shifted in cortical networks and the concomitant changes in firing rates.
Information Content of Spike Phases
In recent experiments, the spike phase relative to low frequency (4–8 Hz) oscillations in the LFP contained more information than the firing rate by itself (Kayser et al., 2009). Instead of the gamma oscillations modeled in this paper, which emerge intrinsically, these oscillations were evoked by the auditory stimulus and had power in the low frequency band. In these experiments, there was less phase consistency across trials for higher frequencies, such as those in the gamma band, which meant that the information content was reduced compared to that in low frequencies. Nevertheless, spike patterns with ms precision do add information relative to the spike rate and the low-frequency phase, which points to the relevance of fast oscillations (Tiesinga et al., 2008). In a combined computational and in vitro study it was found that oscillatory currents improved the spike time precision, which made it possible to better distinguish between different fluctuating waveforms injected into the neuron based on the output spike times (Schaefer et al., 2006).
In an in vivo experiment, the responses of neurons in prefrontal cortex were measured during a task during which two stimuli were presented and where after a delay the subject had to saccade to the stimulus locations in the order in which the stimuli were presented (Siegel et al., 2009). The spikes during the delay activity were locked to the phase of a 32 Hz (low gamma) oscillation in the LFP. The firing rate of the neuron depended on the identity of the stimulus that was presented. The information content of spikes was quantified in terms of how much of the variance in firing rate across trials could be accounted for by the stimulus identity. The interesting finding was that the information content depended on phase, with the information about the first object being highest for an earlier phase compared to the most informative phase for the second object. Interpreted within the context of the results in Figure 2 showing that the amount of information in the spike phase depends on its mean value, this could perhaps be explained by two sources of synchronous excitatory inputs generated by networks sensitive to each of the two stimuli together with one source of synchronous local inhibition. It remains for future studies to determine how phase-specific coding of stimulus identity can be implemented in a model network.
Predictions
The experiments reviewed here and our modeling studies show that it is possible to use phase shifting for a functional purpose, such as stimulus selection. These functional hypotheses can now be tested directly with recently developed optogenetic techniques (Cardin et al., 2009; Sohal et al., 2009; Tiesinga and Sejnowski, 2009). In psychophysical experiments our ability to distinguish between two orientations depends on contrast (Lee et al., 1999). Electrophysiological experiments suggest that spatial attention has effects that are in some aspects similar to increasing contrast (Reynolds and Chelazzi, 2004), suggesting that attention could improve orientation discriminability. The models presented here hypothesize that attention can be mediated by CTC via excitatory volleys to I and E cells in networks which are generating the gamma oscillations. Hence, these models predict that applying optogenetic pulses to neurons in the appropriate brain area can improve orientation discriminability. The necessary optogenetic manipulation is likely to be feasible in a few years using viral transfection (Han et al., 2009).
Conflict of Interest Statement
The authors declare that the research was conducted in the absence of any commercial or financial relationships that could be construed as a potential conflict of interest.
Acknowledgments
This research was supported in part by the Human Frontier Science program (Paul H. Tiesinga), the Howard Hughes Medical Institute (Terrence J. Sejnowski), and the NSF Science of Learning Center SBE 0542013 (Terrence J. Sejnowski). We thank Jorge V. José, Calin Buia, Jean-Marc Fellous, and Emilio Salinas for their contributions to the work reviewed here and Stan Gielen, Thilo Womelsdorf, and Attila Sík for discussions.
References
Ardid, S., Wang, X. J., Gomez-Cabrero, D., and Compte, A. (2010). Reconciling coherent oscillation with modulation of irregular spiking activity in selective attention: gamma-range synchronization between sensory and executive cortical areas. J. Neurosci. 30, 2856–2870.
Ben-Yishai, R., Bar-Or, R. L., and Sompolinsky, H. (1995). Theory of orientation tuning in visual cortex. Proc. Natl. Acad. Sci. U.S.A. 92, 3844–3848.
Bernander, O., Koch, C., and Usher, M. (1994). The effect of synchronized inputs at the single neuron level. Neural Comput. 6, 622–641.
Bichot, N. P., Rossi, A. F., and Desimone, R. (2005). Parallel and serial neural mechanisms for visual search in macaque area V4. Science 308, 529–534.
Borgers, C., Epstein, S., and Kopell, N. J. (2005). Background gamma rhythmicity and attention in cortical local circuits: A computational study. Proc. Natl. Acad. Sci. U.S.A. 102, 7002–7007.
Brunel, N. (2000). Dynamics of sparsely connected networks of excitatory and inhibitory spiking neurons. J. Comput. Neurosci. 8, 183–208.
Buehlmann, A., and Deco, G. (2008). The neuronal basis of attention: rate versus synchronization modulation. J. Neurosci. 28, 7679–7686.
Buia, C. I., and Tiesinga, P. H. (2006). Attentional modulation of firing rate and synchrony in a model cortical network. J. Comput. Neurosci. 20, 247–264.
Buia, C. I., and Tiesinga, P. H. (2008). Role of interneuron diversity in the cortical microcircuit for attention. J. Neurophysiol. 99, 2158–2182.
Bullmore, E., and Sporns, O. (2009). Complex brain networks: graph theoretical analysis of structural and functional systems. Nat Rev. Neurosci. 10, 186–198.
Cardin, J. A., Carlen, M., Meletis, K., Knoblich, U., Zhang, F., Deisseroth, K., Tsai, L. H., and Moore, C. I. (2009). Driving fast-spiking cells induces gamma rhythm and controls sensory responses. Nature 459, 663–667.
Cecchi, G., Sigman, M., Alonso, J., Martinez, L., Chialvo, D., and Magnasco, M. (2000). Noise in neurons is message dependent. Proc. Natl. Acad. Sci. U.S.A. 97, 5557–5561.
Chalk, M., Herrero, J. L., Gieselmann, M. A., Delicato, L. S., Gotthardt, S., and Thiele, A. (2010). Attention reduces stimulus-driven gamma frequency oscillations and spike field coherence in V1. Neuron 66, 114–125.
Chance, F. S., Abbott, L. F., and Reyes, A. D. (2002). Gain modulation from background synaptic input. Neuron 35, 773–782.
Collins, J. J., Chow, C. C., and Imhoff, T. T. (1995). Stochastic resonance without tuning. Nature 376, 236–238.
Coombes, S., and Bressloff, P. C. (1999). Mode locking and Arnold tongues in integrate-and-fire neural oscillators. Phys. Rev. E 60, 2086–2096.
Desimone, R., and Duncan, J. (1995). Neural mechanisms of selective visual attention. Annu. Rev. Neurosci. 18, 193–222.
Destexhe, A., Rudolph, M., and Pare, D. (2003). The high-conductance state of neocortical neurons in vivo. Nat. Rev. Neurosci. 4, 739–751.
Ferster, D., and Miller, K. D. (2000). Neural mechanisms of orientation selectivity in the visual cortex. Annu. Rev. Neurosci. 23, 441–471.
Fries, P. (2005). A mechanism for cognitive dynamics: neuronal communication through neuronal coherence. Trends Cogn. Sci. 9, 474–480.
Fries, P. (2009). Neuronal gamma-band synchronization as a fundamental process in cortical computation. Annu. Rev. Neurosci. 32, 209–224.
Fries, P., Reynolds, J. H., Rorie, A. E., and Desimone, R. (2001). Modulation of oscillatory neuronal synchronization by selective visual attention. Science 291, 1560–1563.
Fries, P., Womelsdorf, T., Oostenveld, R., and Desimone, R. (2008). The effects of visual stimulation and selective visual attention on rhythmic neuronal synchronization in macaque area V4. J. Neurosci. 28, 4823–4835.
Gielen, S., Krupa, M., and Zeitler, M. (2010). Gamma oscillations as a mechanism for selective information transmission. Biol. Cybern. 101, 151–165.
Gregoriou, G. G., Gotts, S. J., Zhou, H., and Desimone, R. (2009). High-frequency, long-range coupling between prefrontal and visual cortex during attention. Science 324, 1207–1210.
Han, X., Qian, X., Bernstein, J. G., Zhou, H. H., Franzesi, G. T., Stern, P., Bronson, R. T., Graybiel, A. M., Desimone, R., and Boyden, E. S. (2009). Millisecond-timescale optical control of neural dynamics in the nonhuman primate brain. Neuron 62, 191–198.
Hubel, D. H., and Wiesel, T. N. (1968). Receptive fields and functional architecture of monkey striate cortex. J. Physiol. 195, 215–243.
Jacobs, J., Kahana, M. J., Ekstrom, A. D., and Fried, I. (2007). Brain oscillations control timing of single-neuron activity in humans. J. Neurosci. 27, 3839–3844.
Jose, J., Tiesinga, P., Fellous, J.-M., Salinas, E., and Sejnowski, T. (2001). Synchronization as a mechanism for attentional modulation. Soc. Neurosci. Abstract 27, 1910.
Jose, J., Tiesinga, P., Fellous, J.-M., Salinas, E., and Sejnowski, T. (2002). Is attentional modulation optimal at gamma frequencies? Soc. Neurosci. Abstract 28, Program No. 55.56.
Kayser, C., Montemurro, M. A., Logothetis, N. K., and Panzeri, S. (2009). Spike-phase coding boosts and stabilizes information carried by spatial and temporal spike patterns. Neuron 61, 597–608.
Klausberger, T., Magill, P. J., Marton, L. F., Roberts, J. D., Cobden, P. M., Buzsaki, G., and Somogyi, P. (2003). Brain-state- and cell-type-specific firing of hippocampal interneurons in vivo. Nature 421, 844–848.
Klausberger, T., and Somogyi, P. (2008). Neuronal diversity and temporal dynamics: the unity of hippocampal circuit operations. Science 321, 53–57.
Konig, P., Engel, A. K., Roelfsema, P. R., and Singer, W. (1995). How precise is neuronal synchronization? Neural. Comput. 7, 469–485.
Lee, D. K., Itti, L., Koch, C., and Braun, J. (1999). Attention activates winner-take-all competition among visual filters. Nat. Neurosci. 2, 375–381.
Lytton, W., and Sejnowski, T. (1991). Simulations of cortical pyramidal neurons synchronized by inhibitory interneurons. J. Neurophysiol. 66, 1059–1079.
Magri, C., Whittingstall, K., Singh, V., Logothetis, N. K., and Panzeri, S. (2009). A toolbox for the fast information analysis of multiple-site LFP, EEG and spike train recordings. BMC Neurosci. 10, 81.
Markram, H., Toledo-Rodriguez, M., Wang, Y., Gupta, A., Silberberg, G., and Wu, C. (2004). Interneurons of the neocortical inhibitory system. Nat. Rev. Neurosci. 5, 793–807.
McAdams, C. J., and Maunsell, J. H. (1999). Effects of attention on orientation-tuning functions of single neurons in macaque cortical area V4. J. Neurosci. 19, 431–441.
McLelland, D., and Paulsen, O. (2009). Neuronal oscillations and the rate-to-phase transform: mechanism, model and mutual information. J. Physiol. 587, 769–785.
Mehta, M. R., Lee, A. K., and Wilson, M. A. (2002). Role of experience and oscillations in transforming a rate code into a temporal code. Nature 417, 741–746.
Mishra, J., Fellous, J. M., and Sejnowski, T. J. (2006). Selective attention through phase relationship of excitatory and inhibitory input synchrony in a model cortical neuron. Neural Netw. 19, 1329–1346.
Mooser, F., Bosking, W. H., and Fitzpatrick, D. (2004). A morphological basis for orientation tuning in primary visual cortex. Nat. Neurosci. 7, 872–879.
Murthy, V. N., and Fetz, E. E. (1994). Effects of input synchrony on the response of a three-conductance cortical neuron model. Neural Comput. 6, 1111–1126.
Niebur, E., and Koch, C. (1994). A model for the neuronal implementation of selective visual attention based on temporal correlation among neurons. J. Comput. Neurosci. 1, 141–158.
Niebur, E., Koch, C., and Rosin, C. (1993). An oscillation-based model for the neuronal basis of attention. Vision Res. 33, 2789–2802.
Ohiorhenuan, I. E., Mechler, F., Purpura, K. P., Schmid, A. M., Hu, Q., and Victor, J. D. (2010). Sparse coding and high-order correlations in fine-scale cortical networks. Nature 466, 617–621.
Otte, S., Hasenstaub, A., and Callaway, E. M. (2010). Cell type-specific control of neuronal responsiveness by gamma-band oscillatory inhibition. J. Neurosci. 30, 2150–2159.
Paik, S. B., Kumar, T., and Glaser, D. A. (2009). Spontaneous local gamma oscillation selectively enhances neural network responsiveness. PLoS Comput. Biol. 5, e1000342. doi: 10.1371/journal.pcbi.1000342.
Panzeri, S., Senatore, R., Montemurro, M. A., and Petersen, R. S. (2007). Correcting for the sampling bias problem in spike train information measures. J. Neurophysiol. 98, 1064–1072.
Reynolds, J. H., and Chelazzi, L. (2004). Attentional modulation of visual processing. Annu. Rev. Neurosci. 27, 611–647.
Schaefer, A. T., Angelo, K., Spors, H., and Margrie, T. W. (2006). Neuronal oscillations enhance stimulus discrimination by ensuring action potential precision. PLoS Biol. 4, e163. doi: 10.1371/journal.pbio.0040163.
Schreiber, S., Fellous, J. M., Tiesinga, P., and Sejnowski, T. J. (2004). Influence of ionic conductances on spike timing reliability of cortical neurons for suprathreshold rhythmic inputs. J. Neurophysiol. 91, 194–205.
Siapas, A. G., Lubenov, E. V., and Wilson, M. A. (2005). Prefrontal phase locking to hippocampal theta oscillations. Neuron 46, 141–151.
Siegel, M., Donner, T. H., Oostenveld, R., Fries, P., and Engel, A. K. (2008). Neuronal synchronization along the dorsal visual pathway reflects the focus of spatial attention. Neuron 60, 709–719.
Siegel, M., Warden, M. R., and Miller, E. K. (2009). Phase-dependent neuronal coding of objects in short-term memory. Proc. Natl. Acad. Sci. U.S.A. 106, 21341–21346.
Sohal, V. S., Zhang, F., Yizhar, O., and Deisseroth, K. (2009). Parvalbumin neurons and gamma rhythms enhance cortical circuit performance. Nature 459, 698–702.
Somers, D. C., Nelson, S. B., and Sur, M. (1995). An emergent model of orientation selectivity in cat visual cortical simple cells. J. Neurosci. 15, 5448–5465.
Tiesinga, P., and Sejnowski, T. J. (2009). Cortical enlightenment: are attentional gamma oscillations driven by ING or PING? Neuron 63, 727–732.
Tiesinga, P. H. (2002). Precision and reliability of periodically and quasiperiodically driven integrate-and-fire neurons. Phys. Rev. E 65, 041913.
Tiesinga, P. H., and Buia, C. I. (2007). “Attentional modulation in layer 4 of the visual cortex could be mediated by interneurons with complex receptive field characteristics,” in Computational Neuroscience in Epilepsy, eds I. Soltesz and K. Staley (San Diego: Elsevier), 306–321.
Tiesinga, P. H., Fellous, J. M., Jose, J. V., and Sejnowski, T. J. (2001). Computational model of carbachol-induced delta, theta, and gamma oscillations in the hippocampus. Hippocampus 11, 251–274.
Tiesinga, P. H., Fellous, J. M., Salinas, E., Jose, J. V., and Sejnowski, T. J. (2004). Inhibitory synchrony as a mechanism for attentional gain modulation. J. Physiol. Paris 98, 296–314.
Tiesinga, P. H., Fellous, J. M., and Sejnowski, T. J. (2002a). Spike-time reliability of periodically driven integrate-and-fire neurons. Neurocomputing 44, 195–200.
Tiesinga, P. H. E., Fellous, J. M., Jose, J. V., and Sejnowski, T. J. (2002b). Information transfer in entrained cortical neurons. Netw. Comput. Neural Syst. 13, 41–66.
Tiesinga, P. H. E., Fellous, J. M., and Sejnowski, T. J. (2002c). Attractor reliability reveals deterministic structure in neuronal spike trains. Neural Comput. 14, 1629–1650.
Tiesinga, P. H., Fellous, J. M., and Sejnowski, T. J. (2008). Regulation of spike timing in visual cortical circuits. Nat. Rev. Neurosci. 9, 97–109.
Tiesinga, P. H. E., Jose, J. V., and Sejnowski, T. J. (2000). Comparison of current-driven and conductance-driven neocortical model neurons with Hodgkin-Huxley voltage-gated channels. Phys. Rev. E 62, 8413–8419.
Vinck, M., Lima, B., Womelsdorf, T., Oostenveld, R., Singer, W., Neuenschwander, S., and Fries, P. (2010). Gamma-phase shifting in awake monkey visual cortex. J. Neurosci. 30, 1250–1257.
Wang, X. J., and Buzsaki, G. (1996). Gamma oscillation by synaptic inhibition in a hippocampal interneuronal network model. J. Neurosci. 16, 6402–6413.
Whittington, M. A., Traub, R. D., Kopell, N., Ermentrout, B., and Buhl, E. H. (2000). Inhibition-based rhythms: experimental and mathematical observations on network dynamics. Int. J. Psychophysiol. 38, 315–336.
Womelsdorf, T., Schoffelen, J. M., Oostenveld, R., Singer, W., Desimone, R., Engel, A. K., and Fries, P. (2007). Modulation of neuronal interactions through neuronal synchronization. Science 316, 1609–1612.
Keywords: attention, gamma oscillations, synchrony, phase shifting, phase locking
Citation: Tiesinga PH and Sejnowski TJ (2010) Mechanisms for phase shifting in cortical networks and their role in communication through coherence. Front. Hum. Neurosci. 4:196. doi: 10.3389/fnhum.2010.00196
Received: 01 June 2010;
Accepted: 29 September 2010;
Published online: 02 November 2010.
Edited by:
Thilo Womelsdorf, Robarts Research Institute London, CanadaReviewed by:
Markus Siegel, Massachusetts Institute of Technology, USA;Stephanie R. Jones, Harvard Medical School, USA;
Ole Paulsen, University of Cambridge, UK
Copyright: © 2010 Tiesinga and Sejnowski. This is an open-access article subject to an exclusive license agreement between the authors and the Frontiers Research Foundation, which permits unrestricted use, distribution, and reproduction in any medium, provided the original authors and source are credited.
*Correspondence: Paul H.Tiesinga, Donders Centre for Neuroscience/FNWI, Radboud University Nijmegen, P.O. Box 9010, 6500 GL Nijmegen, Netherlands. e-mail: p.tiesinga@science.ru.nl