Functional brain network changes associated with maintenance of cognitive function in multiple sclerosis
- 1 Department of Neuroscience, Baylor College of Medicine, Houston, TX, USA
- 2 Department of Neurology, Baylor College of Medicine, Houston, TX, USA
In multiple sclerosis (MS) functional changes in connectivity due to cortical reorganization could lead to cognitive impairment (CI), or reflect a re-adjustment to reduce the clinical effects of widespread tissue damage. Such alterations in connectivity could result in changes in neural activation as assayed by executive function tasks. We examined cognitive function in MS patients with mild to moderate CI and age-matched controls. We evaluated brain activity using functional magnetic resonance imaging (fMRI) during the successful performance of the Wisconsin card sorting (WCS) task by MS patients, showing compensatory maintenance of normal function, as measured by response latency and error rate. To assess changes in functional connectivity throughout the brain, we performed a global functional brain network analysis by computing voxel-by-voxel correlations on the fMRI time series data and carrying out a hierarchical cluster analysis. We found that during the WCS task there is a significant reduction in the number of smaller size brain functional networks, and a change in the brain areas representing the nodes of these networks in MS patients compared to age-matched controls. There is also a concomitant increase in the strength of functional connections between brain loci separated at intermediate-scale distances in these patients. These functional alterations might reflect compensatory neuroplastic reorganization underlying maintenance of relatively normal cognitive function in the face of white matter lesions and cortical atrophy produced by MS.
Introduction
During the past decade, functional magnetic resonance imaging (fMRI) studies have shown that the human brain is capable of reacting to CNS injury in conditions such as multiple sclerosis (MS) (Rocca and Filippi, 2006). Several studies over these years have applied fMRI in the assessment of patients with MS (Forn et al., 2006; Pantano et al., 2006; Forn et al., 2007; Rocca and Filippi, 2007). Cognitive impairment (CI) is now considered one of the clinical markers of MS, and a leading cause of work-related disability in MS patients (Nocentini et al., 2006; Patti et al., 2009). CI is only weakly correlated with the type of MS, disease duration, or physical disability (Bagert et al., 2002). However, there is a relatively strong correlation between CI and overall lesion burden and brain atrophy (Bagert et al., 2002; Nocentini et al., 2006). In general, fMRI studies have demonstrated evidence for cortical reorganization in patients with MS performing cognitive or movement associated tasks, in comparison to controls. The suggestion is that such functional changes might have an adaptive role in reducing the clinical effects of widespread tissue damage.
An altered recruitment of regions normally devoted to performance of a given task and/or the recruitment of additional areas that are not typically activated by healthy people for performing that task have been described in MS patients, when investigating the visual, cognitive, and motor systems. Using conventional MRI, MR spectroscopy, magnetization transfer, and diffusion weighted MRI, studies have shown that functional changes are correlated with structural changes in the MS brain. This was most recently demonstrated in a study which investigated a simple motor task in patients with relapsing MS (Rocca and Filippi, 2007). The correlations found between measures of functional connectivity and structural damage to some of the major brain motor white matter bundles suggested an adaptive role of functional connectivity changes in limiting the clinical consequence of structural damage in patients with relapsing remitting MS (Saini et al., 2004; Au Duong et al., 2005; Lowe et al., 2008; Rocca et al., 2009).
A working hypothesis for these observations is that neuropathological changes and/or structural-functional reorganization that occur in MS result in altered connectivity patterns in affected neural areas. Such alterations in connectivity could result in changes in neural activation as assayed by executive function and decision-making tasks. These alterations may underlie overt behavioral dysfunction and/or indicate compensatory mechanisms engaged to maintain a normal level of cognitive function. They may provide a unique neural signature that could be indicative of disease severity or disease progression. We hypothesize that these behavioral changes should be reflected in altered functional brain connectivity in fMRI data from neuropsychological tests of executive function such as the Wisconsin Card Sorting task (WCS). The WCS task is a neuropsychological test of “set-shifting,” the ability to display flexibility in the face of changing schedules of reinforcement. To test this hypothesis we have developed a modified computational procedure to determine measures of connectivity in small, intermediate, and large-scale functional networks encompassing the entire brain without using regions of interest as seeds, and without making any a priori assumptions about particular networks. Previous studies have relied on the latter approaches to perform functional connectivity analysis in MS patients (Audoin et al., 2006). To our knowledge this is the first study to conduct whole brain functional network connectivity analysis in MS patients during the performance of an executive function task.
Materials and Methods
Subjects
We performed two experiments in this study. Experiment 1 was done to validate our approach and method of analysis of fMRI data. It was done in 21 normal subjects. These subjects were cognitively normal (age – 33.2 ± 2.0 years, 10 males and 11 females), and were recruited through the Human Neuroimaging Laboratory (HNL, directed by PRM). Experiment 2 was conducted to compare brain network and connectivity measures between cognitively impaired MS patients (n = 16) and age-matched controls (n = 18). In both experiments males and females aged 18 through 60 were eligible to participate. They had normal vision or were vision corrected to be able to see the computer display clearly with or without eyeglasses. Control subjects were cognitively normal. MS patients had mild to moderate cognitive dysfunction, defined as having Montreal Cognitive Assessment (MOCA) scores of 20–25.
The exclusion criteria for subjects in this study were as follows: (1) Claustrophobia, which would make lying in the scanner potentially uncomfortable. (2) Inability to tolerate MRI for any other reason. (3) Pregnancy. (4) Contraindications to MRI including pacemaker, aneurysm clips, neuro stimulators, cochlear implants, metal in the eyes, or other such contraindications. (5) Active medical or neurologic disorders for controls, or active medical problems for study patients. (6) Inability to carry out the study tasks due to motor impairment. (7) MS patients with more than moderate cognitive dysfunction.
The MS patients (age – 39.6 ± 2.6 years, 5 males and 11 females) were diagnosed and clinically assessed at the Maxine Mesinger Multiple Sclerosis Clinic by one of the authors (George J. Hutton). Their clinical details are given in Table 1. The age-matched normal control subjects (age – 36 ± 2.2 years, 7 males and 11 females) were recruited through the HNL. The study protocol was approved by the BCM Institutional Review Board. The subjects were compensated by offering $50 for participation in each scanning session.
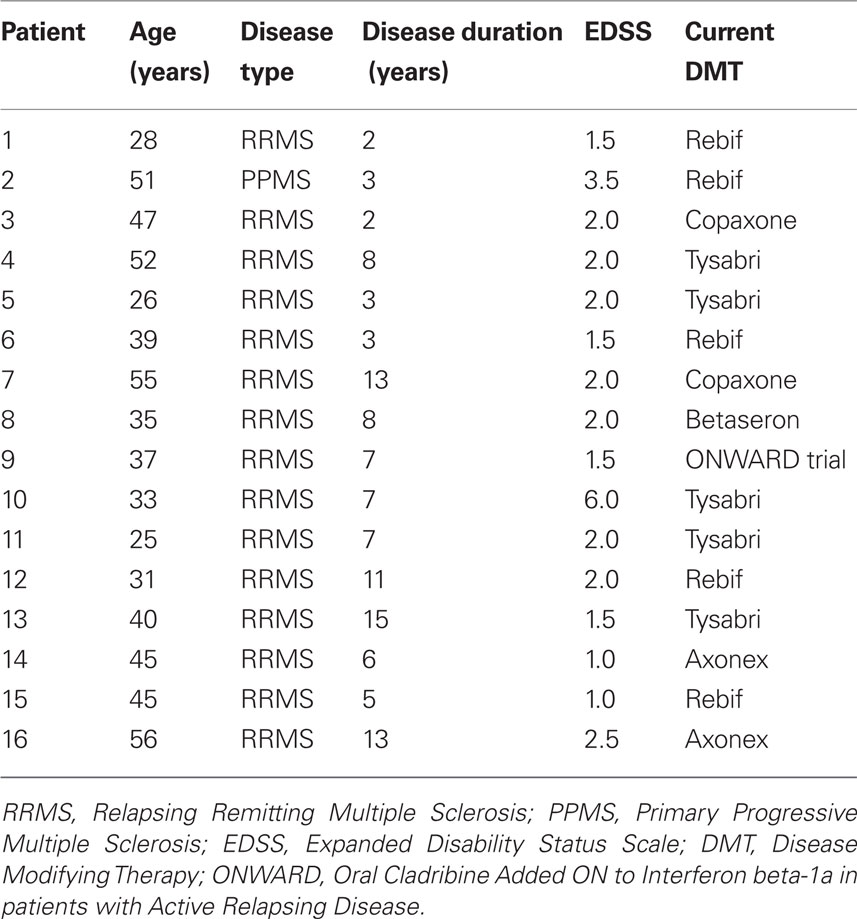
Table 1. Clinical data on patients.
fMRI Scanning and Behavioral Tasks
All of the fMRI scanning and data analysis was carried out in HNL at Baylor College of Medicine (BCM). We used a modified functional brain network analysis procedure on fMRI data to obtain biometric measures. The aim of the study was to compare these measures between MS patients and controls during the performance of two cognitive tasks, namely Stroop task and the WCS task. We tested the validity and utility of our modified analytical procedure on 21 normal control subjects scanned under two different experimental conditions at the outset. The subjects were scanned during the resting state (6 min duration) and during performance of the Stroop task (5–6 min duration). In the resting state condition they fixated with eyes open on a cross hair target on the computer screen through an overhead display mirror, letting their mind wander. In the Stroop task the subjects were presented with names of different colors on the screen. The color of the font of each name was either matched or mismatched with the named color in a pseudo-random manner. Subjects were prompted to indicate the color of the font, irrespective of the named color, or the named color, irrespective of the color of the font, as quickly as possible (Stroop, 1935).
In the experiment involving a comparison between MS patients and matched controls, subjects performed a WCS task during the fMRI scan. The WCS test (Berg, 1948) provides a measure of the ability to identify abstract categories and shift cognitive set (Lezak et al., 2004). In the present study the subjects performed this task on the computer by looking at the display through a mirror positioned above their head. They selected their choice by overlaying a selector box on the correct choice using a device similar to a computer mouse. The computerized version of the WCS task involved a series of trials with three types of displays on the computer screen in three sequential steps. The screen shots for these displays are shown Figure S1 in Supplementary Material. At the bottom of each display screen there were four cards. Each card had symbols with identical shapes (stars, crosses, triangles, and circles), ranging in number from one through four, and all of the same color (red, green, yellow, and blue). At the center of the screen there was a query card with a specific pattern following one of the three rules, namely based on shape, number, or color. The subjects were asked to place their selector box around one of the four bottom cards that specified the sorting rule. They then received feedback telling them whether they made the correct or incorrect choice. Thus, the three sequential display screens in each trial were the prompt screen, choice screen, and feedback screen. The subjects had to respond at the choice screen for the trial to be completed, and the screen to move on to the next trial. Each trial series with pseudorandomly varied number of trials followed the same sorting rule. The rule remained the same or changed in a pseudo-random manner with each new series. Each scanning session consisted of multiple series consisting of a total of 60 trials. The performance of the subject on the WCS test was scored in terms of errors and latencies of response. The total duration of the WCS scanning session was 20–30 min.
During the resting state, Stroop task, and WCS task subjects were scanned on Siemens 3T Trio machines. Functional imaging data was acquired via echo-planar imaging (Kwong, 1995) with the following timing parameters: TR = 2000 ms, TE = 25 ms. The 37 slice protocol (4 mm thickness, hyperangulated to 30°) resulted in voxel dimensions of 3.4 mm × 3.4 mm × 4.0 mm. A Siemens T1-weighted MP Rage sequence was used to acquire structural scans. Data were resampled into 4 mm × 4 mm × 4 mm voxels and preprocessed with SPM2 (Statistical Parametric Mapping 2, Wellcome Department of Cognitive Neurology, London, UK) by performing slice timing correction, realignment, spatial normalization to Montreal Neurological Institute (MNI) space (International Consortium for Brain Mapping 152 atlas), and smoothed using the method of Ashburner and Friston (1999).
Functional Brain Network Analysis
The modified computational procedure that we have developed determines measures of connectivity in small, intermediate, and large-scale functional networks encompassing the entire brain, using a model-free data-driven approach. By performing voxel-by-voxel cross-correlation analysis and hierarchical cluster analysis we have been able to parcellate fMRI maps of the whole brain into functional networks of varying sizes (Figure 1), and determine changes in connectivity parameters such as the total number and sizes of functional networks, the connection strengths within and between networks, the spatial extent of networks and the brain area composition of networks. We modified the functional connectivity analysis procedures involving voxel-by-voxel time series cross-correlation and hierarchical clustering that have been used by others previously, and described in the literature (Cordes et al., 2002; Karkar et al., 2009).
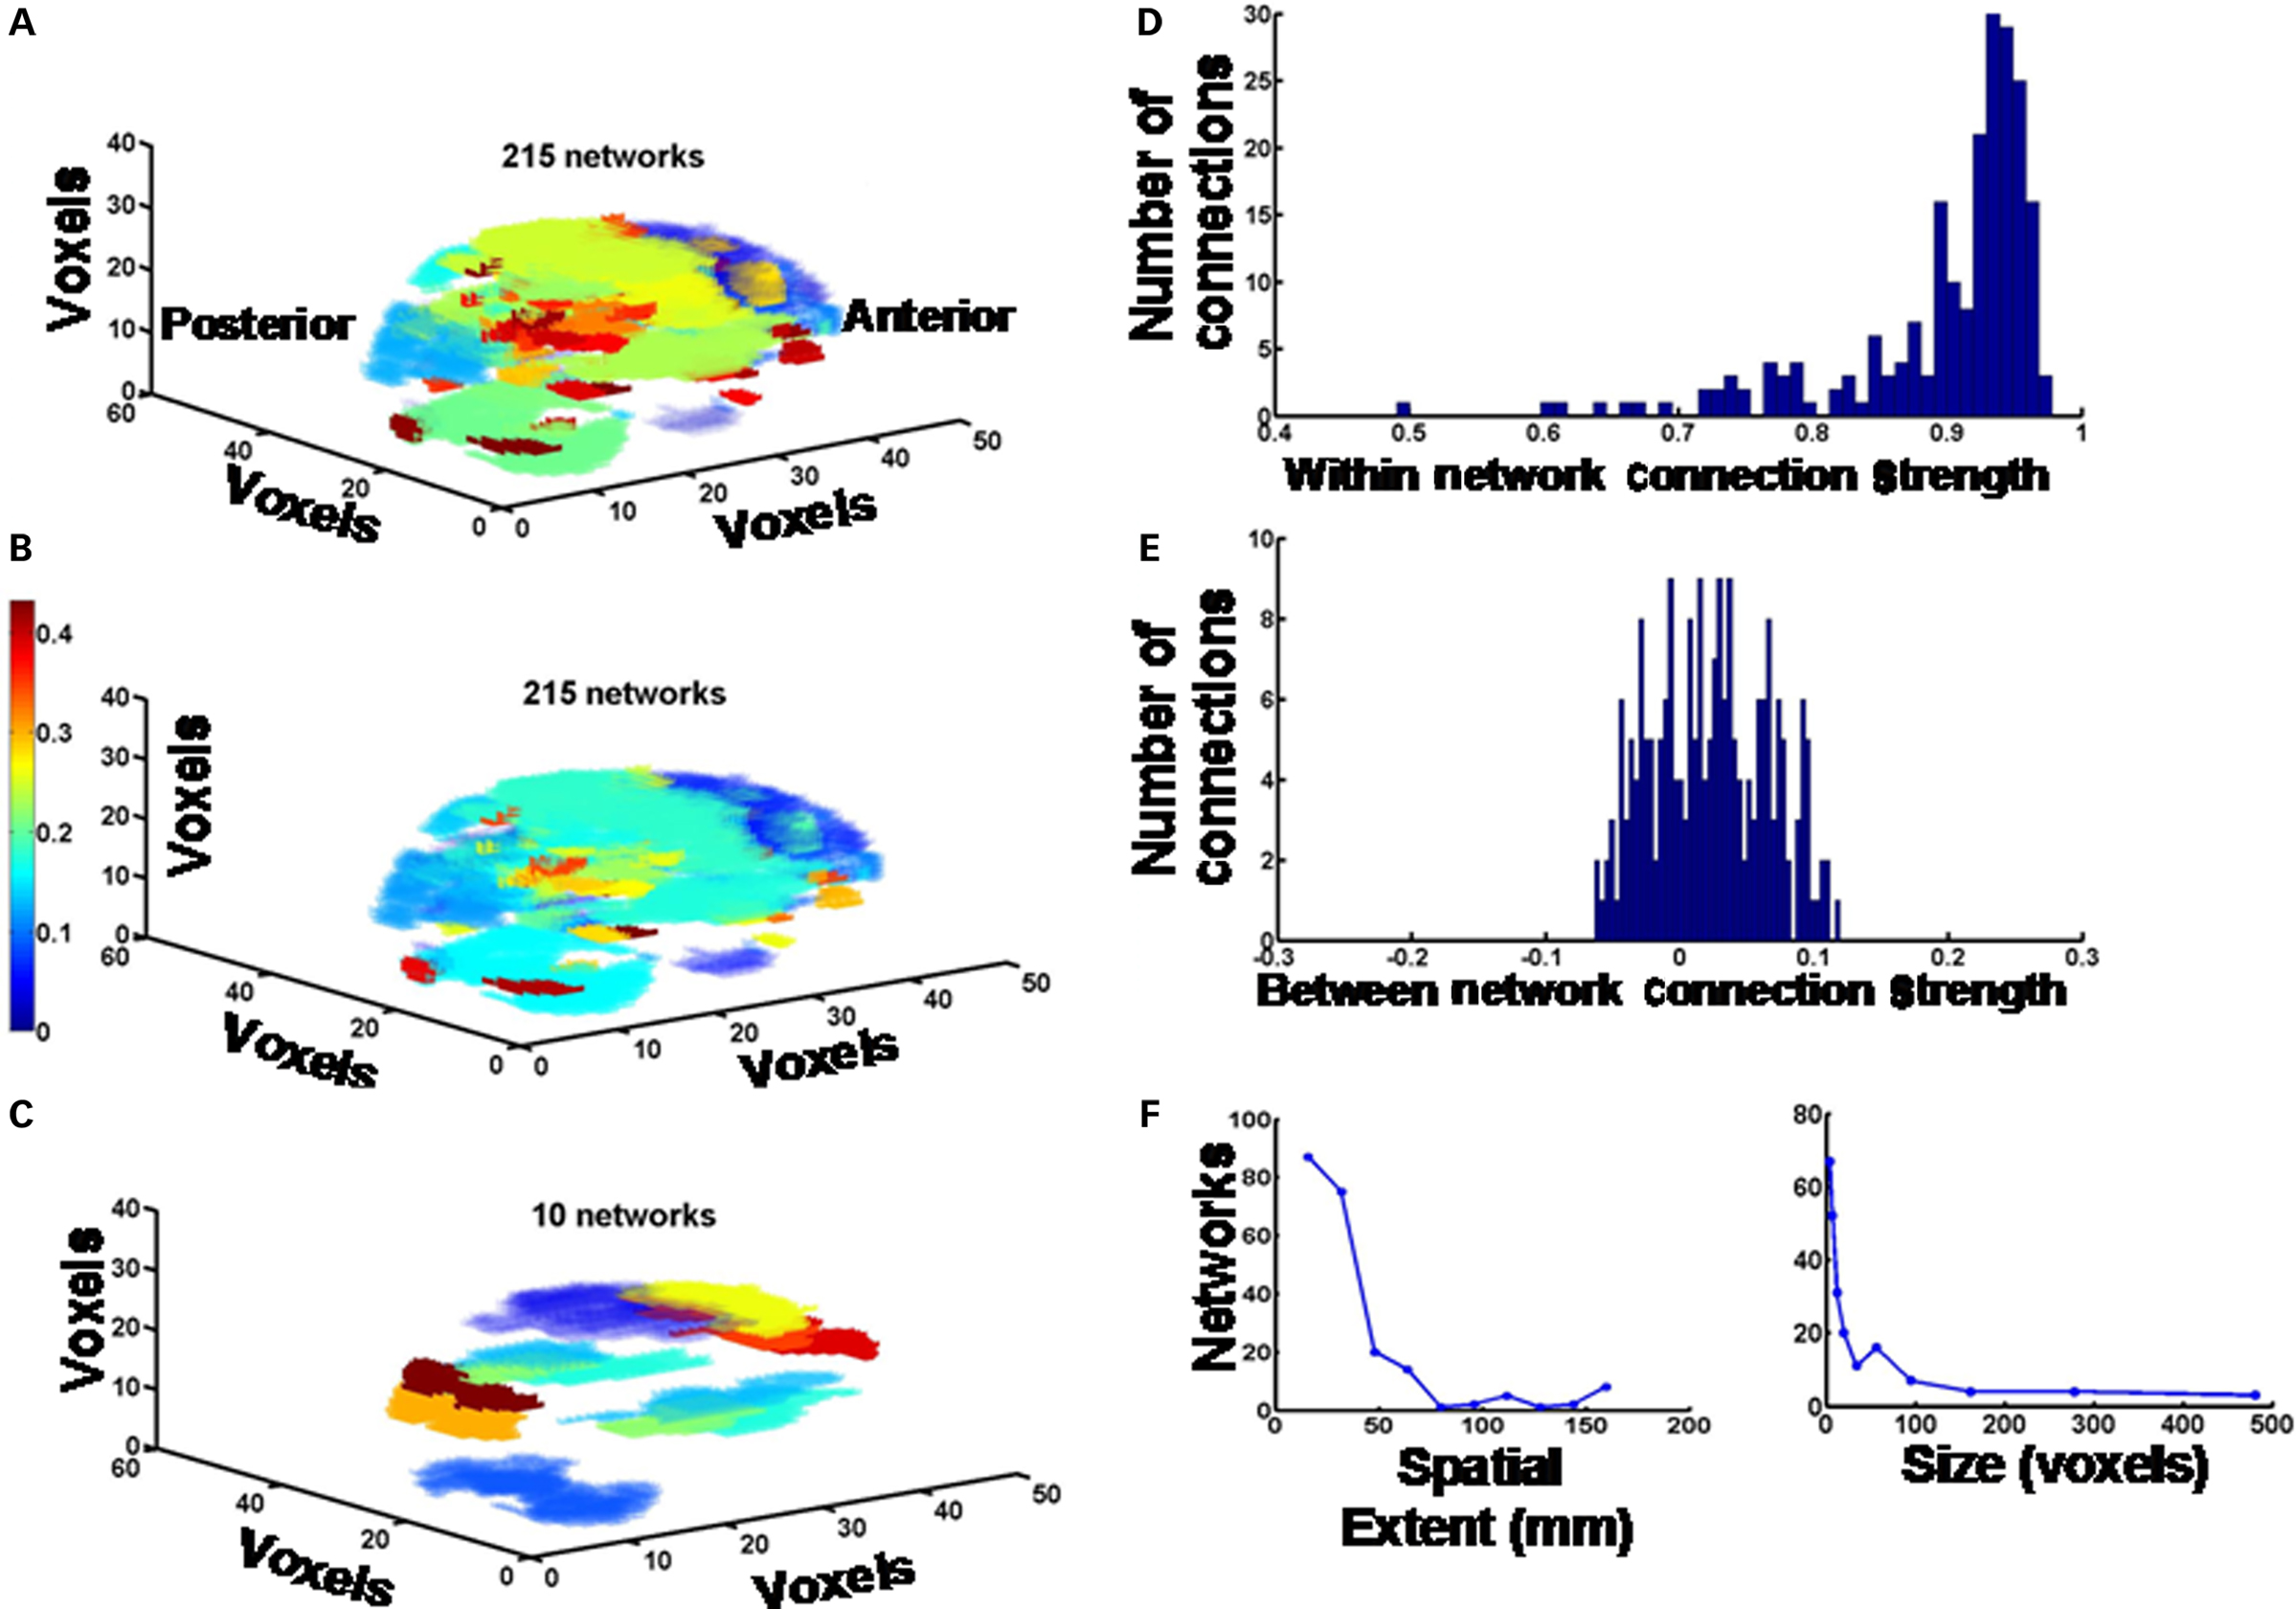
Figure 1. Global brain functional networks. (A) All 215 functional networks in the entire brain derived from a 10 min fMRI scan during the performance of WCS task in a representative control subject are depicted as a color-coded image. The color coding simply demarcates the distinctions between networks; i.e., each color represents one type of network. (B) The same data as above, except the color coding and color scale represents the strength of the functional connectivity (correlation coefficient) between pairs of voxels. (C) The largest 10 networks are depicted. Color coding is the same as in (A). (D) Histogram showing the distribution of connection strengths (correlation coefficients) between pairs of voxels within each network. (E) Distribution of connection strengths (correlation coefficients) between pairs of voxels across pairs of networks. (F) Spatial extents and sizes (number of voxels per network) of networks are plotted as frequency histograms. Spatial extent of each network is defined as the mean Euclidean distance between locations of pairs of voxels within the network. The values of centroids for the bins in the histograms are given the text, and in the Figure 2 legend.
The modification from earlier studies using cross-correlation analysis and hierarchical clustering consisted of using a more stringent cutoff threshold for determining significant correlation between voxels (different from both voxel Cordes et al., 2002; Karkar et al., 2009) and a computationally simpler distance measure involving less number of steps (similar to Karkar et al., 2009, but different from Cordes et al., 2002). To obtain functional networks from the entire brain (unlike in both studies cited above), and for the sake of computational efficiency, we used a multi-stage procedure involving averaging of the highly correlated voxel time series at each stage (similar to Karkar et al., 2009), and subsequently cross-correlating the averaged time series until the entire brain was covered without constraining the clusters obtained to only spatially contiguous voxels by artificially setting the distances of non-contiguous voxels to infinity, as was done by Karkar et al. (2009). Analyzing functional networks and estimating the representation of the connected areas of the brain in relation to the automated anatomical labeling (AAL) brain template (Tzourio-Mazoyer et al., 2002); MRIcro software – http://www.cabiatl.com/mricro/) also represents a new extension to the methods from the two earlier studies cited.
We implemented the following computations in MATLAB (version 7.4.0, Mathworks, Inc., Natick, MA, USA) for functional network analysis. Time series data were obtained for each thresholded brain voxel for a session of 10 min (300 scans) duration for the WCS task and 5 min 20 s (160 scans) duration for the resting state/Stroop task. Data were low-pass filtered at 0.1 Hz with Butterworth digital filter (of order 2). Correlation coefficients (r) were obtained between filtered time series from all pairs of 500 sequential voxels in vectorized 3D image data. The correlation coefficient r was converted into a simple distance measure, i.e., 1 − r, to perform hierarchical cluster analysis. The partitioning threshold for this analysis was set at a distance measure equal to 0.95. Hierarchical cluster analysis was then performed using the nearest neighbor clustering method (similar to Cordes et al., 2002, but unlike Karkar et al., 2009). The number of clusters in pairs of 500 sequential voxels was calculated for the entire brain. Next, the time series of all voxels in each cluster were averaged, and a hierarchical cluster analysis was performed on the averages with the same partitioning threshold as above. The second level of clustering allows one to reduce the number of clusters of functionally correlated voxels, and to group the old clusters under the new reduced number of clusters. All non-contiguous voxels and clusters containing <3 contiguous voxels were rejected to exclude insignificant chance correlations. The correlation coefficients within and between clusters were calculated as measures of connectivity strengths because the clusters can be regarded essentially as functional networks of brain areas showing correlated activity.
From the above analysis, we were able to plot a 3D representation of the functional brain networks using a color-coding scheme designating distinct networks (Figures 1A,C), or reflecting the functional correlation within and between networks (see Figure 1B). We also measured the intra-network and inter-network connectivity strengths, the mean distance between correlated voxels within a network, as a measure of its spatial extent, and the size of the networks in terms of number of voxels. The latter parameters are plotted as frequency histograms with specified number of bins or specified values of bin centroids (see Figures 1D–F). Using the AAL scheme (Tzourio-Mazoyer et al., 2002); MRIcro software – http://www.cabiatl.com/mricro/), and overlaying the 3D network images generated by the above procedure onto the AAL template, we plotted the percentage of voxels in each anatomical area that forms the nodes of each functional network and the cumulative sum of percentages in all networks. These plots showed significant amount of bilateral symmetry across all subjects. Finally, we plotted the strength of the connections (correlation coefficient) between pairs of voxels as a function of distance between them, regardless of the network to which these voxel pairs belonged. This was done for voxels in each hemisphere separately, and also for voxels across the two hemispheres. All these quantitative parameters were compared between patients and controls to see if the disease process affects them in any significant way. All statistical tests were implemented in MATLAB (version 7.4.0, Mathworks, Inc., Natick, MA, USA). They included one-way analysis of variance (ANOVA) followed by Tukey’s least significant difference multiple comparison test and Student’s unpaired t-test with Benjamini–Hochberg false discovery rate correction, as appropriate.
Results
In Experiment 1 we scanned 21 normal subjects in a Siemens 3T Trio MRI machine to obtain structural and functional brain MRI images during the resting state and during the Stroop task. The response times and error rates in these subjects were comparable to the values reported in the literature (Franzon and Hugdahl, 1987; Mekarski et al., 1996). Figure 2A shows that the number of networks is significantly decreased during the performance of the Stroop task (Task) compared to the resting state (Rest, p = 0.00000548, n = 21, Student’s paired t-test). All subjects show this decrease to varying extents, except one. A frequency histogram of the spatial extents of networks with 10 bin centroids spaced 16 mm apart shows a significant decrease in the number of networks in the two smallest bins during Task compared to Rest (Figure 2B). A similar decrease is seen in the size of the networks plotted as a frequency histogram with 10 voxel bins distributed between centroids of 4, 7, 12, 20, 34, 56, 95, 162, 278, and 481 voxels (Figure 2C). Statistical comparisons were made using one-way ANOVA followed by Tukey’s least significant difference multiple comparison test at 0.05 level of significance. These results validate the utility of our functional network analysis procedure to track global changes in brain function as a consequence of engaging in a cognitive task.
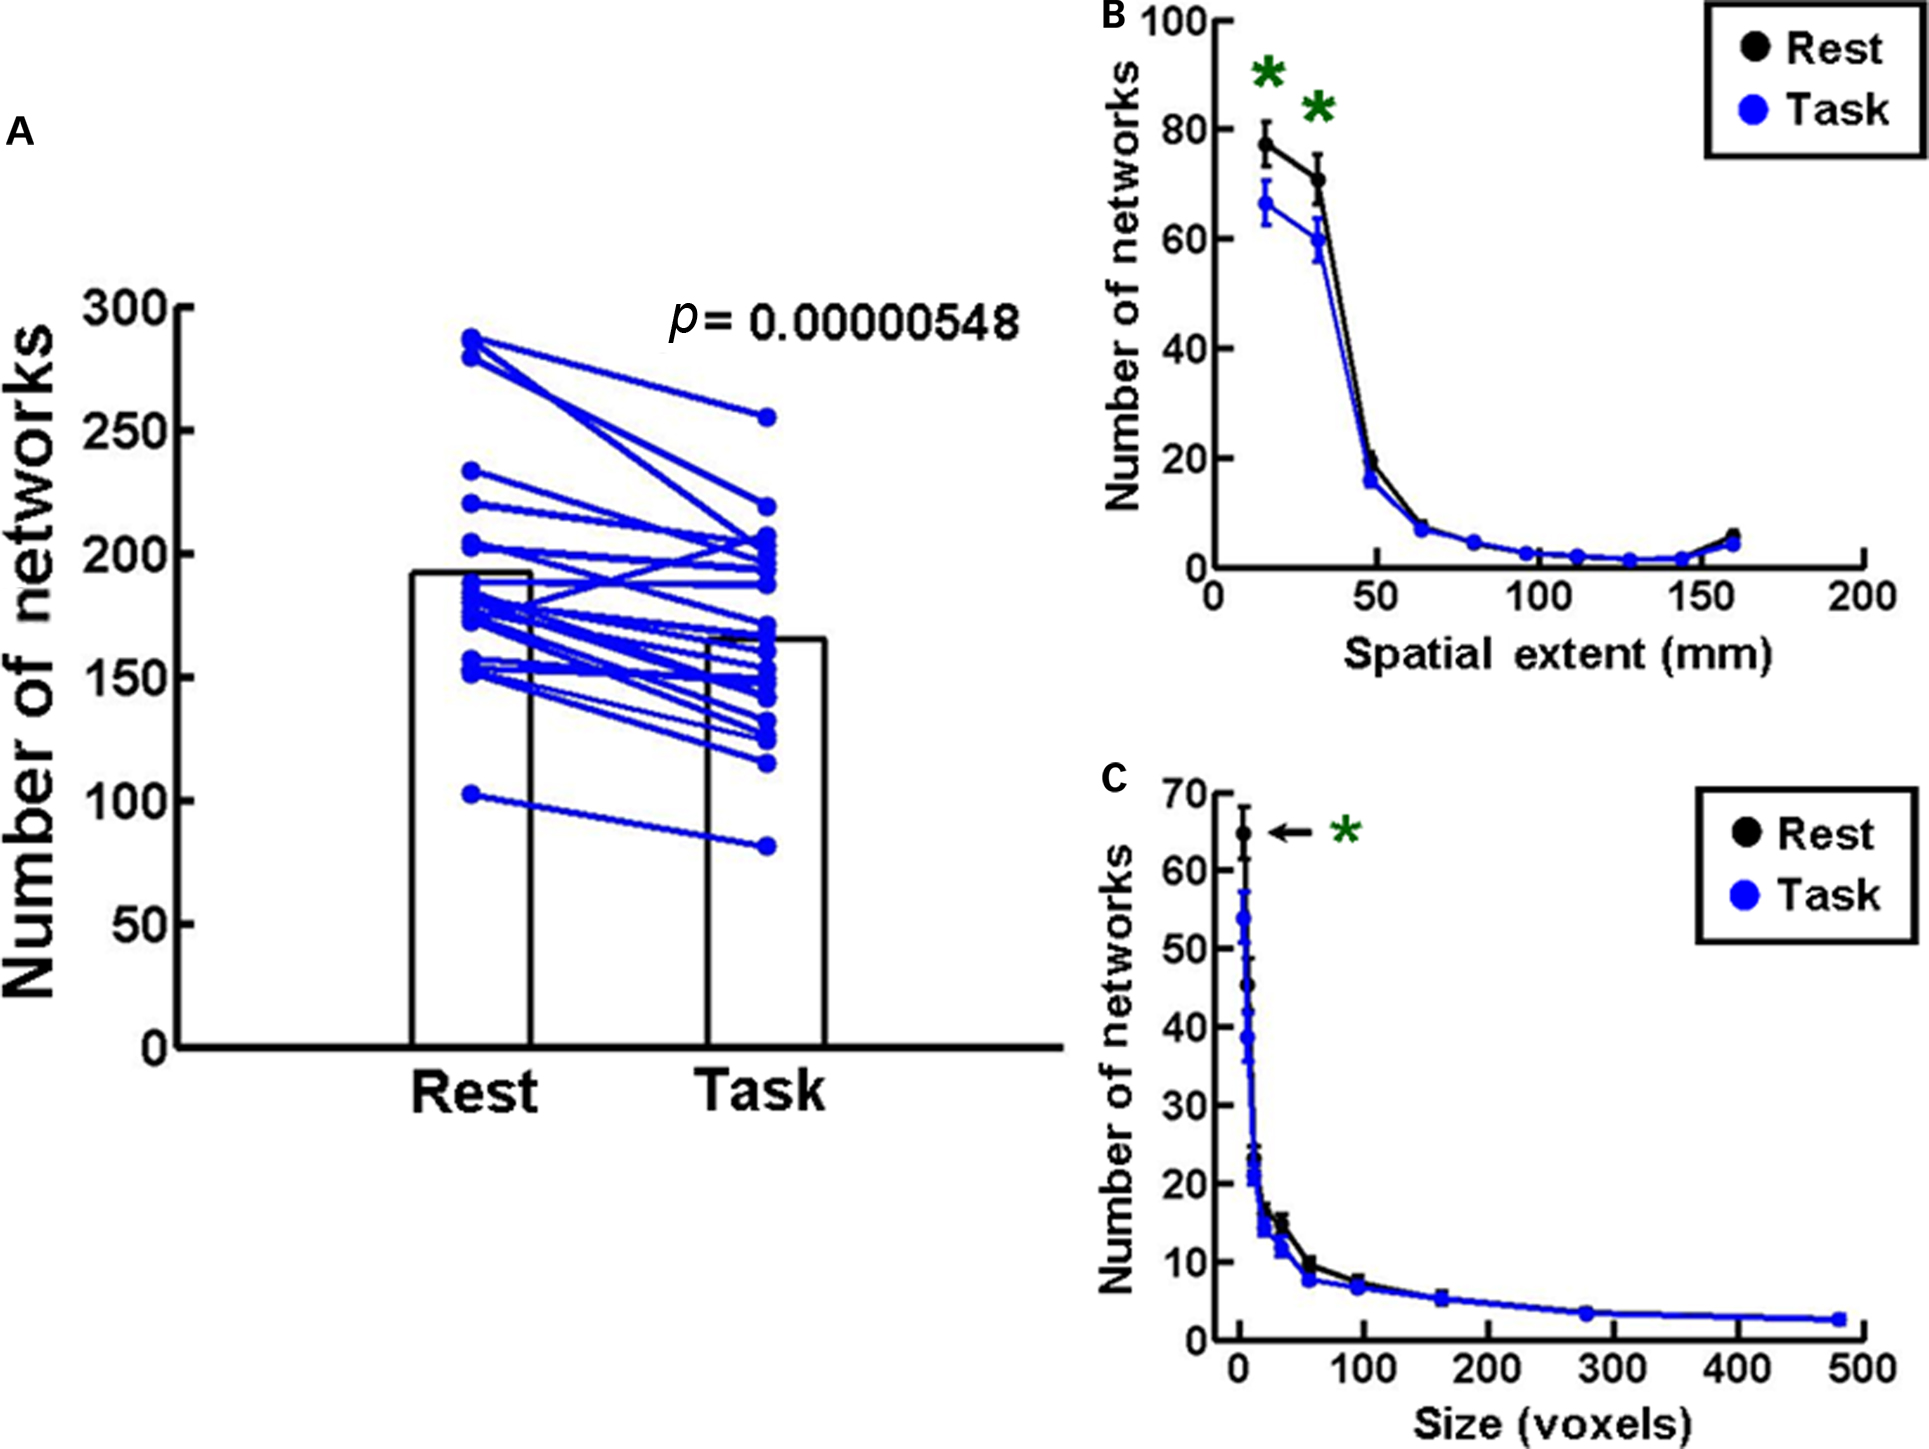
Figure 2. Network changes during Stroop task. (A) A plot of the number of networks during the resting state (Rest) and during the performance of the Stroop task (Task). The bar plots represent means during the two conditions, and lines connect the two values in each subject. There is a decrease in the number of networks during the Task condition in all subjects except one. Student’s paired t-test indicates that the data are statistically significant (p = 0.00000548, n = 21). (B) A frequency histogram of the mean distance in mm between pairs of voxels (spatial extents) in each network. Data plotted in 10 bins with centroids spaced 16 mm apart. A significant decrease in number is seen in the two smallest bins during Task compared to Rest. (C) A frequency histogram of the size of the networks under the two conditions. Data are represented in 10 bins with centroids of 4, 7, 12, 20, 34, 56, 95, 162, 278, and 481 voxels. The number of networks in the smallest network bin is significantly reduced in the Task condition. The error bars in this and all other figures represent standard errors of the mean. Statistical significance in (B,C) was determined by one-way ANOVA and Tukey’s post hoc multiple comparison test at 0.05 level of significance.
In Experiment 2, to measure possible pathophysiological changes in the above functional brain network parameters during a more complex cognitive task in MS we scanned MS patients during the performance of the WCS task. Figure 3 indicates that measures of performance on this task, namely mean response latency and error rate showed no statistically significant difference between MS patients (n = 16) and controls (n = 18). A similar lack of difference between patients and controls was also seen in the Stroop task (Figure S1 in Supplementary Material). These results suggest that the patients were somehow overcoming their structural deficits and functionally compensating to maintain cognitive performance on the tasks.
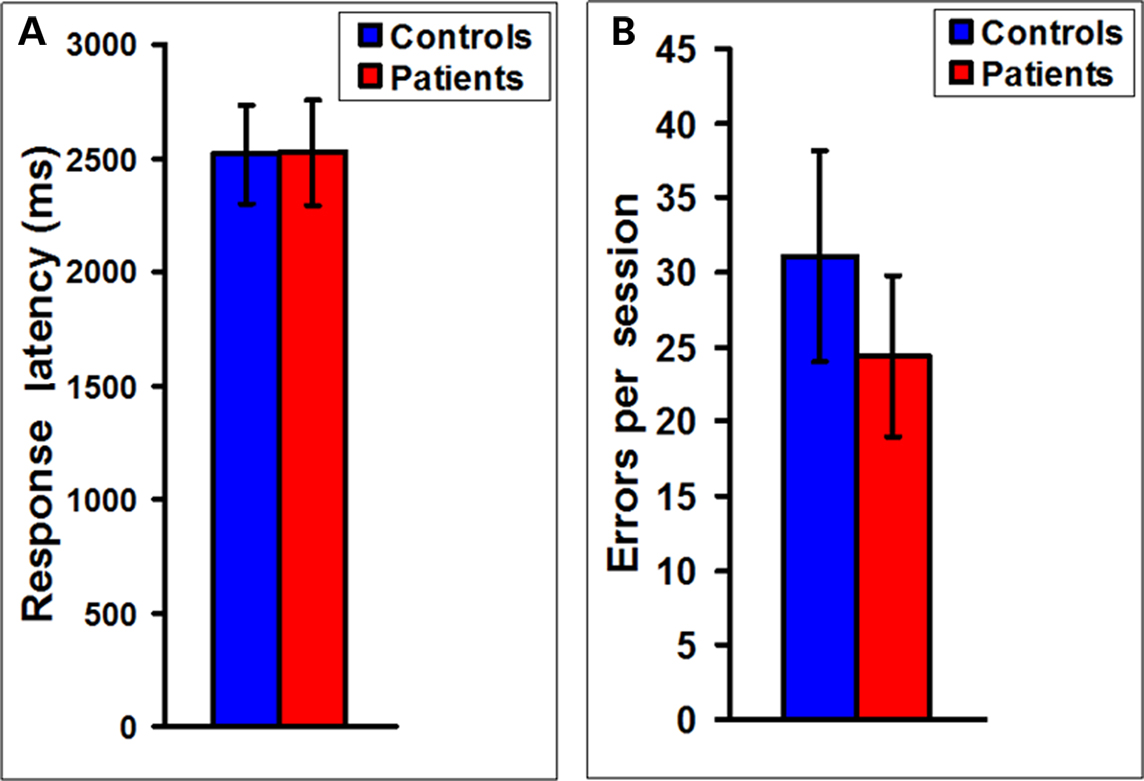
Figure 3. No difference in response latencies and error rates between MS patients and controls. (A) A plot of the mean latency to respond in the WCS task showing no statistically significant difference between MS patients (n = 16) and controls (n = 18). (B) A plot of the errors in each WCS scanning session also shows no statistically significant difference between MS patients (n = 16) and controls (n = 18).
Functional Brain Network Changes
To find out how the changes due to the disease process are reflected in functional organization of the brain we performed a functional network connectivity analysis on the entire brain in our subjects. A bar plot (Figure 4A) of the total number of functionally correlated networks showed a significant 32% decrease (p = 0.041, df = 32, Student’s unpaired t-test) in MS patients (n = 16) compared to controls (n = 18). As far as the functional connectivity between and within networks was concerned, the mean strength of the connections (expressed as the correlation coefficient) between pairs of voxels belonging to two different networks showed no statistically significant difference in patients compared to controls (Figure 4B). The mean strength of the connections between pairs of voxels belonging to the same network also showed no significant change in patients compared to controls (Figure 4C).
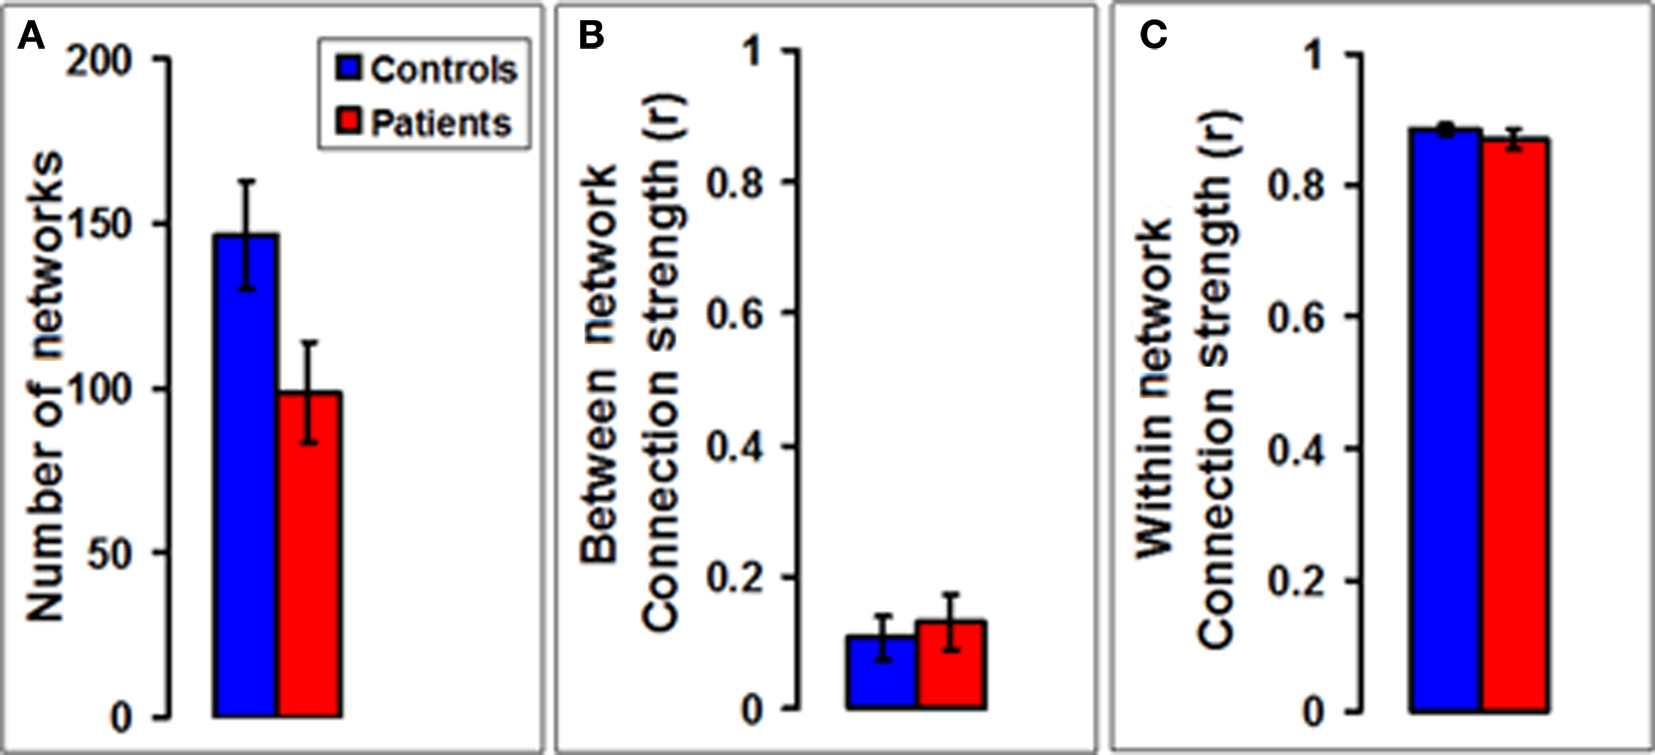
Figure 4. Number and connection strengths of networks in multiple sclerosis. (A) A bar plot of the total number of functionally correlated networks shows a significant decrease in MS patients (n = 16) compared to controls (n = 18). (B) A bar plot of the mean strength of the connections (expressed as the correlation coefficient) between pairs of voxels belonging to two different networks shows no statistically significant difference in patients compared to controls. (C) A bar plot of the mean strength of the connections between pairs of voxels belonging to the same network also shows no statistically significant difference between patients and controls.
Figures 5A,B show frequency histograms of spatial extents and sizes of networks, respectively, plotted in a manner similar to that in Figures 2B,C. Both plots showed a significant decrease in the smallest two and three network bins, respectively (at 0.05 significance level with one-way ANOVA and Tukey’s post hoc test) in MS patients (n = 16) compared to controls (n = 18). There was also a non-significant increase in the number of networks in the largest spatial extent and size bin. These data indicate that the shrinkage in the number of networks in MS patients might be due to a coalescence of smallest networks to form larger networks. No comparable statistically significant changes of this nature were seen in MS patients during the performance of the less demanding Stroop task (Figure S2 in Supplementary Material), suggesting that they are task-dependent and may be a function of task difficulty.
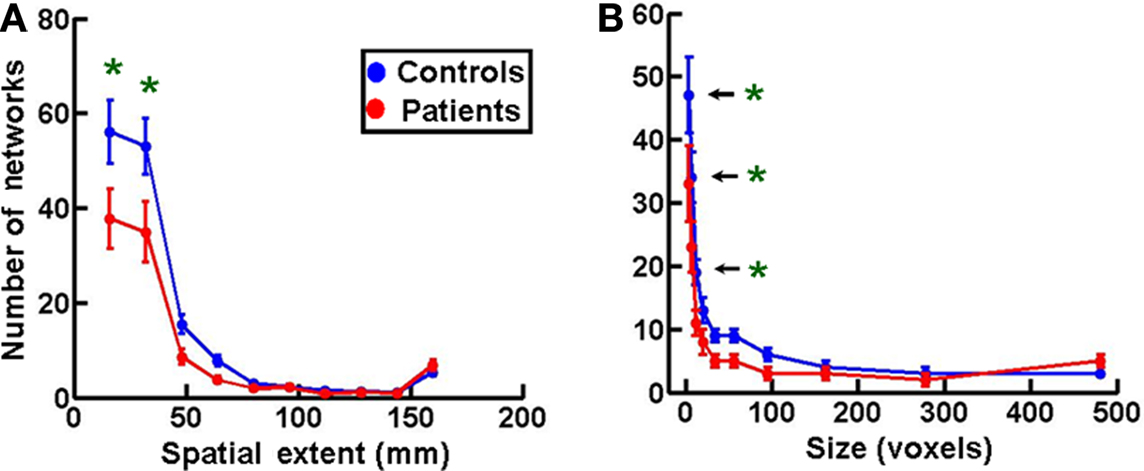
Figure 5. Spatial extent and size of networks in multiple sclerosis. (A) A frequency histogram of the spatial extents of functional networks showing a significant increase in the two smallest network bins in patients (n = 16) compared to controls (n = 18). (B) Sizes of networks are plotted as frequency histograms with 10 bins as in Figure 2C. The MS patients (n = 16) show a significant decrease in the three smallest size bins compared to controls (n = 18). Statistical comparison of data in this figure was done as in Figures 2B,C.
Correlation of Clinical Data with Network Parameters and Task Performance Measures
The clinical records on our patients show wide variations in EDSS scores, disease durations, and ages. Therefore, to find out if these quantitative clinical data, namely the EDSS scores, disease durations, and the ages of the patients influenced the values of the estimated network parameters, we cross-correlated the former data with numbers, sizes and spatial extents of networks. We did not see any significant correlations in this analysis, except between age and the seventh bin (centroid of 95 voxels) of network sizes, and between age and the sixth bin (centroid of 96 mm) of spatial extents of networks (see Figures S2C, S3C, and S4C and Table S1 in Supplementary Material). The implication of these isolated significant values is unclear at present.
Similar correlation analysis of clinical data with WCS task performance measures, namely response latency and errors per session did not show any significant correlations (see Figures S2A,B, S3A,B, and S4A,B in Supplementary Material). The lack of correlation in these data suggests that the functional changes observed may not be related to the clinical course of the disease in a simple way.
Brain Area Composition of Networks
We assessed the brain area composition of the functional networks in all subjects by determining the percentage of voxels of each area being represented as a node in each network. Both the types of brain areas represented in each network and the fraction of each area that is part of the network show a substantial amount of variability in patients as well as controls. However, there is a striking bilateral symmetry in each patient and control, in terms of the brain area composition of each network and magnitude of representation of each area within the networks. This is evident in the average data from all subjects in Figure 6. In Figure 6 we have plotted the mean cumulative sum of the percentages of each brain area represented in all functional networks in patients (n = 15, one outlier disregarded) and in controls (n = 17, one outlier disregarded). Despite the variability, we see a greater than 10% difference in the following brain areas between patients and controls (marked by magenta bars in Figure 6). On the left we see a unilateral decrease in representation in MS patients in precentral gyrus, supplementary motor area, and paracentral lobule. On the same side we see a unilateral increase in representation in the cuneus and the angular gyrus. On the right we observe a unilateral decrease in the frontal inferior operculum, Rolandic operculum, and Heschl’s gyrus. There is a bilateral decrease in representation in patients compared to controls in postcentral gyrus, and segments 7b, 8, and 9 of the cerebellum. Bilateral increases are seen in hippocampus, amygdala, thalamus, calcarine cortex, lingual gyrus, superior and middle occipital gyri, middle temporal gyrus, and segment 3 of the cerebellum. In the midline the cerebellar vermis shows a decrease in segment 7 and an increase in segments 1 through 5.
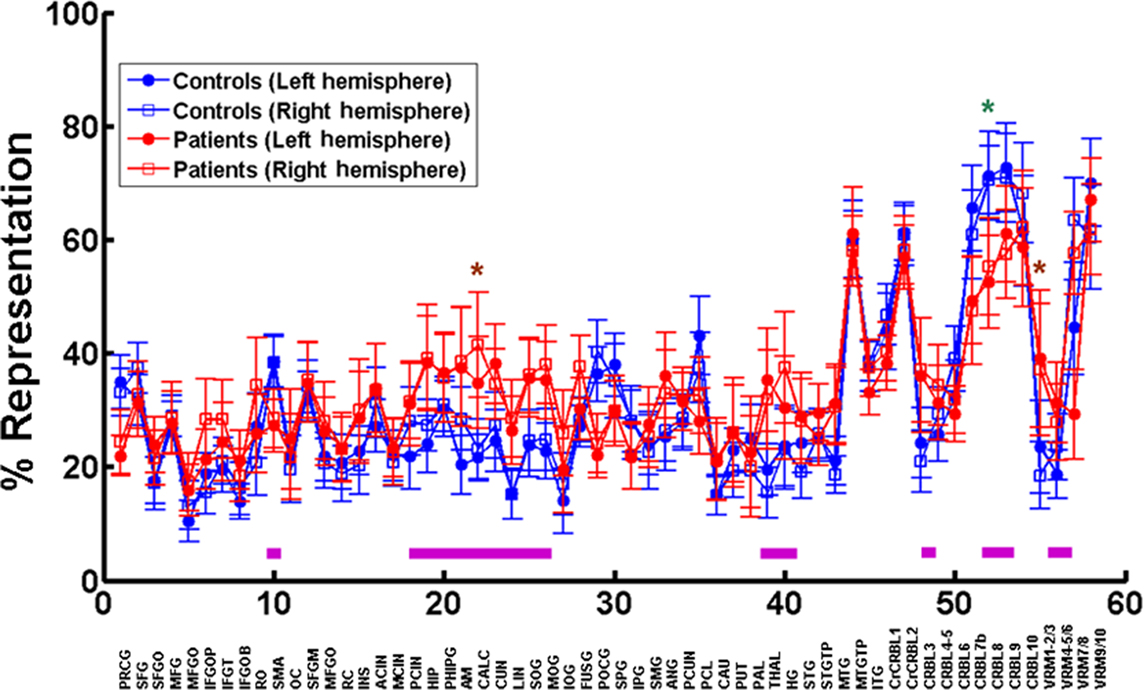
Figure 6. Representation of brain areas in functional brain networks. The top graph is a plot of the mean percentage of voxels in each brain area (closed circles – left side, and open squares – right side) participating in all networks in patients (red, n = 15, one outlier excluded) and controls (blue, n = 17, one outlier excluded). The 58 left/right brain areas in the automated anatomical template (Tzourio-Mazoyer et al., 2002) (see reference for area label legend) from the MRIcro software are depicted on the x axis. The green asterisk (left side) and brown asterisks (right side) mark statistically significant differences between patients and controls. The magenta line bars at the bottom depict areas with mean representations that show greater than 10% difference between patients and controls.
All these changes, except in calcarine cortex on the right, segment 8 of the cerebellum on the left and segment 3 of the vermis, however, are not significant using one-way ANOVA followed by the Tukey’s multiple comparison test.
Connection Strength as a Function of Distance
Since the pathological process in MS involves disconnection of pathways due to demyelination, as well as regeneration of new connections, we would expect to see significant changes in the strength of the functional connections between distant loci in the brain. Indeed, it is likely that the strength might decrease or increase as a function of distance. We tested this possibility by measuring the correlation coefficients between the time series of pairs of voxels in a sample of 2275 voxels dispersed at pseudorandomly chosen locations throughout each hemisphere of the brain separately, and across both hemispheres. Figures 7A–C show plots of these values as a function of the Euclidean distance between the brain loci in the right hemisphere, left hemisphere, and across hemispheres, respectively. On the right side, there is a significant increase in this measure of functional connection strength at 38 mm and 18 consecutive intermediate distance locations from 40 through 57 mm in patients compared to controls. The mean percent increase at these locations is 128.9 ± 48.7%. Statistical significance of these data points was ascertained by Benjamini–Hochberg false discovery rate correction for multiple comparisons (Benjamini and Hochberg, 1995). The significant p-values are denoted by magenta asterisks in Figure 7A. The increase rather than decrease in connection strength suggests that these measurable changes in connectivity might be a neuroplastic consequence of the disease process in MS. The fact that this increase may also be dependent on task difficulty is evident from a lack of significant change in MS patients during the performance of the less demanding Stroop task (data not shown). While similar increase was seen on the left side in the WCS task, it was not statistically significant (Figure 7B). No significant difference was present as far as interhemispheric connections were concerned (Figure 7C).
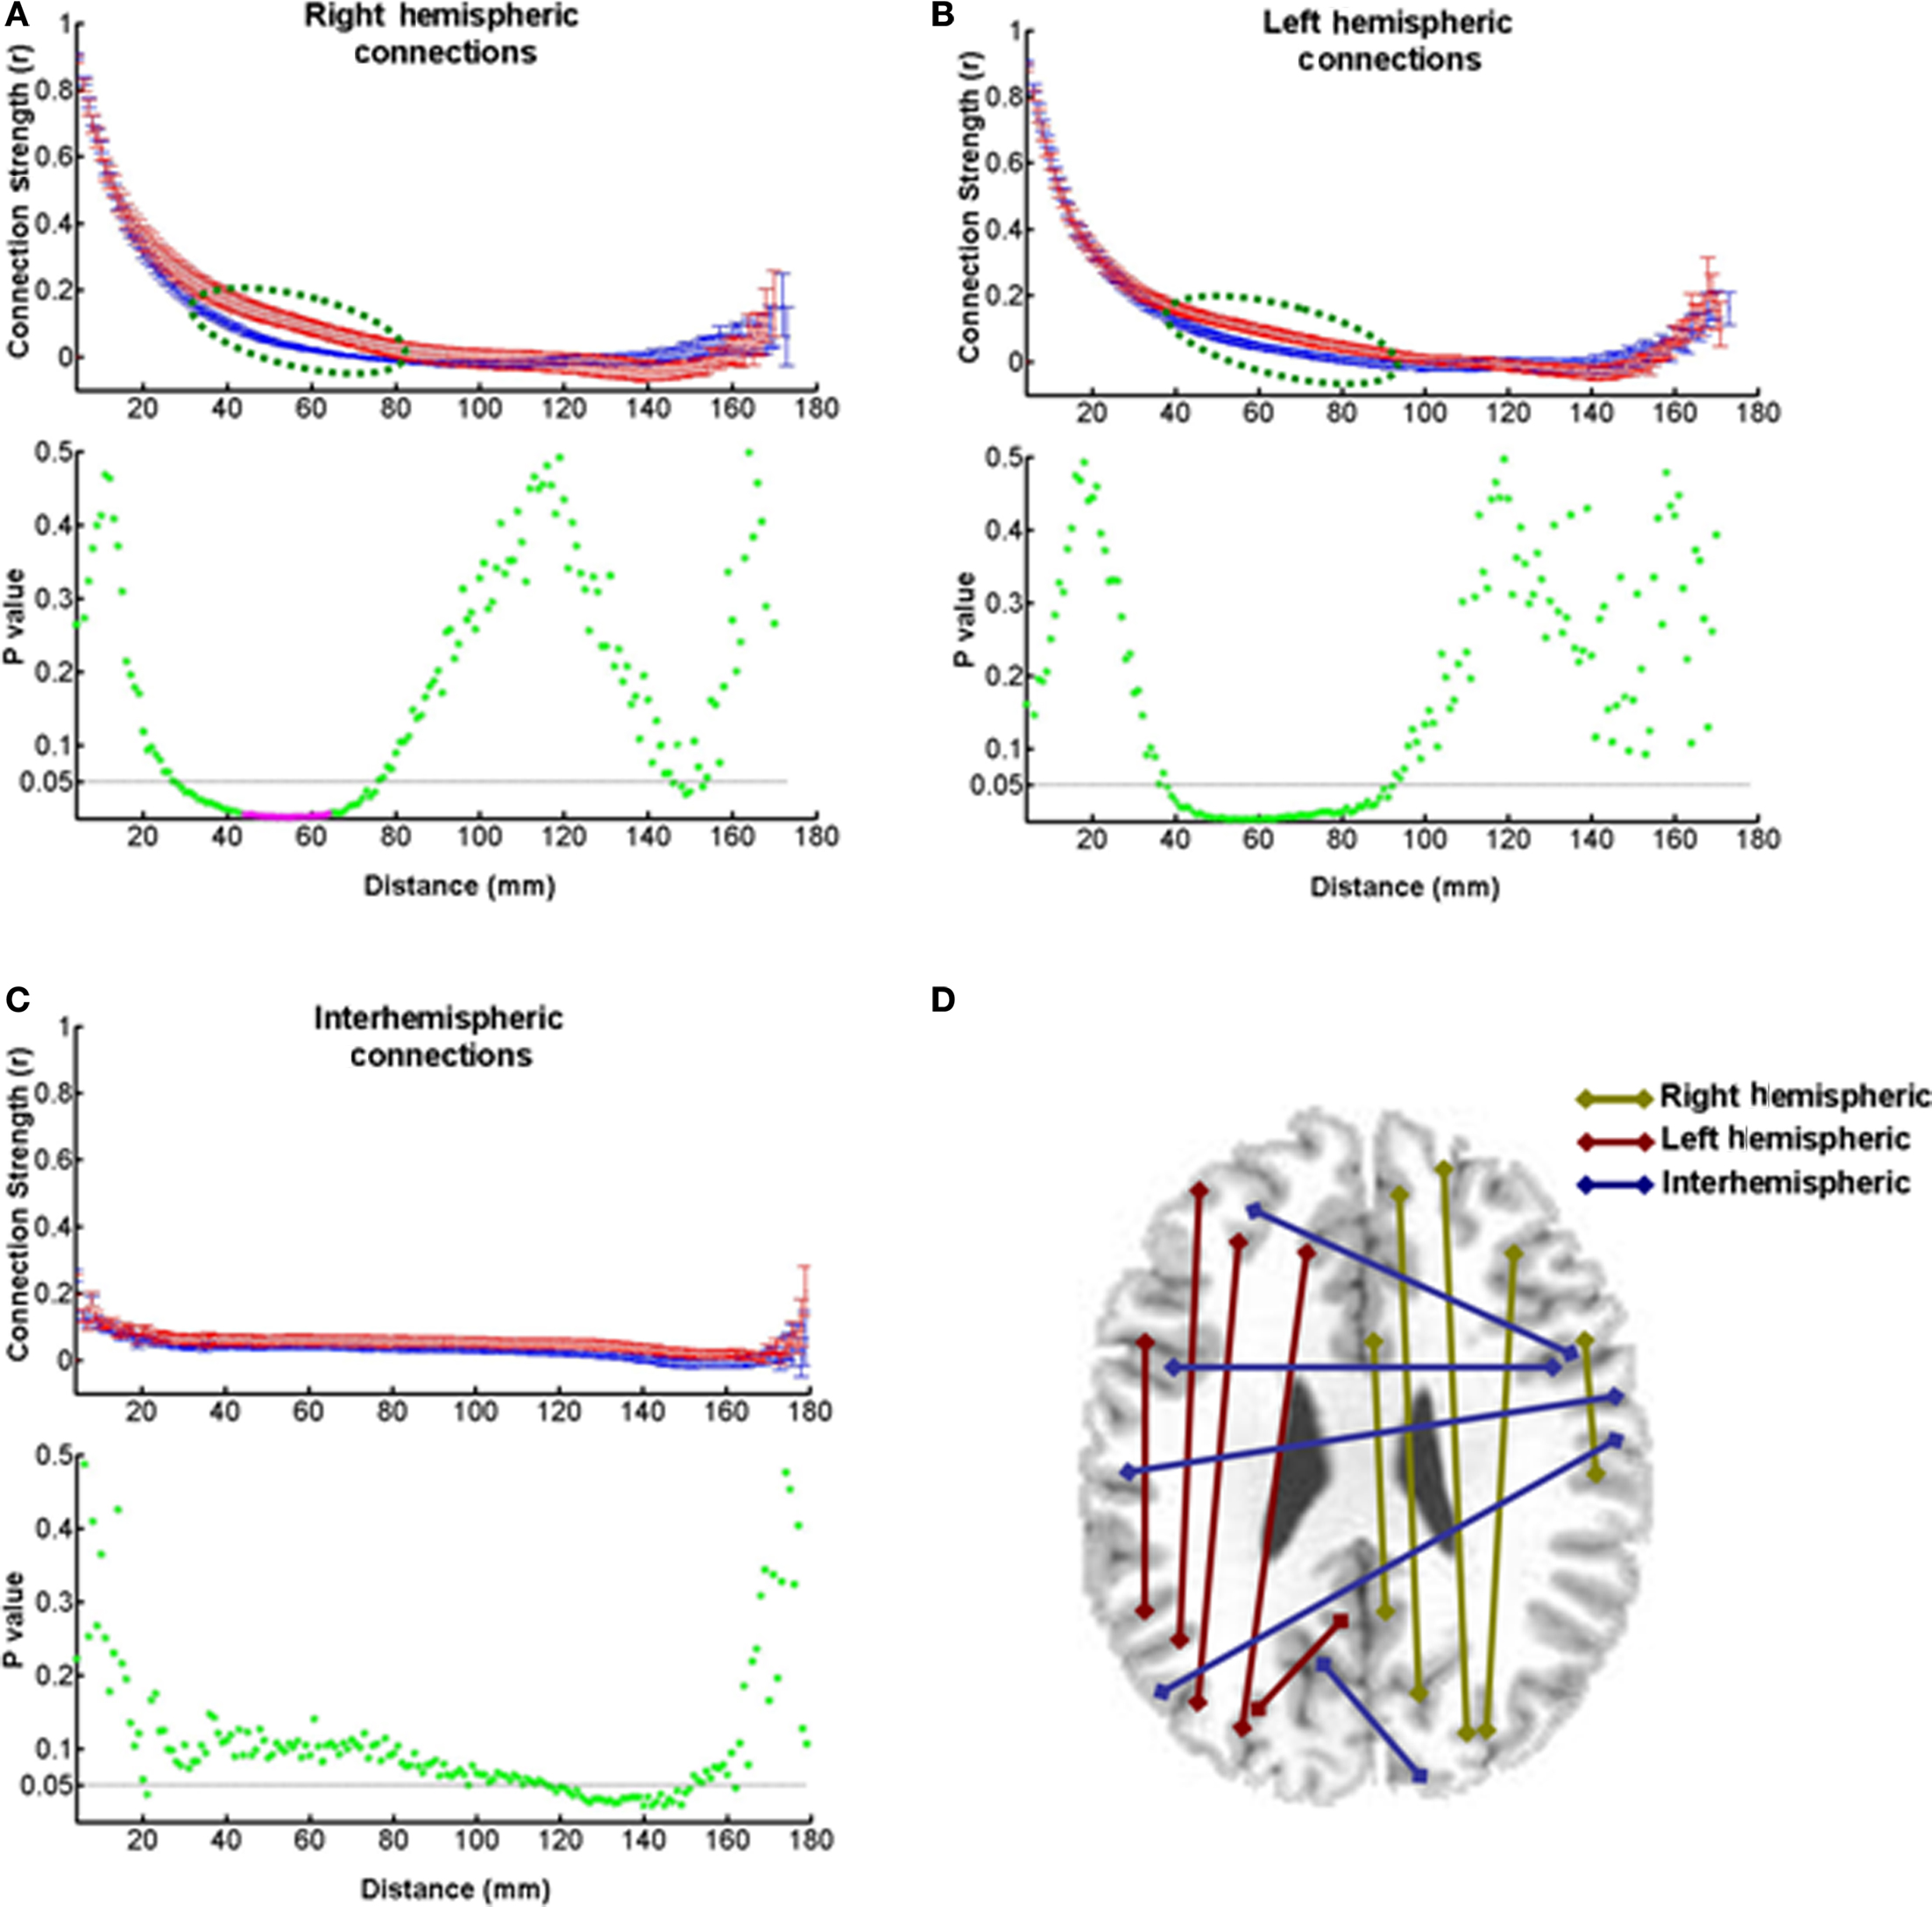
Figure 7. Strength of functional connections at different distances. The connectivity strengths expressed as correlation coefficients between pairs of voxel time series are plotted as a function of distance between the pairs. (A) A strength-distance plot of pairs of voxels in the right hemisphere shows larger strengths at intermediate-scale distances in patients than in controls (dashed green line ellipse). The p-value plot at the bottom shows that 19 of these data points (magenta asterisks) are statistically significant as indicated by the Benjamini–Hochberg false discovery rate method for multiple comparisons. The dashed horizontal line marks the p-value of 0.05. (B) A strength-distance plot of data from the left side of the brain shows differences similar to those on the right side, but they are not statistically significant (see p-value plot at the bottom). (C) The connections between pairs of voxels across the two hemisphere do not show a significant difference in strength at any distance (see p-value plot at the bottom). (D) A diagram showing the connections between voxel pairs in and between the two hemispheres.
Discussion
In the initial validation experiment (Experiment 1) of this study, we find that a global functional brain network analysis procedure involving voxel-by-voxel cross-correlation and hierarchical cluster analysis reflects functional network changes underlying the performance of a cognitive task such as the Stroop task. The changes are characterized by a reduction in the total number of networks during the task compared to the resting state. This reduction is due to elimination of smaller networks, presumably by a process of fusion to form larger networks recruited for the purpose of performing the cognitive task at hand.
In Experiment 2, when the above analysis is conducted in patients with MS with no overt deficit in the performance of WCS task we see similar but more pronounced alterations in them compared to matched controls. There is a significant decrease in the number of functional brain networks in MS patients compared to controls with fewer networks of the smallest sizes and spatial extents. In addition, the magnitude of representation of several brain areas appears to be differentially increased or decreased, both unilaterally on each side and bilaterally. The strength of functional ipsilateral connections is also higher in MS patients at sites located at intermediate distances within the brain, especially in the right hemisphere.
These findings are consistent with previous observations of alterations in the functional connectivity of specific networks. Prior functional connectivity studies have shown that essentially three specific brain networks are affected in MS patients. They are the working memory (Au Duong et al., 2005), primary sensorimotor (Lowe et al., 2008; Rocca et al., 2009), and cerebellar (Saini et al., 2004) networks. These findings have led to the proposal of the hypothesis that the cognitive deficits in early stage MS might be due to disruption of large-scale functional cortical networks (Audoin et al., 2006). In the working memory network, reduced functional connectivity has been detected in a paced auditory serial addition test in patients with early stage MS. The connections affected are those between left Brodmann Area (BA) 45/46 and left BA 9, right BA 3 and the anterior cingulate cortex. Because the connectivity change correlated with magnetization transfer ratio of normal white matter and brain T2 lesion load it was hypothesized that the deficits are a reflection or consequence of diffuse primary white matter lesions (Au Duong et al., 2005). BAs 45/46, 9, and 3 referred to above correspond to portions of the middle, inferior and superior frontal gyri, pre- and postcentral gyri, and supplementary motor area. Remarkably, our data show altered representation of bilateral postcentral gyrus, left precentral gyrus, left supplementary motor area, right frontal inferior operculum, and right Rolandic operculum. The involvement of the precentral gyrus in the functional deficit is also supported by a sensorimotor task-dependent study of Lowe et al. (2002). They observed a reduction in connectivity between the left and right precentral gyri, and a reduced representation of the right precentral gyrus in the motor cortical network engaged during a bilateral finger-tapping task in MS patients. Altered connectivity in the frontal cortex, especially between the left and the right hemispheres has been confirmed by others in a separate working memory task, the n-back task (Cader et al., 2006). A structural network analysis based on the measurement of cortical thickness, coupled with a small-world network efficiency computation has also corroborated the reduced efficiency of connections in the precentral gyri and regions of the prefrontal cortex (He et al., 2009). A change in the effective connectivity of the supplementary motor areas and primary sensorimotor cortex with premotor cortex has been detected by another independent method, namely dynamic causal modeling, and the coefficient of this change has been correlated with damage to the left corticospinal tract measured by diffusion tensor tractography (Rocca et al., 2009).
As far as the cerebellar network is concerned, Saini et al. (2004) have shown that there is a significant reorganization of functional connections between the primary motor cortex and the dentate nucleus, as well as crus I of the cerebellum. MS patients showed a decrease in connectivity between the left primary motor cortex and right dentate nucleus compared to controls. There was also significant connectivity between the left motor cortex and crus I of the ipsilateral cerebellar cortex in MS patients. No such connectivity was found in the control subjects. Rocca et al. (2009) have also observed a reduction in effective connectivity between the left sensorimotor cortex and right cerebellum. The present data (see Figure 6) show significant alterations in the network representation of the cerebellum.
The earlier papers using connectivity analysis in MS patients used the seed region approach wherein they measured connectivity by correlation analysis of particular seed regions with all other regions. These approaches naturally focus on connectivity differences with select regions. Our approach analyzes the connectivity between all regions of the brain in an unbiased manner. Limitations of cross-correlation analysis and averaging of BOLD activity time series are common to the earlier connectivity studies and ours. One other caveat of our approach is that the actual values obtained depend on the cut off threshold value that we have selected to parcellate voxels into separate brain networks. As far as functional connection strength as a function of distance is concerned, no other earlier study has estimated it in MS patients. The limitation of this procedure is that we are using simple Euclidean geometric distances between brain loci. The actual length of the connections between these loci might be longer, and might vary for similar distances depending on the course that the nerve fibers take in each case.
The network alterations observed in this study might reflect changes due to primary white matter lesions. Prior studies have found correlation between the degree of white matter deficit as measured by magnetization transfer ratio imaging or cortical thickness measurements and the amount of alteration in functional or structural connectivity (Au Duong et al., 2005; He et al., 2009). Alternatively, our data might point to compensatory neuroplastic changes. This is supported by the fact that we see an enhancement in the connection strength between brain loci separated by intermediate-scale distances (see Figure 7). Such increases in connectivity have been reported in other studies, and in each case the increase has been interpreted to suggest a neuroplastic reorganization of functional networks to overcome the disruption due to the primary white matter lesions and neuronal loss, in order to maintain cognitive function (Audoin et al., 2006; Cader et al., 2006; Rocca et al., 2009). Compensatory cortical reorganization was considered as a possibility because of poor correlation between structural deficits and CI (Ranjeva et al., 2005). There is also a lack of correlation between the clinical picture and alteration in functional connectivity (Lowe et al., 2002; Au Duong et al., 2005). Several groups have provided independent fMRI evidence for neuroplastic reorganization as an adaptive response to widespread tissue damage in MS (Staffen et al., 2002; Parry et al., 2003; Mainero et al., 2004; Wishart et al., 2004; Pelletier et al., 2009).
We want to caution that our inference that the observed functional changes are compensatory is speculative in nature. To summarize, it is based on the following three considerations:
1. We see an increase in connection strength in MS patients, as opposed to a decrease, which would be anticipated if the functional change was due to the primary white matter deficits. Increased connectivity on the other hand would be seen if there was a neuroplastic growth of new fibers and/or a recruitment of pre-existing functionally silent connections.
2. The patients do not show any decrease in performance on the cognitive task compared to normal controls. This indicates that the former are overcoming their primary structural deficits to maintain the normal brain function, or using alternative strategies, necessary to accomplish these tasks.
3. Our observations are consistent with earlier studies offering evidence in support of compensatory mechanisms triggered to overcome the primary deficits in MS.
Thus the possibility that the changes in connectivity and functional brain networks that we have uncovered in the present study are indeed due to compensatory adaptive reorganization of functional cortical networks needs to be investigated and confirmed by future research involving other techniques such as diffusion tensor imaging and magnetization transfer imaging. Future studies in MS patients should also look at correlations between white matter lesions and the observed functional network changes.
Conflict of Interest Statement
The authors declare that the research was conducted in the absence of any commercial or financial relationships that could be construed as a potential conflict of interest.
Acknowledgments
This work was supported in part by NIDA Grant DA11723 and NINDS Grant NS045790 awarded to P. Read Montague.
References
Ashburner, J., and Friston, K. J. (1999). Nonlinear spatial normalization using basis functions. Hum. Brain Mapp. 7, 254–266.
Au Duong, M. V., Audoin, B., Boulanouar, K., Ibarrola, D., Malikova, I., Confort-Gouny, S., Celsis, P., Pelletier, J., Cozzone, P. J., and Ranjeva, J. P. (2005). Altered functional connectivity related to white matter changes inside the working memory network at the very early stage of MS. J. Cereb. Blood Flow Metab. 25, 1245–1253.
Audoin, B., Au Duong, M. V., Malikova, I., Confort-Gouny, S., Ibarrola, D., Cozzone, P. J., Pelletier, J., and Ranjeva, J. P. (2006). Functional magnetic resonance imaging and cognition at the very early stage of MS. J. Neurol. Sci. 245, 87–91.
Bagert, B., Camplair, P., and Bourdette, D. (2002). Cognitive dysfunction in multiple sclerosis: natural history, pathophysiology and management. CNS Drugs 16, 445–455.
Benjamini, Y., and Hochberg, Y. (1995). Controlling the false discovery rate – a practical and powerful approach to multiple testing. J. R. Stat. Soc. Series B Methodol. 57, 289–300.
Berg, E. A. (1948). A simple objective technique for measuring flexibility in thinking. J. Gen. Psychol. 39, 15–22.
Cader, S., Cifelli, A., Abu-Omar, Y., Palace, J., and Matthews, P. M. (2006). Reduced brain functional reserve and altered functional connectivity in patients with multiple sclerosis. Brain 129, 527–537.
Cordes, D., Haughton, V., Carew, J. D., Arfanakis, K., and Maravilla, K. (2002). Hierarchical clustering to measure connectivity in fMRI resting-state data. Magn. Reson. Imaging 20, 305–317.
Forn, C., Barros-Loscertales, A., Escudero, J., Belloch, V., Campos, S., Parcet, M. A., and Avila, C. (2006). Cortical reorganization during PASAT task in MS patients with preserved working memory functions. Neuroimage 31, 686–691.
Forn, C., Barros-Loscertales, A., Escudero, J., Benlloch, V., Campos, S., Antonia Parcet, M., and Avila, C. (2007). Compensatory activations in patients with multiple sclerosis during preserved performance on the auditory N-back task. Hum. Brain Mapp. 28, 424–430.
Franzon, M., and Hugdahl, K. (1987). Effects of speed vs. accuracy in vocal reaction time to visual half-field presentations of incongruent (Stroop) color-words. Cortex 23, 615–629.
He, Y., Dagher, A., Chen, Z., Charil, A., Zijdenbos, A., Worsley, K., and Evans, A. (2009). Impaired small-world efficiency in structural cortical networks in multiple sclerosis associated with white matter lesion load. Brain 132, 3366–3379.
Karkar, S., Faisan, S., Thoraval, L., and Foucher, J. R. (2009). A multi-level parcellation approach for brain functional connectivity analysis. Conf. Proc. IEEE Eng. Med. Biol. Soc. 1, 3497–3500.
Kwong, K. K. (1995). Functional magnetic resonance imaging with echo planar imaging. Magn. Reson. Q. 11, 1–20.
Lezak, M. D., Howieson, D. B., and Loring, D. W. (2004). Neuropsychological Assessment. New York: Oxford University Press.
Lowe, M. J., Beall, E. B., Sakaie, K. E., Koenig, K. A., Stone, L., Marrie, R. A., and Phillips, M. D. (2008). Resting state sensorimotor functional connectivity in multiple sclerosis inversely correlates with transcallosal motor pathway transverse diffusivity. Hum. Brain Mapp. 29, 818–827.
Lowe, M. J., Phillips, M. D., Lurito, J. T., Mattson, D., Dzemidzic, M., and Mathews, V. P. (2002). Multiple sclerosis: low-frequency temporal blood oxygen level-dependent fluctuations indicate reduced functional connectivity initial results. Radiology 224, 184–192.
Mainero, C., Caramia, F., Pozzilli, C., Pisani, A., Pestalozza, I., Borriello, G., Bozzao, L., and Pantano, P. (2004). fMRI evidence of brain reorganization during attention and memory tasks in multiple sclerosis. Neuroimage 21, 858–867.
Mekarski, J. E., Cutmore, T. R., and Suboski, W. (1996). Gender differences during processing of the Stroop task. Percept. Mot. Skills 83, 563–568.
Nocentini, U., Pasqualetti, P., Bonavita, S., Buccafusca, M., De Caro, M. F., Farina, D., Girlanda, P., Le Pira, F., Lugaresi, A., Quattrone, A., Reggio, A., Salemi, G., Savettieri, G., Tedeschi, G., Trojano, M., Valentino, P., and Caltagirone, C. (2006). Cognitive dysfunction in patients with relapsing-remitting multiple sclerosis. Mult. Scler. 12, 77–87.
Pantano, P., Mainero, C., and Caramia, F. (2006). Functional brain reorganization in multiple sclerosis: evidence from fMRI studies. J. Neuroimaging 16, 104–114.
Parry, A. M., Scott, R. B., Palace, J., Smith, S., and Matthews, P. M. (2003). Potentially adaptive functional changes in cognitive processing for patients with multiple sclerosis and their acute modulation by rivastigmine. Brain 126, 2750–2760.
Patti, F., Amato, M., Trojano, M., Bastianello, S., Tola, M., Goretti, B., Caniatti, L., Di Monte, E., Ferrazza, P., Brescia Morra, V., Lo Fermo, S., Picconi, O., and Luccichenti, G. (2009). Cognitive impairment and its relation with disease measures in mildly disabled patients with relapsing-remitting multiple sclerosis: baseline results from the Cognitive Impairment in Multiple Sclerosis (COGIMUS) study. Mult. Scler. 15, 779–788.
Pelletier, J., Audoin, B., Reuter, F., and Ranjeva, J. (2009). Plasticity in MS: from functional imaging to rehabilitation. Int. MS J. 16, 26–31.
Ranjeva, J. P., Audoin, B., Au Duong, M. V., Ibarrola, D., Confort-Gouny, S., Malikova, I., Soulier, E., Viout, P., Ali-Cherif, A., Pelletier, J., and Cozzone, P. (2005). Local tissue damage assessed with statistical mapping analysis of brain magnetization transfer ratio: relationship with functional status of patients in the earliest stage of multiple sclerosis. AJNR Am. J. Neuroradiol. 26, 119–127.
Rocca, M. A., Absinta, M., Valsasina, P., Ciccarelli, O., Marino, S., Rovira, A., Gass, A., Wegner, C., Enzinger, C., Korteweg, T., Sormani, M. P., Mancini, L., Thompson, A. J., De Stefano, N., Montalban, X., Hirsch, J., Kappos, L., Ropele, S., Palace, J., Barkhof, F., Matthews, P. M., and Filippi, M. (2009). Abnormal connectivity of the sensorimotor network in patients with MS: a multicenter fMRI study. Hum. Brain Mapp. 30, 2412–2425.
Rocca, M. A., and Filippi, M. (2006). Functional MRI to study brain plasticity in clinical neurology. Neurol. Sci. 27(Suppl. 1), S24–S26.
Rocca, M. A., and Filippi, M. (2007). Functional MRI in multiple sclerosis. J. Neuroimaging 17(Suppl. 1), 36S–41S.
Saini, S., DeStefano, N., Smith, S., Guidi, L., Amato, M. P., Federico, A., and Matthews, P. M. (2004). Altered cerebellar functional connectivity mediates potential adaptive plasticity in patients with multiple sclerosis. J. Neurol. Neurosurg. Psychiatr. 75, 840–846.
Staffen, W., Mair, A., Zauner, H., Unterrainer, J., Niederhofer, H., Kutzelnigg, A., Ritter, S., Golaszewski, S., Iglseder, B., and Ladurner, G. (2002). Cognitive function and fMRI in patients with multiple sclerosis: evidence for compensatory cortical activation during an attention task. Brain 125, 1275–1282.
Stroop, J. R. (1935). Studies of interference in serial verbal reactions. J. Exp. Psychol. 18, 643–662.
Tzourio-Mazoyer, N., Landeau, B., Papathanassiou, D., Crivello, F., Etard, O., Delcroix, N., Mazoyer, B., and Joliot, M. (2002). Automated anatomical labeling of activations in SPM using a macroscopic anatomical parcellation of the MNI MRI single-subject brain. Neuroimage 15, 273–289.
Keywords: connectivity, demyelination, white matter, plasticity, neuroimaging, fMRI
Citation: Helekar SA, Shin JC, Mattson BJ, Bartley K, Stosic M, Saldana-King T, Montague PR and Hutton GJ (2010) Functional brain network changes associated with maintenance of cognitive function in multiple sclerosis. Front. Hum. Neurosci. 4:219. doi: 10.3389/fnhum.2010.00219
Received: 29 July 2010;
Accepted: 30 October 2010;
Published online: 22 November 2010.
Edited by:
Hauke R. Heekeren, Max Planck Institute for Human Development, GermanyReviewed by:
Nancy Zucker, Duke University Medical Center, USAPeter Sörös, University of Western Ontario, Canada
Copyright: © 2010 Helekar, Shin, Mattson, Bartley, Stosic, Saldana-King, Montague and Hutton. This is an open-access article subject to an exclusive license agreement between the authors and the Frontiers Research Foundation, which permits unrestricted use, distribution, and reproduction in any medium, provided the original authors and source are credited.
*Correspondence: Santosh A. Helekar, Department of Neuroscience, Baylor College of Medicine, One Baylor Plaza, BCM 295, Houston, TX 77030, USA.e-mail: shelekar@bcm.edu