Deconstructing the “resting” state: exploring the temporal dynamics of frontal alpha asymmetry as an endophenotype for depression
- 1 Department of Psychology, University of Arizona, Tucson, AZ, USA
- 2 Department of Psychology, University of Amsterdam, Amsterdam, Netherlands
- 3 Department of Physiology, University of Arizona, Tucson, AZ, USA
Asymmetry in frontal electrocortical alpha-band (8–13 Hz) activity recorded during resting situations (i.e., in absence of a specific task) has been investigated in relation to emotion and depression for over 30 years. This asymmetry reflects an aspect of endogenous cortical dynamics that is stable over repeated measurements and that may serve as an endophenotype for mood or other psychiatric disorders. In nearly all of this research, EEG activity is averaged across several minutes, obscuring transient dynamics that unfold on the scale of milliseconds to seconds. Such dynamic states may ultimately have greater value in linking brain activity to surface EEG asymmetry, thus improving its status as an endophenotype for depression. Here we introduce novel metrics for characterizing frontal alpha asymmetry that provide a more in-depth neurodynamical understanding of recurrent endogenous cortical processes during the resting-state. The metrics are based on transient “bursts” of asymmetry that occur frequently during the resting-state. In a sample of 306 young adults, 143 with a lifetime diagnosis of major depressive disorder (62 currently symptomatic), three questions were addressed: (1) How do novel peri-burst metrics of dynamic asymmetry compare to conventional fast-Fourier transform-based metrics? (2) Do peri-burst metrics adequately differentiate depressed from non-depressed participants? and, (3) what EEG dynamics surround the asymmetry bursts? Peri-burst metrics correlated with traditional measures of asymmetry, and were sensitive to both current and past episodes of major depression. Moreover, asymmetry bursts were characterized by a transient lateralized alpha suppression that is highly consistent in phase across bursts, and a concurrent contralateral transient alpha enhancement that is less tightly phase-locked across bursts. This approach opens new possibilities for investigating rapid cortical dynamics during resting-state EEG.
Introduction
Prefrontal brain asymmetry has been proposed to serve as an indicator of risk for major depressive disorder (MDD; Allen et al., 2004b; Stewart et al., 2010) as well as internalizing disorders more generally (e.g., Allen et al., 1993; Bruder et al., 1997; Nitschke et al., 1999; Wiedemann et al., 1999; Davidson et al., 2000; Accortt and Allen, 2006; Mathersul et al., 2008; Stewart et al., 2008), and individuals low on this risk factor demonstrate significant signs of well-being (e.g., Kang et al., 1991; Schmidt and Fox, 1994; Fox et al., 1995; Davidson et al., 1999; Urry et al., 2004). Such findings support the proposition that prefrontal brain asymmetry indexes a dimension that spans risk for or resilience from depression and internalizing psychopathology, and that it provides an easily measured endophenotype (Iacono, 1998; Gottesman and Gould, 2003), a measurable endogenous characteristic of an individual that is related to underlying mechanisms conferring risk. Prefrontal brain asymmetry demonstrates several characteristics to support its promise as an endophenotype for depression(for overviews, see Allen et al., 2004b; Coan and Allen, 2004; Stewart et al., 2010) including that: (1) it differentiates depressed from non-depressed individuals not only during active episodes but when in remission (e.g., Henriques and Davidson, 1990, 1991; Allen et al., 1993, 2004b; Gotlib et al., 1998); (2) it is heritable (Anokhin et al., 2006; Smit et al., 2007); and (3) it is seen at elevated rates among non-depressed relatives of those with a history of depression (e.g., Dawson et al., 1997, 1999; Jones et al., 1997; Tomarken et al., 2004; Diego et al., 2010).
Prefrontal brain asymmetry in these contexts, however, has been measured almost exclusively with assessments of resting EEG alpha activity (Allen et al., 2004a; Coan and Allen, 2004), deriving summary metrics that may reflect anywhere from 2 to 12 min of resting brain electrical activity. Such resting assessments are often viewed from the somewhat endemic model that resting frontal EEG asymmetry taps trait-like dispositions for affective responses (Davidson, 1998b) of approach (indexed by relatively greater left frontal activity) or withdrawal (indexed by relatively greater right frontal activity; Coan et al., 2006). Although there is now a substantial literature of more than 80 studies to suggest that resting frontal EEG activity may serve as an indicator of a trait-like diathesis to respond to emotional situations with a characteristic pattern of emotional negativity and behavioral withdrawal (for review, see Coan and Allen, 2004), this literature is not without studies that fail to support this notion (e.g., Bruder et al., 1997; Reid et al., 1998; Debener et al., 2000; Pizzagalli et al., 2002).
Such inconsistencies have inspired a healthy debate in this literature about the psychometric properties of the metrics of frontal asymmetry and the importance of various EEG reference montages for assessing prefrontal brain asymmetry (e.g., Davidson, 1998a; Hagemann et al., 2001, 2002; Allen et al., 2004a,b; Coan and Allen, 2004; Towers and Allen, 2009). Although resting frontal brain asymmetry shows high internal consistency (Towers and Allen, 2009) and reasonable stability over time (Hagemann et al., 2002; Allen et al., 2004b), there exists considerable variability within the resting assessment period, with non-depressed individuals demonstrating relatively greater left frontal activity approximately 70% of the time, and relatively greater right activity the remainder (Baehr et al., 1998; Allen et al., 2001). Such findings suggest that there may indeed be meaningful variability within the resting assessment period that deserves greater scrutiny, and that the assumption that resting EEG asymmetry is a trait may need to be reframed to reflect a recurring series of states within the resting period. Thus, investigations of this variability would be motivated by the assumption that the resting-state does not reflect a homogeneous psychological or physiological condition, but instead comprises multiple dynamic states, some of which may predominate sufficiently to produce meaningful, albeit suboptimal, summary metrics over the entire resting period. Further, some of these dynamic states may have greater relevance to questions of interest, such as identifying individuals at greatest risk for depression. Thus a finer-grained analysis of the resting-state may ultimately improve the status of prefrontal brain asymmetry as an endophenotype for depression. This assumption of dynamic networks active over the resting interval has a profitable precedent, as this assumption is the basis for analysis of resting fMRI data, which led to the characterization of the default mode network (Raichle et al., 2001; Smith et al., 2009).
Additionally, a finer-grained analysis of the resting-state may aid in linking the currently coarse and highly global metrics of prefrontal brain asymmetry to more specific aspects of neural function. Although resting frontal EEG asymmetry has been linked repeatedly to psychological traits and thus has reasonable psychological construct validity (Allen and Kline, 2004; Cacioppo, 2004), there is a conspicuous absence of links to functional or structural brain imaging data or brain neurochemistry, thus revealing that resting frontal EEG asymmetry has impoverished neurophysiological construct validity (Allen and Kline, 2004; Davidson, 2004). Because the measure of frontal EEG asymmetry suffers from both relatively crude temporal and also spatial resolution, a finer-grained analysis of temporal dynamics of the resting-state EEG, utilizing a spatially more specific approach, has promise in linking resting frontal EEG asymmetry to other aspects of neurophysiology. Addressing the spatial specificity, a recent investigation reduced the contribution of distal volume-conducted signals to frontal cortex via the use of the current-source-density (CSD) transformation (Stewart et al., 2010). In that study, the CSD derivation yielded a more robust relationship to a history of depression than did other traditional reference montages (i.e., average reference, averaged mastoids reference, Cz reference); CSD-based frontal EEG asymmetry differentiated individuals with any history of depression – current or previous episodes – from never-depressed individuals, independent of the current level of depressive symptoms. Still lacking from that study, however, was a fine-grained temporal analysis of frontal asymmetry, as the measures reflected the average activity across several minutes of resting sessions.
In the present investigation, therefore, we sought to improve both the spatial and temporal precision of resting frontal EEG asymmetry, characterizing this asymmetry in terms of a set of features that recurred dynamically during the resting period, and leveraging the improved anatomical specificity and sensitivity to depression history provided by the use of the CSD reference. By comparing metrics based on these recurring features to the conventional global metrics of resting EEG asymmetry, it was possible to assess whether the novel metrics retain the construct validity of the extant global metrics in terms of differentiating depressed and non-depressed individuals. Should these novel metrics that reflect the dynamics of the resting period show adequate correspondence to extant metrics and similarly differentiate depressed from non-depressed individuals, they may hold advantages for future investigations that can explore brain state dynamics and neural bases of activity that portends risk for depression.
Materials and Methods
Participants
Participants were 306 young adults also reported in a recent report (Stewart et al., 2010). Prospective participants were identified using Beck depression inventory (BDI; Beck et al., 1961) scores, and were initially telephoned by a post-baccalaureate project manager to determine if they met exclusionary criteria: left handedness, history of head injury with loss of consciousness >10 min, concussion, epilepsy, electroshock therapy, use of current psychotropic medications, and active suicidal potential necessitating immediate treatment. Individuals receiving current psychotherapy were not excluded. Participants not excluded by this screen were invited for an intake interview. All participants accepted into the study were required to be strongly right handed (a score of greater than 35 on the 39 point scale of Chapman and Chapman, 1987). Figure 1 provides a detailed flow chart summarizing study recruitment across a 4-year period. Participants were screened during the intake interview for Axis I psychopathology using the structured clinical interview for DSM-IV (SCID, First et al., 2002), and excluded if they met criteria for any current comorbid DSM-IV Axis I disorder other than lifetime MDD or current dysthymia. Inter-rater reliability was high for both current and past MDD diagnoses (κ = 0.81 and 0.91, respectively). The final sample of 306 participants (95 male) ranged in age from 17 to 34 years (M = 19.1, SE = 0.1), of whom 143 met criteria for the lifetime MDD. All participants provided informed consent, using procedures and a form approved by the Institutional Review Board of the University of Arizona.
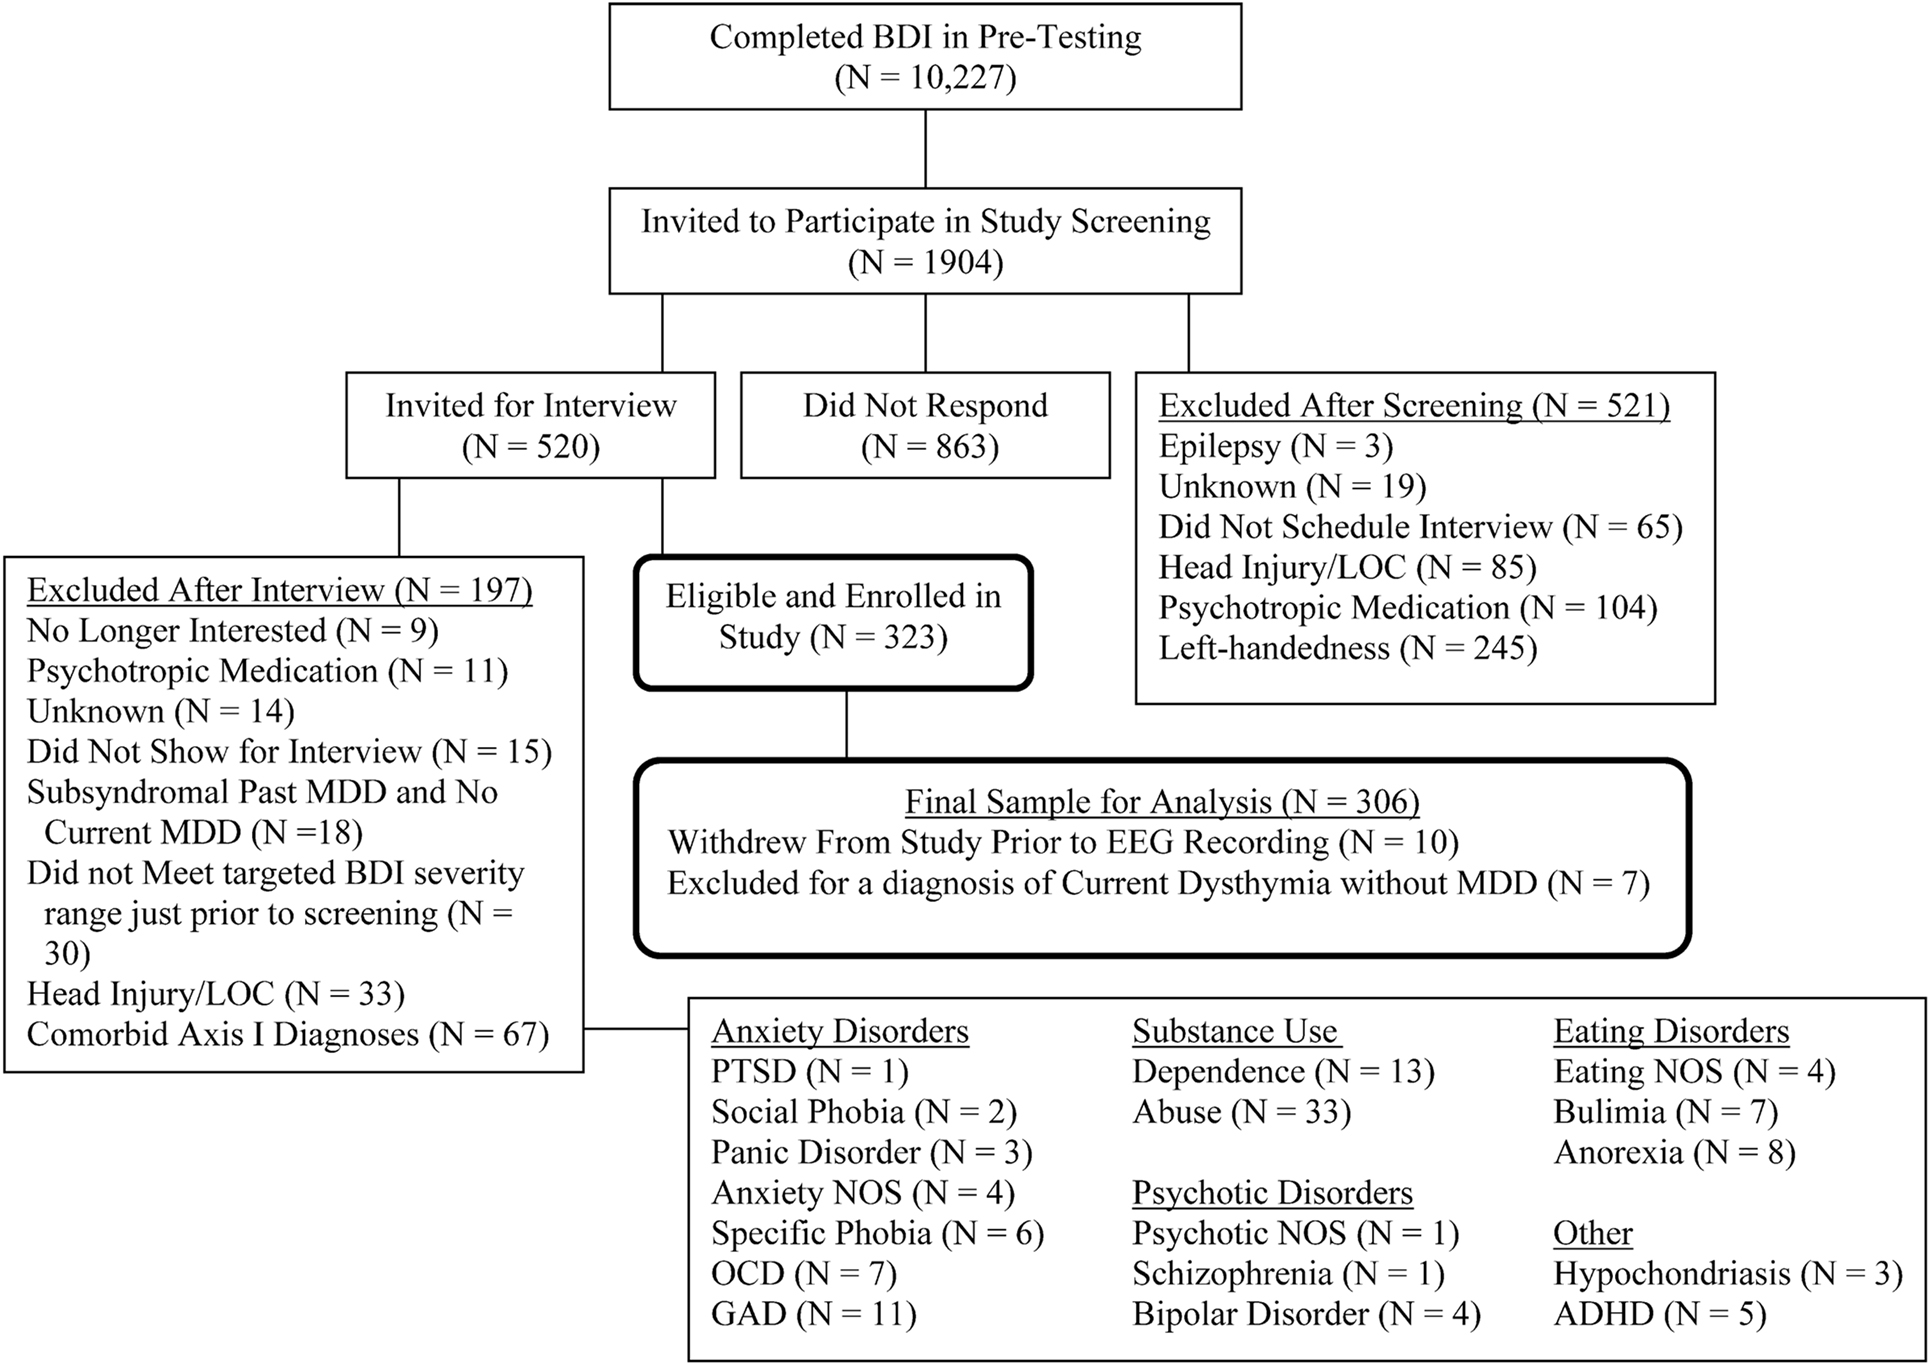
Figure 1. Flowchart of participant screening and enrollment. Note: BDI, Beck depression inventory; LOC, loss of consciousness; MDD, major depressive disorder; PTSD, posttraumatic stress disorder; NOS, not otherwise specified; OCD, obsessive compulsive disorder; GAD, generalized anxiety disorder; ADHD, attention deficit hyperactivity disorder. After Stewart et al. (2010).
Figure 1 summarizes the flow of recruitment, Table 1 provides participant demographics and symptom characterization, and Table 2 provides diagnostic information about those with lifetime MDD. Depression severity was assessed during the intake interview with the BDI II (Beck et al., 1996) and the 17-item Hamilton rating scale for depression (HRSD; Hamilton, 1960), the latter that had an intra-class correlation of inter-rater agreement of 0.95 for a randomly selected sample of 10% of HRSD interviews.
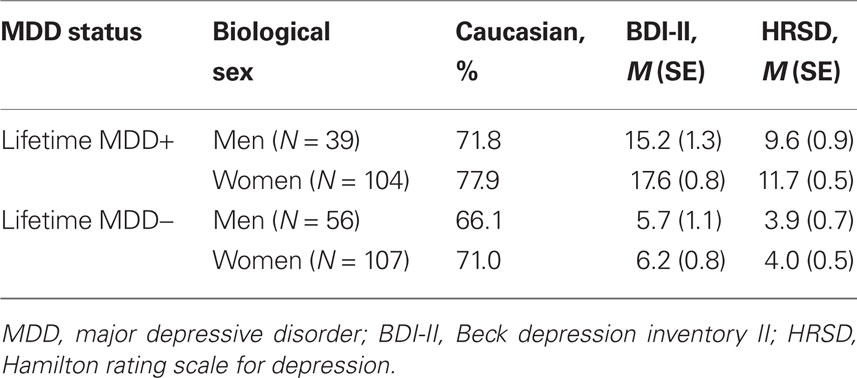
Table 1. Participant demographics.
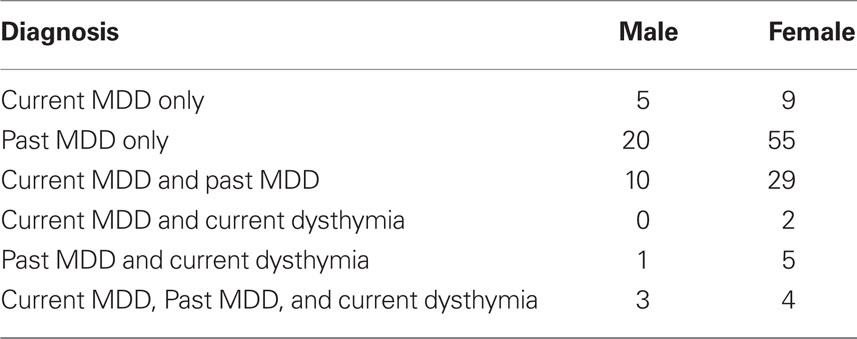
Table 2. DSM-IV diagnoses endorsed in lifetime MDD+ group (N = 143).
EEG Data Collection and Reduction
Participants visited the laboratory on four separate days within a 2-week period. Two resting EEG sessions were completed each day. Nine participants attended fewer than all four EEG assessment days but all subjects were included in mixed linear model analyses that successfully handle missing data (Bagiella et al., 2000). During each resting EEG session, eight 1 min baselines were recorded, with eyes-open (O) or eyes-closed (C), in one of two counterbalanced orders (OCCOCOOC or COOCOCCO). Sessions within day were separated by approximately 20 min. All EEG data were acquired using a 64-channel NeuroScan Synamps2 amplifier, and imported into Matlab using the EEGLab Toolbox (Delorme and Makeig, 2004). A vertical electrooculogram (EOG) channel (superior and inferior orbit of the left eye) was recorded for later ocular artifact rejection. All impedances were kept under 10 kΩ. Data for each resting session were digitized continuously at 1000 Hz, amplified 2816 times, and filtered with 200 Hz low pass filter prior to digitization. EEG data were acquired with an online reference site immediately posterior to Cz and subsequently re-referenced offline to a CSD derivation using the CSD Toolbox of Kayser and Tenke (2006a,b) that is based on the spherical spline approach summarized by Perrin et al. (1989, 1990). CSD is a spatial filter that minimizes the contributions of deep and/or distant sources. It therefore provides a more accurate depiction of the topography of electrocortical dynamics (Srinivasan et al., 1996, 2007), and is appropriate for localizing time-frequency dynamics of cognitive processes at the level of the scalp (Cavanagh et al., 2009; Cohen et al., 2009a). Modeling (Winter et al., 2007) and empirical (Srinivasan et al., 2007) papers suggest that volume conduction artifacts extend to less than 3 cm across the scalp (typical distance between two electrodes in a 128-channel cap, or 1/2 of an electrode in a 64-channel cap). It is believed that after CSD/Laplacian processing, each electrode measures activity from ∼3 cm underneath the electrode. Thus, it is likely that the effects reported here are generated by tissue close to the surface of the brain. This is not meant to imply that deeper generators of alpha do not exist or are irrelevant; rather, our choice of methods helps topographically localize clinically relevant cortical dynamics.
After acquisition, epochs with movement and muscle artifacts were removed via visual inspection, following which segments were automatically rejected if vertical ocular activity exceeded ±75 μV. Finally, a custom artifact rejection algorithm rejected segments with large fast deviations in amplitude in any channel (e.g., DC shifts and spikes) that may have eluded human inspection. After these preprocessing steps, data were then processed in the standard fashion to derive the customary metrics of asymmetry (details below), and also processed using a novel approach that is based on identifying spontaneous asymmetrical bursts in the ongoing EEG (details below).
Conventional Data Reduction
The standard data processing steps, and the rationale behind them, have been described in detail elsewhere (Allen et al., 2004a; Stewart et al., 2010). For this approach, summarized in Figure 2, data are segmented into short epochs, tapered with a Hamming window, transformed via fast-Fourier transform (FFT) to power spectra, and then the average across all spectra is derived and total alpha power is extracted for each site. In the present data, each resting session was segmented into 1 min EEG blocks and further into 117 epochs of 2.048 s per block, overlapping by 1.5 s. Overlapping epochs offsets the minimal weight applied to the end of the epoch due to the Hamming window function. Next, a power spectrum for each artifact-free epoch was derived via FFT, following which all power spectra across all 8 min were averaged to provide a summary spectrum for each resting session. At each site, from each resting session, total alpha power (8–13 Hz) was extracted and an asymmetry score for each resting session was computed with natural-log transformed scores [i.e., ln(Right) − ln(Left)] for homologous left and right leads (e.g., F7 and F8, F5 and F6, F3 and F4, F1 and F2), with higher scores interpreted to reflect relatively greater left activity (i.e., greater right than left alpha; cf. Allen et al., 2004a). Results from this approach on the present participant sample have been previously reported (Stewart et al., 2010), and a subset of those findings will be repeated here for comparison to the novel metrics.
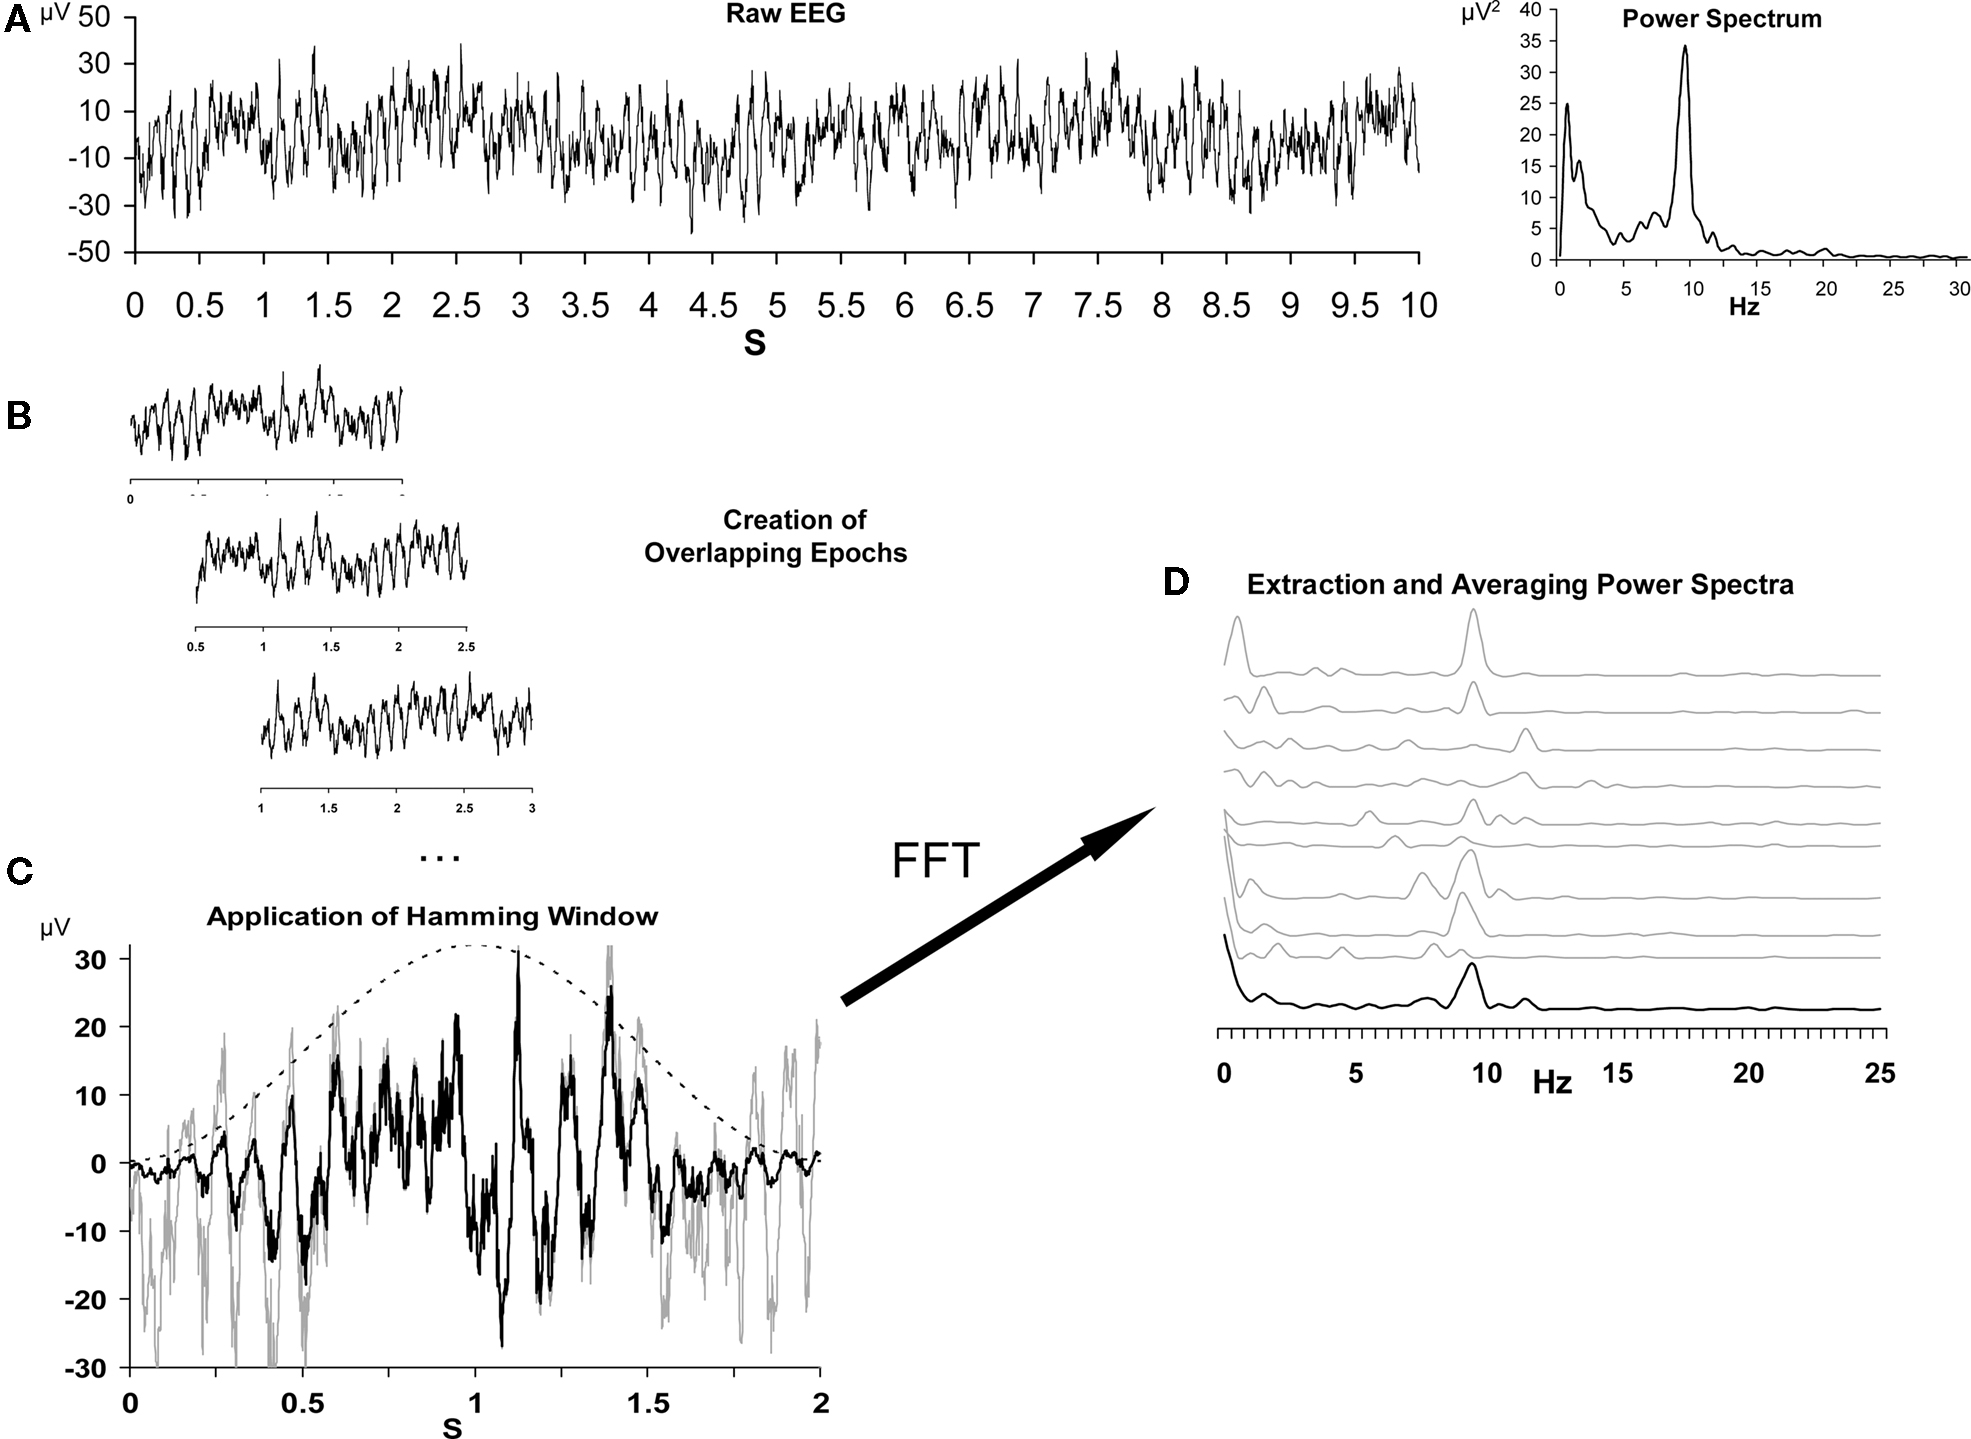
Figure 2. Schematic depiction of the data reduction steps for the conventional EEG asymmetry data reduction. (A) depicts a 10-s segment of raw data from a single channel on the left, and the spectral representation of this epoch on the right. (B) illustrates the process of epoching the longer segment into shorter overlapping 2 s epochs. (C) depicts the impact of the Hamming window (dotted bell curve) on a single epoch, with the gray line representing the raw signal and the black line representing the signal after the application of the window. Panel D illustrates the extraction of individual power spectra via FFT, and finally the averaging of those spectra across epochs. The top nine gray lines are the spectral representation of nine 2 s epochs, and the lower black line is the average spectrum. Note that alpha power (8–13 Hz) is somewhat variable from epoch to epoch, but that the average spectrum reveals a distinct alpha peak. Vertical axis in (D) is power in microvolts-squared. Figure modeled after Allen et al. (2004a).
Novel data reduction based on endogenous asymmetry bursts
In cognitive/perceptual studies, transient as well as sustained alpha dynamics are thought to be related to “pulsed inhibition,” a potential mechanism by which neural processing can be temporally organized and cognitive dynamics can be shaped (Klimesch et al., 2007; Palva and Palva, 2007; Handel et al., 2010). Many of these studies focus on transient (100 s of milliseconds) stimulus-induced alpha activity. On the other hand, the study of frontal alpha asymmetry as it relates to depression has focused on global measures of EEG recorded over several minutes (see previous section). Thus, we adopted methods from cognitive neuroscience to examine whether frontal alpha asymmetry fluctuates dynamically over time. Indeed, during exploratory data investigations, we noticed that alpha asymmetry is not stable over time, but rather is characterized by fluctuations at multiple time scales, and punctuated by “bursts” of increased or decreased power. An example of this can be seen in Figure 3. The reasoning behind the analyses reported here is that these bursts of frontal alpha asymmetry might reflect a phasic endogenous process related to the global alpha asymmetry typically reported. We consider each of these bursts to be an event of interest, and conducted time-frequency decomposition analyses surrounding each of these events to investigate these dynamic alpha asymmetries and link them to depression.
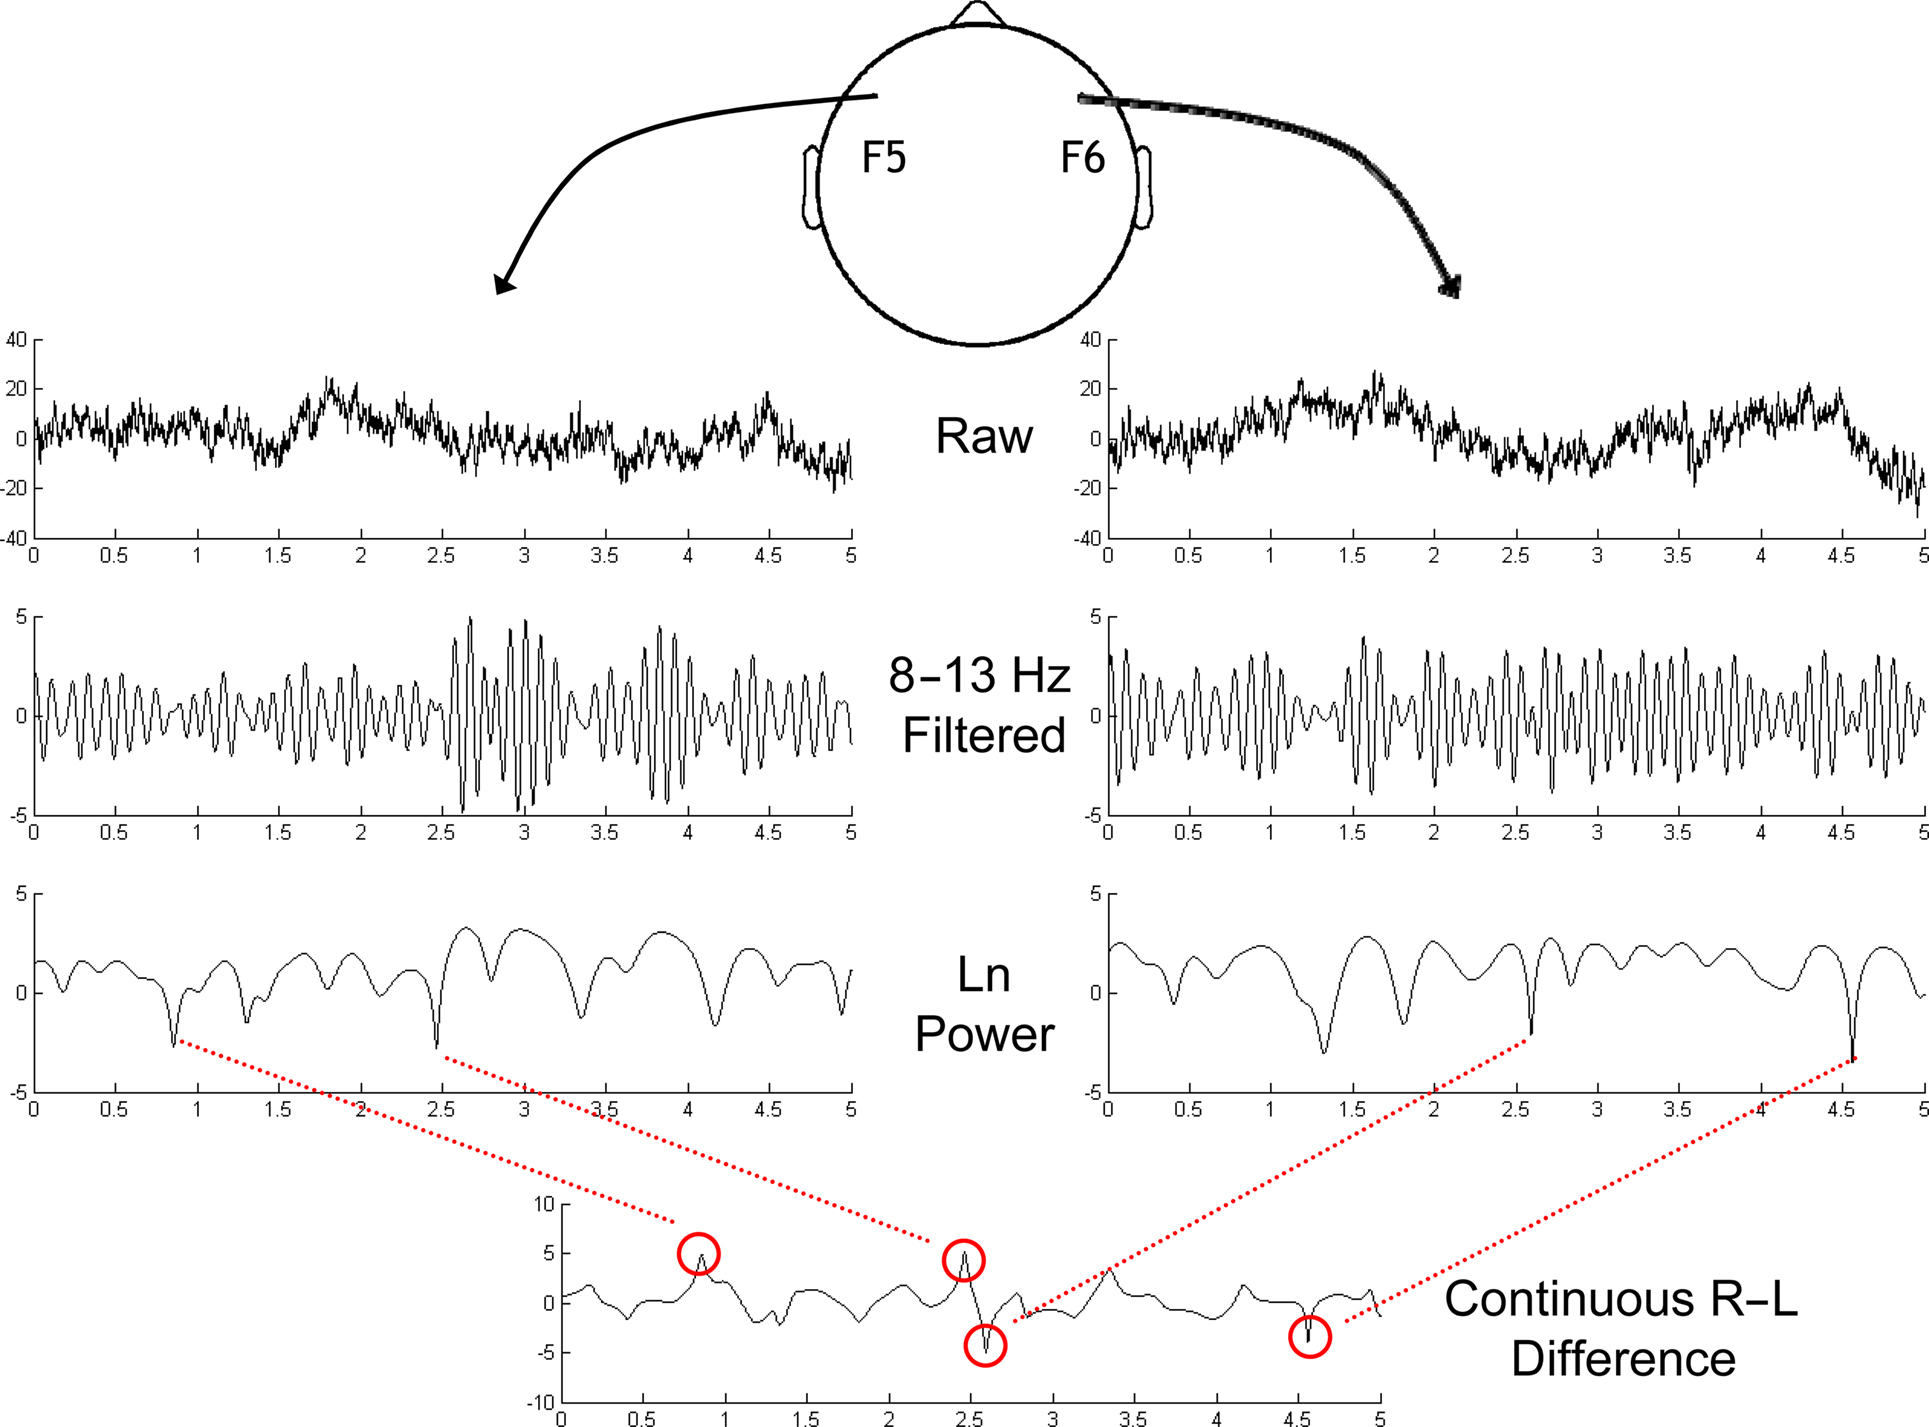
Figure 3. Schematic depiction of the identification of asymmetrical bursts in the ongoing resting EEG session. Sites F5 and F6 were chosen based on previous findings as the sites of interest. Top row depicts 5 s of data after current-source density transformation. Next row is alpha-band (8–13 Hz) filtered version of the same data. The natural log of squared Hilbert-transformed alpha-band-pass filtered signals is depicted in the third row. Finally, the subtraction (Right-Left) of these two signals is depicted in the bottom panel, revealing the dynamic nature of frontal alpha asymmetry, with bursts identified by the red circles, and lines linking to the corresponding features in the right or left channel. The leftmost two bursts in this bottom panel are positive bursts, and the rightmost two bursts are negative bursts. Vertical axis for the upper two rows is μV/cm2, and for the bottom two rows is log-μV2/cm2.
To identify endogenous lateralized alpha bursts (Figure 3), the ongoing EEG signal at sites F5 and F6 were filtered with an 8–13 Hz FIR bandpass filter. Next the Hilbert transform was applied, which provides the analytic representation of the data, from which estimates of instantaneous power (the natural log of the squared magnitude of the analytic signal) were taken for each site. Finally, the difference between sites F6 and F5 (F6–F5; right–left hemisphere) was taken as a continuous time-varying signal of alpha asymmetry. Sites F6 and F5 were selected as they were centrally positioned among sites examined with the conventional FFT-based metrics (Stewart et al., 2010).
To identify asymmetry bursts, we examined the distribution of the absolute value of alpha asymmetry values over time, and selected time points that were on the extreme upper 1% tail of the distribution for each recording session for each participant1. This gives both “positive” (greater relative right alpha power) and “negative” (greater relative left alpha power) bursts. Finally, if, after trial removal/rejection (using the procedure described above), there were fewer than 10 bursts in any one of the four conditions (eyes-open/closed × positive/negative bursts), then the entire session was removed from analyses. Although this might seem overly stringent because there might be valid data in the other conditions, because of the multitude of data from over 300 subjects, we decided to use a cautious approach that would favor selectivity. This procedure resulted in discarding 784 out of 2448 sessions. This does not imply that alpha asymmetry dynamics on different time scales or at less extreme values are irrelevant; rather, we chose to focus this initial investigation on endogenous events that can be unequivocally defined and differentiated.
To quantify the electrophysiological dynamics surrounding these endogenous asymmetry bursts, EEG data from each “trial” (i.e., burst, from 3 s before to 3 s after each burst) were convolved with a family of complex Morlet wavelets, defined as a complex sine wave windowed by a Gaussian:  where t is time, f is frequency, which increased from 2.5 to 50 Hz in 40 logarithmically spaced steps, and σ defines the width of each frequency band and is set to 4.5/(2πf). Estimates of frequency-specific instantaneous power (real[z(t)]2 + imag[z(t)]2) and phase (arctan(imag[z(t)]/real[z(t)])) were extracted from the resulting analytic signal. Long epochs were extracted in order to discard data points contaminated by edge artifacts; visual inspection confirmed that no edge artifacts contaminated the data subjected to statistical analyses or shown in figures. Power was averaged across bursts and converted to decibel scale relative to the average power from −500 to +500 ms surrounding the burst; phase values were used for inter-burst phase coherence:
  . For statistical analyses, data from −26 to +26 ms surrounding bursts were entered into repeated-measures ANOVA and regressions, using the procedures described below2.
The analyses were designed to address three central questions: (1) How do the novel peri-burst metrics of dynamic asymmetry compare to the conventional FFT-based metrics? (2) Do the peri-burst metrics adequately differentiate depressed and non-depressed participants? and (3) What EEG dynamics surround the asymmetry bursts that are captured by the novel peri-burst metrics? To address these questions, a combination of approaches was utilized. Correlations between the novel peri-burst metrics and conventional asymmetry metrics were examined, and mixed linear models assessed whether the metrics differentiated those with lifetime depression from never-depressed individuals, and further whether these metrics would differentiate never-depressed individuals only from those with current depression (indicative of a state effect) or from those with any lifetime history of depression (indicative of a potential marker of risk).
Results
A Comparison of Peri-Burst Dynamics with Conventional FFT-Based Metrics
As depicted in Figure 4, peri-burst alpha power at sites F5 and F6 was most closely related to conventional FFT-derived power from the entire resting period at those same sites. And although the topographical pattern of the correlations of peri-burst alpha power at F5 and F6 with conventional FFT-based power estimates across the scalp was similar for both positive and negative bursts, the magnitude of the correlations were substantially larger for F5 during negative bursts and F6 during positive bursts than for F5 during positive or F6 during negative bursts. Finally, as evident in Figure 4, there is a general pattern of positive correlations across the scalp, likely due to the fact that both measures capture individual differences in overall power.
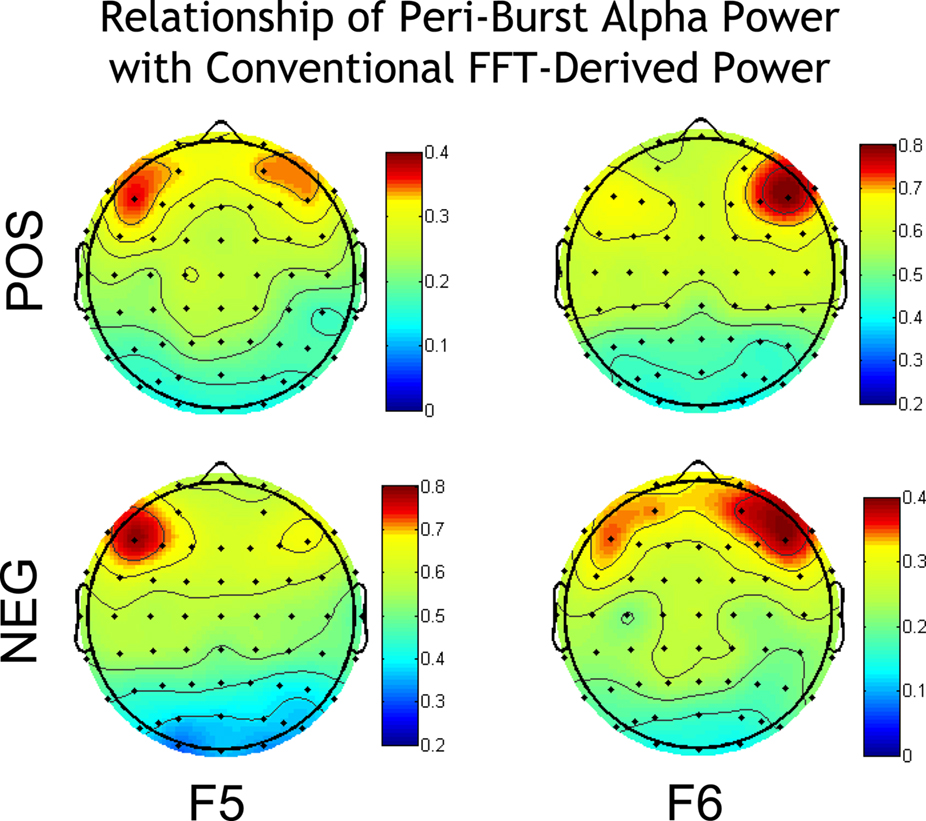
Figure 4. Correlation of peri-burst alpha power at sites F5 and F6 with the conventional FFT-derived metrics of power over the entire scalp. Correlations are shown separately for positive bursts (top row) and negative bursts (bottom row). All individual site power values (both conventional and peri-burst power) were natural-log transformed prior to correlation, in keeping with the tradition of log-transformed power values in the EEG asymmetry literature. Against the backdrop of modest positive correlations, reflecting global power differences between subjects, there is anatomical specificity such that peri-burst power from F5 correlates most highly with conventional FFT power at F5, and similarly for these metrics at F6. This anatomical specificity is, in part, due to the effective high-pass spatial filter provided by CSD transformation. Note that the range of correlations differs such that positive bursts for F5 and negative bursts for F6 are on a common scale, and negative bursts for F5 and positive bursts for F6 are on a common scale. Maps were constructed by mapping Pearson correlations using the function topoplot from EEGLab (Delorme and Makeig, 2004).
Of greater interest, however, is how the asymmetry in peri-burst alpha power relates to conventional and widely used asymmetry scores derived via FFT. Depicted in Figure 5 are correlations between the peri-burst alpha power asymmetry [ln(F6)−ln(F5)] and conventional asymmetry scores [ln(Right)−ln(Left)] derived via FFT from the entire resting period. As seen in Figure 5, anatomical specificity is observed in the relationship of peri-burst alpha asymmetry to conventional asymmetry for positive bursts, negative bursts, and the pooled set of bursts, but the relationship is notably stronger for the combined dataset. Combining across both positive and negative bursts produces a peri-burst alpha power asymmetry metric that is most closely aligned with the conventional FFT-based asymmetry scores, accounting for 42% of the variance in conventional asymmetry scores at F6–F5.
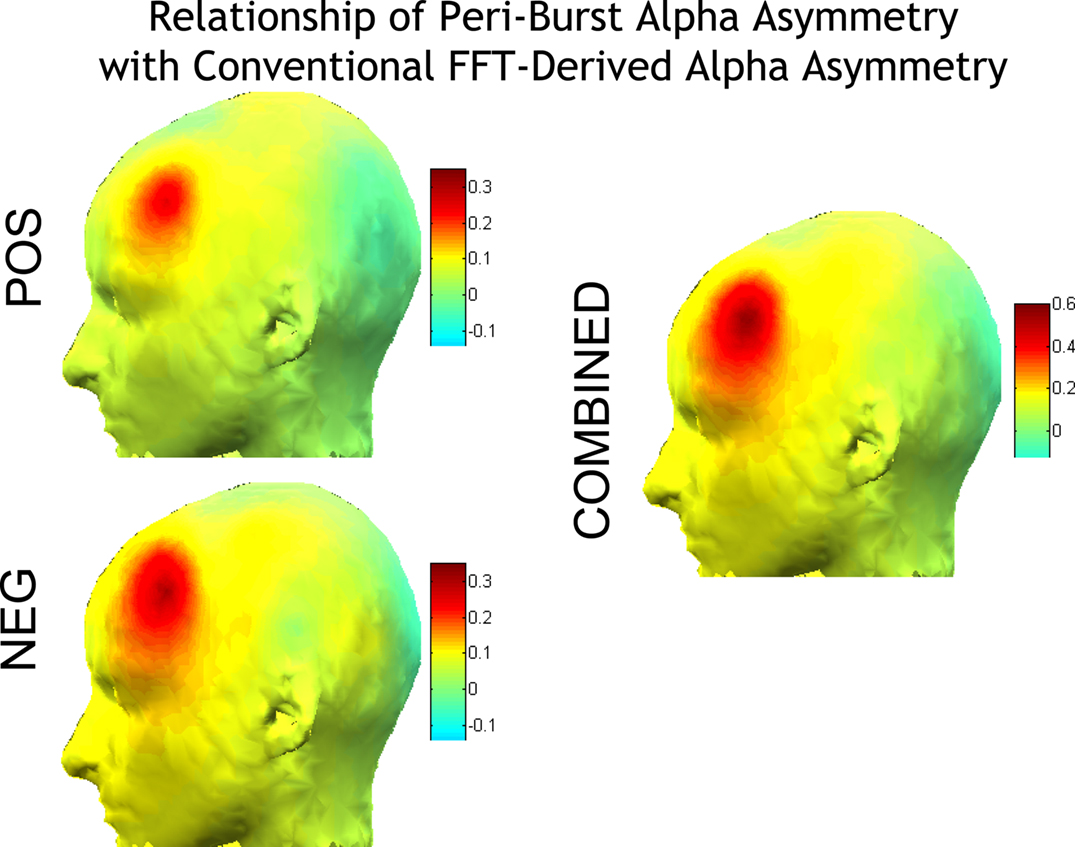
Figure 5. Correlations of peri-burst alpha asymmetry from sites F5 and F6 [ln(F6)−ln(F5)] with the conventional FFT-derived asymmetry score from all homologous EEG sites [ln(Right)−ln(Left)]. Correlations are shown separately for positive bursts (top left) and negative bursts (bottom left) and combined (right). Because asymmetry scores are difference scores, only one side of the head is depicted, as the opposite side would show identical topography. Anatomical specificity is observed for positive and negative bursts, and all bursts combined, but note that the scale for the combined is larger than either the positive or negative bursts alone, indicating that combining across both positive and negative bursts produces a metric that is most closely aligned with the conventional asymmetry scores, accounting for 42% of the variance in conventional asymmetry scores at F6–F5. Maps were constructed by mapping Pearson correlations using the function headplot from EEGLab (Delorme and Makeig, 2004).
Together, these findings demonstrate peri-burst alpha power from a small subset of the recording epoch is remarkably similar to, although not redundant with, conventional FFT-based power.
Finally, the relationship between the number of positive and negative bursts and conventional FFT-derived metrics was examined. Because bursts were identified by selecting the extreme 1% of all activity, the number of positive or negative bursts reflects whether, among an individual’s extreme amplitude bursts, the individual had more positive or negative bursts. As shown in Figure 6, anatomical specificity is observed in the relationship of number of positive and negative bursts to conventional asymmetry and power at individual sites, but the overall relationships are modest in magnitude.
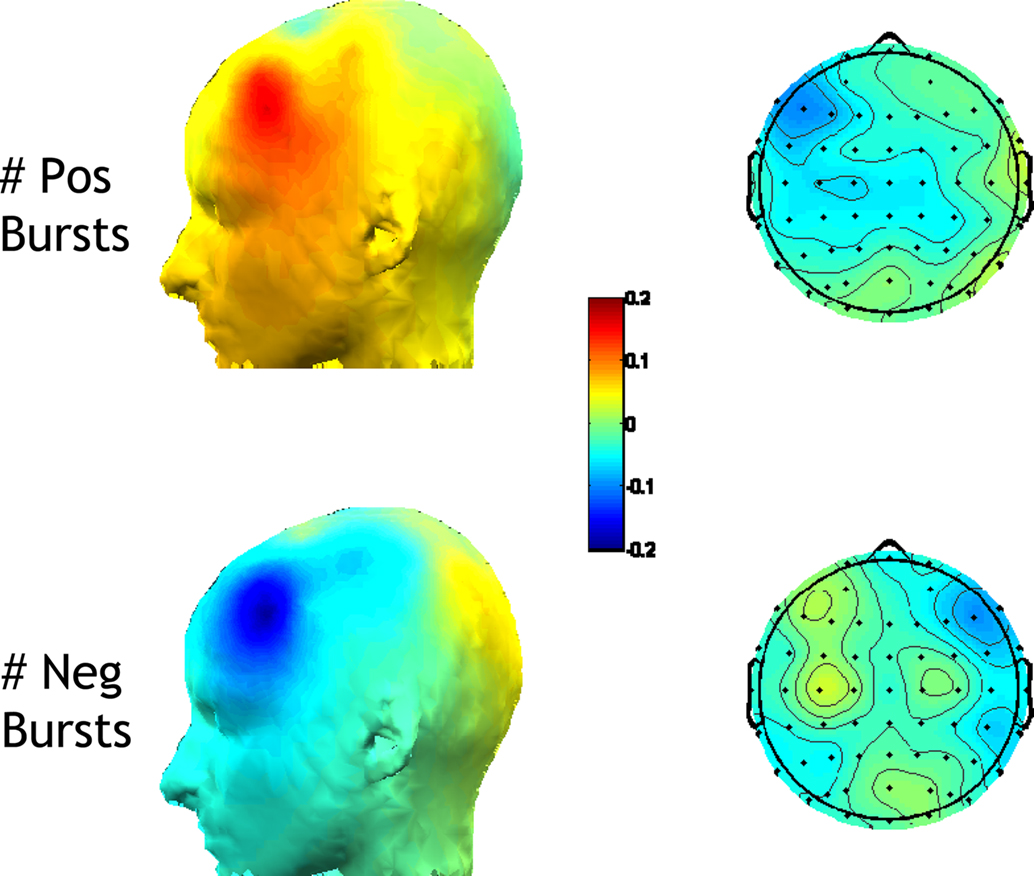
Figure 6. Correlations of number of positive and negative bursts with the conventional FFT-derived metrics. Left panel: correlation with the asymmetry score from all homologous EEG sites [ln(Right)−ln(Left)]; Right panel: correlations with ln-transformed alpha power at individual sites. Correlations are shown separately for the number of positive bursts (top) and for the number of negative bursts (bottom). A greater number of positive bursts is associated with relatively greater ln(R)−ln(L) FFT-derived asymmetry scores, and less left frontal alpha. A greater number of negative bursts is associated with relatively lower ln(R)−ln(L) FFT-derived asymmetry scores, and less right frontal alpha.
Examining whether Peri-Burst Dynamics are Sensitive to Lifetime Depression
To examine whether asymmetry metrics would differ as a function of depression status, mixed linear models were used, first with the conventional FFT-based EEG asymmetry and then with metrics of peri-burst dynamics.
Previous findings: conventional FFT-based alpha power asymmetry
As previously reported (Stewart et al., 2010), conventional FFT-based frontal EEG alpha asymmetry differentiated individuals on the basis of lifetime MDD. A subset of the data (sites F5 and F6) from that report was used here to provide an analysis comparable to those planned for the peri-burst metrics. In the Stewart et al. report, CSD-referenced EEG asymmetry scores that were derived from the conventional FFT method were examined across a broad frontal region (F2–F1, F4–F3, F6–F5, F8–F7). For the model here, the specific electrode-pair F6–F5 was examined, as that is the site where peri-burst metrics were computed. In a model that included lifetime MDD status (past and/or current MDD = lifetime MDD+, never depressed = lifetime MDD−), recording day (4), and session within day (2), the FFT-derived EEG asymmetry score based on total 8–13 Hz alpha power was the dependent variable. Only effects involving MDD status were of interest. In the absence of any significant interactions involving Lifetime MDD status, there was a main effect of Lifetime MDD status [F(1,2359.9) = 14.0, p < 0.001], with Lifetime MDD participants having significantly lower frontal asymmetry scores than never-depressed individuals. To determine if these findings were due to currently depressed individuals among the Lifetime MDD group, the model was rerun, but instead of lifetime MDD status, current MDD status was used (current MDD+ = all participants with current MDD, regardless of past MDD status; past MDD+ = participants with past MDD but not current MDD or current dysthymia; MDD− = participants without current or past MDD or dysthymia; six participants with past MDD but current dysthymia were not included in these analyses). Again, there was a main effect of MDD status [F(2,2307.2) = 5.9, p < 0.001], which indicated that both current and past MDD+ participants had lower frontal EEG asymmetry scores than never-depressed controls (Figure 7), and did not differ significantly from one another.
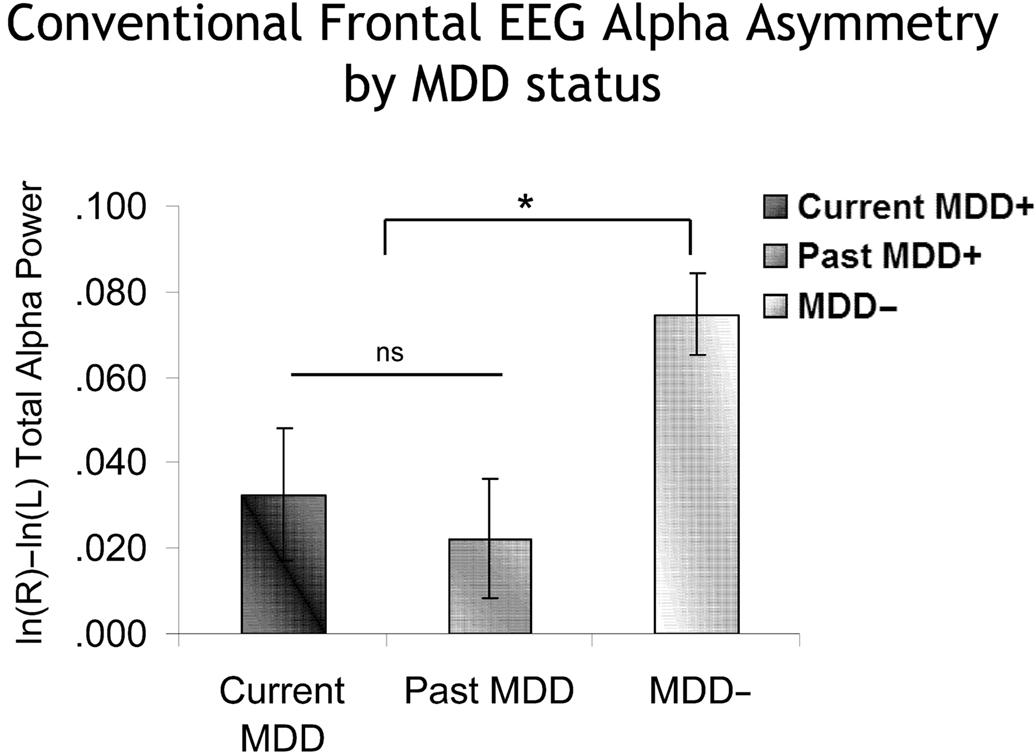
Figure 7. Conventional frontal alpha asymmetry scores as a function of MDD status. Error bars reflect standard error. Y-axis is ln μV2/cm2. Both currently and previously depressed individuals had significantly lower asymmetry scores than never-depressed individuals.
Peri-burst alpha power asymmetry
An identical approach was used to examine peri-burst alpha asymmetry. In a model that included lifetime MDD status (past and/or current MDD = lifetime MDD+, never depressed = lifetime MDD−), recording day (4), and session within day (2), the peri-burst EEG asymmetry score was the dependent variable. Only effects involving MDD status were of interest. In the absence of any significant interactions involving Lifetime MDD status, there was a main effect of Lifetime MDD status [F(1,1537.5) = 11.2, p < 0.001], with Lifetime MDD participants having significantly lower frontal asymmetry scores than never-depressed individuals. Following-up the model using current MDD status instead of Lifetime MDD status revealed a main effect of current MDD status [F(2,1492.8) = 4.9, p < 0.01], which indicated that both current and past MDD+ participants had lower peri-burst frontal EEG asymmetry scores than never-depressed controls (Figure 8), and did not differ significantly from one another.
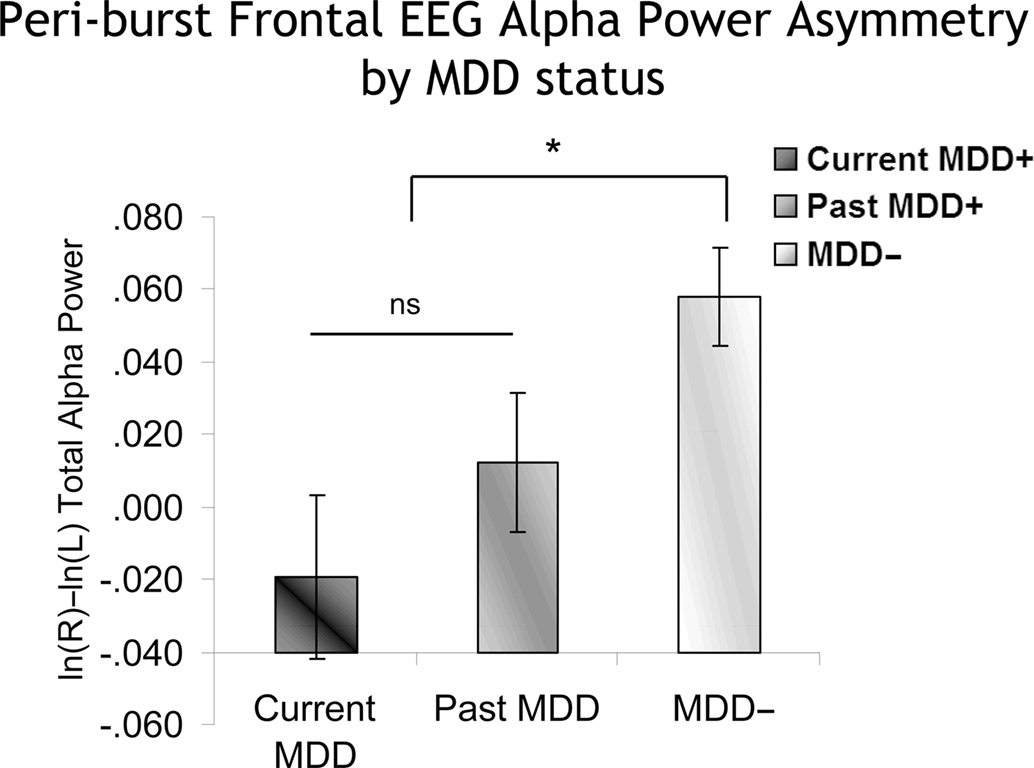
Figure 8. Peri-burst frontal alpha asymmetry scores as a function of MDD status. Error bars reflect standard error. Y-axis is ln μV2/cm2. As with conventional metrics (Figure 7), both currently and previously depressed individuals had significantly lower peri-burst asymmetry scores than never-depressed individuals.
To directly compare the conventional frontal EEG alpha asymmetry to the peri-burst alpha power asymmetry, effect sizes were computed comparing lifetime and current MDD+ groups to never-depressed controls. Table 3 shows that the effect sizes were roughly comparable for the two approaches; by computing the confidence interval for the effect size of the conventional EEG alpha asymmetry (Hedges and Olkin, 1985), the effect size for peri-burst alpha asymmetry was well within the confidence interval of the conventional alpha power asymmetry for each of the effects sizes in Table 3. Thus the novel metrics do not incur any disadvantage in terms of reduced effect size for discriminating depressed from non-depressed participants.
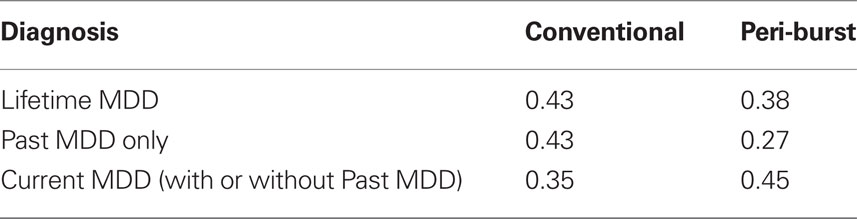
Table 3. Effect sizes (Cohen’s d) comparing depressed groups to never-depressed controls.
Number of negative and positive bursts
The number of positive and negative bursts was also examined, in two separate models, one for positive and one for negative bursts. Each model included lifetime MDD status (past and/or current MDD = lifetime MDD+, never depressed = lifetime MDD−), recording day (4), and session within day (2), and the number of bursts was the dependent variable. Only effects involving MDD status were of interest. For negative bursts, in the absence of any significant interactions involving Lifetime MDD status, there was a main effect of Lifetime MDD status [F(1,1608.2) = 7.7, p < 0.01], with Lifetime MDD participants having significantly more negative bursts than never-depressed individuals. Following-up the model using current MDD status instead of Lifetime MDD status revealed a main effect of current MDD status [F(2,1558.7) = 4.1, p < 0.02], which indicated that both current and past MDD+ participants had a greater number of negative bursts than never-depressed controls (Figure 9), and did not differ significantly from one another. For positive bursts, no significant effects involving either lifetime or current MDD status emerged.
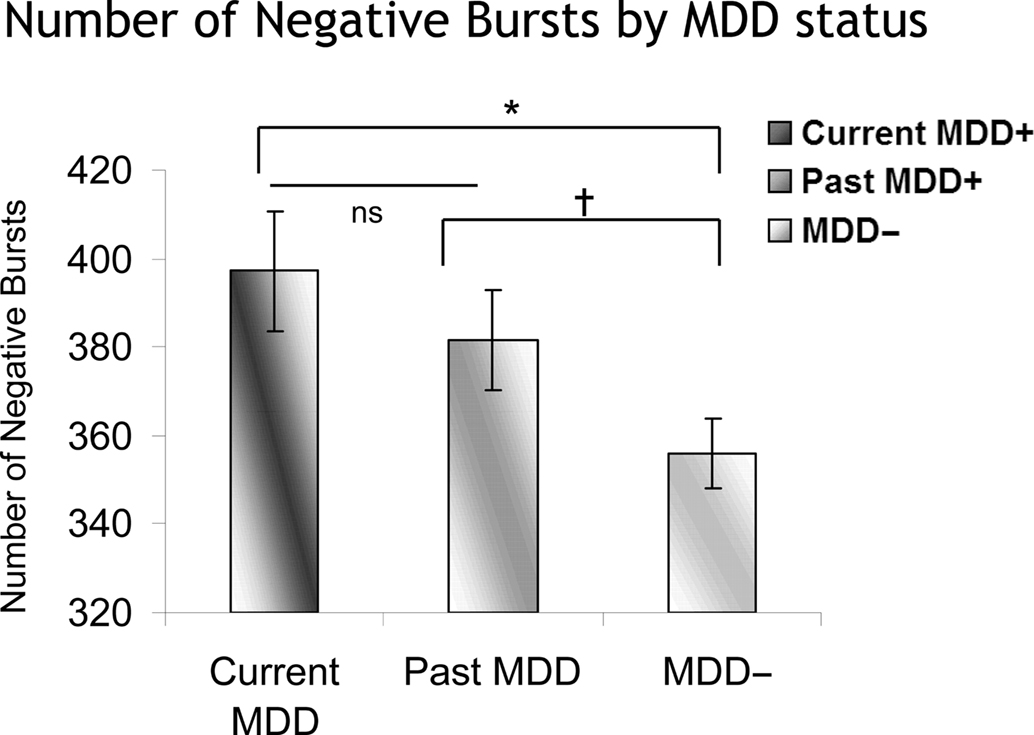
Figure 9. Number of negative bursts as a function of MDD status. Error bars reflect standard error. Both currently and previously depressed individuals had significantly more negative bursts than never-depressed individuals. *p < 0.05; †p < 0.07.
Inter-burst phase coherence
Inter-burst phase coherence was examined in a slightly different model, as an asymmetry score based on phase coherence had no analog in the conventional EEG asymmetry literature. Thus, peri-burst phase coherence values at each site were examined in a model that included lifetime MDD status (past and/or current MDD = lifetime MDD+, never depressed = lifetime MDD−), recording day (4), session within day (2), burst direction (positive/negative) and hemisphere (Left = F5, Right = F6) as factors. Interactions involving Day or Session were not of interest and were not specified in the model in the interest of parsimony. Only effects involving MDD status were of interest and thus reported. In the absence of any significant interactions involving Lifetime MDD status, there was a main effect of Lifetime MDD status [F(1,11071.7) = 9.8, p < 0.001], with Lifetime MDD participants having significantly higher peri-burst phase coherence than never-depressed individuals. This indicates that the fine timing of alpha activity surrounding alpha bursts is more consistent over repeated bursts in MDD+ individuals compared to that of MDD− individuals.
Following-up the model using current MDD status instead of Lifetime MDD status again revealed a main effect of MDD status [F(2,10832.0) = 6.1, p < 0.01], but in this model with current MDD status, this main effect was further qualified by both MDD by burst direction [F(2,10827.9) = 5.9, p < 0.01] and MDD by burst direction by hemisphere [F(2,10827.9) = 3.2, p < 0.05] interactions. This interaction was decomposed by examining positive and negative bursts separately. For negative bursts, no significant effects involving current MDD status emerged. By contrast, for positive bursts, and as depicted in Figure 10, there was a significant main effect of current MDD status [F(2,5342.2) = 10.3, p < 0.001] and also a significant Current MDD Status by hemisphere interaction [F(2,5440.0) = 7.1, p = 0.001]. Greater inter-burst phase coherence was seen among currently depressed participants compared to previously and never-depressed participants, but only at the left hemisphere site during positive bursts.
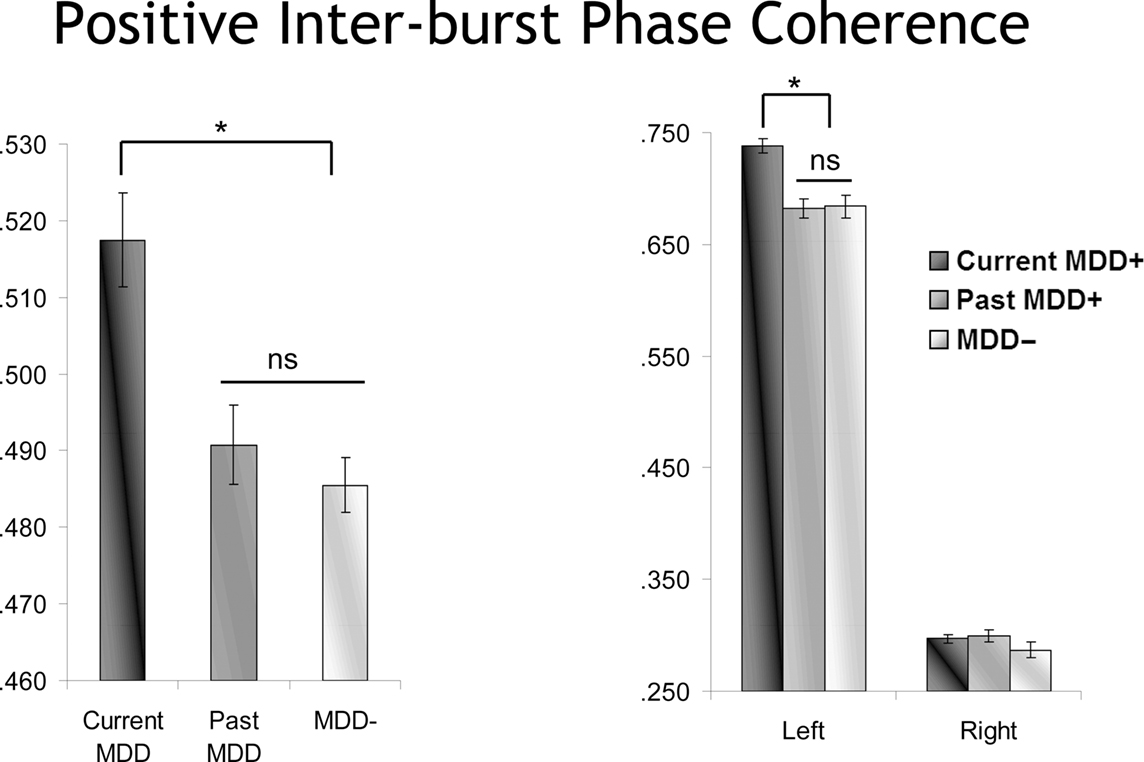
Figure 10. Inter-burst phase coherence as a function of MDD status for positive bursts. The effect of MDD status is episode dependent, with only currently depressed individuals showing enhanced inter-burst phase coherence, and only for left frontal activity.
EEG Dynamics Surrounding Asymmetry Bursts
The previous sets of analyses demonstrate that transient asymmetry bursts are correlated with conventional measures of asymmetry and are related to current and past depression in similar ways as are conventional measures. Thus, transient asymmetry bursts may potentially open new doors for examining the neural dynamics that underlie frontal asymmetry, while maintaining a link to clinically relevant outcome measures. Our initial investigations focus on time-frequency dynamics in the power (amplitude of signal) and phase (timing of oscillations) of oscillations before and after bursts, and also the topographical distributions of these effects. Although exploratory in nature, the large N ensures that these patterns are robust across individuals.
Topography of peri-burst alpha power and inter-burst phase coherence
We first examined the topographical distribution of alpha characteristics in the time frame surrounding bursts. Figure 11 displays topographical distributions of the peri-burst dynamics for alpha oscillation power and alpha oscillation inter-burst phase coherence (the extent to which alpha oscillations have the same phase value over many bursts), separately for positive and negative bursts. Two features of these topographies are striking: First, each burst is characterized by a topographically focal inverse relationship between alpha power at F5 and F6, the sites that comprise the time-varying asymmetry waveform from which bursts were identified. Second, the bursts, which are defined solely on the basis of relative left-vs.-right hemisphere power, are accompanied by strong inter-burst phase coherence in the hemisphere that shows alpha suppression.
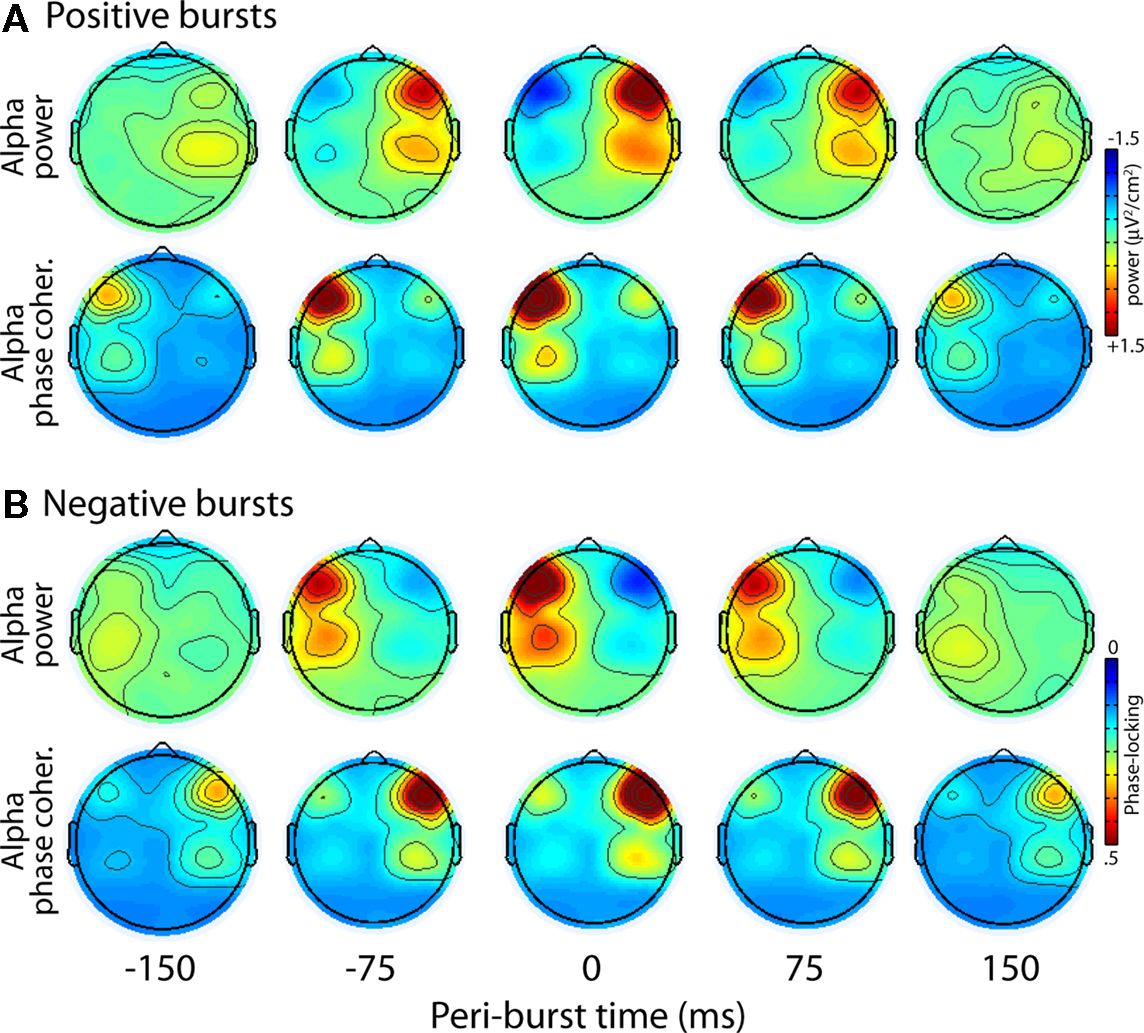
Figure 11. Topographical distribution of positive (A) and negative (B) bursts for alpha oscillation power and alpha oscillation inter-burst phase coherence.
Temporal dynamics of peri-burst alpha power and inter-burst phase coherence
The temporal dynamics of power and inter-burst phase coherence can also be seen in Figure 12. These dynamics begin approximately 200 ms (about two alpha cycles) prior to and decay approximately 200 ms following each burst. This enhancement of contralateral phase coherence may lead to the seemingly paradoxical observation that event-related potentials (Figure 12C) appear to contain more alpha activity in the contralateral hemisphere. That is, the burst-phase-locked alpha activity (giving rise to event-related potentials) is strongest when total peri-burst alpha power actually decreases. This effect was more pronounced in the right hemisphere compared to the left hemisphere (Figures 12A,C). The robust alpha in the event-related potentials in Figure 12C is striking considering no temporal filters were applied to the data.
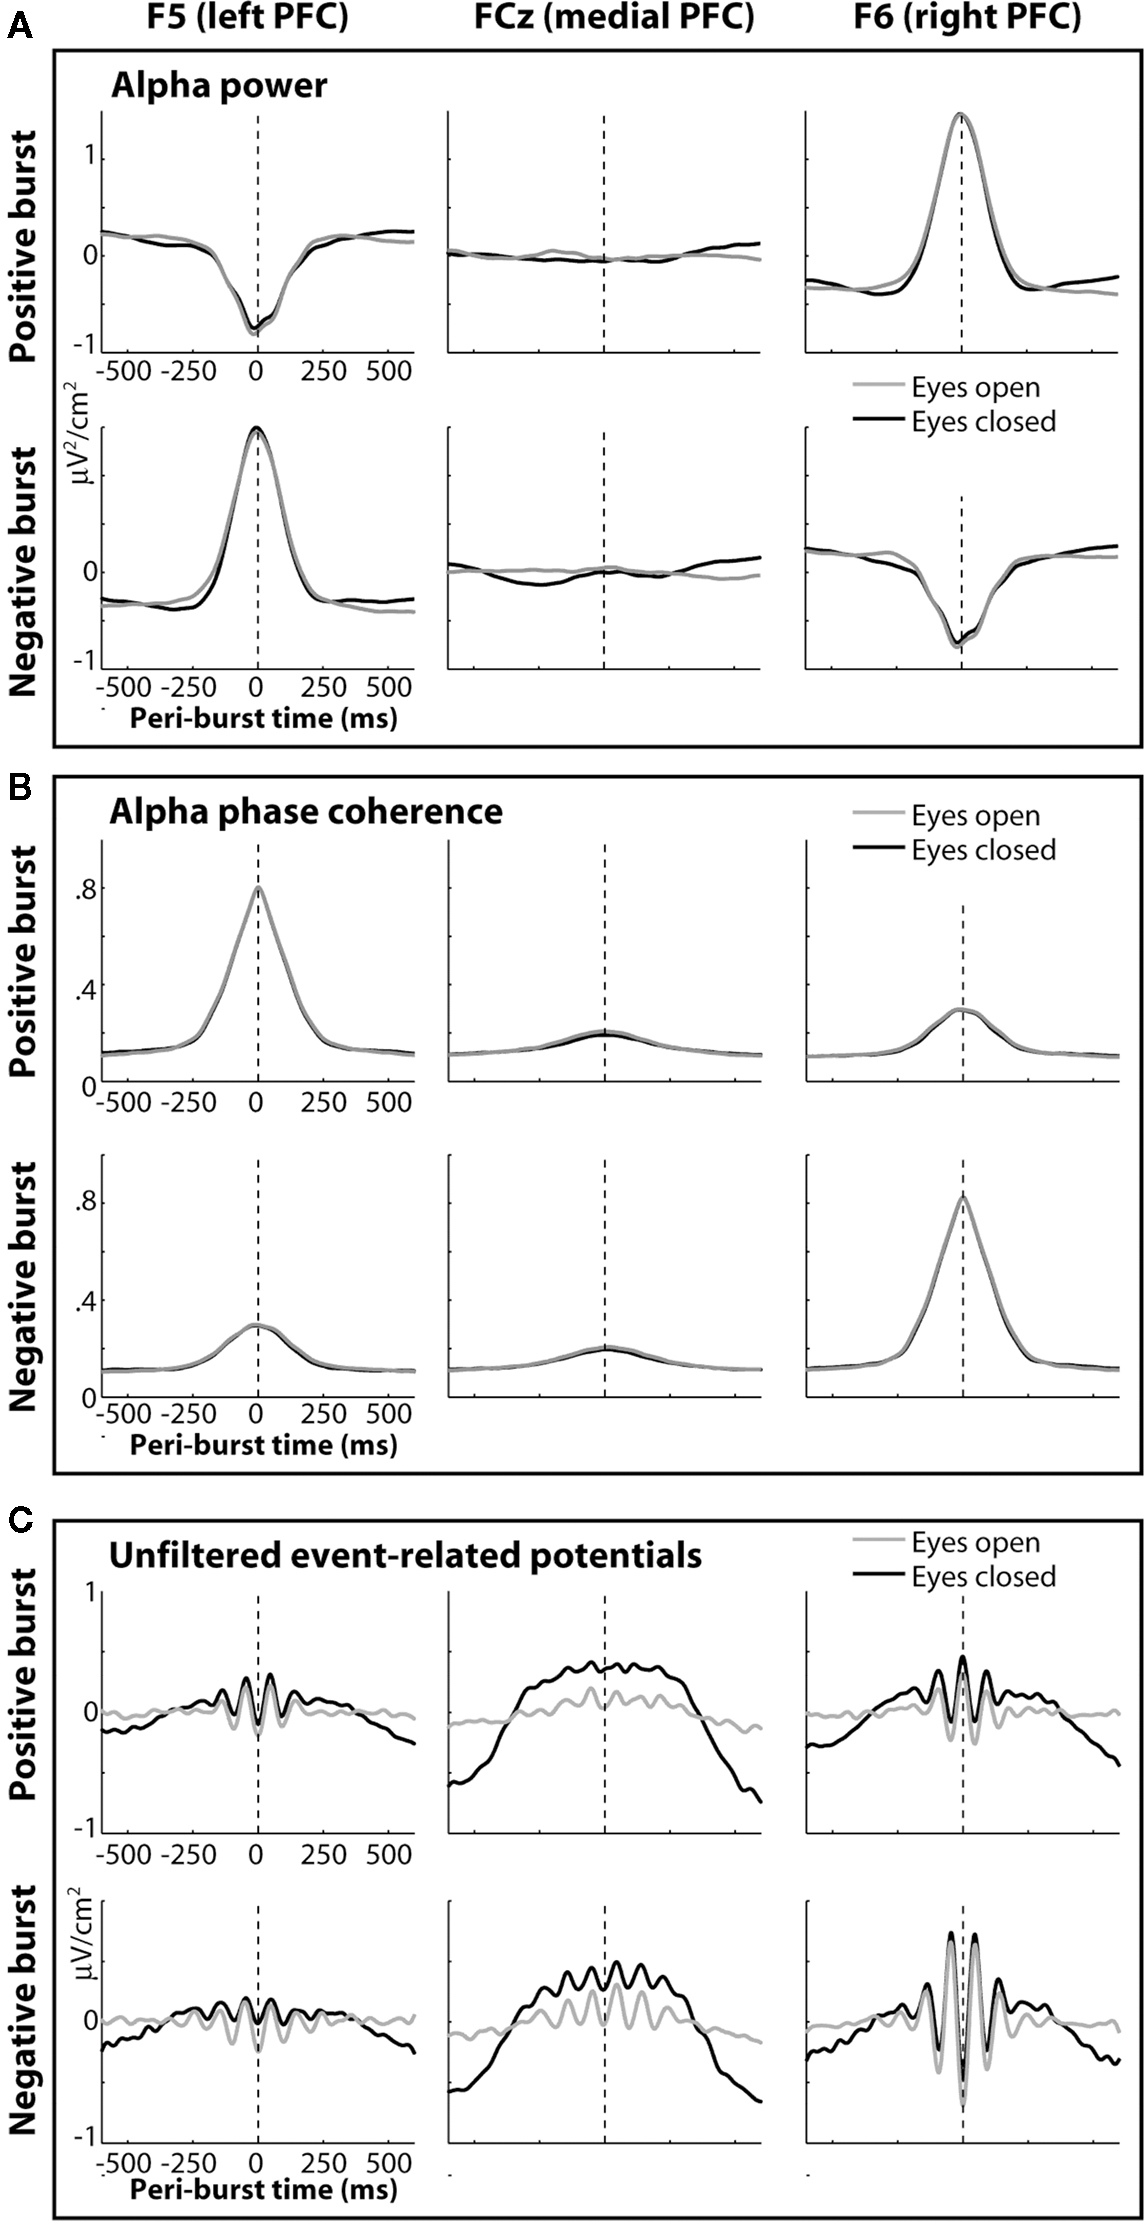
Figure 12. The temporal dynamics of power and inter-burst phase coherence for left (F5) medial (FCz) and right (F6) loci. Bursts were defined based on the power difference ln(F6)−ln(F5), with positive bursts representing extreme positive values on this metric, and negative bursts representing extreme negative values on this metric. (A) displays peri-burst alpha power; (B) displays inter-burst phase coherence; (C) displays event-related potentials, created by time-locking unfiltered EEG to each burst.
Peri-burst oscillatory dynamics
Finally, we examined the oscillatory dynamics in a broader frequency range through wavelet convolution techniques. Note that because the entire time period (−500 to +500 ms) was used for decibel conversion, in/decreases in peri-burst alpha power imply a relative de/increase in alpha power before and after the burst. As depicted in Figure 13, clear alpha modulation surrounds each burst, with F5 and F6 revealing effects of similar size but opposite direction. As also shown in the figure, there were lower theta-band dynamics that were similar at both F5 and F6, during both positive and negative bursts. Although blinks were rejected from the raw data prior to any signal processing, we suspected that given the low-frequency and ubiquitous nature of these lower theta-band dynamics, that they may be ocular in origin. Thus we examined oscillatory dynamics separately for bursts that occurred during eyes-open and eyes-closed resting periods. As shown in Figure 14, the site-specific alpha-band dynamics are highly consistent across eyes-open and eyes-closed resting periods, but the lower theta-band dynamics predominate only when eyes are open, with a relative theta-band suppression accompanying both positive and negative bursts.
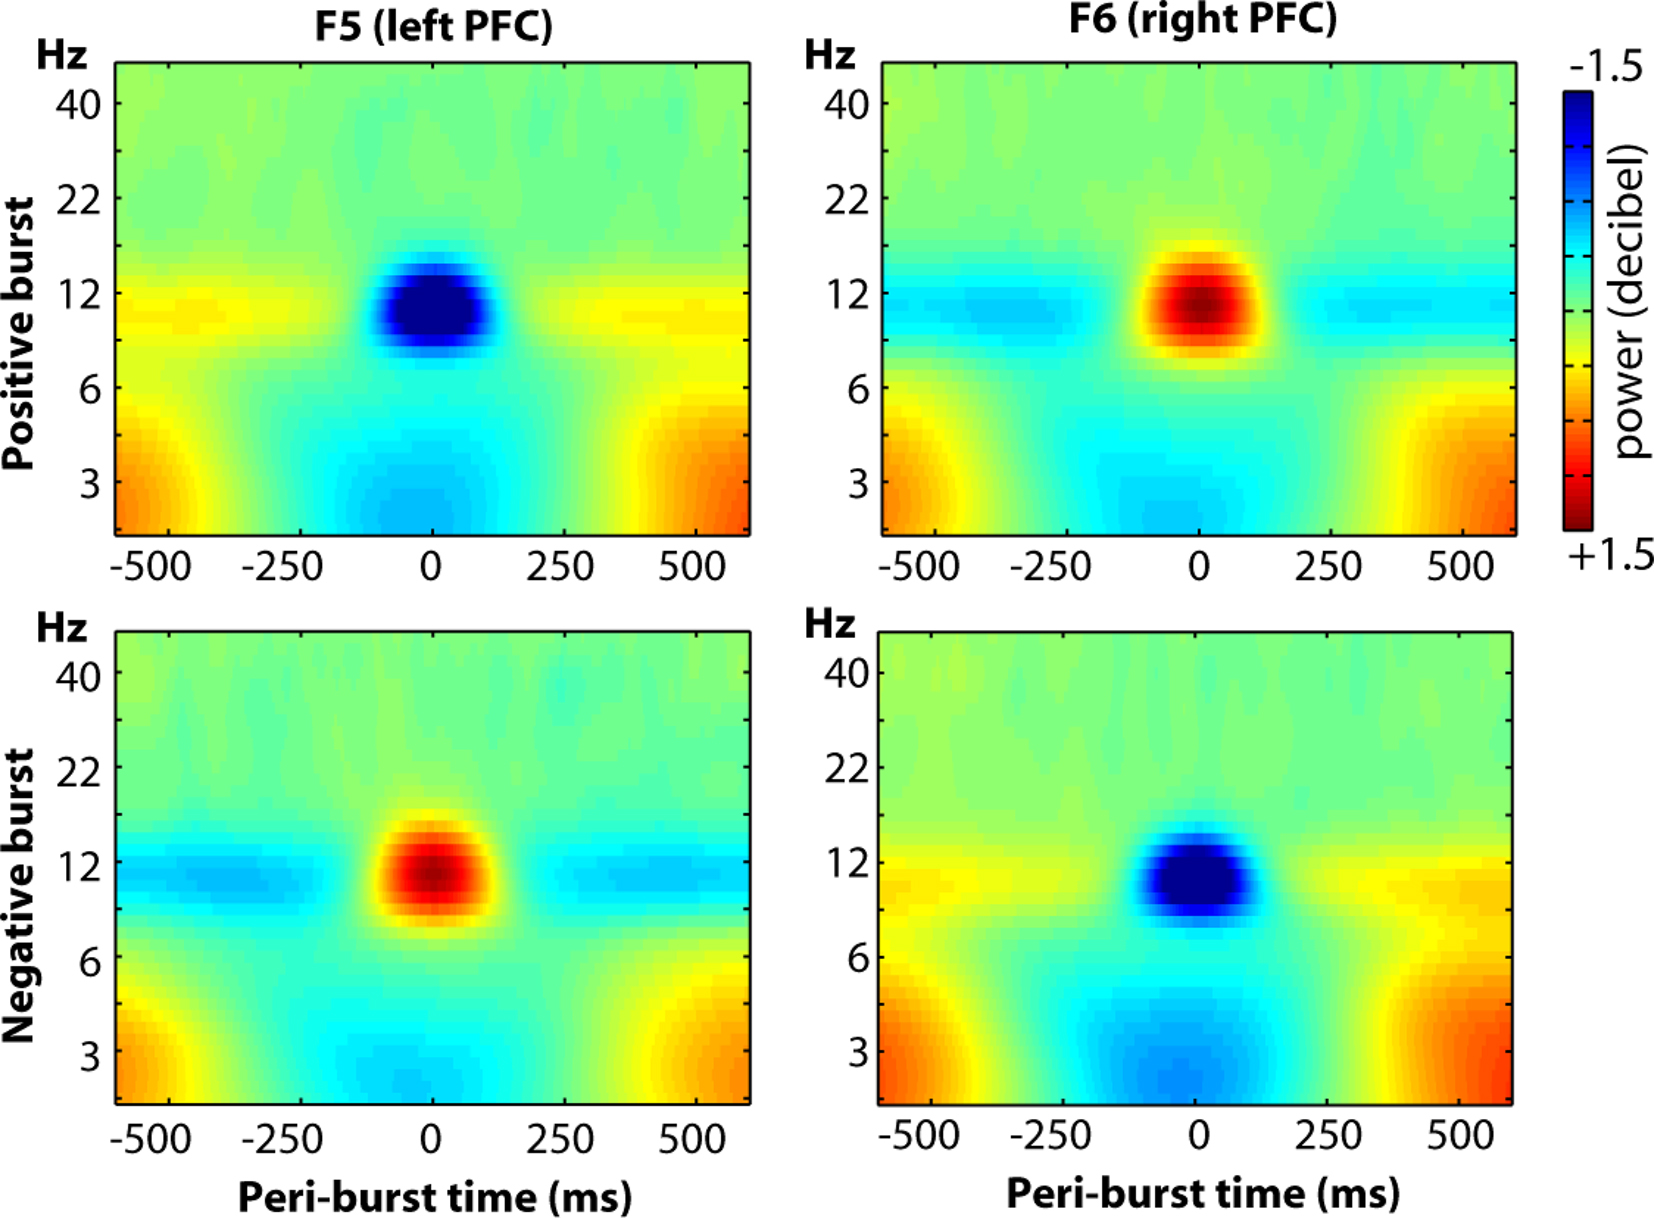
Figure 13. The oscillatory dynamics of a wider frequency range for sites F5 and F6, displayed as a function of positive and negative bursts.
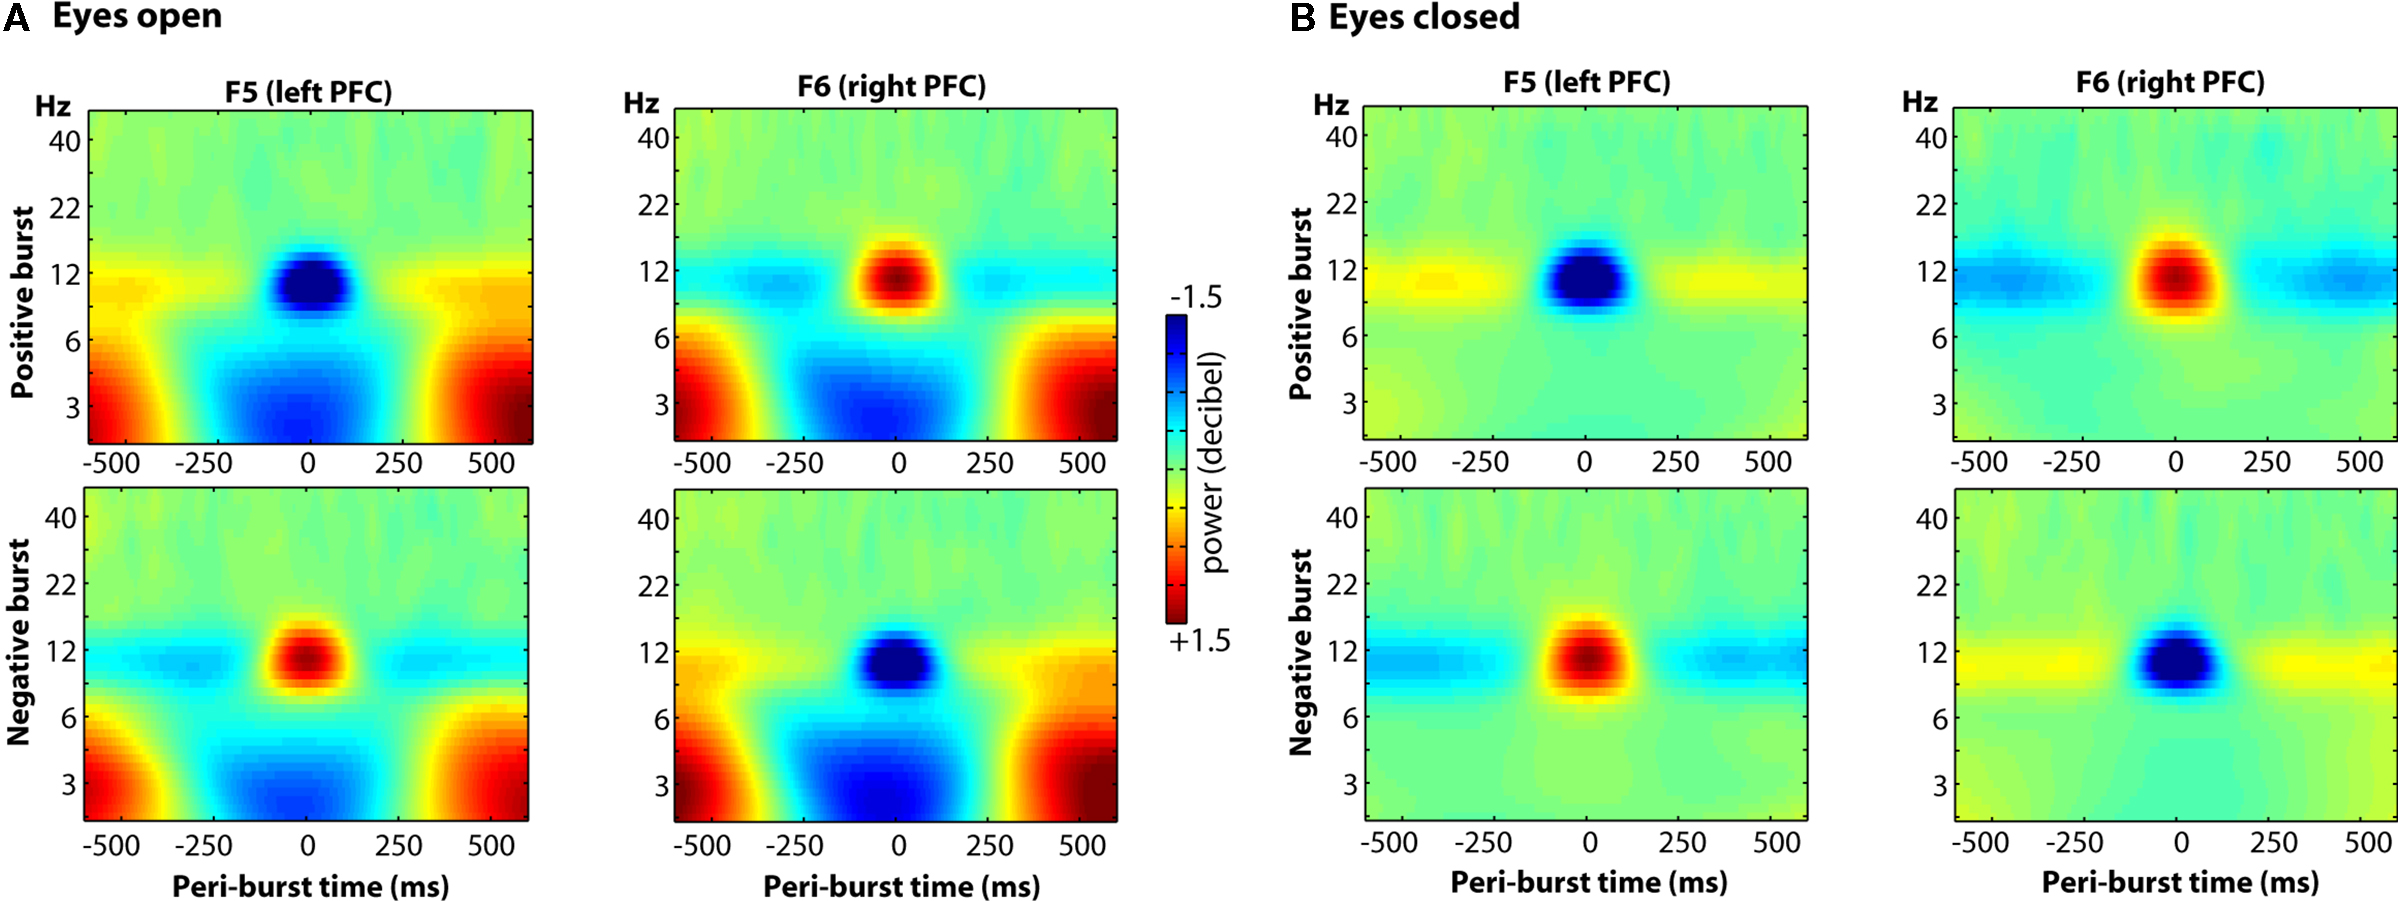
Figure 14. The oscillatory dynamics of a wider frequency range for sites F5 and F6, as a function of positive and negative bursts, depicted separately for eyes-open and eyes-closed epochs. Clear alpha modulation surrounds each burst, with F5 and F6 revealing effects of similar size but opposite direction. These effects are highly consistent across both eyes-open (A) and eyes-closed (B) conditions, but a relative theta-band suppression accompanying both positive and negative bursts is seen only in the eyes-open (A) condition.
To examine more specifically the topography of the lower theta-band peri-burst suppression, Figure 15 shows the scalp topography of theta-band (4–7 Hz) power preceding and following the bursts. The topography is highly consistent for both positive and negative bursts, with relative theta-band suppression occurring surrounding the time of the alpha asymmetry bursts.
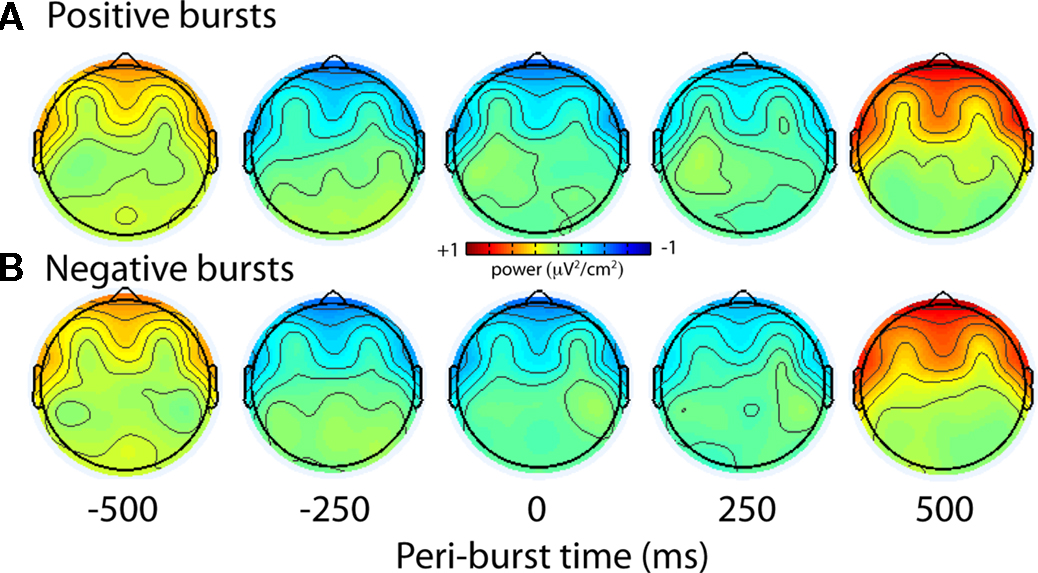
Figure 15. Topographical distribution of theta (4–7 Hz) activity during eyes-open condition. The scalp topography of theta-band (4–7 Hz) power preceding and following the bursts is highly consistent for both positive (A) and negative (B) bursts, with relative theta-band suppression occurring at frontal and lateral frontal regions surrounding the time of the alpha asymmetry bursts.
Discussion
Conventional FFT-based approaches to the analysis of frontal EEG asymmetry acquired during the resting-state produce metrics that lack temporal and spatial precision. As an initial endeavor to improve both the temporal and spatial precision by which frontal EEG asymmetry is assessed, we present metrics that capture a recurrent dynamic endogenous neural process – asymmetry bursts – that transpires during the lengthy resting-state. Moreover, these metrics were based on a CSD transformation, which had advantages for time-frequency dynamics at the level of the scalp (Cavanagh et al., 2009; Cohen et al., 2009a). These metrics, although reflecting a distinct minority of the resting assessment period, nonetheless account for a substantial proportion of variance in the conventional metrics that sum across the entire interval.
Peri-burst alpha power was found to be relatively closely related to conventional FFT-derived alpha power, at constituent target sites F5 and F6, as well as in terms of asymmetry in alpha power between F5 and F6. In the latter case of power asymmetry, peri-burst alpha power asymmetry, which represented but a small fraction (1%) of the total resting period, accounted for 42% of the variance in FFT-derived alpha power asymmetry across the entire resting period. Moreover, peri-burst alpha asymmetry, like FFT-derived alpha power asymmetry, was sensitive to a history of major depression, with both current and previously depressed individuals showing relatively lower scores, indicating greater relative left frontal alpha and by inference less left frontal activity, than never-depressed individuals. Thus peri-burst alpha power asymmetry is consistent with a rather sizable literature linking altered frontal EEG asymmetry to emotion and depression (Coan and Allen, 2004; Thibodeau et al., 2006), yet as a temporally more sensitive measure, peri-burst alpha power asymmetry holds the promise that future investigations may uncover more precisely what transpires in terms of neural dynamics that ultimately may create risk for depression.
The inter-burst phase metrics were also sensitive to MDD status, and in this case only to current, but not past, MDD status, and only over left frontal cortex during positive bursts. The findings with inter-burst phase coherence were exploratory but provocative, and further suggest altered neural dynamics in left frontal cortex as a feature of MDD, consistent with findings using a wide variety of methodologies including EEG (Coan and Allen, 2004; Thibodeau et al., 2006), positron emission tomography (e.g., Bench et al., 1993), and transcranial magnetic stimulation (e.g., George et al., 2010). The functional significance of the inter-burst phase metrics in MDD must await future research, but the specificity to current MDD suggests that such measures might be worth exploring within the context of treatment studies to observe is successful treatment is reflected in normalized inter-burst phase coherence, and whether baseline inter-burst phase coherence might predict treatment response. These findings also further highlight the rich temporal dynamics of the endogenous processes that underlie conventional FFT-based metrics to studying frontal asymmetry.
This initial investigation into characterizing the neural dynamics surrounding the bursts indicates that the asymmetry bursts are characterized by a transient lateralized alpha suppression that shows a highly consistent phase relationship across bursts, and a concurrent contralateral transient alpha enhancement that is less tightly phase-locked across bursts. These findings may be similar to those seen in event-related desynchronization investigations (e.g., Pfurtscheller, 1992), where regions involved in active processing show alpha suppression (desynchronization) while regions uninvolved in such processing show alpha enhancement (event-related synchronization; e.g., Pfurtscheller, 1992). Indeed, alpha has been implicated in the active suppression of irrelevant or distracting information during active task engagement (Klimesch et al., 2007; van Dijk et al., 2008). Speculatively, then, the recurrent burst-related alpha suppression may reflect recurrent bouts of active lateralized cortical processing across analogous frontal regions. In absence of an active task it is challenging to link these dynamics to specific cognitive/emotional processes; simultaneous autonomic recordings may help (e.g., to examine whether pupillary or cardiac responses coincide with asymmetry bursts). Examining such asymmetry bursts during specific cognitive tasks may also help elucidate candidate mental operations that underlie bursts. Nonetheless, the fact that the alpha suppression is particularly tightly phase-locked across bursts raises the possibility that the lateralized alpha suppression may drive or regulate cortical processing. It is possible that the reach of frontal alpha bursts extends beyond frontal cortical areas. For example, the human nucleus accumbens exhibits strong alpha-linked cross-frequency coupling, such that transient increases in gamma power occur preferentially at specific phases of nucleus accumbens alpha oscillations (Cohen et al., 2009b). Nucleus accumbens alpha was also phase-synchronized with frontal cortical alpha (unpublished observations in that same dataset), suggesting the possibility that alpha asymmetry dynamics regulate active processing in the ventral striatum, which has been implicated in depression and is one of the main targets for deep-brain-stimulation treatment of major depression (Schlaepfer et al., 2008).
We observed a decrease in theta activity at anterior frontal and lateral sites during alpha asymmetry bursts only during eyes-open condition. Although we cannot completely rule out that ocular activity contributed to these dynamics, they do not appear to be entirely driven by eye movements, for the following reasons: epochs with blinks were removed from the data, the extreme lateral and medial frontal spatial components are atypical of eye movements, and non-blink oculomotor artifacts in EEG have been associated with higher frequency (gamma) power (Yuval-Greenberg et al., 2008) and nose-reference (we used a CSD reference, which is a local referencing scheme and therefore minimizes contribution of ocular artifacts on EEG electrodes). Importantly, it is clear from both Figures 13 and 14 that the lower theta-band effects do not extend into the alpha range, suggesting that the peri-burst alpha effects observed here are not influenced by the lower frequency modulations during eyes-open conditions, and, moreover, the alpha-band dynamics are robust during both eyes-open and eyes-closed conditions.
In the spirit of exploration, the present investigation may raise more questions than it answers, but it also lays a foundation for new directions in research on resting-state frontal brain asymmetry. The novel metrics presented here retain the advantage of the conventional metrics in terms of accounting for substantial variance in the conventional metrics and retaining sensitivity to a history of major depression, but these metrics provide the possibility to examine the spatio-temporal dynamics of brain activity that may underlie the resting-state, and thus give rise to risk for depression. Moreover, the ability to characterize specific relevant time points within the ongoing resting-state provides the possibility to utilize EEG-defined events, in the form of asymmetry bursts, to define time windows of interest with other concurrent imaging modalities that may reveal clues as to the localized origin of these bursts (e.g., concurrent fMRI, or ICA decomposition of EEG surrounding bursts), as well as autonomic and behavioral correlates of these recurrent endogenous events. The promise of this approach is bolstered by a recent investigation linking EEG-defined microstates to BOLD activation patterns, many within the widely studied resting-state networks (Musso et al., 2010). Alpha burst-driven transcranial magnetic stimulation may also be an important avenue of exploration not only for examining the neural dynamics surrounding bursts, but also as a possible improvement over TMS-guided depression treatment (e.g., Schutter, 2009; George et al., 2010).
The present approach is illustrative for future investigations of resting-state brain activity, including those utilizing frontal EEG asymmetry as well as other approaches such as fMRI investigations of resting-state activity (e.g., “default mode network,” Raichle et al., 2001; Smith et al., 2009). Although much has been gleaned about neural systems under tightly controlled exogenous presentation of experimental stimuli, there remains much to be learned about how the brain functions under its own endogenous control. The resting-state approaches have gained some traction in that pursuit, but have also suffered from the virtually inevitable decrease in precision that accompanies investigating lengthy uncontrolled time periods. By parsing relatively long resting time periods according to meaningful and recurrent endogenous signals such as asymmetry bursts or autonomic responses (e.g., Critchley et al., 2002; Siegle et al., 2003), or perhaps patterns of interconnectivity using the BOLD signal (cf., De Luca et al., 2006), greater progress in the elucidation of the neural basis of endogenous brain activity may be possible. It is with that hope that we offer the present exploration with endogenous EEG alpha asymmetry bursts.
Conflict of Interest Statement
The authors declare that the research was conducted in the absence of any commercial or financial relationships that could be construed as a potential conflict of interest.
Acknowledgments
This research was supported in part by grants from the National Institutes of Health (R01 MH066902) and the National Alliance for Research on Schizophrenia and Depression (NARSAD) to John Allen, and by a VIDI grant from the Dutch Organization for Scientific Research (NWO) to Michael Cohen. The authors wish to thank Jennifer Stewart and David Towers for their tireless assistance with data management and reduction, and to thank Andrew Bismark, Craig Santerre, Eynav Accortt, Amanda Brody, Jay Hegde, Eliza Fergerson, Jamie Velo, Dara Halpern, and myriad research assistants for their help on this project.
Footnotes
- ^A subsequent re-analysis using a 5% cutoff yielded nearly identical results.
- ^Matlab scripts to process data using these steps are available from www.psychofizz.org or from the authors. These scripts work with data imported to Matlab using the EEGLab data structure (Delorme and Makeig, 2004).
References
Accortt, E. E., and Allen, J. J. (2006). Frontal EEG asymmetry and premenstrual dysphoric symptomatology. J. Abnorm. Psychol. 115, 179–184.
Allen, J. J., Harmon-Jones, E., and Cavender, J. H. (2001). Manipulation of frontal EEG asymmetry through biofeedback alters self-reported emotional responses and facial EMG. Psychophysiology 38, 685–693.
Allen, J. J., Iacono, W. G., Depue, R. A., and Arbisi, P. (1993). Regional electroencephalographic asymmetries in bipolar seasonal affective disorder before and after exposure to bright light. Biol. Psychiatry 33, 642–646.
Allen, J. J., and Kline, J. P. (2004). Frontal EEG asymmetry, emotion, and psychopathology: the first, and the next 25 years. Biol. Psychol. 67, 1–5.
Allen, J. J. B., Coan, J. A., and Nazarian, M. (2004a). Issues and assumptions on the road from raw signals to metrics of frontal EEG asymmetry in emotion. Biol. Psychol. 67, 183–218.
Allen, J. J. B., Urry, H. L., Hitt, S. K., and Coan, J. A. (2004b). The stability of resting frontal electroencephalographic asymmetry in depression. Psychophysiology 41, 269–280.
Anokhin, A. P., Heath, A. C., and Myers, E. (2006). Genetic and environmental influences on frontal EEG asymmetry: a twin study. Biol. Psychol. 71, 289–295.
Baehr, E., Rosenfeld, J. P., Baehr, R., and Earnest, C. (1998). Comparison of two EEG asymmetry indices in depressed patients vs. normal controls. Int. J. Psychophysiol. 31, 89–92.
Bagiella, E., Sloan, R. P., and Heitjan, D. F. (2000). Mixed-effects models in psychophysiology. Psychophysiology 37, 13–20.
Beck, A. T., Steer, R. A., and Brown, G. K. (1996). Manual for the Beck Depression Inventory-II. San Antonio, TX: Psychological Corporation.
Beck, A. T., Ward, C. H., Mendelson, M., Mock, J., and Erbaugh, J. (1961). An inventory for measuring depression. Arch. Gen. Psychiatry 4, 561–571.
Bench, C. J., Friston, K. J., Brown, R. G., Frackowiak, R. S., and Dolan, R. J. (1993). Regional cerebral blood flow in depression measured by positron emission tomography: the relationship with clinical dimensions. Psychol. Med. 23, 579–590.
Bruder, G. E., Fong, R., Tenke, C. E., Leite, P., Towey, J. P., and Stewart, J. E. (1997). Regional brain asymmetries in major depression with or without an anxiety disorder: a quantitative electroencephalographic study. Biol. Psychiatry 41, 939–948.
Cacioppo, J. T. (2004). Feelings and emotions: roles for electrophysiological markers. Biol. Psychol. 67, 235–243.
Cavanagh, J. F., Cohen, M. X., and Allen, J. J. (2009). Prelude to and resolution of an error: EEG phase synchrony reveals cognitive control dynamics during action monitoring. J. Neurosci. 29, 98–105.
Coan, J. A., and Allen, J. J. (2004). Frontal EEG asymmetry as a moderator and mediator of emotion. Biol. Psychol. 67, 7–49.
Coan, J. A., Allen, J. J., and McKnight, P. E. (2006). A capability model of individual differences in frontal EEG asymmetry. Biol. Psychol. 72, 198–207.
Cohen, M. X., van Gaal, S., Ridderinkhof, K. R., and Lamme, V. A. (2009a). Unconscious errors enhance prefrontal-occipital oscillatory synchrony. Front. Hum. Neurosci. 3:54. doi: 10.3389/neuro.09.054.2009.
Cohen, M. X., Axmacher, N., Lenartz, D., Elger, C. E., Sturm, V., and Schlaepfer, T. E. (2009b). Good vibrations: cross-frequency coupling in the human nucleus accumbens during reward processing. J. Cogn. Neurosci. 21, 875–889.
Critchley, H. D., Melmed, R. N., Featherstone, E., Mathias, C. J., and Dolan, R. J. (2002). Volitional control of autonomic arousal: a functional magnetic resonance study. Neuroimage 16, 909–919.
Davidson, R. J. (1998a). Anterior electrophysiological asymmetries, emotion, and depression: conceptual and methodological conundrums. Psychophysiology 35, 607–614.
Davidson, R. J. (1998b). Affective style and affective disorders: perspectives from affective neuroscience. Cogn. Emot. 12, 307–330.
Davidson, R. J. (2004). What does the prefrontal cortex “do” in affect: perspectives on frontal EEG asymmetry research. Biol. Psychol. 67, 219–233.
Davidson, R. J., Coe, C. C., Dolski, I., and Donzella, B. (1999). Individual differences in prefrontal activation asymmetry predict natural killer cell activity at rest and in response to challenge. Brain Behav. Immun. 13, 93–108.
Davidson, R. J., Marshall, J. R., Tomarken, A. J., and Henriques, J. B. (2000). While a phobic waits: regional brain electrical and autonomic activity in social phobics during anticipation of public speaking. Biol. Psychiatry 47, 85–95.
Dawson, G., Frey, K., Panagiotides, H., Osterling, J., and Hessl, D. (1997). Infants of depressed mothers exhibit atypical frontal brain activity: a replication and extension of previous findings. J. Child. Psychol. Psychiatry 38, 179–186.
Dawson, G., Frey, K., Panagiotides, H., Yamada, E., Hessl, D., and Osterling, J. (1999). Infants of depressed mothers exhibit atypical frontal electrical brain activity during interactions with mother and with a familiar, nondepressed adult. Child Dev. 70, 1058–1066.
De Luca, M., Beckmann, C. F., De Stefano, N., Matthews, P. M., and Smith, S. M. (2006). fMRI resting state networks define distinct modes of long-distance interactions in the human brain. Neuroimage 29, 1359–1367.
Debener, S., Beauducel, A., Nessler, D., Brocke, B., Heilemann, H., and Kayser, J. (2000). Is resting anterior EEG alpha asymmetry a trait marker for depression? Findings for healthy adults and clinically depressed patients. Neuropsychobiology 41, 31–37.
Delorme, A., and Makeig, S. (2004). EEGLAB: an open source toolbox for analysis of single-trial EEG dynamics including independent component analysis. J. Neurosci. Methods 134, 9–21.
Diego, M. A., Jones, N. A., and Field, T. (2010). EEG in 1-week, 1-month and 3-month-old infants of depressed and non-depressed mothers. Biol. Psychol. 83, 7–14.
First, M. B., Spitzer, R. L., Gibbon, M., and Williams, J. B. W. (November, 2002). Structured Clinical Interview for DSM-IV-TR Axis I Disorders, Research Version, Non-patient Edition (SCID-I/NP) New York: Biometrics Research, New York State Psychiatric Institute.
Fox, N. A., Rubin, K. H., Calkins, S. D., Marshall, T. R., Coplan, R. J., Porges, S. W., Long, J. M., and Stewart, S. (1995). Frontal activation asymmetry and social competence at four years of age. Child Dev. 66, 1770–1784.
George, M. S., Lisanby, S. H., Avery, D., McDonald, W. M., Durkalski, V., Pavlicova, M., Anderson, B., Nahas, Z., Bulow, P., Zarkowski, P., Holtzheimer, P. E. III, Schwartz, T., and Sackeim, H. A. (2010). Daily left prefrontal transcranial magnetic stimulation therapy for major depressive disorder: a sham-controlled randomized trial. Arch. Gen. Psychiatry 67, 507–516.
Gotlib, I. H., Ranganath, C., and Rosenfeld, J. P. (1998). Frontal EEG alpha asymmetry, depression, and cognitive functioning. Cogn. Emot. 12, 449–478.
Gottesman, I. I., and Gould, T. D. (2003). The endophenotype concept in psychiatry: etymology and strategic intentions. Am. J. Psychiatry 160, 636–645.
Hagemann, D., Naumann, E., and Thayer, J. F. (2001). The quest for the EEG reference revisited: a glance from brain asymmetry research. Psychophysiology 38, 847–857.
Hagemann, D., Naumann, E., Thayer, J. F., and Bartussek, D. (2002). Does resting electroencephalograph asymmetry reflect a trait? An application of latent state-trait theory. J. Pers. Soc. Psychol. 82, 619–641.
Handel, B. F., Haarmeier, T., and Jensen, O. (2010). Alpha oscillations correlate with the successful inhibition of unattended stimuli. J. Cogn. Neurosci. doi: 10.1162/jocn.2010.21557. [Epub ahead of print].
Henriques, J. B., and Davidson, R. J. (1990). Regional brain electrical asymmetries discriminate between previously depressed and healthy control subjects. J. Abnorm. Psychol. 99, 22–31.
Henriques, J. B., and Davidson, R. J. (1991). Left frontal hypoactivation in depression. J. Abnorm. Psychol. 100, 535–545.
Iacono, W. G. (1998). Identifying psychophysiological risk for psychopathology: examples from substance abuse and schizophrenia research. Psychophysiology 35, 621–637.
Jones, N. A., Field, T., Fox, N. A., Lundy, B., and Davalos, M. (1997). EEG activation in 1-month-old infants of depressed mothers. Dev. Psychopathol. 9, 491–505.
Kang, D. H., Davidson, R. J., Coe, C. L., Wheeler, R. W., Tomarken, A. J., and Ershler, W. B. (1991). Frontal brain asymmetry and immune function. Behav. Neurosci. 105, 860–869.
Kayser, J., and Tenke, C. E. (2006a). Principal components analysis of Laplacian waveforms as a generic method for identifying ERP generator patterns: I. Evaluation with auditory oddball tasks. Clin. Neurophysiol. 117, 348–368.
Kayser, J., and Tenke, C. E. (2006b). Principal components analysis of Laplacian waveforms as a generic method for identifying ERP generator patterns: II. Adequacy of low-density estimates. Clin. Neurophysiol. 117, 369–380.
Klimesch, W., Sauseng, P., and Hanslmayr, S. (2007). EEG alpha oscillations: the inhibition-timing hypothesis. Brain Res. Rev. 53, 63–88.
Mathersul, D., Williams, L. M., Hopkinson, P. J., and Kemp, A. H. (2008). Investigating models of affect: relationships among EEG alpha asymmetry, depression, and anxiety. Emotion 8, 560–572.
Musso, F., Brinkmeyer, J., Mobascher, A., Warbrick, T., and Winterer, G. (2010). Spontaneous brain activity and EEG microstates. A novel EEG/fMRI analysis approach to explore resting-state networks. Neuroimage 52, 1149–1161.
Nitschke, J. B., Heller, W., Palmieri, P. A., and Miller, G. A. (1999). Contrasting patterns of brain activity in anxious apprehension and anxious arousal. Psychophysiology 36, 628–637.
Palva, S., and Palva, J. M. (2007). New vistas for alpha-frequency band oscillations. Trends Neurosci. 30, 150–158.
Perrin, F., Bertrand, O., Giard, M. H., and Pernier, J. (1990). Precautions in topographic mapping and in evoked potential map reading. J. Clin. Neurophysiol. 7, 498–506.
Perrin, F., Pernier, J., Bertrand, O., and Echallier, J. F. (1989). Spherical splines for scalp potential and current density mapping. Electroencephalogr. Clin. Neurophysiol. 72, 184–187.
Pfurtscheller, G. (1992). Event-related synchronization (ERS): an electrophysiological correlate of cortical areas at rest. Electroencephalogr. Clin. Neurophysiol. 83, 62–69.
Pizzagalli, D. A., Nitschke, J. B., Oakes, T. R., Hendrick, A. M., Horras, K. A., Larson, C. L., Abercrombie, H. C., Schaefer, S. M., Koger, J. V., Benca, R. M., Pascual-Marqui, R. D., and Davidson, R. J. (2002). Brain electrical tomography in depression: the importance of symptom severity, anxiety, and melancholic features. Biol. Psychiatry 52, 73–85.
Raichle, M. E., MacLeod, A. M., Snyder, A. Z., Powers, W. J., Gusnard, D. A., and Shulmani, G. L. (2001). A default mode of brain function. Proc. Natl. Acad. Sci. U.S.A. 98, 676–682.
Reid, S. A., Duke, L. M., and Allen, J. J. (1998). Resting frontal electroencephalographic asymmetry in depression: inconsistencies suggest the need to identify mediating factors. Psychophysiology 35, 389–404.
Schlaepfer, T. E., Cohen, M. X., Frick, C., Kosel, M., Brodesser, D., Axmacher, N., Joe, A. Y., Kreft, M., Lenartz, D., and Sturm, V. (2008). Deep brain stimulation to reward circuitry alleviates anhedonia in refractory major depression. Neuropsychopharmacology 33, 368–377.
Schmidt, L. A., and Fox, N. A. (1994). Patterns of cortical electrophysiology and autonomic activity in adults’ shyness and sociability. Biol. Psychol. 38, 183–198.
Schutter, D. J. (2009). Antidepressant efficacy of high-frequency transcranial magnetic stimulation over the left dorsolateral prefrontal cortex in double-blind sham-controlled designs: a meta-analysis. Psychol. Med. 39, 65–75.
Siegle, G. J., Steinhauer, S. R., Stenger, V. A., Konecky, R., and Carter, C. S. (2003). Use of concurrent pupil dilation assessment to inform interpretation and analysis of fMRI data. Neuroimage 20, 114–124.
Smit, D. J., Posthuma, D., Boomsma, D. I., and De Geus, E. J. (2007). The relation between frontal EEG asymmetry and the risk for anxiety and depression. Biol. Psychol. 74, 26–33.
Smith, S. M., Fox, P. T., Miller, K. L., Glahn, D. C., Fox, P. M., Mackay, C. E., Filippini, N., Watkins, K. E., Toro, R., Laird, A. R., and Beckmann, C. F. (2009). Correspondence of the brain’s functional architecture during activation and rest. Proc. Natl. Acad. Sci. U.S.A. 106, 13040–13045.
Srinivasan, R., Nunez, P. L., Tucker, D. M., Silberstein, R. B., and Cadusch, P. J. (1996). Spatial sampling and filtering of EEG with spline laplacians to estimate cortical potentials. Brain Topogr. 8, 355–366.
Srinivasan, R., Winter, W. R., Ding, J., and Nunez, P. L. (2007). EEG and MEG coherence: measures of functional connectivity at distinct spatial scales of neocortical dynamics. J. Neurosci. Methods 166, 41–52.
Stewart, J. L., Bismark, A. W., Towers, D. N., Coan, J. A., and Allen, J. J. B. (2010). Resting frontal EEG asymmetry as an endophenotype for depression risk: sex-specific patterns of frontal brain asymmetry. J. Abnorm. Psychol. 119, 502–512.
Stewart, J. L., Levin-Silton, R., Sass, S. M., Heller, W., and Miller, G. A. (2008). Anger style, psychopathology, and regional brain activity. Emotion 8, 701–713.
Thibodeau, R., Jorgensen, R. S., and Kim, S. (2006). Depression, anxiety, and resting frontal EEG asymmetry: a meta-analytic review. J. Abnorm. Psychol. 115, 715–729.
Tomarken, A. J., Dichter, G. S., Garber, J., and Simien, C. (2004). Resting frontal brain activity: linkages to maternal depression and socio-economic status among adolescents. Biol. Psychol. 67, 77–102.
Towers, D. N., and Allen, J. J. (2009). A better estimate of the internal consistency reliability of frontal EEG asymmetry scores. Psychophysiology 46, 132–142.
Urry, H. L., Nitschke, J. B., Dolski, I., Jackson, D. C., Dalton, K. M., Mueller, C. J., Rosenkranz, M. A., Ryff, C. D., Singer, B. H., and Davidson, R. J. (2004). Making a life worth living: neural correlates of well-being. Psychol. Sci. 15, 367–372.
van Dijk, H., Schoffelen, J. M., Oostenveld, R., and Jensen, O. (2008). Prestimulus oscillatory activity in the alpha band predicts visual discrimination ability. J. Neurosci. 28, 1816–1823.
Wiedemann, G., Pauli, P., Dengler, W., Lutzenberger, W., Birbaumer, N., and Buchkremer, G. (1999). Frontal brain asymmetry as a biological substrate of emotions in patients with panic disorders. Arch. Gen. Psychiatry 56, 78–84.
Winter, W. R., Nunez, P. L., Ding, J., and Srinivasan, R. (2007). Comparison of the effect of volume conduction on EEG coherence with the effect of field spread on MEG coherence. Stat. Med. 26, 3946–3957.
Keywords: EEG asymmetry, resting-state, EEG dynamics, endophenotype, depression
Citation: Allen JJB and Cohen MX (2010) Deconstructing the “resting” state: exploring the temporal dynamics of frontal alpha asymmetry as an endophenotype for depression. Front. Hum. Neurosci. 4:232. doi: 10.3389/fnhum.2010.00232
Received: 23 July 2010;
Accepted: 11 December 2010;
Published online: 29 December 2010.
Edited by:
Judith M. Ford, Yale University School of Medicine, USAReviewed by:
Brian F. O’Donnell, Indiana University, USARyan Thibodeau, St. John Fisher College, USA
Copyright: © 2010 Allen and Cohen. This is an open-access article subject to an exclusive license agreement between the authors and the Frontiers Research Foundation, which permits unrestricted use, distribution, and reproduction in any medium, provided the original authors and source are credited.
*Correspondence: John J. B. Allen, Department of Psychology, University of Arizona, P.O. Box 210068, Tucson, AZ 85721-0068, USA. e-mail: jallen@u.arizona.edu