The impact of disappointment in decision making: inter-individual differences and electrical neuroimaging
- 1 Electrical Neuroimaging Group and Geneva Neuroscience Center, Neurology Department, University of Geneva, Geneva, Switzerland
- 2 Sleep Research Laboratory, Geneva University Hospital, Geneva, Switzerland
- 3 Laboratory of Decision Making under Uncertainty, Ecole Polytechnique Fédérale Lausanne, Lausanne, Switzerland
- 4 Computational and Neural Systems, California Institute of Technology, Pasadena, CA, USA
Disappointment, the emotion experienced when faced to reward prediction errors (RPEs), considerably impacts decision making (DM). Individuals tend to modify their behavior in an often unpredictable way just to avoid experiencing negative emotions. Despite its importance, disappointment remains much less studied than regret and its impact on upcoming decisions largely unexplored. Here, we adapted the Trust Game to effectively elicit, quantify, and isolate disappointment by relying on the formal definition provided by Bell’s in economics. We evaluated the effects of experienced disappointment and elation on future cooperation and trust as well as the rationality and utility of the different behavioral and neural mechanisms used to cope with disappointment. All participants in our game trusted less and particularly expected less from unknown opponents as a result of disappointing outcomes in the previous trial but not necessarily after elation indicating that behavioral consequences of positive and negative RPEs are not the same. A large variance in the tolerance to disappointment was observed across subjects, with some participants needing only a small disappointment to impulsively bias their subsequent decisions. As revealed by high-density EEG recordings the most tolerant individuals – who thought twice before making a decision and earned more money – relied on different neural generators to contend with neutral and unexpected outcomes. This study thus provides some support to the idea that different neural systems underlie reflexive and reflective decisions within the same individuals as predicted by the dual-system theory of social judgment and DM.
Introduction
Decision making (DM) under uncertainty is part of our everyday life and humans do not always make decisions as predicted by rational or utilitarian laws. Such deviations are often attributed to emotions with several psychological and economic decision studies showing that DM involves a composite emotional reaction encompassing diverse emotions such as regret, disappointment, satisfaction, rejoicing, anger, self-blame, elation, each of them grasping some aspects of the emotional situation, either in an overlapping or in mutually independent way (Roese and Summerville, 2005; Zeelenberg et al., 2008). While economists have started to explicitly incorporate diverse emotions such as disappointment and regret (Bell, 1982, 1985; Mellers, 2001) as clearly differentiated terms into their DM models, few neuroimaging studies tried to dissociate them. Two recent fMRI studies (Coricelli et al., 2005) and (Chua et al., 2009) relied on gambling tasks to determine the neural substrates of disappointment/regret to conclude that these emotions apparently differ on their neural substrate in addition to their well known differences in terms of definition, origins, importance to DM and relative frequency of occurrence between the individuals (Schimmack and Diener, 1997). Consequently, to continue enlightening both neuroscience and economic models we need more carefully designed neuroimaging experiments that allow studying the neural basis, chronometry, mechanisms, and impact of each specific emotion in isolation.
Regret is typically defined as “a negative, cognitively determined emotion that we experience when realizing or imagining that our present situation would have been better, had we acted differently” (Bell, 1982). Disappointment (and its positive counterpart Elation) is formally defined by Bell (1985) as proportional to the mismatch (numerical difference) between the subject’s expectations and the actual outcome. Thus, to formally evaluate disappointment we need to quantify both the size of the outcome and the subject’s expectations or predictions. However, expectations are hardly ever controlled in typical gambling tasks as most studies focus on the size and valence of the monetary outcomes without accounting for the internal reference point (subject’s prediction or expectations). Expectations are, according to the formal definition of disappointment, as important for the magnitude of the elicited emotion as the pure size of the outcome per se. Additionally, to evaluate disappointment in isolation from regret we could take into account that “If actions have been constrained by outside forces, the individual seizes on these external attributions and hence feels no dissonance, no regret, and no self-blame” (Roese and Summerville, 2005). Thus, while disappointment and regret are hard to decouple in gambling tasks where choices are the sole responsibility of the participant, they can be better dissociated when outcomes can be attributed to outside forces.
Our first goal was to devise an experimental paradigm able to effectively elicit disappointment in humans in isolation from regret. We relied on Bell’s definition of disappointment as it provides a formal quantitative measure of this. We were additionally interested in a paradigm suitable for electrophysiological recordings in humans since disappointment (elation) is the emotional reflect of a negative (positive) reward prediction error (RPE). Invasive electrophysiological recordings in animals have revealed the existence of dopaminergic neurons that code reward value as it differs from prediction, fulfilling the basic requirement for a bidirectional prediction error signal postulated by learning theory (Schultz, 2010) which is likely to be crucial for goal-directed behavior and DM (Schultz, 2002; Caplin and Dean, 2008), and which complies with Bell’s definition of disappointment. Importantly, dissociating disappointment from regret is essential to compare with the animal literature as regret is likely to involve high level cognitive processing, not necessarily available to animals but required for counterfactual thinking.
To achieve our goals we adapted a well-known socio-economic game, the Trust Game (TG), widely used to study cooperative behavior (Cesarini et al., 2008; Wischniewski et al., 2009). In a TG, an individual (the investor) decides how much money out of an initial endowment to send to another subject (the trustee). The sent amount is then multiplied by some factor, usually three, and the trustee decides how much of the money received to send back to the investor. In our variant of the game, the participants assumed the role of the investors and played several trials, every time against a different and completely unknown trustee. On the basis of experimental evidence collected during previous runs of the TG, we expected participants to invest a part of their endowments and blame Trustees (external forces) who do not reciprocate as responsible for their disappointment. We collected on every trial the expectations (anticipation) of the investors to manipulate the amounts allegedly given back to them by the Trustees as to elicit numerically quantifiable emotional reactions ranging from elation to disappointment. High-density scalp EEG data were continuously recorded across the game.
Behaviorally, we were interested in evaluating the effects of disappointment and elation on cooperation and trust as well as the rationality and utility of the different mechanisms that might be used to cope with disappointment. Disappointment influences DM because individuals try to minimize future negative emotions (Taylor, 1991; Quirk and Beer, 2006). However, different behavioral strategies might be implemented by the same or different individuals to reduce the emotional impact (Van Dijk et al., 2003) of disappointment. Individuals could for example use higher cognitive and costly strategies to maximize their future chances to obtain desired outcomes, such as investing extra effort in a task, or instead rely on more automatic (and effortless) strategies such as lowering their expectations. Since disappointment is proportional to the mismatch expectations–actual outcome, reducing expectations should lower the experienced emotional reaction. Indeed, these two ways of acting are predicted by the dual-system theory (Evans, 2008) of decision and action that postulates the existence of two neural systems which co-exist and even compete to drive decisions (Caldu and Dreher, 2007; Sanfey and Chang, 2008). While different attributes and names have been given to these two systems, most authors agree that one of these systems is responsible for fast, automatic, and reflexive behavior (e.g., lowering expectations) while the other is responsible for slow, reflective, and conscious processing (e.g., investing extra effort). We were therefore interested in studying how Investors modified decisions concerning trust and expectations in trials following disappointment and whether or not behavioral changes could be accounted for the intervention of different neural generators as revealed by differences in whole scalp EEG topography.
Literature on the electrophysiological signatures of reward signals is vast, complex, and comprises research from very different recording scales and imaging modalities. Indeed, disappointment (as formally defined by Bell) cannot be completely distinguishable from the phenomenon of RPE linked to the dopamine system. However, in the TG, the mismatch between the expected and the real outcome might have similar signature in the brain as a feedback error related potentials.
Neurophysiological studies on dopaminergic single neuron describe mechanisms such as change in firing rate according to the expected presence or not of a reward (Schultz, 1998; Fiorillo et al., 2008; Matsumoto and Hikosaka, 2009; Zaghloul et al., 2009). On the other side, electroencephalography studies have long ago described an event-related potential (ERP), the feedback-related negativity (FRN) that appears on fronto-central electrodes following feedback error and which supposedly reflects activations of the ventral striatum, the anterior cingulate cortex (ACC) and medial prefrontal cortex – see for example Falkenstein et al. (2000) for a tutorial. Importantly, there are various interpretations of those “error” signals, and theories such as error detection, conflict detection, or reinforcement learning still fight against each other for the best explanation. Briefly, in the error detection theory, the ERN (a component similar to the FRN but more specific to motor action errors) reflects the mismatch between required and executed responses. Indeed, it was first considered as belonging to a group of mismatch-related signals such as the Mismatch Negativity (Naatanen et al., 1978; Falkenstein et al., 2000). In the conflict detection view, the ACC uses this signal to monitor action and exert cognitive control over the behavior (Botvinick et al., 2001; Bateson et al., 2006). The reinforcement learning theory holds that FRN reflects the impact of negative prediction error signal on the ACC. This signal is conveyed by the midbrain dopamine system and generated as a RPE when outcomes are worse than expected (Holroyd et al., 2006). Again, ACC will modify performance as a function of this signal. Irrespective of the correct interpretation of the FRN signal we expected to observe this type of responses in fronto-central electrodes when confronting the subjects to disappointing outcomes.
Materials and Methods
Participants and Experimental Design
Thirty-two healthy young volunteers (mean age 25 ± 3.8, 17 females) were recruited by advertisements posted at different faculties of the University of Geneva. Four of the participants were left-handed. They had no history of neurological problems. The whole experiment was approved by the local ethics committee (Geneva University Hospitals). A written informed consent was signed by all participants before starting the experiment. After signing the informed consent, the participants read the instructions.
Inducing and Quantifying Disappointment through the Trust Game
In our version of the TG (Figure 1), participants (Investors) had to decide how much money out of a 10 Swiss Francs endowment at each trial they wanted to share with an unknown opponent (Trustee) on the sole basis of a picture of his/her face presented for half a second. Trustees were never repeated to avoid associating a face to a previous experience. The faces presented to the subjects were neutral faces selected from the FERET database (Phillips et al., 1998, 2000;1) and were balanced by age, gender, and ethnic origins. The experiment was implemented and run using Cogent 2000.
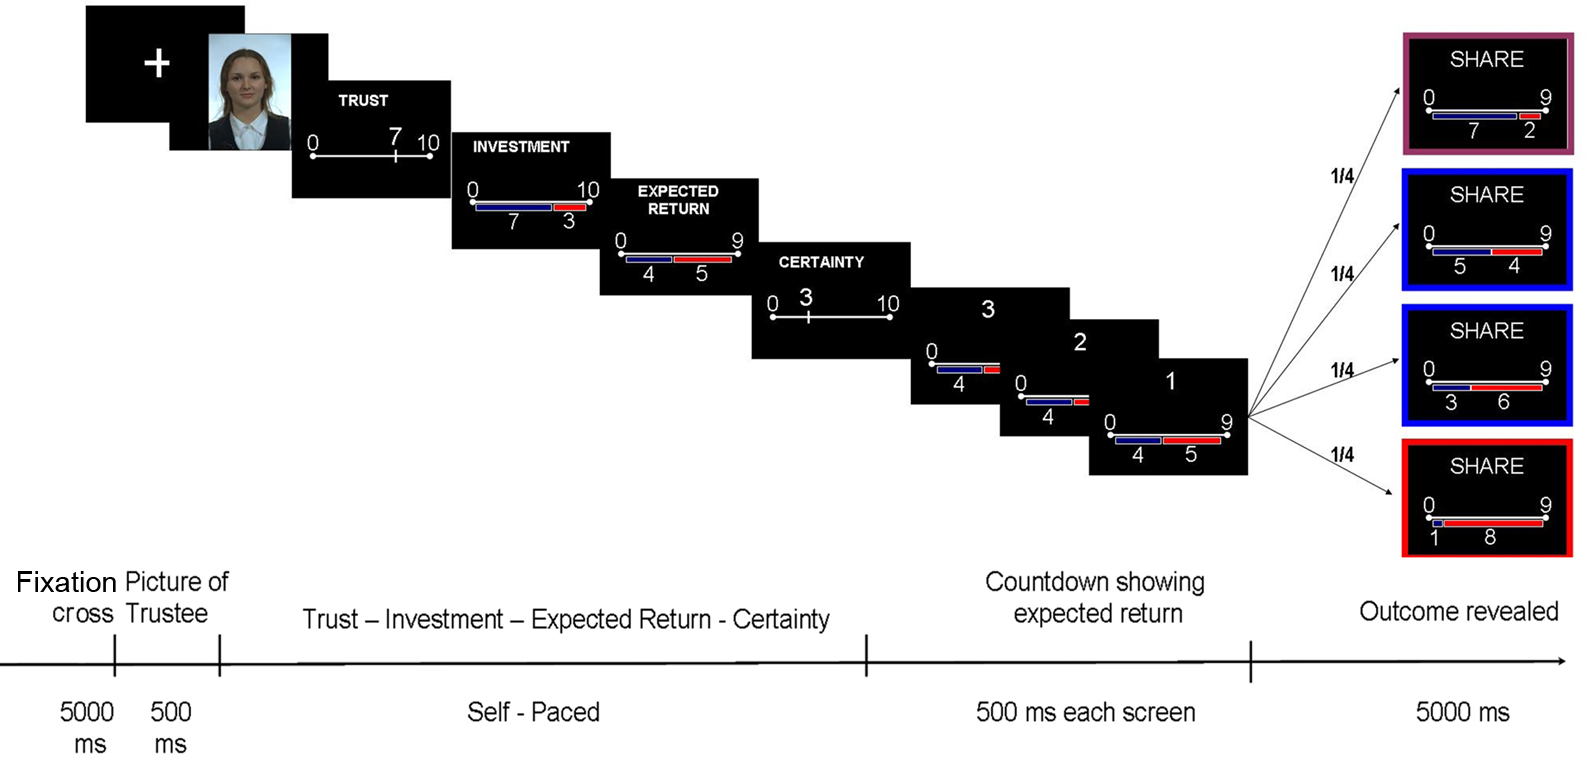
Figure 1. Eliciting and quantifying disappointment by the Trust Game. Each trial begins with a picture of the Trustee (500 ms). The participant (playing the role of Investor) has to rate on 10 points-scale how trustworthy he assesses the face to be. Then, the Investor decides how much he is willing to invest in this trial (10 points-scale). The amount invested is tripled and given to the Trustee. After this exchange, the Investor indicates how much he thinks that the Trustee will give him back, on a scale going from 0 to 3 times the investment (expected return). Finally, the Investor has to report his self-confidence about all the choices he has been making during this trial (10 points-scale). While waiting for the outcome (the final share, allegedly dependent on the Trustee’s decision but actually set up by the experimenter), a countdown screen flashes three times showing the expected return, so that the Investor keeps his expectations in mind. The outcome is then revealed, framed in different colors depending on the outcome. The Investor plays 240 times, each time against a different Trustee, to whom the re-payment is randomly assigned. Varying Trustees from one trial to the other increases the chances that Investors blame the unknown external Trustees by their misfortune minimizing the self-blame and therefore the influence of regret.
At each trial, the Investor had to provide numerical estimates of the following variables:
(1) Trustworthiness (TR): how trustworthy is the Trustee (from 0 to 10);
(2) Investment (INV): how much of his/her 10 Swiss Francs endowment per trial is to be shared with the Trustee;
(3) Expected Return (ER) or simply Expectations: how much does s/he expect to get back from the Trustee (the share that goes from zero to three times the Investment); and
(4) Confidence (CF): to what extent is s/he certain about current decision (from 0 to 10).
To elicit and quantify disappointment in agreement with Bell’s definition, we manipulated the outcomes (the money given back by the Trustee) according to the expectations of the Investor (value entered as ER). We aimed to elicit different a balanced number of trials on each of the following emotional categories in the Investor: (1) elation (outcomes much larger than expected, 60 trials); (2) disappointment (outcome much lower than expected, 60 trials); (3) neutral–positive feeling (outcome similar to expectations but slightly higher than expected, 60 trials); (4) neutral–negative (slightly less than expected, 60 trials). In this definition we used cut-off levels set prior to the experiment and described in the Appendix section.
Following Bell (1985), we used the disparity, i.e., the difference between the received outcome and the expected one (ER), as our quantitative measure of disappointment/elation for each trial. Pictures (faces) of the Trustees were randomly assigned to one of the four categories of outcomes, a fact unknown to the participants. We indeed expected that participants will blame the unknown external Trustees for their misfortune, minimizing the self-blame and therefore the influence of regret.
To further control if disappointment was correctly isolated from regret we created two variants of the game: the experimental and the control conditions. In the experimental condition (EC), played by 19 out of the 32 participants, subjects were told that the Trustees with whom they were going to play had already participated in a similar study so that for each possible value of investment we (the experimenters) already knew how much the Trustees were willing to give back in return. Thus, the participants thought that they were playing with human opponents although not in real-time. In this EC condition, outcomes are then completely determined by the external factor (the generosity of the Trustee) and no self-blame and regret is expected to arise. The remaining subjects (13) played a version of the game named Control Condition (CC) in which they were explicitly informed that we programmed the game according to predefined rules. In this condition, the subject (Investor) might occasionally blame himself for not discovering the rules of the game. The development of the game and the images presented were identical in both conditions to minimize potential differences in EEG patterns. Participants were told that they would be paid according to their performance, thus the final goal of the experiment was to maximize their gains.
At the end of the session we asked the participants to fill in a questionnaire in which they had to report: (a) the emotion that best described what they felt in the cases where they invested substantially but received little in return; (b) if they thought that there was a link between their assessment of the faces and the outcomes, or if they felt that it was random; (c) if they thought that their ratings on the unknown Trustees could have been influenced by previous outcomes with different Trustees.
Evaluating the Effects of Disappointment and Elation Upon Cooperation and Trust
In both variants of the game, Trustees vary from trial to trial. Then, trials should be independent (at least in the EC) as there is no logical reason to evaluate a new yet unknown Trustee on the basis of previous outcome received from a different Trustee. However, if disappointment and elation play a role and bias behavior, the independency across trials should be abolished and larger changes in behavior should be observed immediately after experiencing the stronger emotions. In other words, Investors might rate the TR of an unknown Trustee lower (higher) after experiencing disappointment (elation) and as a consequence invest and expect less.
To assess if participants judged each Trustee independently of previous history with other Trustees or if instead previous outcomes influenced their gaming strategy, we defined a measure of the change in strategy (CS) across consecutive trials. The measure used was the difference between the value of the previous trial (n − 1) and that of the current trial (n) for the three variables under study: TR, investment, and expectation. A negative value of the CS thus indicates that the Investor has lowered his TR rating/investment/expectation in the current trial compared to the previous one, whereas a positive value means a relative increase in TR rating/investment/expectation. The plot of the CS (abscissa) vs. previous outcome (ordinate) for all trials should show a bell-shaped distribution (2D-Gaussian) if trials are independent and deviate from the bell-shaped distribution when the independency is broken.
EEG Recordings
The scalp electroencephalogram (EEG, 64 channels) and reaction times (RTs) were recorded during all steps of the game. The EEG was recorded at 1024 Hz (fifth order sinc filter with a −3 dB point at 1/5th of the sampling frequency) using 64 BioSemi sintered Ag–AgCl electrodes. The electrodes were mounted on the manufacturer-provided cap according to an extended 10–20 system. The Biosemi system uses a common mode sense (CMS) active electrode as the reference that we transformed to the average reference during offline analysis. Visual inspection was used to reject artifact-contaminated trials. Bad electrodes interpolation was based on spherical splines using Cartool (http://brainmapping.unige.ch/Cartool.htm). Epochs of 1100 ms (100 ms before the presentation of the outcome) were extracted after notch filtering at 50 Hz and superior harmonics. No baseline correction was applied as it might modify the scalp topography (Wendel et al., 2009). Averages of the epochs, aligned by the onset of the presentation of the outcomes, were computed for every subject and outcome. We particularly focused on the electrophysiological signals during the period of discovering the outcomes as it is the period during which disappointment should be experienced and which should correspond to the reward/reward omission period where the dopamine cells show differential activation.
Seven subjects were excluded from the EEG analysis (but not from the behavioral analysis) because of excessive contamination (more than half of the 240 trials) of their EEGs by artifacts (electromyographic contamination, ocular movements). Electrophysiological results are then based on a sample of 25 subjects (14 of the EC and 11 of the CC).
Statistical Analysis of Behavioral Data
In all analyses the distribution of the data was tested to investigate potential deviations of normality assumptions. Non-parametric statistics were used when the Kolmogorov–Smirnov test revealed deviations from the normal distribution (P > 0.05, Kolmogorov–Smirnov). To compare multiple groups under normality assumptions, we would use analysis of variance (ANOVA/MANOVA). In case of deviations we relied on the Kruskal–Wallis analysis of ranks which is a non-parametric version of the classical one-way ANOVA, and an extension of the Wilcoxon rank sum test to more than two groups. Also, when appropriate we graphically depict the data using notched boxplots that provide a summary of several important features of the distribution of values (e.g., median, confidence interval around it, outliers). In these plots, when the notches of two or more groups do not overlap then the medians of the two groups differ at the 5% significance level.
The significance of the correlation (the P-value) was computed in Matlab by transforming the correlation to create a t statistic having n − 2 degrees of freedom, where n is the number of variables. The confidence bounds are based on an asymptotic normal distribution of 0.5 × log[(1 + R)/(1 − R)], with an approximate variance equal to 1/(n − 3).
Statistical Analysis of Event-Related Potentials
All analyses for EEG and behavioral data were carried out using custom-built Matlab routines.
To avoid any dependence of the results on the reference electrode we mainly relied on the statistical analysis of the whole ERP topography, i.e., the instantaneous spatial distribution of potential over the scalp surface measured by the 64 recording channels, instead of the most conventional single trace analysis. Note that the ERP topography (as a landscape) is reference-independent. A reference is a constant value added or subtracted to the voltage instantaneously recorded at each electrode. As such, a reference can modify the absolute value for each map (the individual wave shape and components recorded at each electrode) but never the topography of the map. This is identical to altitude maps of a terrain landscape that remain invariant when referred to the sea level or to any other altitude. The relative ranking of the scalp measured voltage values – i.e., the landscape – remains unaffected by the reference and therefore the topographies can be compared to the ones reported in other studies.
The analysis of ERP topography yields a second advantage over single trace ERP analysis which is essential to our goals of assessing the dual-system theory. Since electric fields at the scalp bear a linear relationship with the underlying generators, differences in scalp topographies necessarily reflect differences in underlying generators. Here, we stick to the term neural generators in the sense used in the discrete formulation of the direct and inverse problems of the EEG, i.e., the distribution of current density within a discrete network of locations within the brain. Note that simple polarity inversions or scaling (multiplicative) factors do not imply different generators. In other words, if two ERP topographies are significantly different in a non-trivial form, the involved neural generators are necessarily different. Some simple math can corroborate this assertion. Let’s Φ denote the vector of the potential values recorded at a single time instant over all scalp electrodes. According to Maxwell equations Φ can be related to the underlying current distribution J (the generators) measured at a discrete grid of points distributed over the gray matter by the matrix–vector equation Φ = LJ (Grave de Peralta Menendez et al., 2000). Here L denotes the lead field matrix summarizing the geometrical and conductivity properties of the neural media which can be safely assumed constant over the time course of the experiment for each subject. Let’s assume that two different non-collinear scalp maps Φ1 and Φ2 have been measured on the same geometry (e.g., subjects). Then, from LJ1 = Φ1 and LJ2 = Φ2 follows that L(J1 − J2) = Φ1 − Φ2 ≠ 0. This is only possible if J1 ≠ J2. Interestingly, the converse effect does not hold true, i.e., it is impossible to conclude that the generators of two identical maps are identical as silent sources producing no measurable scalp potentials might exist.
In summary, two different scalp topographies necessarily imply two different distributions of underlying neural generators. The veracity of this assertion derives from the linear relationship existing between distributions of currents within the brain (neural generators) and scalp measured potentials (EEG) described by the lead field operator which can be “safely” assumed invariant over the course of the experiment.
Note that to exclude possible confounds due to trivial changes in scale (e.g., polarity) between the generators we have to be careful selecting the appropriate measure of closeness or resemblance. A good measure of the similarity or dissimilarity of the topography of instantaneous scalp maps, insensitive to simple polarity inversions, or scaling factors, is the absolute value of the correlation coefficient between maps.
We used the correlation coefficient as the test statistics to build a non-parametric multivariate randomization test to evaluate the statistical significance of differences between instantaneous scalp maps within two or more groups. This test, known as a randomized one-way MANOVA (Mielke and Berry, 2001), can be applied to each measured topography, i.e., to each time frame. In the test, we assume that no differences exist between the compared groups (hypothesis Ho) and compute the distribution of the test statistic by permuting members from one group to the other 1500 times. Note that the test is applied to each time frame preserving the millisecond order temporal resolution of the original data.
To compare single trace ERPs we relied on a Friedman non-parametric tests (as data were not normally distributed according to the Kolmogorov–Smirnov test) which compare column effects in a two-way layout. Friedman’s test is similar to classical balanced two-way ANOVA, but it tests only for column effects after adjusting for possible row effects. It does not test for row effects or interaction effects. Friedman’s test is appropriate here as we are interested in comparing the relative ranking of neural responses to the different outcomes irrespective of the individual voltage values which are a nuisance effect as they might simply emerge from differences in scalp/skull thickness. These potential differences need to be taken into account but are not of any interest.
All statistical analysis of ERPs and topographies included a pre-stimulus window of 100 ms. By including this baseline period in all statistical comparisons we make sure that no significant differences existed already in the pre-stimulus period and therefore that they are due to the processing of the outcomes. Hence, like baseline correction, our approach insures that differences are related to the outcome but contrarily to baseline correction we achieve this goal without distorting the scalp maps.
Results
The Behavioral Consequence of Disappointment and Elation and its Asymmetry
The questionnaire confirmed that the experiment was effective in eliciting disappointment amongst the participants. When asked to evaluate their feelings after adverse unexpected outcomes, the vast majority (30/32) of the subjects spontaneously reported negative emotions, with disappointment being the prevalent one (12/32). Moreover, in a forced-choice version of this question, they restated their answer by choosing disappointment (15/32 subjects), over anger (7/32), betrayal (6/32), or regret (3/32). A summary of the individual responses to the questionnaire is given in Table A1 of Appendix.
If participants playing the CC condition were trying to cognitively decode the implemented game strategy they should neglect their personal impressions on the Trustees and invest according to rules different from TR. Consequently, the correlations between TR ratings and investments should be much lower in the CC than in the EC conditions. However, TR ratings and investments were highly correlated in both conditions (mean linear correlation coefficient r = 0.65 in EC and 0.61 in CC, corresponding to P-values smaller than 10−8 in both cases) and correlations were also highly significant between TR ratings and ERs (mean r = 0.72 in EC, 0.69 in CC, P < 10−9). The highest correlations were however observed between investments and ERs (mean r = 0.79 in EC and 0.76 in CC) suggesting that expectations are the most determinant factor for decisions within this context. The highly significant correlations between trust and investments or trust and ERs in the CC indicate that subjects relied on their personal impressions about the Trustees in both the EC and CC. This is confirmed by the fact that most participants (9/13) in the CC reported in the questionnaire a causal link between the face and the outcomes rather than the random assignment actually implemented. The total gains, the amount of TR ratings, investment, or ER showed no behavioral differences (P = 0.3, Kruskal–Wallis) between participants of the EC and CC (Figure 2). The comparison of RTs between subjects of EC and CC revealed no significant differences either.
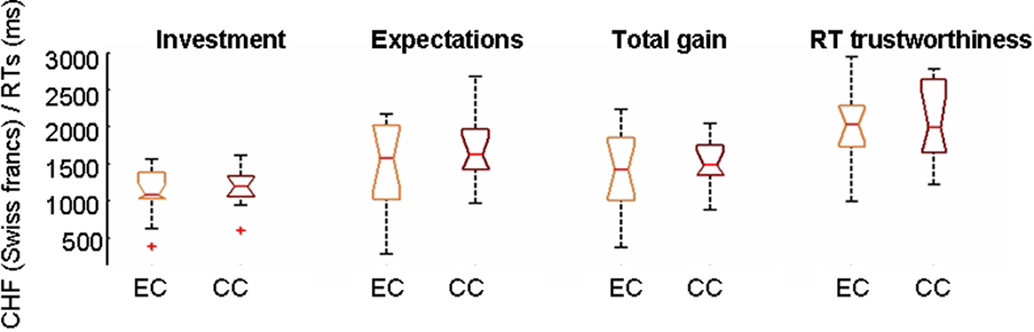
Figure 2. No behavioral differences emerge in this setting when playing with a computer (CC) or a human opponent (EC). Notched boxplots showing the distributions of values for total investment, total expectations, total gains, and mean reaction times (RTs) for trustworthiness ratings when subjects are grouped according to the experimental (EC) or control (CC) conditions. No differences in medians in any of the variables are found between subjects playing EC or CC at the 5% significance level (P = 0.05) as the notches of the two groups overlap. RTs in this and following figures are expressed in milliseconds. Gains, investments, or trustworthiness ratings are expressed in mean absolute values accumulated over the whole game.
The individual plots of the CS for the variable ER (expectations) as a function of the disappointment experienced in the previous trial reveals a strong bias in the behavior of the subjects in both the EC (Figure A1 of Appendix) and CC conditions (Figure A2 of Appendix). Indeed, beyond an individual-specific level of disappointment, only negative CS values of ER (dashed green zone) are observed for all Investors, irrespective of the condition. The absence of positive CS values beyond specific levels of disappointment in previous trials constitutes a systematic deviation from the expected bell-shaped distribution which indicates that trials are not independent from previous history. This tendency was somehow present for investments and to a lesser extent for TR ratings (not shown at the individual levels) suggesting that expectations is the factor the most affected by emotions in our experimental framework. Note that at intermediate levels of disappointment/elation (neutral outcomes) the distribution of choices appears equally distributed around the vertical axis as expected for independent trials.
The individual plots of CS as a function of prior disappointment failed to reveal any particular difference between the EC and CC participants. In both groups, participants invested and expected according to the TR ratings they accorded to the unknown Trustees and participants from both groups appeared to be equally sensitive to previous disappointment. Indeed, it seems like if there is always a limit to the tolerance of disappointment beyond which previous history modifies subsequent behavior and Trustees are not anymore independently assessed. However, while some Investors showed this behavior after a small amount of disappointment, others seemed less influenced by it. Moreover, the Investors who reacted easily to disappointment often increased their expectations and investments after experiencing elation (Figures A3 and A4 of Appendix).
In summary, we found no statistical evidences for significant differences between the EC and CC conditions in terms of RTs, total gains, and total investments. Answers to the questionnaire were similar in both conditions in terms of the relative frequency of emotions reported under free and forced choices and no particular trend differentiating both groups emerged from the plots of CS vs. previous disappointment. Therefore, it seems that the experimental manipulation failed to evoke a more cognitive strategy in CC participants that would have reflected the cognitive impact of regret. We therefore decided to pull together participants from both conditions into a single group to summarize results.
Figure 3 depicts the plot of the CS vs. previous disappointment for the three variables under study: TR, investments (INV), and ERs when all participants are pooled together. The plot clearly reveals a marked asymmetry in the distribution of values for the ER with respect to the x-axis (previous outcome). While for elation (positive x-axis) the distribution is approximately bell-shaped, a sort of linear trend appears for negative values in the x-axis that correspond to disappointment. In other words, stronger disappointment is followed by largest decreases in expectations about new Trustees which contradict the hypothesis of independent trials.
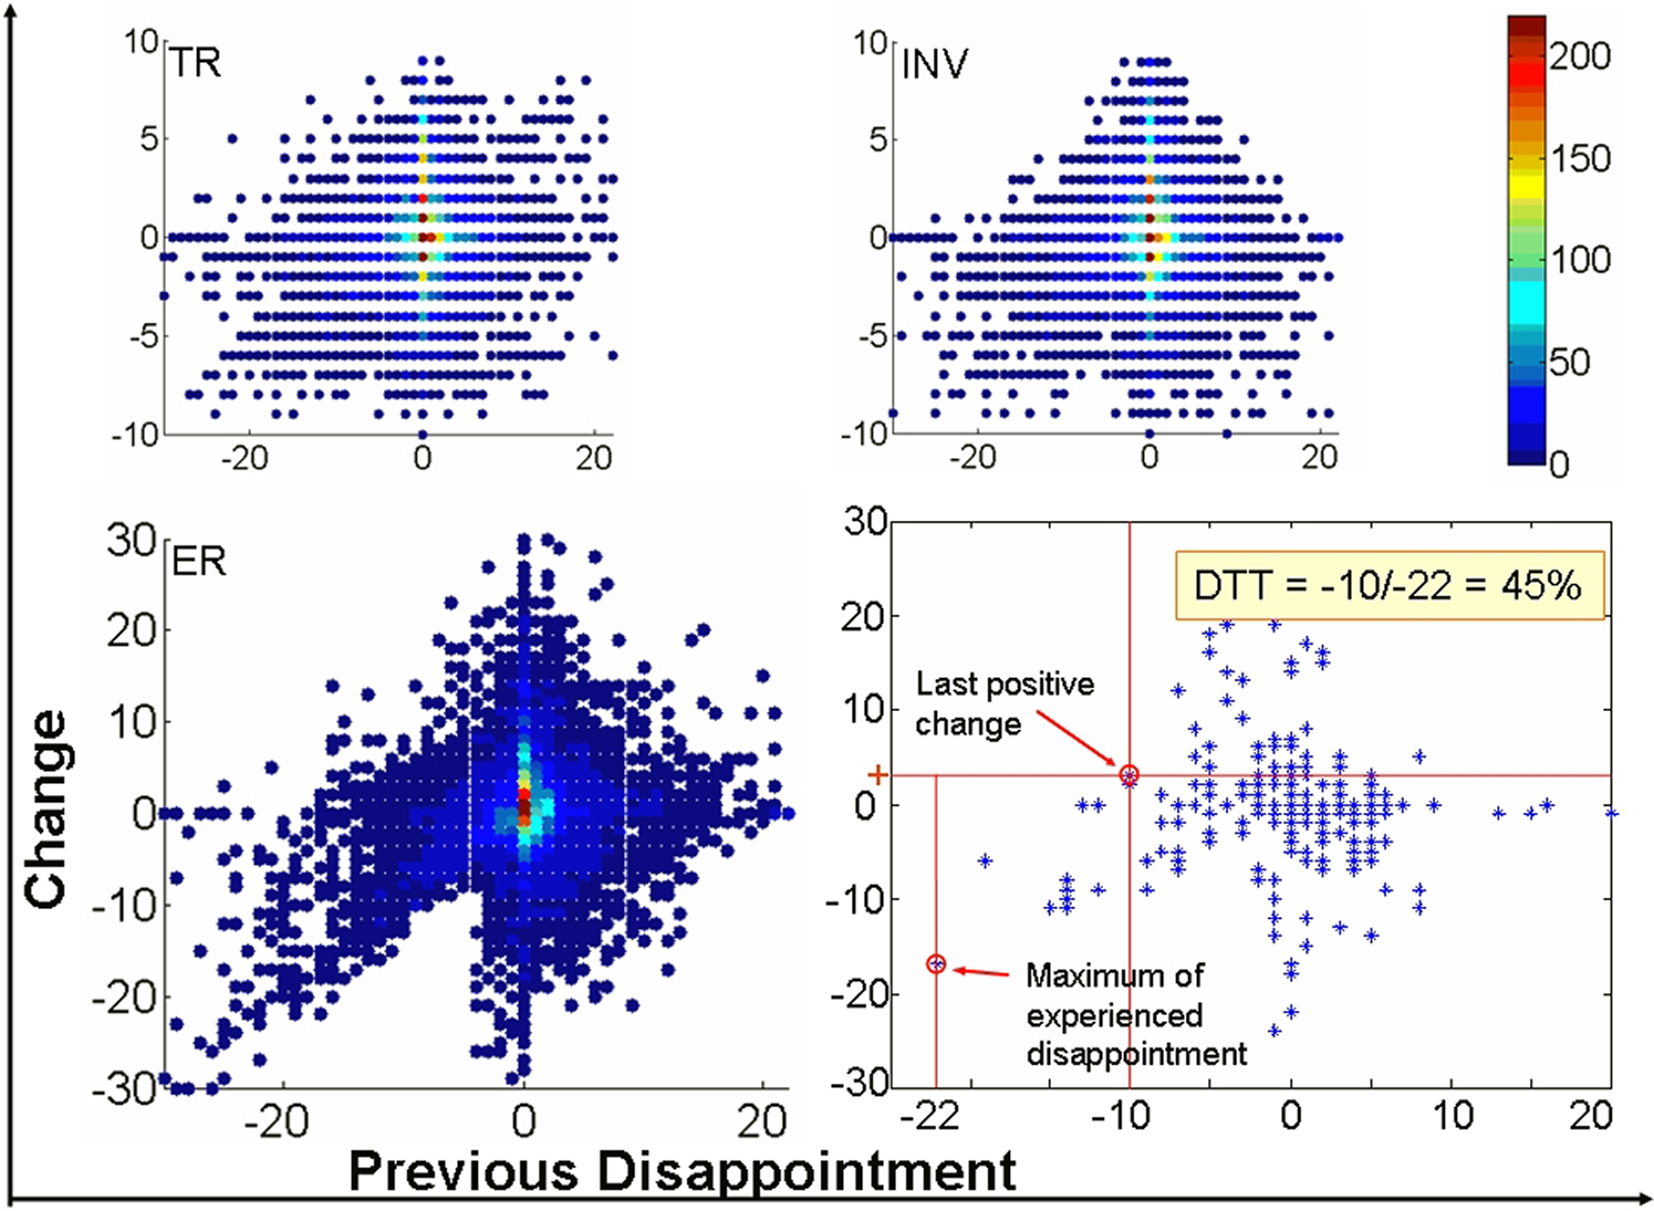
Figure 3. The influence of disappointment on upcoming decisions. Difference of trial n − 1 and trial n (y-axis) as a function of previous disappointment (x-axis) for one individual subject (bottom, right), and for the three variables Trustworthiness Ratings (TR), Investment (INV), and Expected Return (ER) for all subjects. Colors of the scale are proportional to the density of observations for the x, y point. Note that the distribution of values considerably deviate from the bell-shaped distribution for the largest values of disappointment (most negative values in the abscissa) to be expected if each new Trustee were assessed independently of previous outcome with a completely different Trustee. Disappointment Tolerance Threshold (DTT, the rightmost lower inset) is defined for each participant as the x-value at which the last positive change in ER is observed (y-axis) divided by the maximum disappointment experienced. For example here, the DTT of the individual subject is: −10/−22 = 0.45 or 45%.
It is precisely the asymmetry between disappointment and elation which rules out that this behavior reflects an increase in cautiousness due to having invested a large amount in the previous trial (and would be consequently unrelated to the outcome of this trial). Indeed, to obtain an outcome much larger than expected subjects must also invest large amounts, so this effect of cautiousness might be observed too. However, the decrease in expectations is not observed for elation. In addition the converse effect is more often observed: some subjects tend to increase their expectations after a strong positive outcome. The modification in behavior revealed by Figure 3 is therefore a consequence of disappointment and reveals an important asymmetry in the behavioral consequences of a positive and a negative RPE. Disappointment bears a larger behavioral impact than elation in this context.
Inter-Individual Differences in Coping with Disappointment: Causes and Consequences
Interestingly, inter-individual differences emerged as a new unanticipated factor in this experimental design. Indeed, the largest behavioral differences amongst Investors were observed across the individuals rather than across the EC and CC as revealed by their individual plots of CS. We therefore classified the subjects according to their behavior following disappointment. For that, we defined a measure aimed to reflect the individual impact of previous outcome on expectancy ratings that we termed the Disappointment Tolerance Threshold (DTT). With this measure (Figure 3, rightmost lower inset) we tried to characterize the extent to which each subject deviates from the distribution expected when trials are independent. We defined the DTT for each participant as the x-value at which the last positive change in ER is observed (y-axis) divided by the maximum of disappointment experienced2. Dividing by the maximum of disappointment allowed us to create a measure between 0 and 1 that facilitated the ranking of the subjects. Note that the DTT is defined for the ER for the sake of compatibility with the formal definition of disappointment (Bell, 1985) and because it is the variable that better correlated with the investments.
Three groups of subjects were created. The first category (low-DTT) includes participants with the 10 lowest thresholds who require little disappointment to modify their behavior. The High-DTT category consists of participants with the 10 highest DTTs. Finally, the remaining five participants constitute the middle category. This division is somehow arbitrary as the plot of the DTT over subjects (Figure 4A) revealed no clear-cut division. Still, we needed large extreme groups as to allow for robust statistical comparison of EEG3.
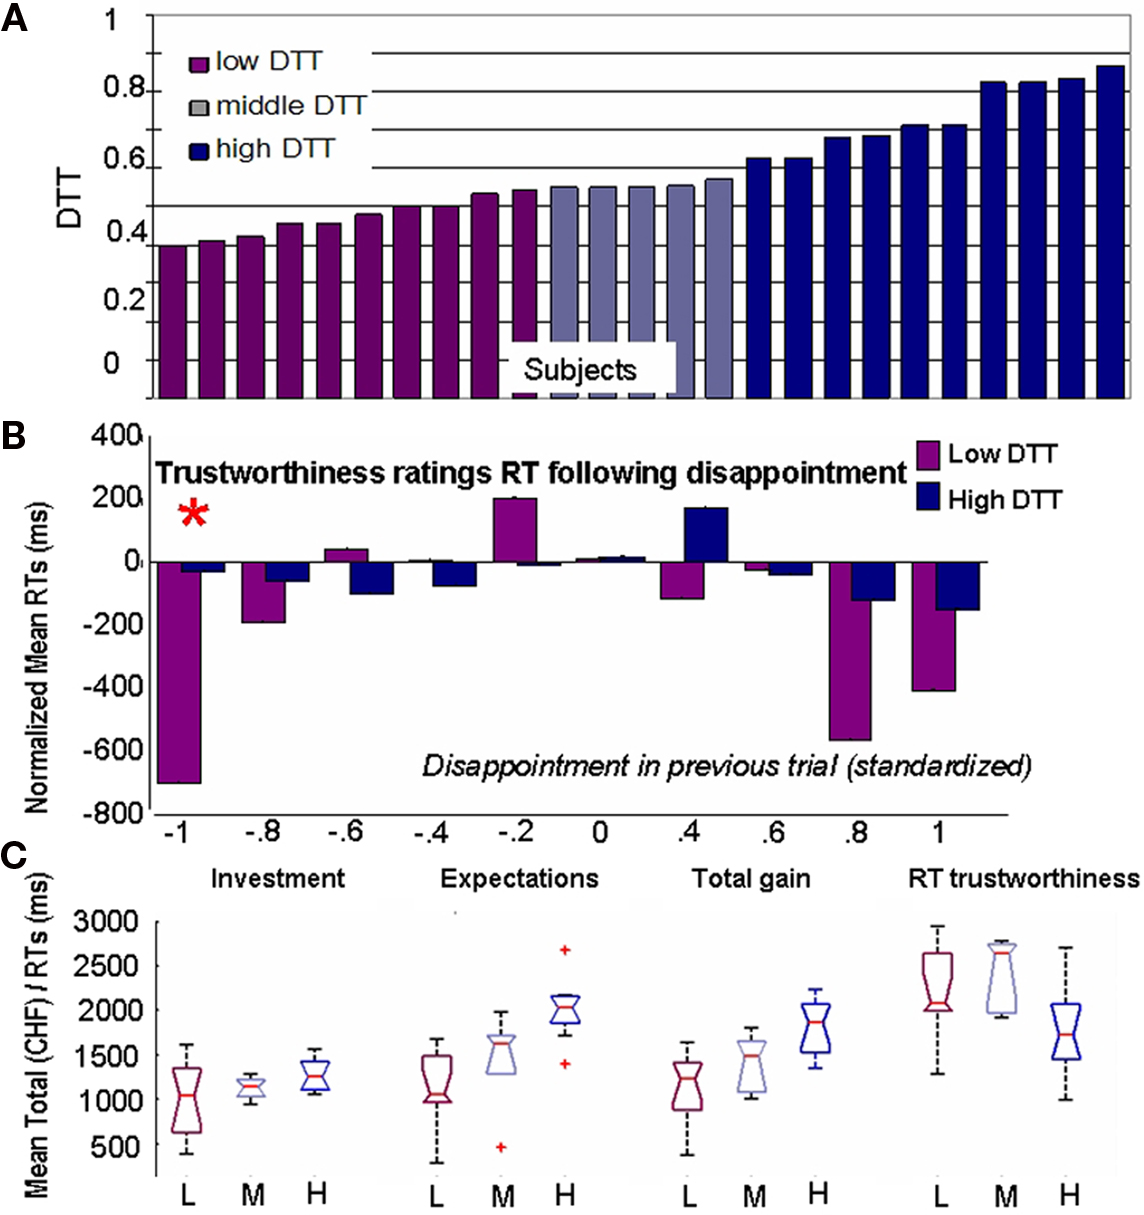
Figure 4. Impact of disappointment sensitivity on behavior. (A) Segregation of the subjects on the basis of behavior. Disappointment Tolerance Thresholds are shown on y-axis. (B) Mean (over subjects) reaction times after standardization by individual mean reaction times over the whole task. The disappointment in previous trial was individually normalized and divided into 10 bins of equal length. (C) Boxplots showing the distributions of values for total investment, total expectations, total gains, and mean reaction times (RTs) for trustworthiness ratings when subjects are grouped by DTT values. Subjects who reduce their expectations after disappointment take faster decisions but expect less and gain less while investing the same as subjects who are less sensitive to disappointment.
The decrease in expectations in trials following disappointment observed in the Investors can be either a consequence of cognitive updating of the estimates (i.e., after a negative outcome, the subject thinks that he granted trust too easily in the previous trial, so he diminishes it in the following) or simply an impulsive (automatic) reaction. To clarify this issue, we analyzed two factors considered to be key elements of impulsive decisions (Evenden, 1999): (1) the RTs, that are proportional to the cognitive load involved in the decision and (2) the consequences of the decision for the gains of the investor as failing to maximize one’s gains is considered an evidence of counter-productive behavior. Figure 4B shows that Low-DTT subjects are significantly faster to evaluate TR after experiencing disappointment than after neutral or favorable outcomes. Moreover, they are also significantly faster than the High-DTT group (P = 2 × 10⁻⁵, Kruskal–Wallis, indicated by an asterisk on top of the bar). They take approximately half of the time to evaluate next Trustee after emotional outcomes (average: 2014 ms after neutral and 1296 ms after disappointing outcomes). This is an important evidence of impulsive behavior since they are generally slower than High-DTT to assess the TR of the faces when all trials are considered together (Figure 4C, last boxplots). It is the reaction to disappointment – and elation to a lesser extent – that leads to shorter RTs in the Low-DTT group, rather than a general trend to take faster decisions. Importantly, the RTs of High-DTT group in the trials where they lowered their expectations after disappointment are not shorter than their average RTs. Consequently, while we cannot make a judgment on the legitimacy of their decisions, there is no clear indication that they were acting upon impulses when confronted to adverse outcomes.
To asses the second aspect, i.e., counter-productiveness, we compared the total investment, total expectation, and total gains for the Low, Middle, and High-DTT groups (Figure 4C). The total gains are significantly different between the three groups (P = 0.0003, Kruskal–Wallis), with the largest gains observed for the group with the High-DTT, intermediate gains for the Middle-DTT group, and the lowest gains for the Low-DTT group. The comparison of the total investment between the three groups showed no significant differences (P = 0.19, Kruskal–Wallis) indicating that the smaller gains of the Low-DTT cannot be explained by an overall more cautious strategy of investment but again, by a sudden decrease in expectations after disappointment.
Electrophysiological Results
A likely explanation for the behavioral differences observed amongst individuals is the engagement of different brain structures (neural generators) to cope with emotionally laden outcomes. As discussed in the Section “Materials and Methods,” formal evidence for the engagement of different neural generators can be obtained by statistically comparing the whole head topography of the scalp recorded ERPs, i.e., the spatial distribution of the potential values or simply the maps.
If regret, instead of disappointment, arises in the EC condition and since both emotions are found to stem from different neural substrates, then we should expect differences in scalp topographies between Investors playing the EC and CC. This difference should appear when subjects are confronted to the outcomes as it is the period where the emotions are experienced. However, the randomized MANOVA failed to reveal any differences in scalp topographies at the 5% significance in the whole second following the presentation of the outcomes. Indeed, the distribution of P-values over time computed using the randomized MANOVA described in Section “Statistical Analysis of Event-Related Potentials” never reached values smaller than 0.05 when the EC and CC topographies were compared which agrees with the lack of significant different observed at the behavioral level. We have no statistical evidences to reject the null hypothesis that maps, and therefore the underlying generators, are identical.
We therefore explored potential differences in underlying neural generators between Low and High-DTT subjects where behavior (e.g., RTs, expectations) and results (gains) did clearly differ. These behavioral differences might however stem from two different neural origins, namely: (1) the impulsive behavior of Low-DTT individuals stems from the involvement of structures linked to emotional processing that add to the neural structures involved in the automatic assessment of outcomes independent of their valence, or (2) The impulsive behavior is the rule for both Low and High-DTT individuals when confronted to disappointment but High-DTT individuals make appeal to cognitive control mechanisms that moderate their impulsive reactions leading to slightly slower responses but higher gains.
The statistical comparison of the scalp map topographies between the different outcomes (disappointment, elation, and neutral) might help to dissociate between both hypotheses. Indeed, if the behavior of Low-DTT individuals is a consequence of their strong emotional involvement, then a change in topography should appear in the cases where they experience emotions (disappointment/elation) as compared to neutral outcomes that evoke no emotions. On the other hand, if similar neural generators are automatically involved in the assessment of all outcomes for both groups but the better performance of High-DTT individuals is due to cognitive control, then specific maps should appear in High-DTT individuals when confronted to disappointment and/or elation but the maps of High-DTT individuals should be similar to those of Low-DTT for neutral outcomes when cognitive control of impulses is not required.
During the assessment of the outcomes we found differences in the amplitudes of ERPs and in the scalp topographies within (depending on the emotional valence of the outcome) and across groups (High and Low-DTT), as detailed below.
Differences in the amplitude of ERP traces across individuals
We observed differences between groups (P < 0.01, Friedman’s non-parametric two-way ANOVA) in the amplitude and latency of the mean ERPs around 350 ms, on several fronto-central electrodes (Fp1, F1, F3, FC1, Fpz, AF8, AF4, AFz, Fz, F2, F4, FC4, FC2, FCz, Cz) as illustrated in Figure 5A for FCz.
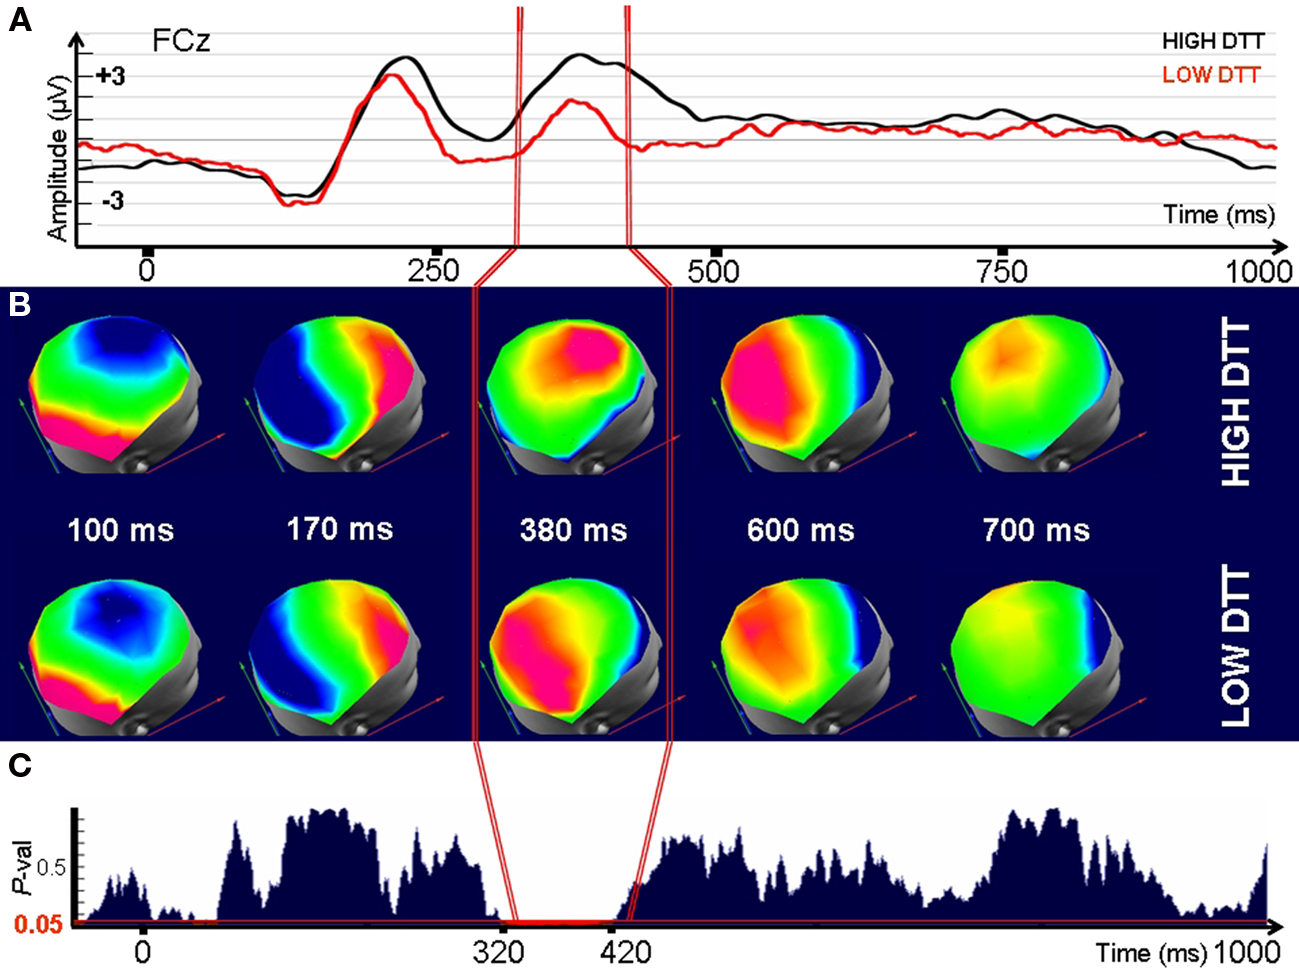
Figure 5. Electrophysiological differences between individuals with High and Low Tolerance to Disappointment when confronted to disappointing outcomes (time 0). (A) Signals recorded at a fronto-central electrode (FCz) after presentation of the disappointing outcomes. (B) Evolution through time of the corresponding Event-Related Potential maps (C) P-value for a randomized MANOVA performed on the maps. Threshold for significance (P < 0.05) is indicated by the red line. Note that the maps (ERP topography) significantly differ between groups in the interval 320–420 ms indicating that the underlying generators are necessarily different. Consequently, High and Low-DTT individuals differ in the neural generators used to cope with disappointing outcomes in the specified interval.
Differences in scalp topographies between individuals
Significant differences (P < 0.01, randomized MANOVA) in scalp topographies were observed between the Low and the High-DTT groups for the interval between 320 and 420 ms after strongly disappointing outcomes (Figures 5B,C). Neutral outcomes did not lead to any differences in topography (Figures A5 and A6 of Appendix). A very brief topographic difference (380–400 ms) was observed between groups for the case of elation (Figure A7 of Appendix). No significant differences in topographies were observed during the initial interval that contains the ERP components P100 and N170, supposed to index basic visual processing, or after 400 ms.
Differences in scalp topographies as a function of the emotional valence of the outcome
The within-group analysis of topography comparing the different outcomes (elation; disappointment; neutral–positive/negative) for the High and Low-DTT groups separately revealed significant differences between the outcomes for the interval 320–420 ms within the High-DTT group. No significant differences were found between the different outcomes for Low-DTT individuals. The post hoc analysis (based on paired comparisons using the same test) identified the disappointment condition as the source of the differences (Figure 6) between the outcomes for the High-DTT group.
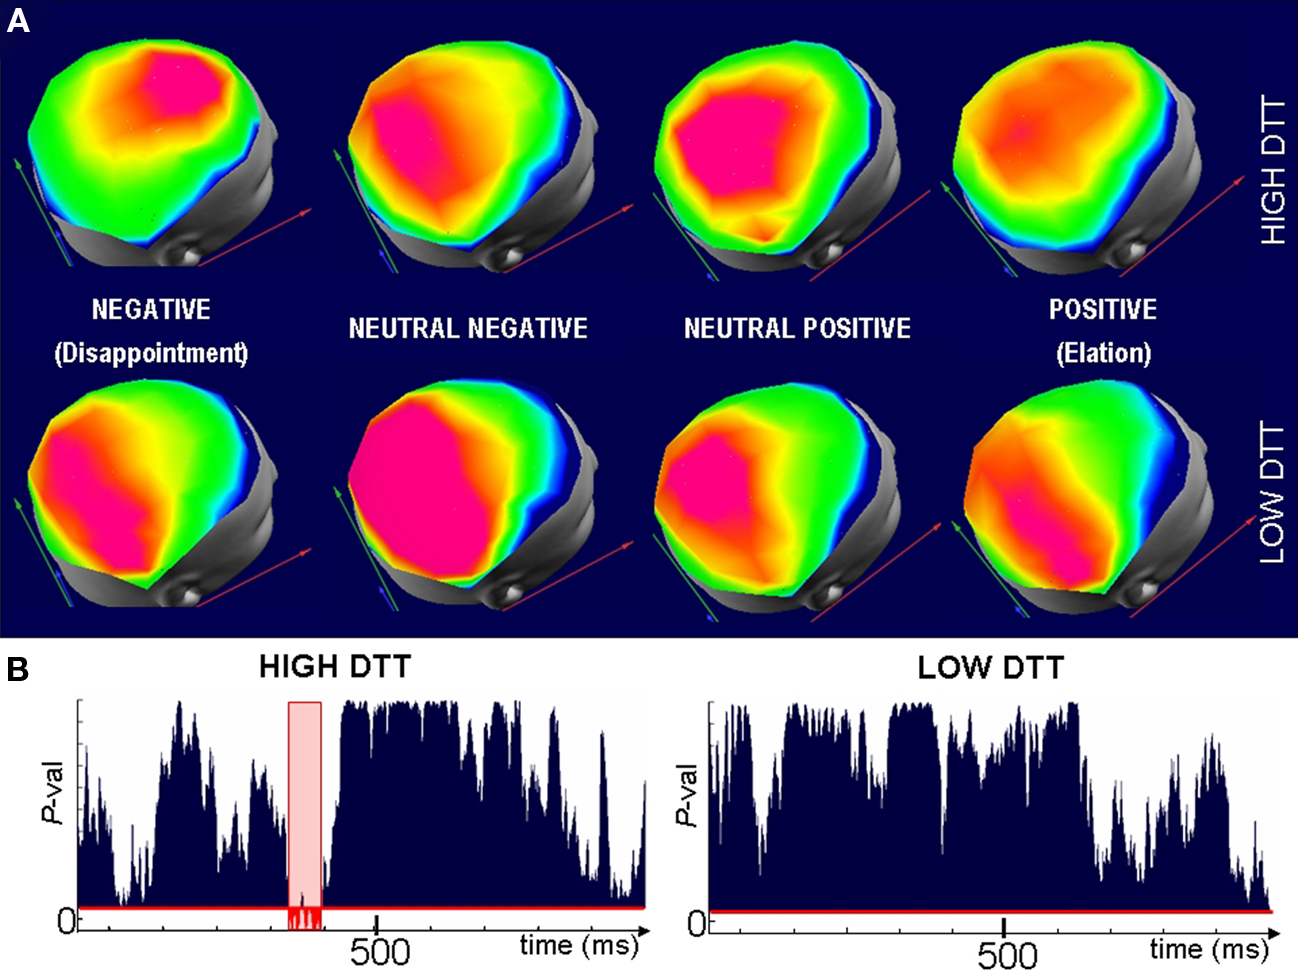
Figure 6. Different neural generators are involved in the evaluation of outcomes for High-DTT players. (A) Representative scalp maps averaged over Low (top row) and High (lower row) DTT subjects when confronted to outcomes of difference valence (columns). Maps are selected from the period where significant differences in topographies were observed across groups and categories for the High-DTT individuals. The map with fronto-central maximum (top row, left most map) appears only when High-DTT participants are confronted by disappointment. A different map is observed after neutral and satisfactory outcomes for the High-DTT which is not significantly different from the map seen for all outcomes in the Low-DTT group. (B) Randomized MANOVA reveals that the fronto-central map is significantly different (P < 0.05, in red) from the three other maps of the High-DTT group, whereas no significant differences are observed across outcomes in the Low-DTT group (right). The fact that the difference in scalp topographies appears for the High-DTT group confronted to disappointing outcomes suggest that cognitive control over the automatic impulsive reaction is the source of their better performance in the task (higher gains for similar investments).
The existence of significant differences in topography proves that Low and High-DTT individuals relied on different (although maybe partially overlapping) brain areas (neural generators) to evaluate disappointing outcomes. Consistent with our second hypothesis, the different ERP landscape appears within the High-DTT group (Figure 6). Indeed, when comparing the maps of High-DTTs following the other outcomes (positive and neutral ones), they are statistically indistinguishable from all the maps of the Low-DTT group.
Discussion
Disappointment as a Biasing Factor in Social Decision Making
Using a variant of the TG, we investigated the behavioral and neural mechanisms employed by humans to cope with disappointment and elation, i.e., the emotions experienced in the presence of negative and positive RPEs (Bell, 1985). The advantages of this experimental design are: (1) it allows inducing disappointment in isolation from regret and (2) it allows the manipulation and quantitative evaluation on a trial-by-trial basis of disappointment using Bell’s original definition which formally coincides with the size of a negative RPE. The absence of statistically significant differences in the measured behavioral parameters or EEG topographies between the two ECs created, i.e., playing against a human Trustee (EC) or against the computer (CC) suggests that regret was not evoked in the experimental paradigm. A likely explanation for this finding, that apparently contradicts previous studies reporting differences in gambling tasks when playing against humans and machines (Sally, 1995; McCabe et al., 2001) is the display of a Trustee’s face in both variants of the game. Indeed, previous studies have shown that the mere presence of a picture depicting a face is sufficient to modify human behavior (Bateson et al., 2006). The results of the questionnaire showed that CC players imagined links between the type of face and the outcome, and unexpectedly invested according to their TR ratings. These elements suggest that CC participants played as EC participants because the CC still involved a very strong social component which permits the attribution of misfortune to others minimizing self-blame and regret. Taken together all these aspects allow concluding that this design was successful in its goal of isolating one of the specific emotions involved in DM to explore its impact on behavior and its electrophysiological correlates.
In behavioral terms, the most consistent and novel results of this study are: (1) A negative RPE (disappointment) leads to a systematic reduction of expectations about the reciprocity of yet unknown Trustees that was observed over all participants, (2) There is a clear asymmetry in the behavioral consequences of a negative (disappointment) and a positive (elation) RPE. Behavioral changes after elation are not systematic across participants as some of them showed no systematic deviation of the circular uniform distribution after elation while others showed a trend to increase (or decrease) expectations. We can argue about whether it is rational or fair to decrease expectations about a completely unknown person due to the behavior of others. However, in our experimental context, this rather universal tendency is clearly counter-productive as demonstrated by the smaller gains of Low-DTT participants.
Interestingly, while most studies in the literature have thus far focused on trust (Alesina and La Ferrara, 2002; Baumgartner et al., 2008), we observe here that expectation was a more sensitive variable to reflect the behavioral modifications following disappointment. Indeed, in a similar experimental setup, some researchers (van’t Wout and Sanfey, 2008) already reported an inexplicable decrease of trust toward an unknown partner because of the previous trial’s outcome. However, this influence was minor compared to the influence of the TR of the face, as rated by independent participants. van’t Wout and Sanfey (2008) found no significant interaction between TR of the face and previous outcome, suggesting that the TR rating was clearly more decisive for the investment decision than previous trial’s outcome. Unfortunately the authors did not quantify the expectation that is – according to our study – much more decisive for DM than trust as suggested by its decisive role in RPE and learning.
Inter-Individual Differences in the Tolerance to Disappointment
Beyond this general decrease in expectations following breaches in trust, we found large inter-individual differences in the tolerance to disappointment. Our results consequently support Bell’s (1985) assumptions: individuals more sensitive to disappointment adopt a more pessimistic view about the future. Indeed, within our sample, the group of Investors with lower DTTs invested less and expected less after being highly disappointed, which led them to earn significantly less money than the High-DTT group. In other words, their pessimistic views on future unknown Trustees induced by prior experience made them less effective in achieving their goals of maximizing gains. These elements combined with the shorter RTs (often considered as a core aspect of impulsivity, Whiteside and Lynam, 2001) favor an explanation in terms of impulsivity rather than being the reflection of the cognitive reassessment of the subject’s trust estimates [as for instance could be the case in other studies; Delgado et al., 2005]. This behavior was probably not fully conscious as not all participants reported a possible influence of outcomes in prior trials while most of them acknowledged that they might have adapted their choices as a function of personal feelings about categories of trustees (e.g., “Old people never betray”).
A Dual System Account for Biased Decisions
The dual-system theory (Evans, 2008) provides a plausible explanation to the maladaptive behavior of the Low-DTT group against the (mostly) well-adapted choices of the High-DTT group. Subjects in the High-DTT group earned more money but were slower than Low-DTT participants after disappointing outcomes suggesting the involvement of a more reflective but slower processing evoked by negative RPE. The electrophysiological results additionally support this view. First, the ERP appearing around 350 ms after the presentation of the outcome can be related to the family of feedback-related potentials (Falkenstein et al., 2000). It is present in both groups of subjects, reflecting the fact that they both discover a negative feedback. There is however a difference in the amplitude, the one of Low-DTT group being smaller. Interestingly, it has been shown recently that one of those feedback-related signals, the Outcome-Related-Positivity, is smaller and appears earlier in impulsive subjects (Kamarajan et al., 2009). This electrophysiological cue adds value to the interpretation of an impulsive behavior in the Low-DTT.
There is to our knowledge only one EEG study on the Ultimatum Game (Polezzi et al., 2008). The authors observed an FRN and concluded that it distinguishes between fair and other kinds of offers (mid-values and unfair). First, Polezzi et al. (2008) placed the emphasis on the analysis of FRN related to the evaluation of the offers rather than the assessment of the outcomes as we did. Second, their definition of FRN might not be compatible with the one used in other studies. Indeed, the lack of regularity in the definition of FRN makes difficult the interpretation of our ERP findings on the light of the feedback-related potentials literature. Contrarily to the well standardized sensory ERP responses, feedback-related ERP studies are hardly comparable as the definition of the components – as well as the parameters used to process the electrical data (e.g., reference electrode, subtract error from correct, etc) – is extremely variable. Moreover, it has been shown that cognitive strategies can regulate both physiological (skin conductance) and neural (striatum) signals (Delgado et al., 2008), which complicates again a clear comparison of the results yielded by different paradigms. Recently it has been suggested to denote Outcome-Related Potentials (Negativity/Positivity) all the signals that are linked to outcomes (Kamarajan et al., 2009). This terminology presents the advantage to encompass both the quality (gain/loss) and the quantity (small/large) dimensions. This is a first step, but maybe there should first be a consensus on the definition itself of those components, or the reference electrode used to show the data. Nevertheless, the asymmetry observed for disappointment and elation does however support the idea that neural mechanisms of feedback processing differ between gains and losses (Cohen et al., 2007).
The topographical analysis of EEG data revealed that at least two different configurations of neural generators were active in the High-DTT group during the evaluation of the outcome. Neither before nor after this window have we observed significant differences between conditions. Moreover, the map of the High-DTT group measured during disappointment at the interval of the differences did not appear later in the neutral conditions. The existence of differences in the distribution of generators implies that at least in one (more likely in a discrete set of brain voxels as enough synchronized activity is required to produce a measurable scalp EEG) the current density is larger in one condition than in the other.
In physical terms, the current density is a measure of the density of flow of a conserved charge given, in the case of neural tissue, by the flow of charged ions. Increases in current density are either caused by higher local information processing or higher afferent information within a voxel. Consequently, differences in scalp maps can be explained by either dynamic changes in: (a) the spatial configuration of the areas (voxels) activated by each task or alternatively, (b) synchronous (sufficient to be detectable at the scalp) input to some elements of the network and not to others that will necessarily lead to the activation or the inhibition (depending on input being excitatory or inhibitory) of these elements.
Consequently, from scalp map differences we can safely infer differences in the underlying distribution of generators from which we can infer that the neural structures activated by the compared conditions differ. The co-existence of different neural generators within identical individuals (the High-DTT group) rules out per se that anatomical differences are at the basis of electrophysiological differences. Similarly the electrophysiological analysis was designed to exclude differences due to trivial changes in generators such as inversion of the dipolar moment (leading to polarity inversions in the maps). Consequently the significant differences detected between the scalp topographies of Low and High-DTT participants or within the High-DTT group necessarily reflect differences in the brain areas implicated in the processing of the outcomes.
For neutral outcomes, we found no evidences for changes in neural generators (statistically identical maps across and within groups for neutral outcomes). Behaviorally, the distribution of expectations as a function of previous disappointment does not deviate from the uniform distribution for neutral outcomes and RTs were not different across the Low and High-DTT groups. Under neutral outcomes that coincide with subjects expectations no RPE should emerge and there is to need to use cognitive control to inhibit automatic responses. The automatic system might help to take fast decisions and to keep going on as long as the real outcomes are close to the expectations (neutral cases) but lead to avoidance (sometimes approach) reactions when the outcomes are worse (better) than expected as observed in Low-DTT subjects. Indeed, Low-DTT individuals tended to increase their expectations after experiencing elation in the previous trial. The short (20 ms) difference exclusive to High-DTT participants during elation further supports this interpretation. In contrast, the High-DTT group, who modify the neural generators, might have used the reflective system when confronted to unexpected outcomes, which helped them to adapt their behavior and avoid prejudiced social decisions. Thus, the particular role of the reflective system in this context seems to be to withhold the reflexive behavior by inhibiting the impulsive reaction to systematically decrease expectations about an unknown Trustee.
Importantly, if the results of this study were to support an emotional vs. rational explanation we should have found differences when comparing emotional to neutral outcomes in the group showing the bias (the Low-DTTs). However Low-DTT map topographies showed no differences as a function of previous trial’s outcome. The more plausible explanation of the fact that their high sensitivity to disappointment (strongly impacting their behavior) is not reflected in their maps is that the same generators (neural network) is responsible for all the aspects of their behavior. In this context the theory of an automatic system as described earlier fits well the data whereas there is little support for an interpretation in terms of emotional vs. rational dual system. It must be however acknowledged that this issue is not completely solved as it is based on accepting the null hypothesis for no topographical differences.
Scalp potential of High-DTT subjects in the case of extremely disappointing outcomes resembles the map linked to error or conflict detection elucidated in other studies (Holroyd et al., 2003, 2006; Cohen and Ranganath, 2007). This map has been localized to medial structures in the frontal wall (Carter and van Veen, 2007), in particular to the ACC. Interestingly, the ACC seems to have a general role in representing and updating action values (Ito et al., 2003; Matsumoto et al., 2003; Walton et al., 2004) and lesions to this structure in macaques lead to deficits in integration of the most recent outcome to guide choices (Kennerley et al., 2006). This fronto-central map is present only in High-DTT subjects although both groups showed a feedback-potential at this time point. Clearly, additional neuroimaging studies are required to identify the key components of the postulated reflective/reflexive systems. Our electrophysiological results are informative for these future studies as the differences we have found are short-lived (100 ms) and therefore hard to detect with low temporal resolution imaging techniques. Interestingly, the supposedly “slow” reflective system appears to be relatively fast, with initial activation at around 320 ms.
Questions about the way and the precise location where error prediction or feedback-related signals are generated currently shake the neuroscience community: is there a network whose activation reflects positive reward and de-activation negative signals (RPE)? Or are those signals processed in two different networks? Are we sure that those areas are not rather responding to the expectancy dimension? (for a glimpse on the debate, see Holroyd et al., 2003; Nieuwenhuis et al., 2004, 2007; Yeung et al., 2005; Hajcak et al., 2006; Holroyd and Krigolson, 2007). We hope to shed further light on these issues in the nearby future by a combination of source localization approaches and intracranial recordings in epileptic patients.
The consistent behavioral modification that follows negative RPE suggests that a sort of implicit learning is taking place. However, this learning is not fully explicit as according to the results of the questionnaire, the subjects are barely aware of the changes in behavior. This would suggest that regions linked to the dopaminergic reward system recruited for reinforcement learning as well as regions involved in learning such as the hippocampus are likely to be involved within social interaction tasks. Along this line, it has been previously reported that violations of expectations within the social domain activate striatal regions that are normally implicated in prediction error and valuation during appetitive and aversive conditioning (Harris and Fiske, 2010). Curiously, in the study from Harris and Fiske consistent expectations during this experiment activated areas involved in social cognition. The inter-individual differences we have reported here in the susceptibility of previous experience on future decisions might be therefore due to the differential involvement of prefrontal and striatal circuits in reaction to prediction errors. These differences might be genetically determined or a consequence of social learning but further studies are needed to understand the complex interactions existing between personality traits, social learning, and neural circuits underlying reward, learning, and prediction errors.
Whereas some previous studies investigated emotions such as regret and disappointment (Camille et al., 2004; Coricelli et al., 2007) in the context of DM, or related topics such as unfair revenge (Herrmann et al., 2008), no study has, to our knowledge, formally quantified disappointment (as defined by Bell) and manipulated it in a dynamic context to explore its neural correlates and behavioral consequences.
The merit and original contribution from this study stems from creating an experimental design in which: (1) disappointment is quantitatively measured according to the formal definition provided by Bell as both expectations and outcomes are controlled on a single trial basis, and (2) disappointment is isolated from regret as our participants blame the unknown Trustees (rather than themselves as required to elicit regret) for the consequences of their choices. We can therefore claim that this is, to our knowledge, the first study that deals with the future consequences of disappointment (alone) which is the emotion that more closely resembles the definition of a RPE as studied in the animal literature. Interestingly, dissociating disappointment from regret is essential to compare with the animal literature as regret is likely to involve high level cognitive processing not necessarily present in animals.
This study is then the first one to provide some formal evidence for the dual-system model (Sanfey and Chang, 2008) in DM by showing the involvement and interplay of two different configurations of neural generators within the same individuals as well as between different individuals (De Martino et al., 2006). Our results help to clarify circumstances under which each configuration of generators emerge, the consequences of relying upon one or another system and also the incidence of personality traits in deciding which system gains the upper hand.
Conflict of Interest Statement
The authors declare that the research was conducted in the absence of any commercial or financial relationships that could be construed as a potential conflict of interest.
Footnotes
- ^Portions of the research in this paper use the FERET database of facial images collected under the FERET program, sponsored by the DOD Counterdrug Technology Development Program Office.
- ^In addition, and to validate this classification, we used a more complex measure based upon estimating, for each participant, the probability of observing only negative changes in ER for disappointment values in the lower quartile. This measure provided a ranking of the participants identical to the one based on DTTs.
- ^We also tried to cluster (matlab “clusterdata” function using correlation as the distance) the subjects into three groups based on the EEG topography dominant during the interval where EEG differences were maximal (see inter-individual differences in coping with disappointment: causes and consequences). Except for some movement of subjects (three subjects) from one of the extreme (low and high) to the middle category, the grouping of the subject according to their electrophysiological signatures coincided very well with their grouping in behavioral terms as defined by the DTT.
References
Bateson, M., Nettle, D., and Roberts, G. (2006). Cues of being watched enhance cooperation in a real-world setting. Biol. Lett. 2, 412–414.
Baumgartner, T., Heinrichs, M., Vonlanthen, A., Fischbacher, U., and Fehr, E. (2008). Oxytocin shapes the neural circuitry of trust and trust adaptation in humans. Neuron 58, 639–M650.
Botvinick, M. M., Braver, T. S., Barch, D. M., Carter, C. S., and Cohen, J. D. (2001). Conflict monitoring and cognitive control. Psychol. Rev. 108, 624–652.
Caldu, X., and Dreher, J. C. (2007). Hormonal and genetic influences on processing reward and social information. Ann. N. Y. Acad. Sci. 1118, 43–73.
Camille, N., Coricelli, G., Sallet, J., Pradat-Diehl, P., Duhamel, J. R., and Sirigu, A. (2004). The involvement of the orbitofrontal cortex in the experience of regret. Science 304, 1167–1170.
Caplin, A., and Dean, M. (2008). Dopamine, reward prediction error, and economics. Q. J. Econ. 123, 663–701.
Carter, C. S., and van Veen, V. (2007). Anterior cingulate cortex and conflict detection: an update of theory and data. Cogn. Affect. Behav. Neurosci. 7, 367–379.
Cesarini, D., Dawes, C. T., Fowler, J. H., Johannesson, M., Lichtenstein, P., and Wallace, B. (2008). Heritability of cooperative behavior in the trust game. Proc. Natl. Acad. Sci. U.S.A. 105, 3721–3726.
Chua, H. F., Gonzalez, R., Taylor, S. F., Welsh, R. C., and Liberzon, I. (2009). Decision-related loss: regret and disappointment. Neuroimage 47, 2031–2040.
Cohen, M. X., Elger, C. E., and Ranganath, C. (2007). Reward expectation modulates feedback-related negativity and EEG spectra. Neuroimage 35, 968–978.
Cohen, M. X., and Ranganath, C. (2007). Reinforcement learning signals predict future decisions. J. Neurosci. 27, 371–378.
Coricelli, G., Critchley, H. D., Joffily, M., O’Doherty, J. P., Sirigu, A., and Dolan, R. J. (2005). Regret and its avoidance: a neuroimaging study of choice behavior. Nat. Neurosci. 8, 1255–1262.
Coricelli, G., Dolan, R. J., and Sirigu, A. (2007). Brain, emotion and decision making: the paradigmatic example of regret. Trends Cogn. Sci. 11, 258–265.
De Martino, B., Kumaran, D., Seymour, B., and Dolan, R. J. (2006). Frames, biases, and rational decision-making in the human brain. Science 313, 684–687.
Delgado, M. R., Frank, R. H., and Phelps, E. A. (2005). Perceptions of moral character modulate the neural systems of reward during the trust game. Nat. Neurosci. 8, 1611–1618.
Delgado, M. R., Gillis, M. M., and Phelps, E. A. (2008). Regulating the expectation of reward via cognitive strategies. Nat. Neurosci. 11, 880–881.
Evans, J. S. (2008). Dual-processing accounts of reasoning, judgment, and social cognition. Annu. Rev. Psychol. 59, 255–278.
Falkenstein, M., Hoormann, J., Christ, S., and Hohnsbein, J. (2000). ERP components on reaction errors and their functional significance: a tutorial. Biol. Psychol. 51, 87–107.
Fiorillo, C., Newsome, W., and Schultz, W. (2008). The temporal precision of reward prediction in dopamine neurons. Nat. Neurosci. 11, 966–973.
Grave de Peralta Menendez, R., Gonzalez Andino, S. L., Morand, S., Michel, C. M., and Landis, T. (2000). Imaging the electrical activity of the brain: ELECTRA. Hum. Brain Mapp. 9, 1–12.
Hajcak, G., Moser, J. S., Holroyd, C. B., and Simons, R. F. (2006). The feedback-related negativity reflects the binary evaluation of good versus bad outcomes. Biol. Psychol. 71, 148–154.
Harris, L. T., and Fiske, S. T. (2010). Neural regions that underlie reinforcement learning are also active for social expectancy violations. Soc. Neurosci. 5, 76–91.
Herrmann, B., Thoni, C., and Gachter, S. (2008). Antisocial punishment across societies. Science 319, 1362–1367.
Holroyd, C. B., Hajcak, G., and Larsen, J. T. (2006). The good, the bad and the neutral: electrophysiological responses to feedback stimuli. Brain Res. 1105, 93–101.
Holroyd, C. B., and Krigolson, O. E. (2007). Reward prediction error signals associated with a modified time estimation task. Psychophysiology 44, 913–917.
Holroyd, C. B., Nieuwenhuis, S., Yeung, N., and Cohen, J. D. (2003). Errors in reward prediction are reflected in the event-related brain potential. Neuroreport 14, 2481–2484.
Ito, S., Stuphorn, V., Brown, J. W., and Schall, J. D. (2003). Performance monitoring by the anterior cingulate cortex during saccade countermanding. Science 302, 120–122.
Kamarajan, C., Porjesz, B., Rangaswamy, M., Tang, Y., Chorlian, D. B., Padmanabhapillai, A., Saunders, R., Pandey, A. K., Roopesh, B. N., Manz, N., Stimus, A. T., and Begleiter, H. (2009). Brain signatures of monetary loss and gain: outcome-related potentials in a single outcome gambling task. Behav. Brain Res. 197, 62–76.
Kennerley, S. W., Walton, M. E., Behrens, T. E. J., Buckley, M. J., and Rushworth, M. F. S. (2006). Optimal decision making and the anterior cingulate cortex. Nat. Neurosci. 9, 940–947.
Matsumoto, K., Suzuki, W., and Tanaka, K. (2003). Neuronal correlates of goal-based motor selection in the prefrontal cortex. Science 301, 229–232.
Matsumoto, M., and Hikosaka, O. (2009). Two types of dopamine neuron distinctively convey positive and negative motivational signals. Nature 459, 837–841.
McCabe, K., Houser, D., Ryan, L., Smith, V., and Trouard, T. (2001). A functional imaging study of cooperation in two-person reciprocal exchange. Proc. Natl. Acad. Sci. U.S.A. 98, 11832–11835.
Mellers, B. A. (2001). Anticipated emotions as guides to choice. Curr. Dir. Psychol. Sci. 10, 210–214.
Mielke, P. W., and Berry, K. J. (2001). Permutation Methods: A Distance Function Approach. New York: Springer-Verlag.
Naatanen, R., Gaillard, A. W., and Mantysalo, S. (1978). Early selective-attention effect on evoked potential reinterpreted. Acta Psychol. (Amst.) 42, 313–329.
Nieuwenhuis, S., Schweizer, T. S., Mars, R. B., Botvinick, M. M., and Hajcak, G. (2007). Error-likelihood prediction in the medial frontal cortex: a critical evaluation. Cereb. Cortex 17, 1570–1581.
Nieuwenhuis, S., Yeung, N., Holroyd, C. B., Schurger, A., and Cohen, J. D. (2004). Sensitivity of electrophysiological activity from medial frontal cortex to utilitarian and performance feedback. Cereb. Cortex 14, 741–747.
Phillips, P. J., Moon, H., Rizvi, S. A., and Rauss, P. J. (2000). The FERET evaluation methodology for face recognition algorithms. IEEE Trans. Pattern Anal. Mach. Intell. 22, 1090–1104.
Phillips, P. J., Wechsler, H., Huang, J., and Rauss, P. (1998). The FERET database and evaluation procedure for face recognition algorithms. Image Vision Comput. 16, 295–306.
Polezzi, D., Daum, I., Rubaltelli, E., Lotto, L., Civai, C., Sartori, G., and Rumiati, R. (2008). Mentalizing in economic decision-making. Behav. Brain Res. 190, 218–223.
Quirk, G. J., and Beer, J. S. (2006). Prefrontal involvement in the regulation of emotion: convergence of rat and human studies. Curr. Opin. Neurobiol. 16, 723–727.
Roese, N. J., and Summerville, A. (2005). What we regret most… and why. Pers. Soc. Psychol. Bull. 31, 1273–1285.
Sally, B. (1995). When social outcomes aren’t fair: the effect of causal attributions on preferences. Organ. Behav. Hum. Decis. Process 63, 131–144.
Sanfey, A. G., and Chang, L. J. (2008). Multiple systems in decision making. Ann. N. Y. Acad. Sci. 1128, 53–62.
Schimmack, U., and Diener, E. (1997). Affect intensity: separating intensity and frequency in repeatedly measured affect. J. Pers. Soc. Psychol. 73, 1313–1329.
Schultz, W. (2010). Dopamine signals for reward value and risk: basic and recent data. Behav. Brain Funct. 6, 24.
Taylor, S. E. (1991). Asymmetrical effects of positive and negative events: the mobilization–minimization hypothesis. Psychol. Bull. 110, 67–85.
Van Dijk, W. W., Zeelenberg, M., and Van der Pligt, J. (2003). Blessed are they who expect nothing: lowering expectations as a way of avoiding disappointment. J. Econ. Psychol. 24, 505–516.
van’t Wout, M., and Sanfey, A. G. (2008). Friend or foe: the effect of implicit trustworthiness judgments in social decision-making. Cognition 108, 796–803.
Walton, M. E., Devlin, J. T., and Rushworth, M. F. (2004). Interactions between decision making and performance monitoring within prefrontal cortex. Nat. Neurosci. 7, 1259–1265.
Wendel, K., Väisänen, O., Malmivuo, J., Gencer, N. G., Vanrumste, B., Durka, P., Magjarevic, R., Supek, S., Pascu, M. L., Fontenelle, H., and Grave de Peralta Menendez, R. (2009). EEG/MEG source imaging: methods, challenges, and open issues. Comput. Intell. Neurosci. 2009, 1–12.
Whiteside, S., and Lynam, D. (2001). The five factor model and impulsivity: using a structural model of personality to understand impulsivity. Pers. Individ. Dif. 30, 669–689.
Wischniewski, J., Windmann, S., Juckel, G., and Brüne, M. (2009). Rules of social exchange: game theory, individual differences and psychopathology. Neurosci. Biobehav. Rev. 33, 305–313.
Yeung, N., Holroyd, C. B., and Cohen, J. D. (2005). ERP correlates of feedback and reward processing in the presence and absence of response choice. Cereb. Cortex 15, 535–544.
Keywords: disappointment, decision making, reward prediction error, EEG, dual system, inter-individual differences
Citation: Tzieropoulos H, Grave de Peralta R, Bossaerts P and Gonzalez Andino SL (2011) The impact of disappointment in decision making: inter-individual differences and electrical neuroimaging. Front. Hum. Neurosci. 4:235. doi: 10.3389/fnhum.2010.00235
Received: 11 June 2010;
Accepted: 16 December 2010;
Published online: 06 January 2011.
Edited by:
Francisco Barcelo, University of Illes Balears, SpainReviewed by:
Juliana Yordanova, Bulgarian Academy of Sciences, BulgariaManuel Garcia-Garcia, University of Barcelona, Spain
Copyright: © 2011 Tzieropoulos, Grave de Peralta, Bossaerts and Gonzalez Andino. This is an open-access article subject to an exclusive license agreement between the authors and the Frontiers Research Foundation, which permits unrestricted use, distribution, and reproduction in any medium, provided the original authors and source are credited.
*Correspondence: Sara L. Gonzalez Andino, Electrical Neuroimaging Group, Neurology Department, Geneva University Hospital, 24 Rue Micheli du Crest, 1211 Geneva 14, Switzerland. e-mail: sara.gonzalezandino@hcuge.ch