Abnormal speech spectrum and increased pitch variability in young autistic children
- 1 Department of Human Biology, University of Haifa, Haifa, Israel
- 2 School of Business Administration, Netanya Academic College, Netanya, Israel
- 3 Exaudios Technologies, Ramat-Gan, Israel
- 4 Hadassah Academic College, Jerusalem, Israel
- 5 The Institute for Vision Research, Kiron, Israel
Children with autism spectrum disorder (ASD) who can speak often exhibit abnormal voice quality and speech prosody, but the exact nature and underlying mechanisms of these abnormalities, as well as their diagnostic power are currently unknown. Here we quantified speech abnormalities in terms of the properties of the long-term average spectrum (LTAS) and pitch variability in speech samples of 83 children (41 with ASD, 42 controls) ages 4–6.5 years, recorded while they named a sequence of daily life pictures for 60 s. We found a significant difference in the group’s average spectra, with ASD spectra being shallower and exhibiting less harmonic structure. Contrary to the common impression of monotonic speech in autism, the ASD children had a significantly larger pitch range and variability across time. A measure of this variability, optimally tuned for the sample, yielded 86% success (90% specificity, 80% sensitivity) in classifying ASD in the sample. These results indicate that speech abnormalities in ASD are reflected in its spectral content and pitch variability. This variability could imply abnormal processing of auditory feedback or elevated noise and instability in the mechanisms that control pitch. The current results are a first step toward developing speech spectrum-based bio-markers for early diagnosis of ASD.
Introduction
The speech of many children with autism spectrum disorder (ASD) appears abnormal and is often described as machine-like, “monotonic,” or “sing-song.” These abnormalities of voice and speech were already noted in early descriptions of ASD (Kanner, 1943), but their exact characteristics and the underlying mechanisms, as well as their consistency and diagnostic power are currently unclear (e.g., McCann and Peppe, 2003; Paul et al., 2005). Thus, despite the potential for providing an objective and quantitative marker for ASD, the current diagnostic criteria do not include atypical vocalizations (DSM-IV, 2000).
Most previous studies focused on the abnormal supra-segmental aspects of speech production, or prosody, which were identified as a core feature of the autistic syndrome, for verbal individuals with ASD. Studies based on subjective ratings revealed “flat” intonation, deficits in the use of pitch and control of volume, deficiencies in vocal quality, and use of aberrant stress patterns (Tager-Flusberg, 1981; Shriberg et al., 2001; Rapin and Dunn, 2003), as well as a greater proportion of syllables with atypical phonation in pre-verbal children (Sheinkopf et al., 2000). More recent studies used objective measures to quantify speech abnormalities in ASD. These include a larger pitch range (Hubbard and Trauner, 2007; Sharda et al., 2010), a misplaced pitch peak in the sentence, and a flatter amplitude (Hubbard and Trauner, 2007), as well as a high incidence of “pitch excursions,” similar to the child-directed speech of mothers (Sharda et al., 2010). These results were based on a relatively small sample and effect size that do not allow assessing the diagnostic power of the measures. A third study (Oller et al., 2010) found a lower frequency of proper speech expressions in a large sample of children with ASD in long durations of natural speech, thus providing the first quantitative and automatic measure for speech abnormalities in ASD. Similar findings, however, were also obtained in children with delayed speech development.
In the current study we sought to develop a speech spectrum-based measure that will reliably discriminate between children with ASD and children with normal development. Such a bio-marker could add to the accumulating effort in developing quantitative and objective measures for ASD (e.g., Fan et al., 2009; Ecker et al., 2010) and might hopefully lead to early identification, which is thought to improve the effectiveness of treatment (Levy et al., 2009). We considered several speech measures that might discriminate those children with ASD from those having normal development. One such measure is the long-term average spectrum (LTAS), which provides an amplitude-by-frequency function of overall S behavior, averaging across many individual spectra derived from various vocal tract configurations (Lofqvist and Mandersson, 1987). The LTAS can provide some reliable and consistent measures of voice quality, obtained without requiring a periodic or repeated voice signal (Kitzing and Akerlund, 1993; de Krom, 1995; Goberman and Robb, 1999; Tanner et al., 2005), including measures that can discriminate between preterm and full-term baby cries (Goberman and Robb, 1999). Other measures to consider include spectral variability across time, pitch variability as well as pitch range, previously reported to be abnormal in ASD (Hubbard and Trauner, 2007).
Our approach was to investigate speech vocalization of a large group of young children with ASD under conditions that reduce the effect of social interaction and communication known to be abnormal in ASD. For that purpose, we chose a picture-naming task rather than free conversation. In this way we hoped to uncover speech characteristics that are less related to social and communicative expressions and examine effects that depend primarily on speech mechanisms and sensory motor processes. Our results compare favorably with other such measures and should be considered as a positive step toward developing speech-based diagnosis for ASD.
Materials and Methods
Participants
The study group consisted of 83 children (41 with ASD and 42 controls) ages 4–6.5 years, mean ± SD of 5.0 ± 1.1 and 5.1 ± 0.7 for the ASD and controls respectively. The autistic children were recruited from special-education preschools for ASD. All children had a clinical diagnosis of ASD based on DSM-IV criteria and were all verbal. Among the controls there were 17 boys and 24 girls, whereas in the ASD group the majority (80%) were boys, thus reflecting the gender distribution in the preschools. This discrepancy between the groups was controlled by investigating the effect of gender (see Results). The study was approved by the ethics committee for human subject research at the University of Haifa. Informed consent was obtained from a parent before participation.
Experimental Setting and Procedures
All children were individually recorded in a quiet room in their preschools, in the presence of their caretaker for a single period of about 60 s including between-word silences. There were three and five different recording sites for the control and ASD groups, respectively. The children were asked to name (in Hebrew) 36 pictures presented in a chess-like board. The first response was triggered by an oral question (“what’s that?”); then the experimenter kept pointing at the pictures, one after the other (without vocal prompting to avoid recording the experimenter’s voice), while the child named the pictures to which she pointed. To avoid potential stress, children were not instructed to read fast or complete reading the list of images. In the case of slow reading or breaks, the recording was extended for up to 90 s. The whole sequence was recorded with a digital audio recorder (SAFA, model SRM-160 used for all recordings) at a sampling rate of 8 ks/s. We noted that the lower sampling rate of 8 ks/s was sufficient for our purposes, since we were interested in the frequencies around the fundamental frequency of speech.
Data Analysis
Long-term average spectrum analysis
The 60-s time intervals, which included the between-word silences, were divided into successive (non-overlapping) 32-ms time windows spanning the time interval. These windows, which comprised 256 samples each, were transformed using a 256-point fast Fourier transform (FFT), and the square of the complex magnitude was taken of the first 64 frequency channels to form the power spectrum of the time window in the range 0–2000 Hz in steps of 31.25 Hz. The LTAS for the whole time interval was then computed as the channel-by-channel average of the power spectra for all the time windows in the time interval. The variability (SD) of each frequency across time (within the 60-s recordings) was analyzed in an extended range of 0–3000 Hz (96 frequency points) and was normalized by dividing by the power for each frequency.
The reduced frequency range (0–2000 Hz) for the LTAS analysis was chosen because the extended range (2000–3000 Hz) showed very low power and insignificant group differences, and was omitted for clarity. To determine the statistical significance of differences found between average spectra, we used a paired t-test between the average power values for each frequency point in the spectrum, 64 points in the range of 0–2000 Hz, and we applied False Discovery Rate analysis (FDR, α < 0.05) to determine the significance threshold (Benjamini and Yekutieli, 2001).
Pitch analysis
We analyzed the fundamental frequency or pitch in short time windows of 10 ms using the VoiceBox speech processing toolbox (M. Brookes, Imperial College, London), which provides an estimate of pitch across time. Preliminary analysis indicated that the pitch values were in part continuous, with small differences between adjacent (10 ms steps) measurements, and in part discontinuous with large pitch changes between adjacent estimates (20% of all changes >55 Hz, 10% >130 Hz), possibly reflecting a failure of the pitch detection algorithm, due to low signal at the border of words or due to noise. We analyzed the effect of these discontinuities separately by repeating all pitch analyses without the 20% largest ones, i.e., removing the two pitch samples around pitch changes larger than 55 Hz. Results with different discontinuity threshold were also investigated (see Results).
We computed the pitch range for each child as the difference between the maximum and minimum pitch values during the whole recording period, with and without the exclusion of pitch discontinuities (defined above), as well as outliers (values outside an interval of 5-SD from the mean). We computed normalized (divided by the total number of pitch samples) histograms of pitch values in 12 bins that span the pitch range and used the maxima of these histograms and the pitch SD across time as markers of pitch stability. The choice of the number of bins was done to maximize the difference between the experimental groups, but different values were explored (see Results). The choice of the classification threshold was done automatically for a single dimension (histogram maxima) by iteratively testing all potential values. For simplicity, we will use the term pitch hereafter to denote the estimated fundamental frequency.
Noise Level Estimation
Since the recordings were conducted in eight different sites and despite an effort to minimize noise, the level of background noise could have been different and could have affected the results. We computed the signal-to-noise ratio (SNR) of the recordings by using the VoiceBox toolbox (see above) to detect speech (Voice Activity Detection function), computed the RMS energy of speech and silence periods, and their ratio (SNR) in dB according to the standard formula.
Results
Properties of Reading
Overall, the reading speed and fluency of the two groups appeared similar with some small differences. The average recording length of the ASD group was slightly longer, 70 vs. 66 s for the controls. The average number of words in 60 s (a measure of reading speed) was manually computed to be 27.9 for the ASD group and 31.7 for the controls (a significant difference, p < 0.002). The ASD children spoke longer words, 0.74 s on average vs. 0.62 s of the controls (p < 0.015). As a result of this, the total recorded speech content was somewhat larger for the ASD children, 30.8 s on average vs. 25.8 s for the controls (insignificant difference, p = 0.2). We shall refer to the potential effect of these differences on the observed spectral differences in the results section for pitch variability.
Long-Term Average Spectrum
The results for the LTAS analysis appear in Figure 1. Figure 1A presents 10 examples of the normalized LTAS, five children with ASD, and five controls. Note that the controls generally have sharper and more numerous peaks in these power spectra, whereas the ASD spectra are shallower. The group average LTAS for the 41 ASD children and 42 controls appear in Figure 1B with a significant difference (p < 0.05 FDR corrected, see Materials and Methods) at certain frequencies: 300, 410–440, 1031, 1062, 1120, 1000–1300, and 1660–1750 Hz. Identical or very similar results were obtained with the silence periods removed. The difference between the group average spectra appears to reflect the shallower spectra of the ASD group, mainly around the first peak (around 250 Hz, corresponding to the fundamental frequency F0). On the other hand, the sharper, higher peaks of the controls average out owing to differences in peak positions.
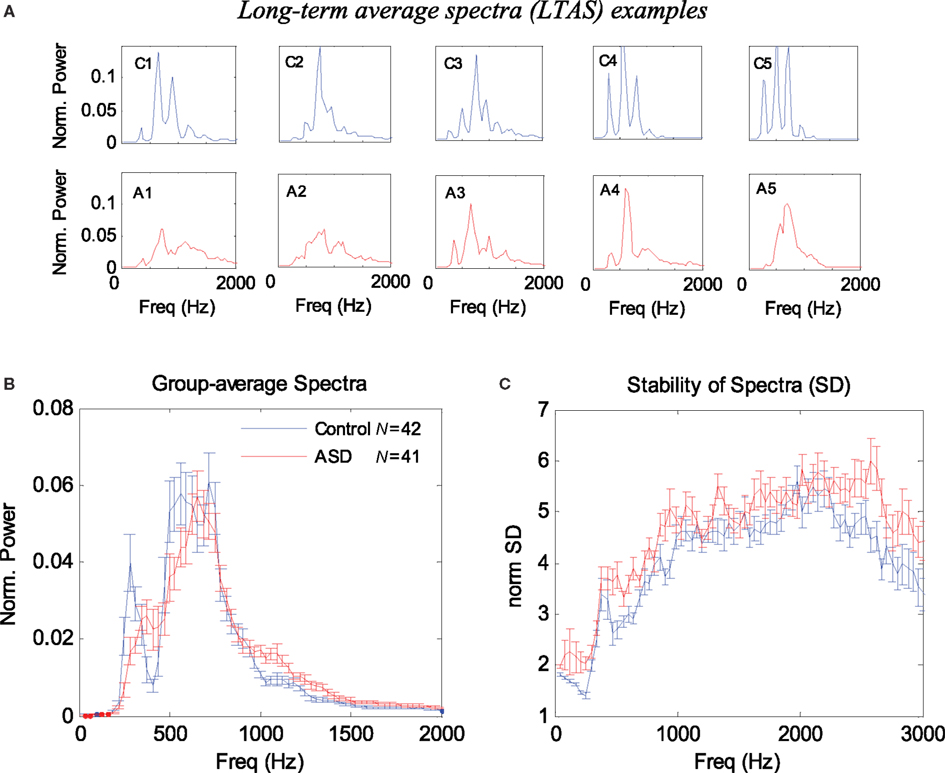
Figure 1. Long-term average spectrum (LTAS) analysis of 1-min speech (naming) of ASD and control children. (A) Examples of normalized LTAS of five controls (C1–C5) and five ASD children (A1–A5). Note that the controls have higher and more numerous spectral peaks, whereas the ASD curves are shallower. (B) Group average of normalized LTAS for 42 controls and 41 ASD children. Error bars denote one SE of the mean. (C) Group average of the stability of the spectra across time (SD divided by the power) for each frequency. Note in (A) that the controls exhibit sharper peaks and a more periodic (harmonic) structure of the spectra. Note in (C) that the ASD spectra are in general more variable across time.
We also considered alternative methods for quantifying the spectral differences between the ASD children and controls. In our first attempt, we used the normalized LTAS maxima since we observed that these maxima were generally higher in the controls (Figure 1A), and since an equivalent measure was previously used in LTAS studies (Goberman and Robb, 1999). The average LTAS peak was found to be significantly higher in the controls (p < 0.00001), but the optimal classification based on this measure achieved only 72% success. We then quantified the LTAS shape differences (less harmonic structure in ASD; see Figure 1A) using spectral analysis of the individual LTAS (spectrum of spectrum). The results were reported in abstract form (Adini et al., 2007) and showed that such a measure could be used for classifying ASD in the sample with >80% success. In the following sections, we present alternative quantification methods using measures of spectral variability that produce similar or better results but with a simpler interpretation.
Spectral Variability
It is possible that the difference in the average spectra results from larger spectral variability in the ASD group, which “blurs” or averages out the harmonic structure. We investigated the spectral variability across time by computing the SD for each frequency, excluding silence periods. Since higher spectral power normally produces higher variance, we normalized the SD by dividing it by the average spectral power for each frequency. The results appear in Figure 1C. Overall, the SD of the ASD children was higher in almost all frequencies and its mean across frequency differed significantly from the controls (p < 0.00008).
Pitch Variability
The results appear in Figure 2. Figure 2A presents examples of 15-s pitch time courses of two children: one control and one ASD. The larger pitch variability, apparent for the ASD child (see also Figure 2B for child A5), is primarily derived from short periods of continuous changes in pitch (upward or downward sweeps), rather than random values. Figure 2B presents the group averages of pitch range (top) and (SD, bottom). The pitch range was obtained while excluding periods around large pitch discontinuities and outliers (see Materials and Methods).The ASD children had a significantly larger pitch range (p < 0.005) and SD (p < 0.0004) than did the control children. However, when the outliers were included, the difference between groups was still significant (p < 0.04). When the pitch values around discontinuities were not excluded, the difference between groups became insignificant. We also found that the pitch range and variability were correlated across all children (r2 = ∼0.6), and pitch SD was moderately correlated with the pitch itself (r2 = ∼0.25), although no significant difference across groups was found for the average pitch (255 Hz for ASD, 248 Hz for controls). Overall, the pitch SD was a better discriminating parameter than pitch range, but we obtained an even better measure using the pitch histograms.
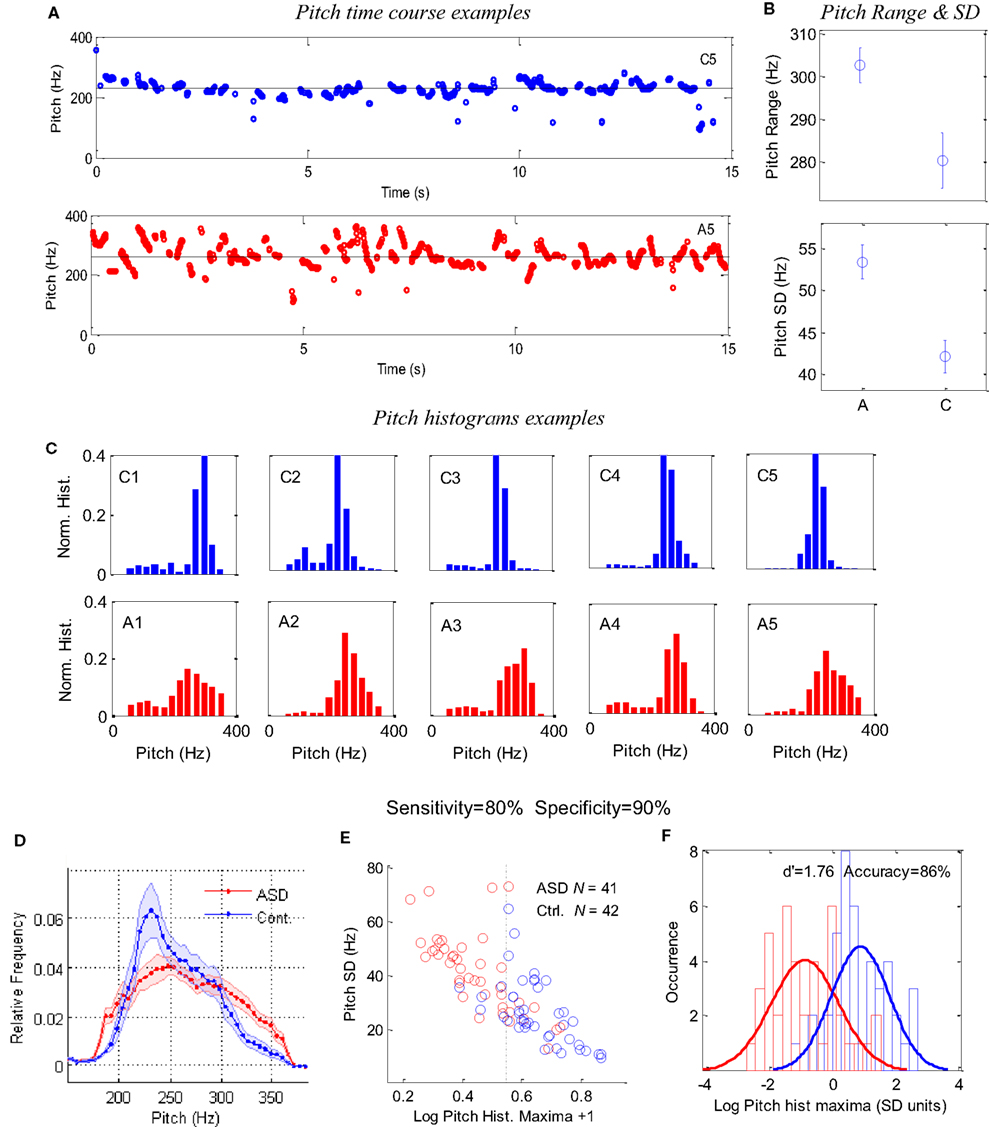
Figure 2. Pitch analysis of 1-min speech (naming) of ASD and control children. (A) Examples of 15-s pitch time courses for one control (top) and one autistic (bottom) children, demonstrating the difference in variability. (B) Group averages of pitch range and SD. (C) Examples of pitch occurrence histograms (across time in 10-ms windows) in five ASD children (A1–A5) and five controls (C1–C5); the same 10 children shown in Figure 1. The x-axis denotes pitch frequency (Hz) and the y-axis denotes a normalized occurrence histogram across time. (D) Group average of the pitch histograms for 41 ASD children and 42 controls. Error bars denote one SE of the mean, with points around 220 Hz showing a highly significant difference (p < 0.002). (E) A scatter plot for the pitch histogram height (log units, x-axis) and pitch SD (y-axis), with each point corresponding to one child. (F) Occurrence histogram for the data in (E) along the x-axis (pitch histogram maxima) with a Gaussian fit for each group, presented in SD units (average across groups) around the average of the means. The difference between the groups corresponds to a d′ of 1.76 and a threshold criterion allows 86% success in classification, with a sensitivity of 80%, a specificity of 90%, and a positive predictive value of 89% (four controls classified as ASD and eight ASD as controls).
Figure 2C presents examples of the normalized pitch histograms for a representative set of five ASD children and five normal controls. Quite strikingly, all histograms of the controls have a sharp peak between 200 and 300 Hz, whereas the pitch histograms of the ASD children are shallower and variable. The group averages of the normalized histograms are presented in Figure 2D. Interestingly, there is a marked discrepancy between groups, with points around 200 Hz displaying a highly significant difference (p < 0.0005; Bonferroni corrected significance is p < 0.0025).
The difference between the groups can be quantified more accurately by taking maxima of individual histograms and a pitch SD for each child and plotting them in the x and y axes of a scatter plot (Figure 2E). The two populations are distinct but with some overlap. An optimal classification threshold of 0.344 along the histogram-maxima dimension (x-axis) was found iteratively by the analysis program and yielded 86% success in classifying ASD in the sample (dashed line in Figure 2E). This distinction between the groups is further shown in Figure 2F by plotting normalized distribution histograms for the x-axis values in Figure 2E. The difference between the two peaks corresponds to a d′of 1.76 (distance in SD units). With this classification, there were four control children that were classified as ASD and eight ASD children classified as controls. This implies a sensitivity of 80% (33 of 41 ASD successfully detected), a specificity of 90% (38 of 42 controls successfully rejected) and a positive predictive value (PPV) of 89%. (33 true ASD “positives” out of 37 “positives”).
The results, presented in Figure 2, were obtained with pitch estimates that were filtered from regions around large discontinuities (see Materials and Methods); however, we also applied the analysis without this filtration and found similar results but with somewhat degraded classification (80%). This implies that large pitch discontinuities are not the source of the increased pitch variability we found in ASD. Overall, we found that the different quantification methods of the pitch variability and the different parameters such as the pitch discontinuity threshold and the number of histogram bins, all yield between 80 and 85% classification accuracy, so the finding is quite robust. Our specific choice of parameters was optimized for classification accuracy of this specific (relatively large) sample and therefore might not represent a realistic performance.
To rule out the possibility that the results could have been affected by the difference in the percentage of girls in the two groups, we compared boys and girls in the control group in terms of the LTAS (as in Figure 1B), the average pitch histogram (as in Figure 2C), and variability, and found no significant differences.
To rule out the possibility that the results could have been affected or modulated by the observed small differences in reading speed and accumulated speech duration, we repeated the analysis with equalized speech duration, which was obtained by proportionally cutting down the recorded speech length of each child in the ASD group. The results were similar (d′ = 1.81, 84% correct classification).
We also investigated the possibility that the results could have been affected by the difference in noise level at the different recording sites (see Materials and Methods). We found a similar average RMS power of the voice segments in the two groups, while the ASD group had elevated average power during the voiceless (silence) periods, yielding a lower SNR for the ASD group (24.9 ± 5.0 dB for ASD, 28.8 ± 4.65 dB for the Controls, p < 0.004). Since the SNR difference was only affected by non-vocal background noise (not detected as voice, e.g., air-condition noise, see Materials and Methods), it is unlikely to have affected pitch. Moreover, we found that the SNR was not correlated with the pitch variability across children within group (r2 = 0.008 in both groups) and thus was not the source for its variance. We therefore conclude that the small difference in SNR cannot explain the differences in pitch variability between groups.
Discussion
We reported here on simple quantitative measures for determining speech abnormalities observed in ASD, which are based on the basic spectral properties of speech. We tested these measures on a large sample (N = 83) of young children (age ∼ 5 years) and under conditions that normally minimize social expressions and emotions (1 min of picture naming). Our results indicate that the long-term average spectra of ASD children differed significantly from those of the controls with an overall larger spectral variability. We also analyzed pitch (F0) and found a larger pitch range and variability across time in the ASD group. In addition, we used measures of pitch variability to classify ASD in the sample with over 80% success. Our optimally tuned threshold yielded 86% success, a high specificity (90%, only four control children were classified as ASD), and good sensitivity (80%, eight children with ASD classified as controls). While 86% success might reflect a fit to a specific sample and not the actual performance of this method, the method appeared quite robust to the choice of parameters for producing above 80% success.
Our results could be compared with two recent studies of ASD speech (Hubbard and Trauner, 2007; Sharda et al., 2010), both reporting increased pitch range in ASD children, as we found here (Figure 2B). Sharda et al. (2010) studied a smaller sample of autistic children (15 ASD and 10 controls) with a wider age range (4–10) recorded during natural speech (compared to a naming task in our case). In addition to increased pitch range, they found that the pitch changes in the ASD group were characterized by exaggerated intonation contours, or pitch “excursions.” They identified these abnormal pitch patterns as similar in shape to those observed in the child-directed speech of mothers (“motherese”), presumably also similar to the speech of young children under 2 years, and suggested that the ASD children had a delayed developmental trajectory of speech. Our results reveal a similar pattern of exaggerated continuous pitch changes or “excursions” in some ASD cases (Figure 2A), which are likely to be a major source for the pitch variability we measured (in comparison, large pitch discontinuities had a negative effect on classification, see Results). However, we also observed some ASD cases whose pitch time course appeared different from a “motherese” pattern. Moreover, the hypothesis of a delayed developmental trajectory is inconsistent with the more general finding of aberrant rather than delayed development of language and prosody in ASD (Rapin and Dunn, 2003).
An alternative explanation for the increased pitch variability in the ASD group is a deficit in the mechanisms that control pitch. This deficit could stem from a problem at the reception level, at the production level, or at the connection between the two that provides the error signal for adjusting the speech. There is a growing body of evidence for abnormal auditory processing in autism (Rosenhall et al., 1999; Boddaert et al., 2004), which could cause a problem in speech reception (Gervais et al., 2004) and perhaps also an abnormal phonological representation in the cortex. There is also evidence of a general impairment in motor functioning (e.g., Freitag et al., 2006), which could suggest “clumsy speech.” Another possibility is that there is a fault in the functional connectivity between reception and production (see Houde et al. (2002) for the normal brain), which would be consistent with recent theories of autism that attribute the syndrome to abnormal cortical connectivity (Belmonte et al., 2004). Pitch variability could also reflect a compensation strategy of deliberate generation of large pitch changes to overcome a noisy channel assumed to transfer “efference copy” information for production error correction (e.g., Houde et al., 2007).
The current study should be regarded as a first step, which needs to be further elaborated. First, the results could have been affected by delayed development of expressive language, leading to reduced experience with speech, and delayed speech development in the ASD children. Although we did not assess expressive language in this pilot study, we noted that all children in both groups were able to name all the presented pictures. A second important issue is the specificity of the findings to ASD in comparison with other disorders such as specific language impairment (SLI) and dyslexia. Although this is a very important question to investigate, even if the outcome shows that our finding is not specific to autism but also encompasses other impairments, the entire spectrum of developmental language disorders would most likely benefit from an early risk assessment tool [see Herbert and Kenet (2007) for a suggested relation between language disorders and ASD]. A third issue to investigate is the possible relation between speech spectrum abnormalities and autism severity and its sub-classification. Future work should determine whether pitch variability or other spectral measures are correlated with the severity of autistic symptoms and whether the ASD children classified as non-ASD (20% by our current measure) represent a specific sub-classification of ASD. A fourth issue to investigate is the relation between speech abnormalities and auditory processing deficits. Evidence for such a relation would strengthen our interpretation of abnormal processing of auditory feedback as a cause for speech abnormalities.
Finally, we consider our measure of speech abnormalities in ASD and the derived classification as a step toward developing a battery of bio-markers for ASD, which are both quantitative and objective. Several recent studies indicate the plausibility of such a battery. These include the latency of pupil dilation with 92% success (Fan et al., 2009), a quantitative measure of atypical gaze patterns with 87% success (Nakano et al., 2010), and structural MRI differences with 90% success (Ecker et al., 2010). A combination of these and other measures has the potential of providing a reliable tool for early diagnosis.
Conflict of Interest Statement
The authors declare that the research was conducted in the absence of any commercial or financial relationships that could be construed as a potential conflict of interest.
Acknowledgments
We thank Drs. Noam Amir, Tal Kenet, and John Houde for helpful comments on preliminary versions of the manuscript. This study was supported by a Cure Autism Now (currently Autism Speaks) innovative technology for autism (ITA) grant and by a grant from the National Institute for Psychobiology in Israel to the first author.
References
Adini, Y., Bonneh, Y. S., Levanon, Y., Dean-Pardo, O., and Lossos, L. (2007). “Abnormal speech spectrum in young autistic children,” in International Meeting on Autism Research (IMFAR), Seattle, Washington.
Belmonte, M. K., Allen, G., Beckel-Mitchener, A., Boulanger, L. M., Carper, R. A., and Webb, S. J. (2004). Autism and abnormal development of brain connectivity. J. Neurosci. 24, 9228–9231.
Benjamini, Y., and Yekutieli, D. (2001). The control of the false discovery rate in multiple testing under dependency. Ann. Stat. 29, 1165–1188.
Boddaert, N., Chabane, N., Belin, P., Bourgeois, M., Royer, V., Barthelemy, C., Mouren-Simeoni, M. C., Philippe, A., Brunelle, F., Samson, Y., and Zilbovicius, M. (2004). Perception of complex sounds in autism: abnormal auditory cortical processing in children. Am. J. Psychiatry 161, 2117–2120.
de Krom, G. (1995). Some spectral correlates of pathological breathy and rough voice quality for different types of vowel fragments. J. Speech Hear. Res. 38, 794–811.
Ecker, C., Marquand, A., Mourao-Miranda, J., Johnston, P., Daly, E. M., Brammer, M. J., Maltezos, S., Murphy, C. M., Robertson, D., Williams, S. C., and Murphy, D. G. (2010). Describing the brain in autism in five dimensions – magnetic resonance imaging-assisted diagnosis of autism spectrum disorder using a multiparameter classification approach. J. Neurosci. 30, 10612–10623.
Fan, X., Miles, J. H., Takahashi, N., and Yao, G. (2009). Abnormal transient pupillary light reflex in individuals with autism spectrum disorders. J. Autism Dev. Disord. 39, 1499–1508.
Freitag, C. M., Kleser, C., Schneider, M., and von Gontard, A. (2006). Quantitative assessment of neuromotor function in adolescents with high functioning autism and Asperger syndrome. J. Autism Dev. Disord. 37, 948–959.
Gervais, H., Belin, P., Boddaert, N., Leboyer, M., Coez, A., Sfaello, I., Barthelemy, C., Brunelle, F., Samson, Y., and Zilbovicius, M. (2004). Abnormal cortical voice processing in autism. Nat. Neurosci. 7, 801–802.
Goberman, A. M., and Robb, M. P. (1999). Acoustic examination of preterm and full-term infant cries: the long-time average spectrum. J. Speech Lang. Hear. Res. 42, 850–861.
Herbert, M. R., and Kenet, T. (2007). Brain abnormalities in language disorders and in autism. Pediatr. Clin. North Am. 54, 563–583, vii.
Houde, J. F., Nagarajan, S. S., and Heinks-Maldonado, T. (2007). “Dynamic cortical imaging of speech compensation for auditory feedback perturbations,” in The 153rd Meeting of the Acoustical Society of America, Salt Lake City, UT.
Houde, J. F., Nagarajan, S. S., Sekihara, K., and Merzenich, M. M. (2002). Modulation of the auditory cortex during speech: an MEG study. J. Cogn. Neurosci. 14, 1125–1138.
Hubbard, K., and Trauner, D. A. (2007). Intonation and emotion in autistic spectrum disorders. J. Psycholinguist. Res. 36, 159–173.
Kitzing, P., and Akerlund, L. (1993). Long-time average spectrograms of dysphonic voices before and after therapy. Folia. Phoniatr (Basel) 45, 53–61.
Lofqvist, A., and Mandersson, B. (1987). Long-time average spectrum of speech and voice analysis. Folia. Phoniatr (Basel) 39, 221–229.
McCann, J., and Peppe, S. (2003). Prosody in autism spectrum disorders: a critical review. Int. J. Lang. Commun. Disord. 38, 325–350.
Nakano, T., Tanaka, K., Endo, Y., Yamane, Y., Yamamoto, T., Nakano, Y., Ohta, H., Kato, N., and Kitazawa, S. (2010). Atypical gaze patterns in children and adults with autism spectrum disorders dissociated from developmental changes in gaze behaviour. Proc. Biol. Sci. 277, 2935–2943.
Oller, D. K., Niyogi, P., Gray, S., Richards, J. A., Gilkerson, J., Xu, D., Yapanel, U., and Warren, S. F. (2010). Automated vocal analysis of naturalistic recordings from children with autism, language delay, and typical development. Proc. Natl. Acad. Sci. U.S.A. 107, 13354–13359.
Paul, R., Augustyn, A., Klin, A., and Volkmar, F. R. (2005). Perception and production of prosody by speakers with autism spectrum disorders. J. Autism Dev. Disord. 35, 205–220.
Rapin, I., and Dunn, M. (2003). Update on the language disorders of individuals on the autistic spectrum. Brain Dev. 25, 166–172.
Rosenhall, U., Nordin, V., Sandstrom, M., Ahlsen, G., and Gillberg, C. (1999). Autism and hearing loss. J. Autism Dev. Disord. 29, 349–357.
Sharda, M., Subhadra, T. P., Sahay, S., Nagaraja, C., Singh, L., Mishra, R., Sen, A., Singhal, N., Erickson, D., and Singh, N. C. (2010). Sounds of melodypitch patterns of speech in autism. Neurosci. Lett. 478, 42–45.
Sheinkopf, S. J., Mundy, P., Oller, D. K., and Steffens, M. (2000). Vocal atypicalities of preverbal autistic children. J. Autism Dev. Disord. 30, 345–354.
Shriberg, L. D., Paul, R., McSweeny, J. L., Klin, A. M., Cohen, D. J., and Volkmar, F. R. (2001). Speech and prosody characteristics of adolescents and adults with high-functioning autism and Asperger syndrome. J. Speech Lang. Hear. Res. 44, 1097–1115.
Tager-Flusberg, H. (1981). On the nature of linguistic functioning in early infantile autism. J. Autism Dev. Disord. 11, 45–56.
Keywords: autism, speech, pitch variability, ASD
Citation: Bonneh YS, Levanon Y, Dean-Pardo O, Lossos L and Adini Y (2011) Abnormal speech spectrum and increased pitch variability in young autistic children. Front. Hum. Neurosci. 4:237. doi: 10.3389/fnhum.2010.00237
Received: 08 October 2010;
Accepted: 21 December 2010;
Published online: 19 January 2011.
Edited by:
Kenneth Hugdahl, University of Bergen, NorwayReviewed by:
Kimmo Alho, University of Helsinki, FinlandKarsten Specht, University of Bergen, Norway
Copyright: © 2011 Bonneh, Levanon, Dean-Pardo, Lossos and Adini. This is an open-access article subject to an exclusive license agreement between the authors and the Frontiers Research Foundation, which permits unrestricted use, distribution, and reproduction in any medium, provided the original authors and source are credited.
*Correspondence: Yoram S. Bonneh, Department of Human Biology, University of Haifa, Haifa, Israel. e-mail: yoram.bonneh@gmail.com