The temporal evolution of electromagnetic markers sensitive to the capacity limits of visual short-term memory
- Medical Research Council Cognition and Brain Sciences Unit, Cambridge, UK
An electroencephalographic (EEG) marker of the limited contents of human visual short-term memory (VSTM) has previously been described. Termed contralateral delay activity, this consists of a sustained, posterior, negative potential that correlates with memory load and is greatest contralateral to the remembered hemifield. The current investigation replicates this finding and uses magnetoencephalography (MEG) to characterize its magnetic counterparts and their neural generators as they evolve throughout the memory delay. A parametric manipulation of memory load, within and beyond capacity limits, allows separation of signals that asymptote with behavioral VSTM performance from additional responses that contribute to a linear increase with set-size. Both EEG and MEG yielded bilateral signals that track the number of objects held in memory, and contralateral signals that are independent of memory load. In MEG, unlike EEG, the contralateral interaction between hemisphere and item load is much weaker, suggesting that bilateral and contralateral markers of memory load reflect distinct sources to which EEG and MEG are differentially sensitive. Nonetheless, source estimation allowed both the bilateral and the weaker contralateral capacity-limited responses to be localized, along with a load-independent contralateral signal. Sources of global and hemisphere-specific signals all localized to the posterior intraparietal sulcus during the early delay. However the bilateral load response peaked earlier and its generators shifted later in the delay. Therefore the hemifield-specific response may be more closely tied to memory maintenance while the global load response may be involved in initial processing of a limited number of attended objects, such as their individuation or consolidation into memory.
Introduction
We are strikingly limited in how many items we can hold in visual short-term memory (VSTM). Although VSTM capacity (K) varies across individuals and testing conditions (Jiang et al., 2000; Alvarez and Cavanagh, 2004; Vogel and Machizawa, 2004; Todd and Marois, 2005; Scolari et al., 2008; Cusack et al., 2009), it is consistently estimated to lie between two and four items (Luck and Vogel, 1997; Cowan, 2001; Zhang and Luck, 2008).
Recent progress in characterizing the neural manifestation of this limit has identified physiological markers of VSTM load using both functional magnetic resonance imaging (fMRI; Todd and Marois, 2004) and electroencephalography (EEG; Vogel and Machizawa, 2004). The critical insight of these papers was that by parametrically varying set-size below and beyond VSTM capacity, memory-related activity could be isolated from responses to sensory stimulation and task difficulty that have linear rather than asymptotic relationships to set-size. These findings have stimulated further research on the nature of the memory representations (Song and Jiang, 2006; Xu and Chun, 2006; Xu, 2007), similar limitations in less mnemonic situations (Drew and Vogel, 2008; Mitchell and Cusack, 2008; Emrich et al., 2009), relationships with selective attention (Vogel et al., 2005; McNab and Klingberg, 2008; Woodman and Vogel, 2008), and effects of sleep deprivation (Chuah and Chee, 2008).
The EEG marker of VSTM load comprises a negative potential, sustained through the delay period, that correlates with K, and peaks at posterior electrodes contralateral to the attended hemifield (Vogel and Machizawa, 2004; McCollough et al., 2007). It has therefore been termed contralateral delay activity (CDA)1. A recent magnetoencephalography (MEG) study (Robitaille et al., 2010) places its generators in the superior intraparietal sulcus (IPS). In contrast, fMRI studies of VSTM typically present central stimuli, reporting bilateral activation focused in posterior parietal cortex (Linden et al., 2003; Todd and Marois, 2004; Xu and Chun, 2006; Mitchell and Cusack, 2008). Surprisingly, this response has recently been shown to remain bilateral even when the memoranda are lateralized (Robitaille et al., 2010). One possibility for this discrepancy is that fMRI can only resolve hemodynamic changes that integrate neural activity over a few seconds, in contrast to the millisecond resolution of EEG/MEG. However, existing studies of the CDA typically sacrifice this temporal precision by calculating statistics after collapsing across the whole delay period (Vogel and Machizawa, 2004; Robitaille et al., 2010). Although the usefulness of such aggregate measures is shown by their correlation with individual differences in behavior (Vogel and Machizawa, 2004) the manner in which the signal unfolds would provide further insight into the dynamic relationships of different components and the cognitive processes that they might reflect. For example, a true memory representation would be expected to last throughout the entire memory delay, encoding and consolidation operations may be stronger early on, while processes related to response anticipation may ramp up at the end of the delay.
The current study uses Bayesian statistics to map the evolution of different components of the evoked electromagnetic fields over the course of a VSTM trial, quantifying the significance of sensor-level and source-level effects across the group, while avoiding problems of correcting for multiple comparisons across space and time. Contralateral and bilateral responses are distinguished, and compared with their EEG counterparts collected simultaneously in a subset of subjects. By using set-sizes spanning sub-capacity and supra-capacity memory loads, load-dependent effects are separated into those asymptoting at the capacity limit of VSTM, and additional linear components that are more likely to be related to task difficulty (or overall visual stimulation in the bilateral case).
Materials and Methods
Participants
Seventeen subjects were recruited, of whom eleven were female and one was the first author. Ages ranged between 20 and 38 years, with a mean age of 26. All subjects reported normal or corrected-to-normal visual acuity, normal color vision, and no history of psychological or neurological impairment. All gave informed consent and were reimbursed for participating. MEG was acquired from all 17, while EEG was simultaneously acquired from a subset of 7. Ethical approval was obtained from Cambridge Psychology Research Ethics Committee (CPREC).
Stimuli and Task
The VSTM task (Figure 1) was designed to be similar to that employed by Vogel and Machizawa (2004). Each trial began with a central arrow (200 ms), directing subjects to attend covertly to either the left or right side of the screen, whilst maintaining central fixation. A bilateral pair of memory arrays, centered 3° either side of fixation, were then presented for 150 ms. The to-be-remembered array consisted of 1, 2, 4, or 6 colored squares, each with sides 0.65° in length. Their centers were positioned randomly within 4° × 7.3° rectangles, with the constraint that none came closer than 2°. Colors were randomly sampled from a highly distinguishable set, of red, green, blue, yellow, cyan, magenta, black, and white, with a maximum of one repetition per color. The distracter array was of the same set-size as the attended array and was randomly selected from those arrays being attended on the other trials. A blank retention interval followed, whose duration was randomly jittered between 900 and 1500 ms according to a uniform distribution. This was followed by a test display identical to the memory array, except that on half of the trials a single item in the attended memory array was replaced with another color from the set (again, allowing no more than one repetition per color). Subjects responded as soon as the test display appeared, using the index fingers of their left and right hands to indicate whether or not one of the items had changed color. Response mapping was counterbalanced across subjects. The test display remained on the screen for 1750 ms, and was then followed by a blank inter-trial interval of 300–400 ms.
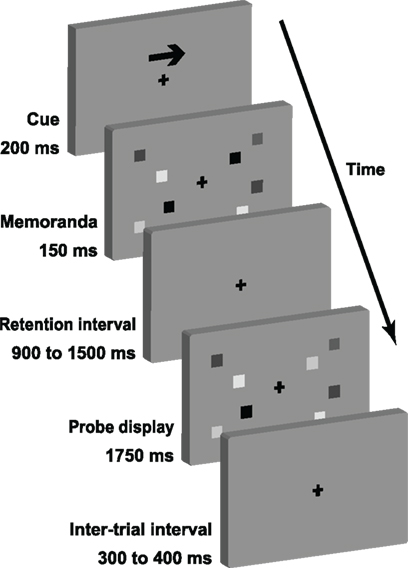
Figure 1. The sequence of each trial of the change detection task. Actual memoranda varied in color rather than gray scale.
Participants performed two identical blocks, each consisting of 240 trials and lasting approximately 15 min. Cued hemifield, set-size, and same/different probes were fully randomized and counterbalanced within each block. Volunteers were provided with written and verbal instructions, and requested to respond within 2 s, concentrating on accuracy, but guessing when unsure. They performed at least 32 practice trials, until they and the experimenter were satisfied that they understood the procedure.
Stimuli were generated and presented using Visual Basic.NET, running under Windows XP on a Dell Precision 380 computer. They were back-projected onto a screen at a resolution of 1024 × 786 and a refresh rate of 60 Hz, using a Panasonic DLP projector. The background was mid gray, with a small, black, central cross, to be fixated at all times.
Data Acquisition
Magnetic fields were recorded using an Elekta Neuromag VectorView system (Stockholm/Helsinki). The sensor array contained 306 superconducting quantum interference devices arranged in 102 triplets, each consisting of a magnetometer and a pair of orthogonal planar gradiometers. The device was located within a light, magnetically shielded room. Active shielding was used to further suppress external interference via a negative feedback loop (Simola et al., 2004). Volunteers were seated and responded using optical button boxes held in either hand. Magnetic and electrical signals were sampled at a rate of 1 kHz, with a high pass filter cut-off at 0.03 Hz. Triggers were recorded to mark the time of events of interest, including the onset of visual stimuli and button presses.
The head position relative to the sensor array was measured at the beginning of each block by injecting weak current through four head position indicator coils attached to the scalp, whose positions were previously digitized relative to nasion and auricular anatomical landmarks using a 3D digitizer (Fastrak Polhemus Inc., Colchester, VA, USA). Approximately 70 points over the surface of the scalp were also digitized to allow precise coregistration of the MEG data with the subjects’ structural MRIs.
Electro-oculograms (EOG) were recorded from bipolar electrodes for all subjects. Horizontal eye movements were monitored by an electrode pair placed at the temples. Vertical eye movements and blinks were monitored by an electrode pair placed above and below the left eye. Additionally, in seven subjects, EEG activity was recorded concurrently using a 70 electrode elastic cap from Elekta Neuromag. Electrodes used included the international 10–20 system sites: FP1, FP2, F7, F3, Fz, F4, F8, T3, C3, Cz, C4, T4, T5, P3, Pz, P4, T6, O1, O2. A further 24 electrode sites covering the back of the head were used as this is where the strongest VSTM-related signal was expected to be observed (Vogel and Machizawa, 2004). The reference electrode was placed on the nose, leading to a total of 44 electrodes.
Sensor-Level Analysis
Noticeably malfunctioning sensors were first excluded manually (ranging from 0 to 6 across acquisitions). Initial pre-processing of the MEG data was performed using signal space separation (Taulu et al., 2005), and its spatiotemporal extension (Taulu and Simola, 2006) to suppress external noise sources, implemented with the MaxFilter software (Elekta Neuromag, Helsinki; default number of basis functions; correlation threshold of 0.9, and 10 s sliding window for spatiotemporal extension). This method also allows the sensor-space signal from participants whose heads are in slightly different positions to be transformed into a common coordinate frame. This can correct for subject movement, and facilitate group-level statistical inference at the sensor level by coregistering the data from different subjects. In the current context, such transformation is especially important in allowing assessment of bilateral and contralateral signals, by realigning the data as though the subjects’ heads were perfectly aligned with the sagittal midline of the helmet (with the best-fitting sphere to the scalp lying 13 mm in front of, and 6 mm below, the origin of the device coordinate frame). At this stage, data were also temporally down-sampled by a factor of four.
Subsequent analysis was performed using SPM5 (Wellcome Trust Centre for Neuroimaging, UCL, London) and Matlab (The MathWorks Inc.). Continuous data were bandpass filtered from 0.25 to 40 Hz to attenuate low and high frequency signal that was expected to reflect noise, rather than signal of interest, for example breathing artifacts and mains noise respectively. This used a fifth-order Butterworth filter in both forward and reverse directions. The independent component analysis (ICA) tools of EEGLAB (Delorme and Makeig, 2004) were then used to automatically detect and project out components associated with blink, saccade, and pulse artifacts (Jung et al., 2000; Mennes et al., 2010). (A principal components analysis first reduced the MEG data to 65–67 orthogonal spatial components, to improve the stability of the subsequent ICA by ensuring >50 data samples per weight in the unmixing matrix being estimated.) Independent components were then projected out of the original data if their time-course showed a correlation >0.3 with the signal from either the horizontal or vertical EOG channels, or had a spatiotemporal profile indicative of a pulse artifact.
Epochs were extracted spanning −150 to 1850 ms around the onset of each cue, and baseline-corrected by subtraction of the mean pre-trigger signal from all time-points, for each channel. Epochs from the two sessions were then concatenated for each subject. Simple thresholding was used to mark and exclude bad epochs. Epochs were rejected if the absolute EEG signal exceeded 120 μV, or the absolute MEG signal exceeded 5000 fT or 5000 fT/cm. Further trials were rejected if saccades were suspected on the basis of large horizontal EOG signal: if the mean post-trigger magnitude exceeded 6 SDs of the mean pre-trigger magnitude across trials, or if the maximum post-trigger magnitude exceeded 7 SDs of the mean maximum pre-trigger magnitude across trials. Across subjects and blocks, 2–38% (median 7%) of epochs were rejected from the MEG data, while 2–39% (median 10%) of trials were rejected from the EEG data. EEG data were re-referenced to the average of all channels after bad channels had been discarded.
Time–frequency analysis of the MEG data used Morlet wavelet decomposition with six cycles per wavelet, at frequencies from 5 to 40 Hz. At each frequency and time-point this provided measures of the power of induced oscillations (i.e., time-locked but not necessarily phase-locked to the sample) and the degree to which these were of similar phase across trials (phase-locking factor). Time–frequency representations were then averaged across all MEG sensors on either side of the helmet.
Source Localization
Source localization was performed using data from all MEG sensors. To construct the forward model, a high resolution, T1-weighted structural MRI was segmented, to generate meshes of the scalp surface and the inner surface of the skull, each containing 2002 vertices. Also from this T1-weighted MRI, the spatial transformation mapping each subject’s brain into standard Montreal Neurological Institute (MNI) space was derived using SPM’s “normalization”. The resultant normalization parameters were then used to calculate the reverse mapping from a canonical cortical mesh in MNI space back into the individual space of each subject’s MRI. The canonical mesh consisted of 8196 nodes, tessellating the gray/white matter boundary of a single subject, with a mean inter-node distance of 4 mm. This procedure avoids repeated manual intervention and expertise involved in cortical segmentation, simplifies the comparison of results across subjects, and facilitates the comparison of MEG data with MRI data in MNI space. Any inaccuracies inherent in the process are insignificant at the spatial resolution of MEG data (Mattout et al., 2007; Henson et al., 2009). For three subjects for whom a structural MRI was unavailable, the canonical mesh was used as a surrogate without inverse normalization. The MEG sensor locations and each subject’s cortical mesh were then aligned (using SPM’s “coregistration”) by translation and rotation of the segmented scalp surface to match the scalp points digitized in the MEG coordinate frame.
Source localization used a model in which the neural generators were constrained to be current dipoles lying on the cortical mesh, oriented perpendicular to its surface. A forward model was defined using Maxwell’s equations to calculate the “lead-field matrix” that maps a unit current dipole, at each node on the cortical mesh, to the magnetic field pattern that it would produce at the sensors. This was constructed using the Brainstorm functions2 included in SPM5. A boundary element model treated the inner skull surface as the boundary of a homogeneous conduction volume, which is likely to be more accurate than single-sphere or overlapping-sphere approximations (Henson et al., 2009).
To estimate the neural sources that produced the observed magnetic field changes, this forward model was inverted using parametric empirical Bayes techniques (Phillips et al., 2005; Friston et al., 2006). A “multiple sparse priors” approach (Friston et al., 2008) used 256 spatial priors per hemisphere, which described local, smooth patches tessellating the cortical mesh, and a further 256 priors that consisted of bilaterally symmetric pairs of patches. These priors encourage solutions in which brain activity is sparse, but locally smooth. It has been shown that the resultant solutions tend to have greater posterior probabilities than those produced under alternative assumptions such as the L2 minimum norm, and that no improvement in model-evidence is gained by allowing dipoles to be freely oriented rather than constrained to the surface normal (Henson et al., 2009). Data were inverted separately for each subject, with the initial weights of the source priors defined on the basis of a preliminary inversion of the group averaged data (Litvak and Friston, 2008).
Statistical Assessment of Bilateral and Contralateral Effects
To assess the statistical significance of effects at the sensor level, data from the sensors across the head were interpolated onto a 2D plane for each point in time, to generate a 3D sensor-by-sensor-by-time volume. This allowed the use of standard statistical parametric mapping techniques (as implemented in SPM5), to reveal the latency and location of significant group effects, without imposing a priori assumptions or post hoc selection. Data were smoothed by a Gaussian kernel with full-width-half-maximum of 10 mm × 10 mm × 20 ms, to accommodate inter-subject variability in location and latency. To quantify lateralized and bilateral effects, this volume was then compared with itself after reflection about the anterior–posterior axis of the sensor array: in EEG, a bilaterally symmetric current distribution evokes a symmetric distribution of potentials; therefore bilateral effects were assessed by averaging signal across each bilateral pair of electrodes; lateralized effects were assessed by taking the difference of the two sides, with any resultant non-zero signal reflecting asymmetric sources. Estimates of source power were treated similarly, after smoothing with a 3D isotropic Gaussian kernel of 13 mm full-width-half-maximum, to accommodate residual inter-subject variations in functional and gyral anatomy. Bilateral and lateralization measures were similarly derived in each MEG sensor type to reveal symmetric and anti-symmetric sources, respectively. The orientation of the sensors in the MEG helmet was such that symmetric sources produced signals in the latitudinal gradiometers that were also symmetric about the left–right axis of the helmet, but signals in the magnetometers and longitudinal gradiometers that were anti-symmetric. Thus, for the latter two sensor types the average of opposing sensors measured lateralized sources, whereas the difference measured bilateral activity.
The resultant 3D volumes were then contrasted across the experimental conditions to derive effects of interest for each subject. (Vectors of contrast coefficients summed to zero and their squares summed to unity.) The linear contrast of load was orthogonalized with respect to the K-weighted contrast before being fit to the data, such that the overall load modulation was partitioned into the sum of capacity-limited and additional linear components. These first-level contrasts were rescaled by their vector length across all locations and time-points, and entered into a second-level Bayesian model to allow generalization to the population and assessment of statistical significance via posterior probability maps (Friston et al., 2002). This identified points in space and time where there was >99% likelihood of signal exceeding a given effect size, taken to be 2 SDs from the mean signal magnitude during the baseline period (or the maximum absolute baseline activity in the case of the source estimates).
Behavioral Analysis
The number of remembered items (K) was estimated using the formula K = S(H − F) suggested by Cowan (2001), where S is the set-size, H is the hit-rate, and F is the false-alarm-rate. Signal detection theory was also used to estimate sensitivity (d′) and response bias (c). These dependent measures, along with reaction time (RT), were analyzed using repeated-measures ANOVA, applying a Greenhouse–Geisser correction where the sphericity assumption was violated. Each analysis contained within-subject factors of block (first, second), cued hemifield (left, right), and set-size (1, 2, 4, 6).
Results
Behavioral
Task performance is illustrated in Figure 2. As expected, K, d′, and RT were all dependent on set-size [F(3,39) = 45.1, p < 0.001, F(3,39) = 123, p < 0.001, and F(3,39) = 97.5, p < 0.001, respectively]. Bonferroni-corrected, pair-wise comparisons confirmed that the number of retained items increased with each increase in set-size from one to four (both p < 0.001), but showed no significant difference between set-sizes of four and six items (p > 0.05). On average, K asymptoted at approximately 2.4 items (Figure 2, left panel). In contrast, d′ did not differ between set-sizes one and two (p > 0.05), but dropped significantly with each increase in set-size thereafter (both p < 0.05; Figure 2, central panel). RT increased with every increase in set-size (all p < 0.05; Figure 2, right panel). As might be expected, RT was shorter for the second block [F(1,13) = 29.8, p < 0.001], however this practice effect did not interact with any other variables and was not observed for d′ or K. This decrease in RT in the absence of an accuracy cost suggests that subjects remained attentive throughout the experiment. Response bias (c) was unaffected by block, cue, or set-size. There were no interactions between any of the three factors.
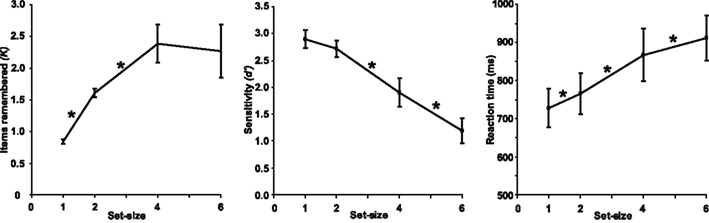
Figure 2. Mean behavioral performance across subjects. Error bars represent between-subjects 95% confidence intervals. Asterisks indicate significant differences between neighboring set-sizes (p < 0.05, Bonferroni-corrected).
Replication of Load-Dependent CDA in EEG
The prefixes e- and m- will be used when referring to CDA to distinguish responses measured with EEG and MEG respectively. The EEG data were broadly consistent with those reported by Vogel and colleagues (Vogel and Machizawa, 2004; McCollough et al., 2007). During the delay period, the signal at posterior electrodes became more negative as K increased; at larger set-sizes this negativity was most prominent at electrodes contralateral to the memorized array. The modulation of the CDA with set-size is illustrated on the left of Figure 3. The top-left panel shows orthogonal sections through the electrode-by-time volume representing the contralateral effect of load (i.e., the interaction of cue direction (left–right) with the K-weighted contrast of set-size, after subtracting from each voxel the signal at the opposite location). Cold colors on the right-hand side reflect the known load-dependent eCDA: signal that becomes more negative with set-size, more so at contralateral than ipsilateral sites with respect to the attended array. Although the full sensor array is shown in the figures, discussion and statistics will be confined to the right side due to the symmetrical redundancy of the data. Figures 4A,B break this down into the eCDA time-course at each set-size, averaged over selected posterior electrodes.
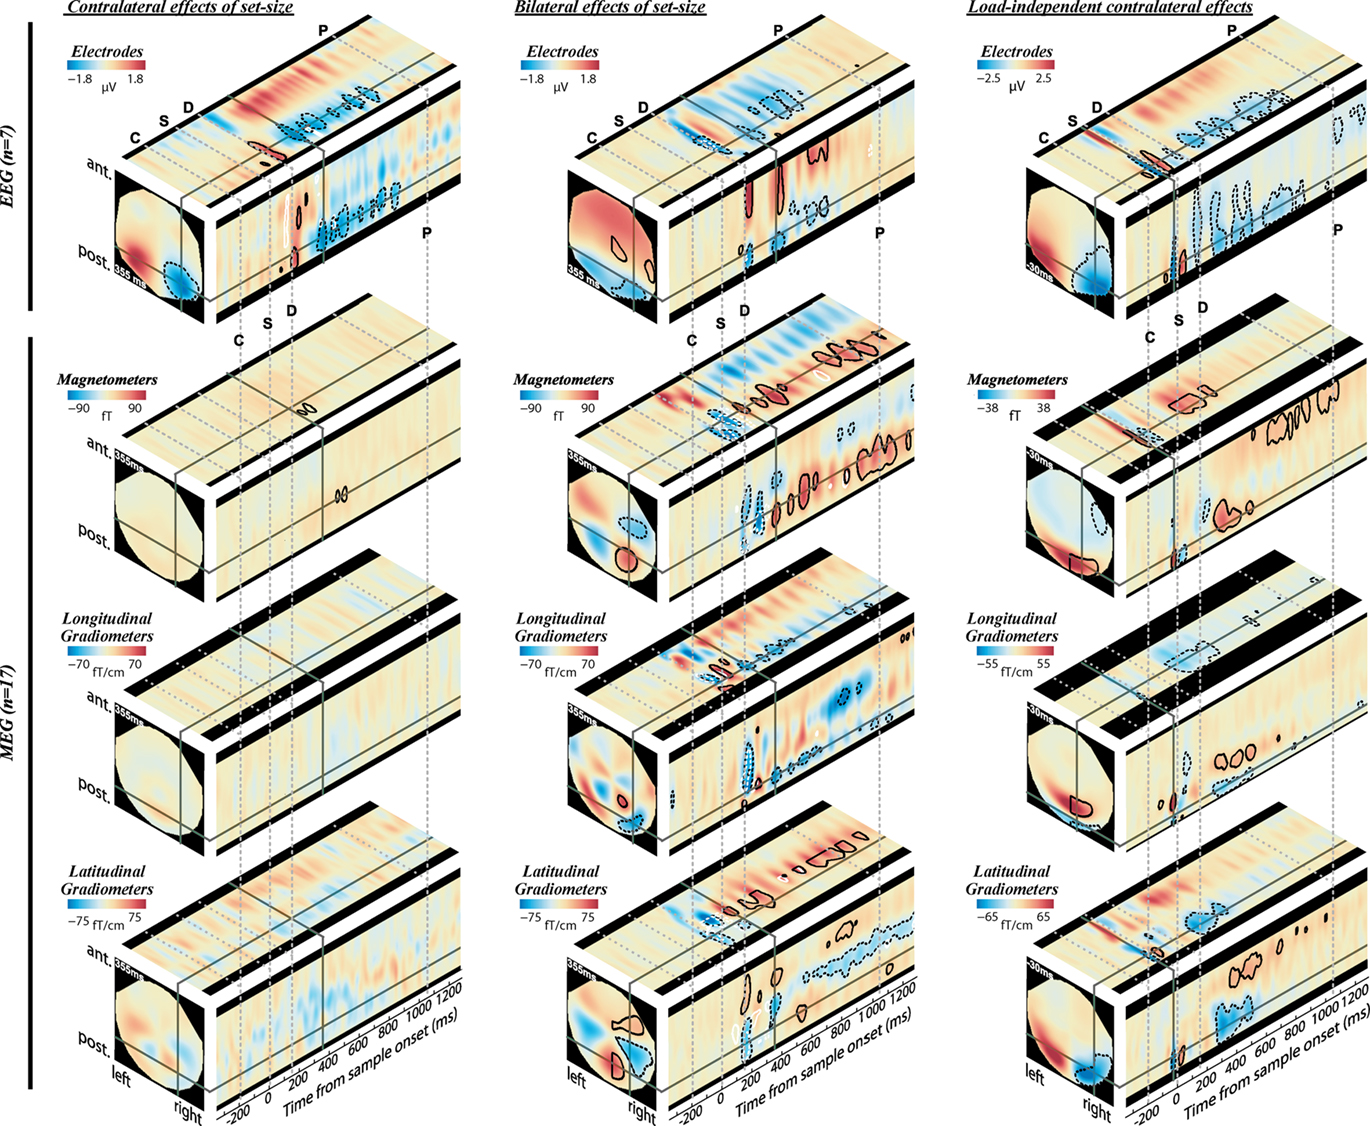
Figure 3. Evoked signal as function of memory load (K) and cue direction, as measured by EEG (top) and MEG (bottom). Effect sizes are shown at three orthogonal slices through each sensor-time volume, at coordinates indicated by the solid gray lines (355 ms for load effects, and −30 ms for cue effect). Warm hues on the right hemisphere correspond to signals that increase with K contralateral to the cued hemifield (left column), increase bilaterally with K (middle column), or increase contralaterally regardless of load (right column). Contours identify regions where contrasts are significantly greater (solid lines) or less (dotted lines) than baseline levels (posterior probability > 0.99). For the left and middle columns, black contours represent the K-weighted contrasts and white contours represent additional contributions to a linear load response. Note that the volumes are symmetric (or anti-symmetric) in the left–right direction and significance contours are confined to the right hemisphere. The onset of the cue, sample, delay, and earliest possible probe are marked by the gray dotted lines, labeled C, S, D, and P, respectively.
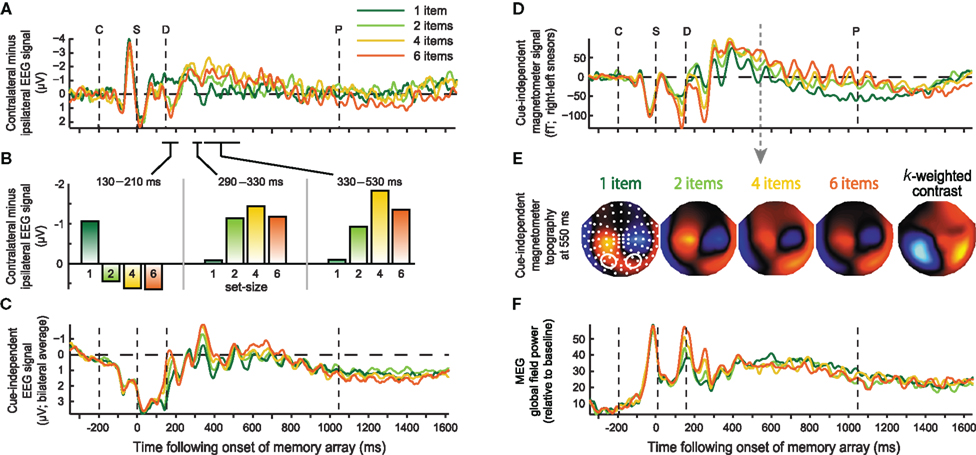
Figure 4. Event-related responses plotted separately for each set-size. Left column: EEG signal averaged over electrodes PO3, PO4, O1, O2, for the eCDA time-course (A), eCDA averaged across successive time windows (B), and eBDA time-course (C). Right column: Magnetometer signal reflecting mBDA time-course (D) at selected sensors marked below (right sensors–left sensors); (E) magnetometer topographies in the middle of the delay period (550 ms) for each set-size, averaged across cue directions; white dots indicate sensor locations and contours mark those sensors for which the time-course is plotted above; (F) Global field power across all MEG sensors. The onset of the cue, sample, delay, and earliest possible probe are marked by the dashed lines, labeled C, S, D, and P respectively.
Some minor differences between the current results and those of Vogel and colleagues should be noted, primarily amongst the early responses. Their eCDA climbed from around 200 ms, and peaked at around 350 ms. The current waveforms also rise to their peak from 200 to 350 ms, but there are two additional positivities at around 20 and 180 ms. These are likely to stem from two differences in presentation timings. Firstly, the sample array was presented for 150 ms rather than 100 ms (potentially leading to a different pattern of summation and cancellation of onset and offset responses). Secondly, the sample display directly followed the cue, rather than being separated by a variable delay (McCollough et al., 2007). The first positivity therefore reflects a response to the cue. However, the second positivity is modulated by object load, and is therefore evoked at least partially by the sample array.
Another difference between the current experiment and the original report of the eCDA is that here a set-size of one was also used. Interestingly, the response to a single item appeared quite different from that for multiple items, and it was this that drove the capacity-limited positivity at 180 ms. There are hints of a similar effect in a recent report that also used a set-size of one (Robitaille et al., 2010). In the middle of the delay period, the single item response was less negative than the other set-sizes, as expected, however it diverged from these around 50 ms before the responses to the other set-sizes began to diverge from each other. Therefore, the current parametric load manipulation suggests three distinct contralateral, capacity-limited phases following sample onset (Figure 4B): an early “multiple object potential” (130–210 ms), where the contralateral activity becomes more positive with load and asymptotes at set-size two, a mid-latency effect (around 290–330 ms), where the contralateral activity becomes more negative with load, again asymptoting around set-size two, followed by the typical eCDA (from 330 ms onward), which also becomes more negative with load, but asymptotes at set-size four. The difference between the first two time windows was confirmed by a significant set-size by time interaction [F(3,18) = 9.49, p = 0.01]; the difference in asymptote between the latter two time windows was suggested by a marginally significant interaction between time and set-sizes two and four [F(1,6) = 5.51, p = 0.057]. It should be emphasized that this distinction between three different load-sensitive phases is a post hoc observation and must await replication. The contralateral negativity separating the first and second load-sensitive effects (210–290 ms), is likely to correspond to the N2pc, an index of spatial attention. Previous studies that measured both the N2pc and the CDA (e.g., McCollough et al., 2007; Drew and Vogel, 2008; Jolicoeur et al., 2008; Perron et al., 2009) found similarities and dissociations between the two, generally consistent with the idea that they are involved in attentional selection and VSTM maintenance respectively. In the context of VSTM, the N2pc is typically insensitive to load (McCollough et al., 2007; Jolicoeur et al., 2008; Perron et al., 2009), although load sensitivity was observed during multiple object tracking (Drew and Vogel, 2008). The final, sustained, load-sensitive phase (eCDA) was significant throughout most of the delay period, up to around 900 ms following sample onset. The null result at later times may reflect a lack of power. It is worth noting, however, that others have found the eCDA to diminish toward the end of the delay (McCollough et al., 2007).
Effects of Memory Load on Evoked Magnetic Fields are Primarily Bilateral and Capacity-Limited
Turning to the MEG data, contralateral contrasts of load revealed far fewer significant effects than in EEG, despite a larger sample size (Figure 3, lower left). An mCDA that varied with memory load barely reached significance, with clusters being extremely small, brief, and of low amplitude. The almost complete lack of contralateral load effects is especially striking compared to substantial bilateral effects of load, observed when collapsing over cue direction (Figure 3, lower middle), and the contralateral load-independent effect observed when collapsing over set-sizes (Figure 3, lower right). Consistent results are observed for the magnetometers and both gradiometer orientations. Bilateral load effects first peaked at around 170 ms following onset of the memory array. The bilateral MEG signal extended throughout the whole memory delay, and will be termed bilateral delay activity (BDA). Strong bilateral signal was also apparent in the EEG data, but was less sustained than in the MEG data, dissipating within 800 ms. This is consistent with an early study which found a bilateral posterior negativity between 300 and 800 ms as VSTM load increased (Klaver et al., 1999). These bilateral load effects may not be found when ERPs are averaged over longer time windows (Robitaille et al., 2010).
The bilateral load effects in both EEG and MEG, and the contralateral load effect in EEG, are explained by a significant K-weighted component throughout most of the delay period. This suggests that they are driven by a capacity-limited memory or attention process, rather than low-level sensory stimulation or confounds of task difficulty. There is also, however, a significant contribution from the additional linear component at early time-points, predominantly within 100–300 ms following onset of the memory array, but also occasionally during the delay period and after appearance of the probe.
In Figure 4, time-courses of the BDA are illustrated for each set-size, at selected posterior electrodes (Figure 4C), magnetometers (Figure 4D) and for the global field power (GFP) across all MEG sensors (Figure 4F). The GFP contains two early peaks that increase linearly with set-size, but is not modulated by load during the subsequent memory delay. This implies that the sustained MEG effect of load, in Figures 3, 4D, and 5B, derives from changes in the distribution rather than the total strength of the measured signals. This can be seen in the topographies in Figure 4E, where the increase in amplitude at posterior sensors is accompanied by a compensatory decrease in amplitude of the central foci. Of the two early MEG components whose power increases linearly with load, the first, at around 150 ms, is also apparent in the EEG data, probably corresponding to the N1/M1; the second peak, at around 250 ms, is modulated by load in the MEG data, but not the EEG data, and is likely to correspond to the M2, to which MEG has been reported to be more sensitive (Croize et al., 2004).
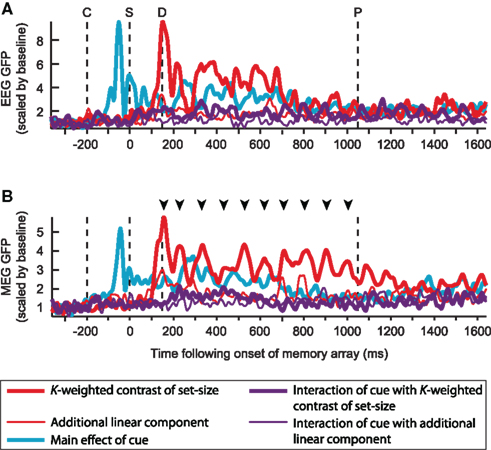
Figure 5. Global field power (GFP) of the grand mean of each contrast of interest, for EEG (A) and MEG (B). Each contrast is scaled by the mean of its baseline activity. Time-points C, S, D, and P respectively mark the onsets of the cue, sample, and the earliest onset of the probe array; arrowheads mark the peaks of the K-weighted response for which source estimates are shown in Figure 7.
Figure 5 illustrates the time-course of the contrasts of interest in terms of the GFP of the grand average across subjects. While this view is agnostic as to the spatial configuration of the signal, it summarizes many temporal features of the data, such as the expected 200 ms delay of the load response relative to the cue response, and the strong, cue-independent load effect (red line), which is partially sustained in the EEG signal, but in the MEG signal persists in an oscillatory manner throughout the entire delay period. The size of the capacity-limited effects can also be seen to be much larger than the additional linear component of the load modulation. As expected from the lack of a load-sensitive mCDA in Figure 3 (lower left), the interaction of cue with load (purple line) is much smaller than the main effect of load. However, a non-zero effect is apparent, especially during the first half of the delay period. This suggests that a small cue-dependent load effect can be detected with MEG, but may vary across individuals in location and/or orientation of its generators.
Bilateral Decreases in Delay-Period Alpha Power Correlate with Individual Differences in Memory Capacity
The evoked mBDA exhibited clear oscillations, peaking approximately every 100 ms and thus falling within the alpha frequency range (9–13 Hz). Time–frequency analysis (Figure 6) showed that the power of induced bilateral oscillations decreased with load in the alpha band (Figure 6A, upper middle). Therefore the evoked alpha oscillations are likely to be driven by increased phase-locking at higher set-sizes, although slow evoked fields may be related to induced power via asymmetric amplitude fluctuations (Mazaheri and Jensen, 2008). The decrease in alpha power with memory load is consistent with previous studies that have required memory of location information (Medendorp et al., 2007). Others have reported an increase in alpha power with memory load, although this typically begins later (from about 700 ms; Jensen et al., 2002; Grimault et al., 2009). Consistent with previous results (Medendorp et al., 2007; Grimault et al., 2009; Sauseng et al., 2009) an additional decrease in alpha power was observed contralaterally, regardless of load (Figure 6A, upper right), however contralateral alpha power increased transiently with increasing load (Figure 6A, upper left). (Note that each point represents convolution with a Morlet wavelet spanning six cycles at each frequency, so underlying oscillations may span broader durations than the significant peaks.) Importantly, the current results show that, as for the evoked signal, induced power changed as an asymptotic rather than linear function of set-size during the delay period. Analysis of phase-locking revealed a strongly significant, bilateral increase with load (Figure 6A, lower middle). This was a broadband signal, although focused in the theta and alpha ranges; it began rapidly following array onset, but dissipated earlier than the bilateral, load-dependent power decreases. Contralateral phase-locking was observed transiently following the cue (Figure 6A, lower right), but showed no additional modulation with load (Figure 6A, lower left). The bilateral decrease in alpha power with load was associated with better task performance, as indicated by its significant correlation with individual differences in memory capacity (r = −0.66, p < 0.005; Figure 6B). No significant correlations were observed between individual performance and changes in contralateral power or phase-locking (all p > 0.1). In addition, bilateral alpha suppression around the time of cue and sample presentation was stronger on trials with correct performance, possibly responsible for distinguishing between the relevant and irrelevant sides of the display (see Appendix).
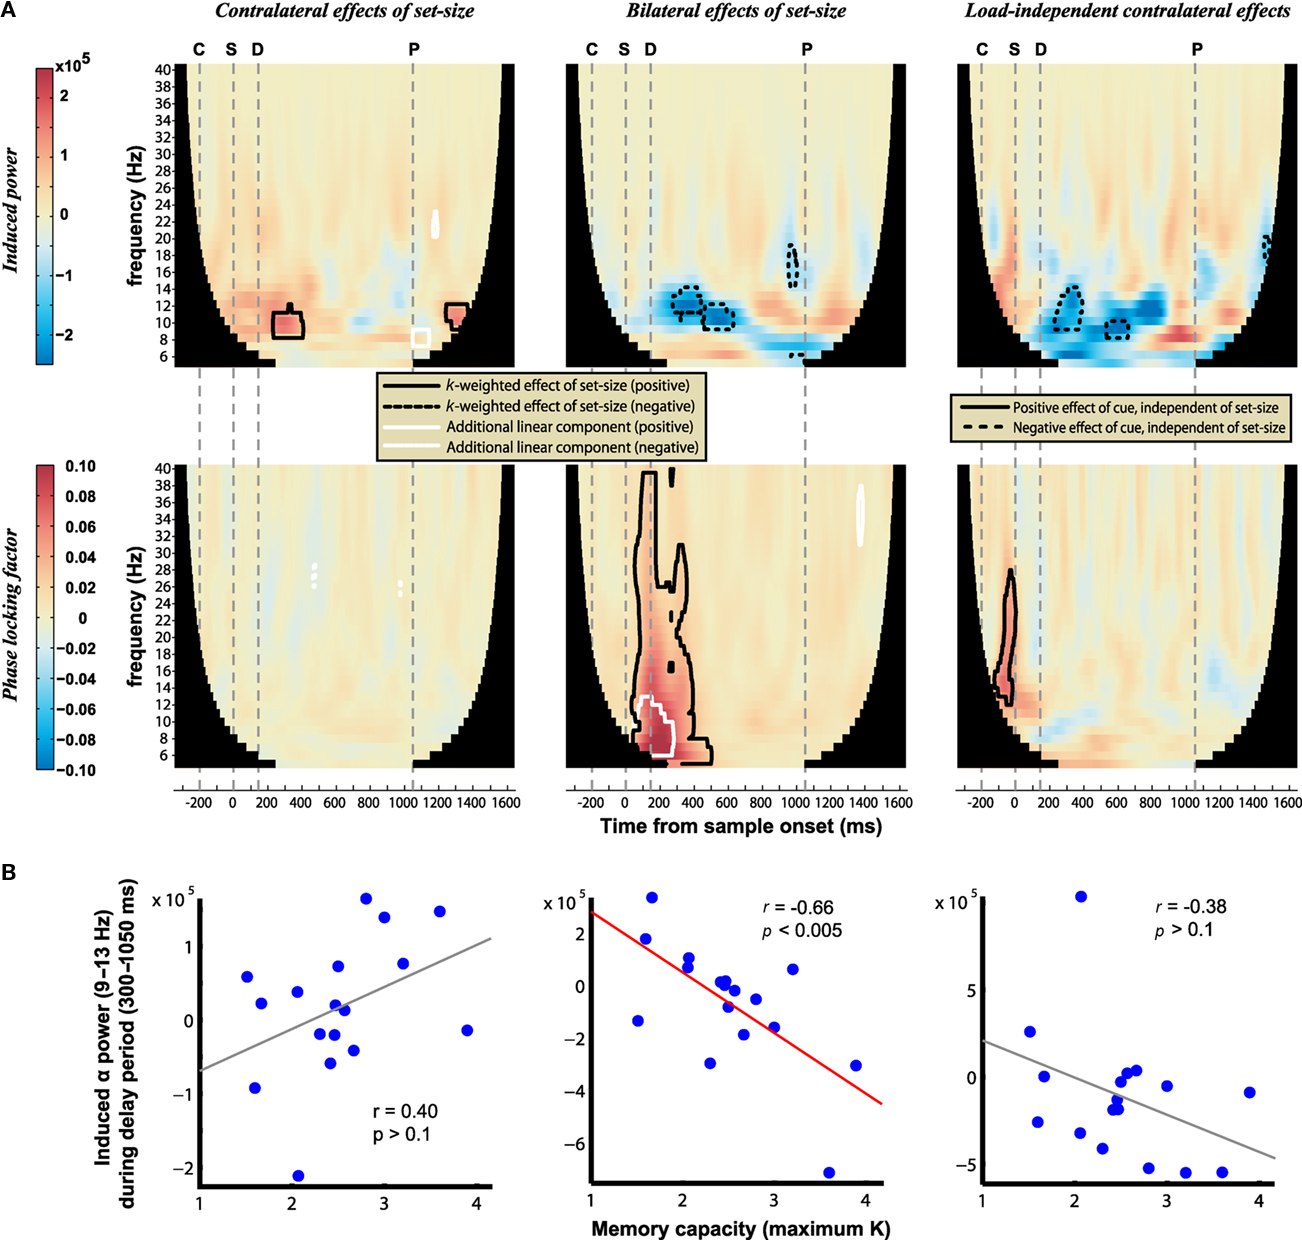
Figure 6. (A) Power (top) and phase-locking (bottom) of induced oscillations. Warm hues correspond to signals that increase with K contralateral to the cued hemifield (left column), increase bilaterally with K (middle column), or increase contralaterally regardless of load (right column). Contours identify regions where contrasts are significantly different from baseline levels (posterior probability > 0.99). The onset of the cue, sample, delay, and earliest possible probe are marked by the gray dashed lines labeled C, S, D, and P, respectively. (B) Correlation of delay-period alpha power with individual differences in memory capacity; a significant negative correlation is observed between K and the bilateral load response.
It should be noted that this analysis averaged across all sensors in each hemisphere, and it is possible that more localized effects in other frequency bands may have been missed. For example there is much evidence showing gamma band involvement in short-term memory (reviewed by Jensen et al., 2007). While bilateral effects of load on alpha power are most prominent here (and in the MEG study of Grimault et al., 2009), the importance of contralateral alpha suppression with increasing load has been shown with EEG (Sauseng et al., 2009). Sauseng and colleagues also elegantly demonstrated that this primarily reflects suppression of irrelevant information (the distracter items on the uncued side), independent of memory load which instead enhances contralateral theta–gamma phase synchronization. The present bilateral load effect may also be related to distracter suppression, although the experimental design confounds the number of distracters with the number of memoranda. Overall, the comparison of these time–frequency results compliments the conclusion from the evoked data, namely that whereas EEG is sensitive to contralateral effects of memory load, bilateral load effects are more apparent in MEG.
Source Localization
Source activity was summarized by integrating evoked activity across 40 ms Hann windows, which spanned the peaks in the GFP of the K-weighted response, as well as the early contralateral response to the cue. Significant results of the source analysis (posterior probability > 0.99 of response being greater than baseline) are illustrated in Figure 7, and the MNI coordinates of the significant peaks are provided in Tables 1 and 2.
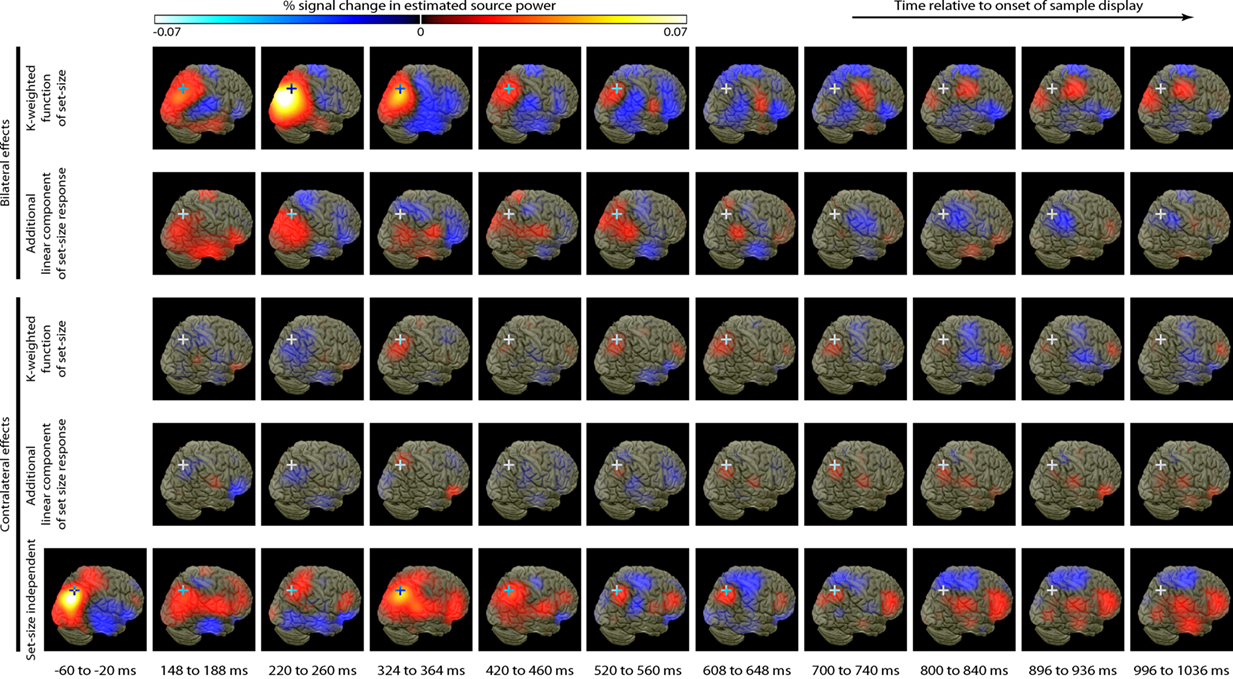
Figure 7. Source localization of bilateral and contralateral contrasts, across successive time windows relative to the onset of the sample array. Statistics are confined to the right hemisphere due to the symmetrical redundancy in the data. The color scale represents the conditional effect size as percent signal change in power (see Materials and Methods), where this is significantly greater in amplitude than during the baseline period (posterior probability > 0.99). Crosshairs are positioned at the focus of the fMRI marker of VSTM load reported by Todd and Marois (2004; Talairach coordinates: x = 23, y = −59, z = 45).
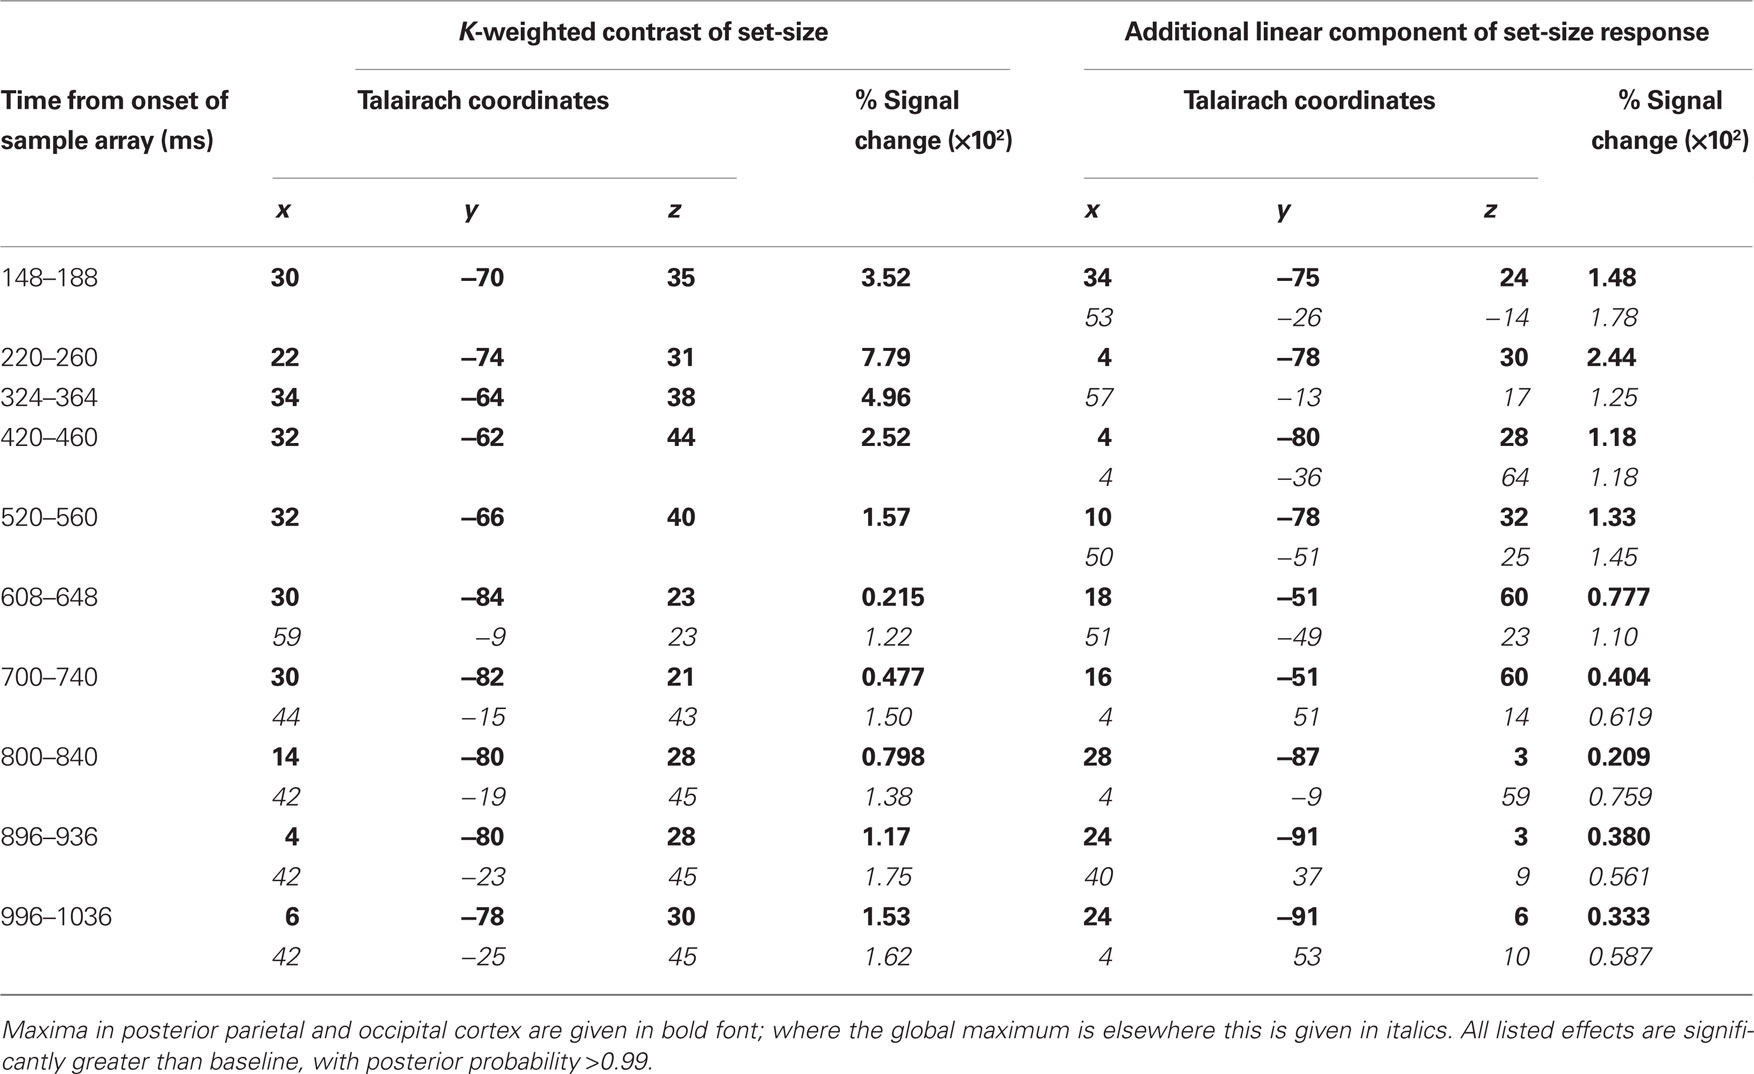
Table 1. Peak coordinates of source-localized bilateral load effects.
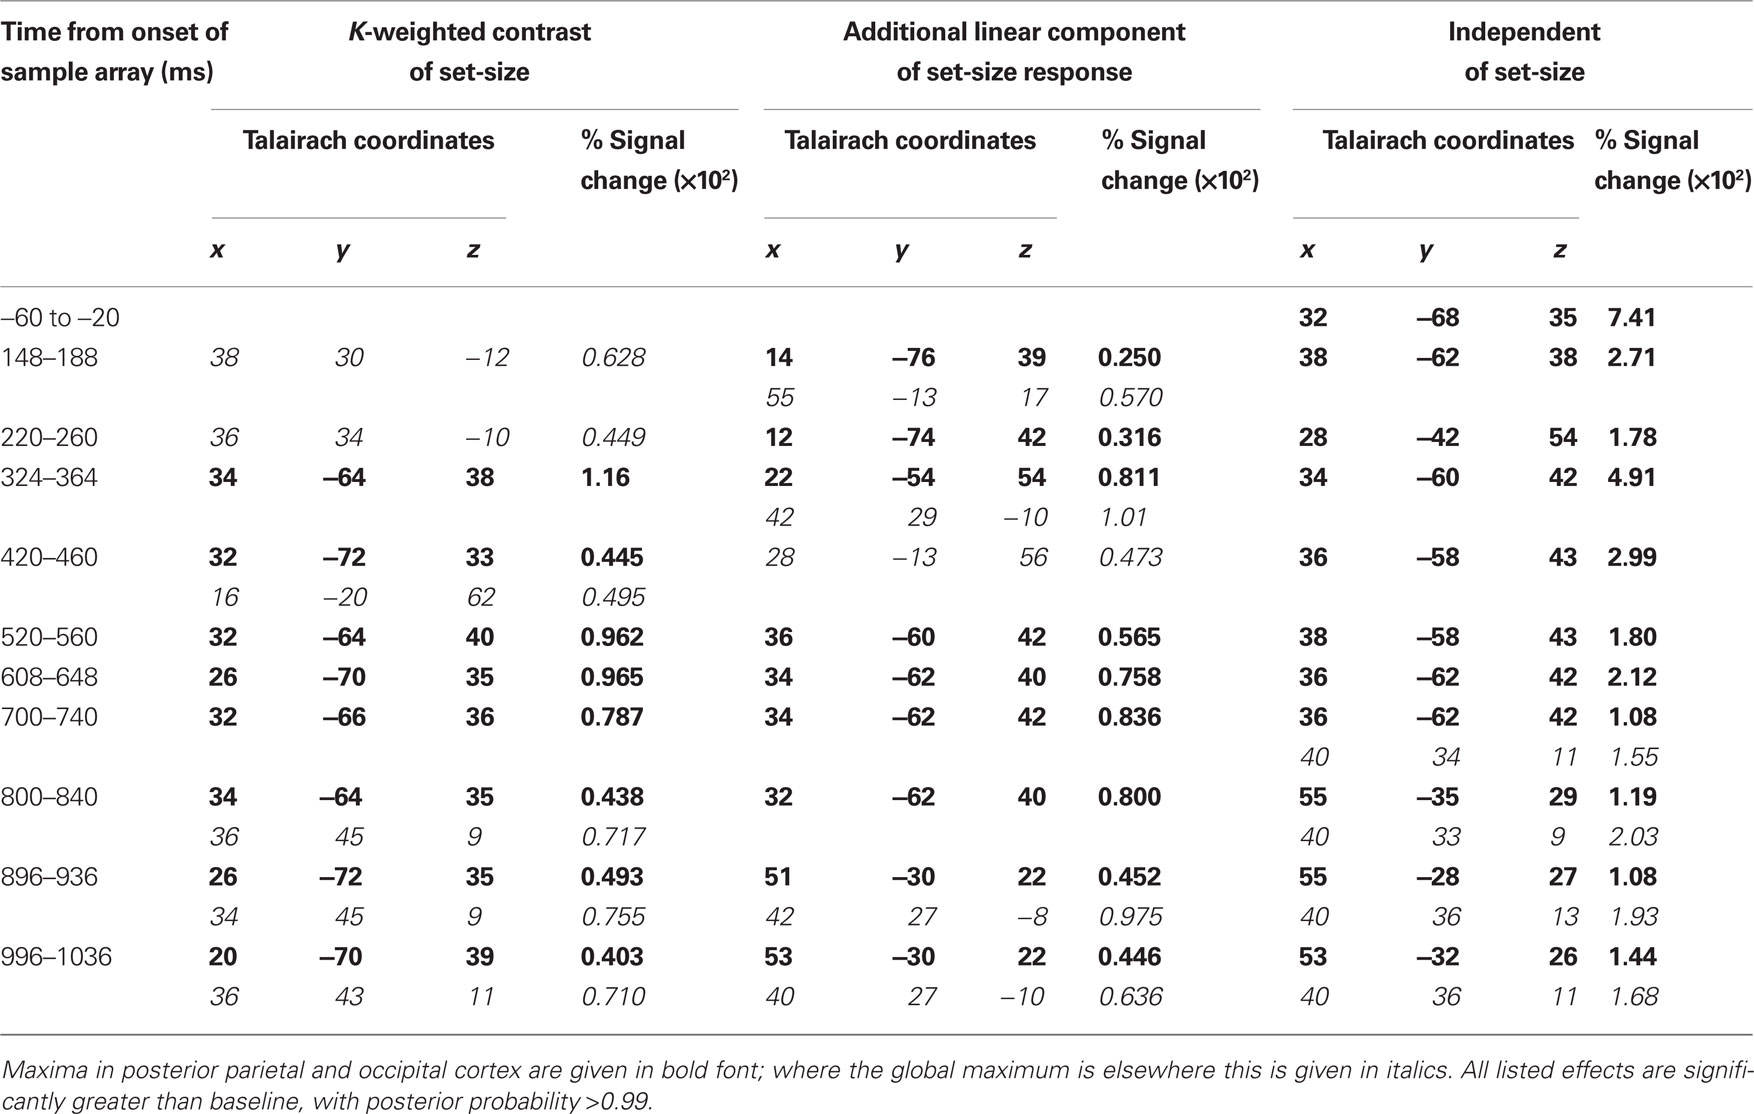
Table 2. Peak coordinates of source-localized contralateral effects.
As expected from the sensor data, the strongest effects following source localization are a bilateral, K-weighted load response (peaking around 240 ms after the sample onset; Figure 7, top row), and a load-independent contralateral effect (peaking at 140–180 ms following cue onset and again at about 350 ms following the sample onset; Figure 7, bottom row). Both signals initially cover a broad region of the dorsal visual stream, but then contract toward a focus at the posterior end of the IPS. This location corresponds well to that which shows a capacity-limited bilateral response during fMRI (Linden et al., 2003; Todd and Marois, 2004; Xu and Chun, 2006; Mitchell and Cusack, 2008; Robitaille et al., 2010). It is also consistent with fMRI studies demonstrating parietal topographic maps of attended space, with a strong contralateral bias (Sereno et al., 2001; Silver et al., 2005; Schluppeck et al., 2006; Jack et al., 2007; Konen and Kastner, 2008). Both IPS responses are partially sustained (at least 540 ms for the bilateral capacity-limited response, and 720 ms for the contralateral load-independent response), but both decay prior to the end of the memory delay, being replaced by sources on the parieto-occipital border and in the frontal lobe. This suggests that they may not reflect pure VSTM maintenance, but rather attentional deployment and a capacity-limited process perhaps involved in the construction of object files (Cusack et al., 2009), or their consolidation into VSTM. Note that more sustained bilateral IPS responses during VSTM are observed with fMRI (Todd and Marois, 2004; Xu and Chun, 2006). This may reflect the techniques’ coupling to different aspects of neural activity, as well as task and stimulus differences. However, parietal BOLD signals show similar capacity limits in tasks without an explicit memory requirement (Mitchell and Cusack, 2008), so it is unclear to what extent they are specific to VSTM or reflect individuation of attended objects more generally. The bilateral, K-weighted reduction in activity around the temporoparietal junction is consistent with existing fMRI data (Todd et al., 2005) that may reflect the suppression of exogenous orienting to distracters. The late emergent source on the parieto-occipital border may correspond to a load-sensitive increase in alpha power that has been observed from 1 second into 2–3 s memory periods and proposed to reflect inhibition of the dorsal visual stream (Jokisch and Jensen, 2007; Tuladhar et al., 2007). Bilateral signal emerging over motor/somatosensory cortex toward the end of the memory delay, along with the contralateral signal in dorsolateral prefrontal cortex, may be related to response anticipation (Nobre et al., 2007; Coull and Nobre, 2008).
In line with the sensor-level data, the contralateral modulation of source activity by load (Figure 7, third row) was weaker than the equivalent bilateral effects. However, significant small effects could be detected, which also localized to the posterior IPS, consistent with a recent report (Robitaille et al., 2010), and in a similar location to the bilateral load response. That these effects were statistically reliable at the source level, but not at the sensor level, is likely due to the power gained by combining the three MEG sensor types, and because the forward model explicitly accounts for individual variability in cortical anatomy and orientation of the sources. This contralateral, capacity-limited activity began from around 340 ms and persisted, with little variation in position, throughout the full memory delay. It was accompanied by an additional contralateral linear component that was of comparable magnitude, but somewhat less stable in position.
Discussion
This study has characterized the neuromagnetic markers of the limited contents of VSTM, as the maintenance period unfolds. We present the first detailed account of estimated sources at successive time-points throughout the whole delay period, separating generators responsible for different patterns of load sensitivity, both bilaterally and contralaterally. Contributions of both bilateral and contralateral components are emphasized, which may be driven by different neural generators, although both localize to posterior IPS. Analyses distinguish activity that plateaus as VSTM capacity is reached, from additional linear effects of load. While the latter may reflect low-level sensory stimulation or processes associated with task difficulty, the former is likely to reflect capacity-limited cognitive functions, and accounts for the bulk of the load sensitivity.
Differences between Early and Late Delay Periods Inform Comparisons with fMRI
The general agreement with other recent independently acquired MEG data is encouraging (Robitaille et al., 2010). Where there are differences, consideration of the temporal evolution of the signal suggests potential resolution to what might otherwise appear to be inconsistencies between studies and measurement modalities. For example, whereas MEG detects a contralateral load response in the IPS, the BOLD signal found in this region remains bilateral (Robitaille et al., 2010). The current results suggest that this would be expected in fMRI designs that combine activity across a whole trial, because the bilateral load response in the early delay dominates the weaker contralateral load response that is associated more specifically with the maintenance period. Thus, although a contralateral capacity-limited response has yet to be found in parietal cortex with fMRI, we predict that fMRI might detect a contralateral load response in the IPS when the maintenance period is explicitly decoupled from the encoding phase.
Similarly, the bilateral load effect that is so apparent in MEG is not always detected in EEG (Robitaille et al., 2010). This appears to be because although the eBDA extends substantially into the delay period, it decays beyond around 800 ms (Klaver et al., 1999). While an mBDA is expressed throughout the delay period, it is supported by two different sets of cortical generators at early and late stages: a superior intraparietal focus during the first half of the delay period, shifting toward the parieto-occipital (and frontoparietal) border toward the end of the delay (with both being active immediately after encoding). These sources may correspond respectively to the superior and inferior intraparietal regions distinguished by Xu and Chun (2006). These authors propose that the superior IPS is involved in the detailed representation of visual objects, while the inferior IPS indexes a limited number of objects by their spatial location. An increase in spatial indexing toward the end of the delay would be consistent with prospective attention toward the location of the upcoming probe items (Lepsien and Nobre, 2006). It would be useful for future work to investigate whether such indexing might serve to enhance processing of the probe items, to facilitate their comparison with the memory representations, or to inhibit processing of the probe items (Jokisch and Jensen, 2007; Tuladhar et al., 2007) if these are liable to interfere with the representations being held in memory (Makovski et al., 2008).
EEG and MEG are Differentially Sensitive to Bilateral and Contralateral Capacity Limits
Electroencephalography and MEG measure different aspects of the electromagnetic field, providing complementary information about the underlying physiological generators. EEG is more sensitive to sources that are deep, radial to the inner skull surface, or span large cortical regions (Goldenholz et al., 2009). Conversely, other components are clearer in MEG. One example is a signal evoked bilaterally in parietal cortex 220–280 ms after target onset (Croize et al., 2004), which is found here to be sensitive to load in MEG but largely invisible in EEG. Although contralateral load sensitivity has hitherto been emphasized in EEG (Gratton, 1998; Vogel and Machizawa, 2004; McCollough et al., 2007; Drew and Vogel, 2008), it is seen here to coexist with equally strong bilateral load sensitivity. In contrast, in the evoked magnetic fields, the contralateral load effects are less reliable and strikingly smaller than the robust, bilateral signal. Consistent with this, the bilateral response appears stronger and statistically more convincing than the contralateral response in other recent MEG studies (Robitaille et al., 2009, 2010). The time–frequency results support the same story: while contralateral alpha suppression is an important marker of VSTM processing in EEG (Sauseng et al., 2009), effects of memory load on MEG alpha power are predominantly bilateral (see also Grimault et al., 2009).
The differential sensitivity of MEG and EEG to the generators of these bilateral and contralateral signals suggests that they may be evoked by different neural populations, despite the estimated sources of the evoked fields localizing to similar regions of the posterior IPS. Specifically, the bilateral effects may include a greater contribution from tangential sources, whereas the contralateral effects of set-size may be dominated by radial sources (and/or broader cortical patches where signals from opposing gyral and sulcal banks cancel to leave radial sources at the gyral crest). An alternative possibility is that MEG is simply less sensitive than EEG, so fails to pick up small contralateral differences that ride upon larger bilateral effects. However, it seems unlikely that the null result for a load-sensitive mCDA can be explained by a general insensitivity of MEG (vs. EEG), because the magnitude of the contralateral and bilateral load effects are comparable in EEG, while MEG and EEG are equally sensitive to the bilateral effect of load (compare the four plots in the upper left of Figure 3).
Previous MEG studies of induced oscillations during change detection (Grimault et al., 2009) and delayed saccade tasks (Medendorp et al., 2007), have reported main effects of laterality and short-term memory load, but no interaction between these factors. Although the current experiment found a contralateral effect of load on induced alpha power, this was smaller and more transient than the bilateral load effect and the contralateral effect of cue. Only the sustained bilateral load response correlated with individual differences in memory capacity. Overall, the current data suggest that the presence or absence of load-by-hemifield interactions depends as much on the measurement modality as on cognitive considerations, with source localization helping to reveal contralateral load responses to which MEG is relatively insensitive. The observation that small, contralateral load effects are reliable at the source level but largely invisible in the evoked magnetic fields (despite realignment of subjects to a common sensor space), suggests the importance of source localization in modeling individual variability in orientation of the generators.
In paradigms where visual stimulation is equated across cued and uncued hemifields, analysis of contralateral signal has the advantage of subtracting out bilateral responses to sensory stimulation, thus isolating top–down cognitive processes of memory and attention. However, this benefit is offset by sensitivity to horizontal eye movements, for which a residual tendency may remain despite requiring fixation and discarding trials with large HEOG signal. The presence of small but systematic eye movements has been noted previously for similarly peripheral tasks (Drew and Vogel, 2008). Small residual eye movements explain some but not all of the lateralized EEG signal, but contribute minimally to the lateralized MEG signal (see Appendix). The bilateral response, as well as being more prominent in MEG, has the advantage of nullifying such potential lateralized confounds. Although instead sensitive to the overall amount of bilateral visual stimulation, such low-level responses are distinguished here from the capacity-limited activity of interest which is expected to show an asymptotic rather than linear relationship with set-size. Therefore, contralateral and capacity-limited effects are complementary in allowing inferences to be made about top–down cognitive processes.
Possible Functions of Coexisting Bilateral and Contralateral Capacity Limits
A load-sensitive eCDA replicated previous EEG results (Vogel and Machizawa, 2004). There was a suggestion that the asymptote with load increased initially, with a single item behaving differently to multiple items. One might speculate that the early asymptote at set-size two reflects individuation or attentional selection processes, engaged whenever multiple objects are detected, while the later asymptote around set-size four reflects maintenance of a few individuated object tokens or attentional foci. Along with the eCDA, the eBDA and mBDA also plateaued at set-sizes corresponding to the capacity limit of VSTM. Together with their continuation into the memory delay, this is consistent with involvement in establishing and/or maintaining VSTM representations. While previous results show that the amplitude of the eCDA correlates with individual memory capacity (Vogel and Machizawa, 2004), we find that bilateral suppression of alpha power is also predictive of memory performance. Therefore both bilateral and contralateral capacity-limited networks are likely to contribute to successful VSTM performance. Might the bilateral and contralateral components reflect different cognitive functions subserving task performance? Behavioral evidence (Delvenne, 2005; Fleming et al., 2009; Umemoto et al., 2010) shows that if memoranda are divided across both hemifields, VSTM performance is better than if they are presented unilaterally, implying separate memory resources for each hemifield. However, performance with bilateral memoranda is not double that with unilateral memoranda, so VSTM capacity cannot be solely determined by independent systems for each hemifield and must also depend on some shared resource. These findings map nicely onto the possibility that VSTM is supported by two complementary neural systems: the BDA, reflecting a global resource, and the CDA reflecting an additional, hemisphere-specific resource.
Some have speculated that hemifield-specific and bilateral resources might operate in different task stages (with contralateral stimulus selection preceding bilateral memory storage) or might process identity and location information respectively (Alvarez and Cavanagh, 2005; Delvenne, 2005). The current data do not support the first hypothesis, since bilateral and contralateral responses occur together for much of the delay period, while at the source level the bilateral response precedes the contralateral response. This experiment cannot address the second hypothesis, but is consistent with it since correct performance required both color and location information (beyond set-size one). The eCDA does not depend on the spatial extent of attention (McCollough et al., 2007), however there is some disagreement over whether it is primarily sensitive to the number of remembered locations, or the number of remembered objects themselves (Wang et al., 2009; Ikkai et al., 2010), a question that is also being actively studied in the context of fMRI (Harrison et al., 2010). It will be interesting to determine whether contralateral and bilateral components are differentially modulated by spatial and object load.
A third perspective is that bilateral and contralateral systems may confer different levels of robustness to interference. If the contralateral system uses a partially retinotopic resource with relatively non-overlapping receptive fields it may be more robust to interference between items in memory, but susceptible to overwriting by incoming stimulation; conversely, the bilateral system may store information in a more abstracted format, utilizing neurons with larger, overlapping receptive fields, to provide insulation from sensory masking at the cost of greater competition between memoranda. This hypothesis remains to be tested.
Although the load responses are well explained by the K-weighted function of set-size, derived from VSTM performance, in fMRI similar capacity-limited responses can be observed in situations requiring attention and object individuation, but not working memory (Mitchell and Cusack, 2008). The bilateral and contralateral responses may differ in the extent to which they reflect maintenance in working memory or attended object representations more generally. At the source level, the contralateral response persists for longer at the same parietal focus, so is a stronger candidate for continued maintenance of representations in VSTM. Since the bilateral K-weighted response has its strongest peak at the beginning of the memory delay this could reflect initial attentional individuation of a few object files and/or their consolidation into VSTM.
Conflict of Interest Statement
The authors declare that the research was conducted in the absence of any commercial or financial relationships that could be construed as a potential conflict of interest.
Acknowledgments
This work was supported by the Medical Research Council under project code U.1055.01.010.00001.01. We thank Paola Finoia for assistance with data collection, Rik Henson and Jason Taylor for discussions on data analysis and contributions to its implementation, and Lorina Naci for reading an earlier draft of the manuscript.
Footnotes
- ^This response has also been called the “sustained posterior contralateral negativity” (SPCN; Robitaille and Jolicoeur, 2006).
- ^http://neuroimage.usc.edu/brainstorm
References
Alvarez, G. A., and Cavanagh, P. (2004). The capacity of visual short-term memory is set both by visual information load and by number of objects. Psychol. Sci. 15, 106–111.
Alvarez, G. A., and Cavanagh, P. (2005). Independent resources for attentional tracking in the left and right visual hemifields. Psychol. Sci. 16, 637–643.
Chuah, L. Y., and Chee, M. W. (2008). Cholinergic augmentation modulates visual task performance in sleep- deprived young adults. J. Neurosci. 28, 11369–11377.
Coull, J., and Nobre, A. (2008). Dissociating explicit timing from temporal expectation with fMRI. Curr. Opin. Neurobiol. 18, 137–144.
Cowan, N. (2001). The magical number 4 in short-term memory: a reconsideration of mental storage capacity. Behav. Brain Sci. 24, 87–114; discussion 114–185.
Croizé, A. C., Ragot, R., Garnero, L., Ducorps, A., Pélégrini-Issac, M., Dauchot, K., Benali, H., and Burnod, Y. (2004). Dynamics of parietofrontal networks underlying visuospatial short-term memory encoding. Neuroimage 23, 787–799.
Cusack, R., Lehmann, M., Veldsman, M., and Mitchell, D. J. (2009). Encoding strategy and not visual working memory capacity correlates with intelligence. Psychon. Bull. Rev. 16, 641–647.
Cusack, R., Mitchell, D. J., and Duncan, J. (2009). Discrete object representation, attention switching, and task difficulty in the parietal lobe. J. Cogn. Neurosci. 22, 32–47.
Delorme, A., and Makeig, S. (2004). EEGLAB: an open source toolbox for analysis of single-trial EEG dynamics including independent component analysis. J. Neurosci. Methods 134, 9–21.
Delvenne, J. F. (2005). The capacity of visual short-term memory within and between hemifields. Cognition 96, B79–B88.
Drew, T., and Vogel, E. K. (2008). Neural measures of individual differences in selecting and tracking multiple moving objects. J. Neurosci. 28, 4183–4191.
Emrich, S. M., Al-Aidroos, N., Pratt, J., and Ferber, S. (2009). Visual search elicits the electrophysiological marker of visual working memory. PLoS ONE 4, e8042. doi: 10.1371/journal.pone.0008042
Fleming, G., Sheremata, S., and Somers, D. (2009). Cross-hemifield attention benefits for visual short-term memory. Paper Presented at the Vision Sciences Society, 9th Annual Meeting, Naples, Florida.
Friston, K., Harrison, L., Daunizeau, J., Kiebel, S., Phillips, C., Trujillo-Barreto, N., Henson, R., Flandin, G., and Mattout, J. (2008). Multiple sparse priors for the M/EEG inverse problem. Neuroimage 39, 1104–1120.
Friston, K., Henson, R., Phillips, C., and Mattout, J. (2006). Bayesian estimation of evoked and induced responses. Hum. Brain Mapp. 27, 722–735.
Friston, K. J., Glaser, D. E., Henson, R. N., Kiebel, S., Phillips, C., and Ashburner, J. (2002). Classical and Bayesian inference in neuroimaging: applications. Neuroimage 16, 484–512.
Goldenholz, D. M., Ahlfors, S. P., Hamalainen, M. S., Sharon, D., Ishitobi, M., Vaina, L. M., and Stufflebeam, S. M. (2009). Mapping the signal-to-noise-ratios of cortical sources in magnetoencephalography and electroencephalography. Hum. Brain Mapp. 30, 1077–1086.
Gratton, G. (1998). The contralateral organization of visual memory: a theoretical concept and a research tool. Psychophysiology 35, 638–647.
Grimault, S., Robitaille, N., Grova, C., Lina, J. M., Dubarry, A. S., and Jolicoeur, P. (2009). Oscillatory activity in parietal and dorsolateral prefrontal cortex during retention in visual short-term memory: additive effects of spatial attention and memory load. Hum. Brain Mapp. 30, 3378–3392.
Harrison, A., Jolicoeur, P., and Marois, R. (2010). “What” and “Where” in the intraparietal sulcus: an fMRI study of object identity and location in visual short-term memory. Cereb. Cortex 20, 2478–2485.
Henson, R. N., Mattout, J., Phillips, C., and Friston, K. J. (2009). Selecting forward models for MEG source- reconstruction using model-evidence. Neuroimage 46, 168–176.
Hillyard, S. A. and Galambos, R. (1970). Eye movement artifact in the CNV. Electroencephalogr. Clin. Neurophysiol. 28, 173–182.
Ikkai, A., McCollough, A. W., and Vogel, E. (2010). Contralateral delay activity provides a neural measure of the number of representations in visual working memory. J. Neurophysiol. 103, 1963–1968.
Jack, A. I., Patel, G. H., Astafiev, S. V., Snyder, A. Z., Akbudak, E., Shulman, G. L., and Corbetta, M. (2007). Changing human visual field organization from early visual to extra-occipital cortex. PLoS ONE 2, e452. doi: 10.1371/journal.pone.0000452
Jensen, O., Gelfand, J., Kounios, J., and Lisman, J. E. (2002). Oscillations in the alpha band (9–12 Hz) increase with memory load during retention in a short-term memory task. Cereb. Cortex 12, 877–882.
Jensen, O., Kaiser, J., and Lachaux, J. P. (2007). Human gamma-frequency oscillations associated with attention and memory. Trends Neurosci. 30, 317–324.
Jiang, Y., Olson, I. R., and Chun, M. M. (2000). Organization of visual short-term memory. J. Exp. Psychol. Learn Mem. Cogn. 26, 683–702.
Jokisch, D., and Jensen, O. (2007). Modulation of gamma and alpha activity during a working memory task engaging the dorsal or ventral stream. J. Neurosci. 27, 3244–3251.
Jolicoeur, P., Brisson, B., and Robitaille, N. (2008). Dissociation of the N2pc and sustained posterior contralateral negativity in a choice response task. Brain Res. 1215, 160–172.
Jung, T. P., Makeig, S., Westerfield, M., Townsend, J., Courchesne, E., and Sejnowski, T. J. (2000). Removal of eye activity artifacts from visual event-related potentials in normal and clinical subjects. Clin. Neurophysiol. 111, 1745–1758.
Klaver, P., Talsma, D., Wijers, A. A., Heinze, H. J., and Mulder, G. (1999). An event-related brain potential correlate of visual short-term memory. Neuroreport 10, 2001–2005.
Konen, C. S., and Kastner, S. (2008). Two hierarchically organized neural systems for object information in human visual cortex. Nat. Neurosci. 11, 224–231.
Lepsien, J., and Nobre, A. C. (2006). Cognitive control of attention in the human brain: insights from orienting attention to mental representations. Brain Res. 1105, 20–31.
Linden, D. E., Bittner, R. A., Muckli, L., Waltz, J. A., Kriegeskorte, N., Goebel, R., Singer, W., and Munk, M. H. (2003). Cortical capacity constraints for visual working memory: dissociation of fMRI load effects in a fronto-parietal network. Neuroimage 20, 1518–1530.
Litvak, V., and Friston, K. (2008). Electromagnetic source reconstruction for group studies. Neuroimage 42, 1490–1498.
Luck, S. J., and Vogel, E. K. (1997). The capacity of visual working memory for features and conjunctions. Nature 390, 279–281.
Makovski, T., Sussman, R., and Jiang, Y. V. (2008). Orienting attention in visual working memory reduces interference from memory probes. J. Exp. Psychol. Learn Mem. Cogn. 34, 369–380.
Mattout, J., Henson, R. N., and Friston, K. J. (2007). Canonical source reconstruction for MEG. Comput. Intell. Neurosci. 2007, Article ID 67613.
Mazaheri, A., and Jensen, O. (2008). Asymmetric amplitude modulations of brain oscillations generate slow evoked responses. J. Neurosci. 28, 7781–7787.
McCollough, A. W., Machizawa, M. G., and Vogel, E. K. (2007). Electrophysiological measures of maintaining representations in visual working memory. Cortex 43, 77–94.
McNab, F., and Klingberg, T. (2008). Prefrontal cortex and basal ganglia control access to working memory. Nat. Neurosci. 11, 103–107.
Medendorp, W. P., Kramer, G. F., Jensen, O., Oostenveld, R., Schoffelen, J. M., and Fries, P. (2007). Oscillatory activity in human parietal and occipital cortex shows hemispheric lateralization and memory effects in a delayed double-step saccade task. Cereb. Cortex 17, 2364–2374.
Mennes, M., Wouters, H., Vanrumste, B., Lagae, L., and Stiers, P. (2010). Validation of ICA as a tool to remove eye movement artifacts from EEG/ERP. Psychophysiology 47, 1142–1150.
Mitchell, D. J., and Cusack, R. (2008). Flexible, capacity-limited activity of posterior parietal cortex in perceptual as well as visual short-term memory tasks. Cereb. Cortex 18, 1788–1798.
Nobre, A., Correa, A., and Coull, J. (2007). The hazards of time. Curr. Opin. Neurobiol. 17, 465–470.
Perron, R., Lefebvre, C., Robitaille, N., Brisson, B., Gosselin, F., Arguin, M., and Jolicoeur, P. (2009). Attentional and anatomical considerations for the representation of simple stimuli in visual short-term memory: evidence from human electrophysiology. Psychol. Res. 73, 222–232.
Phillips, C., Mattout, J., Rugg, M. D., Maquet, P., and Friston, K. J. (2005). An empirical Bayesian solution to the source reconstruction problem in EEG. Neuroimage 24, 997–1011.
Robitaille, N., Grimault, S., and Jolicoeur, P. (2009). Bilateral parietal and contralateral responses during maintenance of unilaterally encoded objects in visual short-term memory: evidence from magnetoencephalography. Psychophysiology. 46, 1090–1099.
Robitaille, N., and Jolicoeur, P. (2006). Fundamental properties of the N2pc as an index of spatial attention: effects of masking. Can. J. Exp. Psychol. 60, 101–111.
Robitaille, N., Marois, R., Todd, J., Grimault, S., Cheyne, D., and Jolicoeur, P. (2010). Distinguishing between lateralized and nonlateralized brain activity associated with visual short-term memory: fMRI, MEG, and EEG evidence from the same observers. Neuroimage 53, 1334–1345.
Sauseng, P., Klimesch, W., Heise, K. F., Gruber, W. R., Holz, E., Karim, A. A., Glennon, M., Gerloff, C., Birbaumer, N., and Hummel, F. C. (2009). Brain oscillatory substrates of visual short-term memory capacity. Curr. Biol. 19, 1846–1852.
Schluppeck, D., Curtis, C. E., Glimcher, P. W., and Heeger, D. J. (2006). Sustained activity in topographic areas of human posterior parietal cortex during memory-guided saccades. J. Neurosci. 26, 5098–5108.
Scolari, M., Vogel, E. K., and Awh, E. (2008). Perceptual expertise enhances the resolution but not the number of representations in working memory. Psychon. Bull. Rev. 15, 215–222.
Sereno, M. I., Pitzalis, S., and Martinez, A. (2001). Mapping of contralateral space in retinotopic coordinates by a parietal cortical area in humans. Science 294, 1350–1354.
Silver, M. A., Ress, D., and Heeger, D. J. (2005). Topographic maps of visual spatial attention in human parietal cortex. J. Neurophysiol. 94, 1358–1371.
Simola, J., Taulu, S., Parkkonen, L., and Kajola, M. (2004). Active shielding method for an MEG device. Proc. Biomag. p. 661.
Song, J. H., and Jiang, Y. (2006). Visual working memory for simple and complex features: an fMRI study. Neuroimage 30, 963–972.
Taulu, S., and Simola, J. (2006). Spatiotemporal signal space separation method for rejecting nearby interference in MEG measurements. Phys. Med. Biol. 51, 1759–1768.
Taulu, S., Simola, J., and Kajola, M. (2005). Applications of the signal space separation method. IEEE Trans. Signal Process. 53, 3359–3372.
Todd, J. J., Fougnie, D., and Marois, R. (2005). Visual short-term memory load suppresses temporo-parietal junction activity and induces inattentional blindness. Psychol. Sci. 16, 965–972.
Todd, J. J., and Marois, R. (2004). Capacity limit of visual short-term memory in human posterior parietal cortex. Nature 428, 751–754.
Todd, J. J., and Marois, R. (2005). Posterior parietal cortex activity predicts individual differences in visual short-term memory capacity. Cogn. Affect. Behav. Neurosci. 5, 144–155.
Tuladhar, A. M., ter Huurne, N., Schoffelen, J. M., Maris, E., Oostenveld, R., and Jensen, O. (2007). Parieto-occipital sources account for the increase in alpha activity with working memory load. Hum. Brain Mapp. 28, 785–792.
Umemoto, A., Drew, T., Ester, E. F., and Awh, E. (2010). A bilateral advantage for storage in visual working memory. Cognition. 117, 69–79.
Vogel, E. K., and Machizawa, M. G. (2004). Neural activity predicts individual differences in visual working memory capacity. Nature 428, 748–751.
Vogel, E. K., McCollough, A. W., and Machizawa, M. G. (2005). Neural measures reveal individual differences in controlling access to working memory. Nature 438, 500–503.
Wang, L., Most, S. B., and Hoffman, J. E. (2009). Contralateral delay activity is sensitive to the spatial distribution of items in working memory: an ERP study. Paper Presented at the Vision Sciences Society, 9th Annual Meeting, Naples, Florida.
Woodman, G. F., and Vogel, E. K. (2008). Selective storage and maintenance of an object’s features in visual working memory. Psychon. Bull. Rev. 15, 223–229.
Xu, Y. (2007). The role of the superior intraparietal sulcus in supporting visual short-term memory for multifeature objects. J. Neurosci. 27, 11676–11686.
Xu, Y., and Chun, M. M. (2006). Dissociable neural mechanisms supporting visual short-term memory for objects. Nature 440, 91–95.
Keywords: magnetoencephalography, visual short-term memory, contralateral delay activity, electroencephalography, contralateral, bilateral, capacity, parietal
Citation: Mitchell DJ and Cusack R (2011) The temporal evolution of electromagnetic markers sensitive to the capacity limits of visual short-term memory. Front. Hum. Neurosci. 5:18. doi: 10.3389/fnhum.2011.00018
Received: 19 October 2010;
Accepted: 03 February 2011;
Published online: 15 February 2011.
Edited by:
Leon Y. Deouell, The Hebrew University of Jerusalem, IsraelReviewed by:
Leon Y. Deouell, The Hebrew University of Jerusalem, IsraelRoy Luria, University of Oregon, USA
Christoph Bledowski, Goethe University, Germany
Copyright: © 2011 Mitchell and Cusack. This is an open-access article subject to an exclusive license agreement between the authors and Frontiers Media SA, which permits unrestricted use, distribution, and reproduction in any medium, provided the original authors and source are credited.
*Correspondence: Daniel J. Mitchell, Medical Research Council Cognition and Brain Sciences Unit, 15 Chaucer Road, Cambridge CB2 7EF, UK. e-mail: daniel.mitchell@mrc-cbu.cam.ac.uk