Phonological processing in human auditory cortical fields
- 1 Human Cognitive Neurophysiology Laboratory, Department of Veterans Affairs Northern California Health Care System, Martinez, CA, USA
- 2 Department of Neurology, University of California Davis, Davis, CA, USA
- 3 Center for Neurosciences, University of California Davis, Davis, CA, USA
- 4 Center for Mind and Brain, University of California Davis, Davis, CA, USA
We used population-based cortical-surface analysis of functional magnetic imaging data to characterize the processing of consonant–vowel–consonant syllables (CVCs) and spectrally matched amplitude-modulated noise bursts (AMNBs) in human auditory cortex as subjects attended to auditory or visual stimuli in an intermodal selective attention paradigm. Average auditory cortical field (ACF) locations were defined using tonotopic mapping in a previous study. Activations in auditory cortex were defined by two stimulus-preference gradients: (1) Medial belt ACFs preferred AMNBs and lateral belt and parabelt fields preferred CVCs. This preference extended into core ACFs with medial regions of primary auditory cortex (A1) and the rostral field preferring AMNBs and lateral regions preferring CVCs. (2) Anterior ACFs showed smaller activations but more clearly defined stimulus preferences than did posterior ACFs. Stimulus preference gradients were unaffected by auditory attention suggesting that ACF preferences reflect the automatic processing of different spectrotemporal sound features.
Introduction
Although there is an increasing consensus that lateral regions of human auditory cortex play a central role in the analysis of speech sounds (Blumstein et al., 2005; Desai et al., 2005, 2008; Liebenthal et al., 2005; Rimol et al., 2005; Obleser et al., 2006, 2007; Sabri et al., 2008; Leff et al., 2009; Flinker et al., 2011; Leaver and Rauschecker, 2010; Turkeltaub and Coslett, 2010; Zheng et al., 2010) there is little information about how speech sounds are processed in human auditory cortical fields (ACFs).
Human auditory cortex shares a common anatomical structure with the auditory cortex of other primate species (Hackett et al., 2001; Morsan et al., 2005; Fullerton and Pandya, 2007; Hackett, 2008). Based on the results of anatomical (Galaburda and Pandya, 1983; Pandya, 1995; Kaas et al., 1999; Kaas and Hackett, 2000) and functional (Rauschecker, 1998; Recanzone and Sutter, 2008; Kusmierek and Rauschecker, 2009) studies in the macaque, Kaas and Hackett (2000) developed a influential model of primate ACFs with three tonotopically organized core ACFs receiving direct thalamo-cortical inputs from the ventral nucleus of the medial geniculate body, surrounded by eight belt ACFs that receive inputs from the core and that process more complex sound features (Rauschecker and Scott, 2009). In a recent study using tonotopic mapping of functional magnetic resonance imaging (fMRI) activations on the cortical surface analysis (Woods et al., 2010c), we found that the tuning properties of population-defined ACFs were similar to those observed in macaques (Petkov et al., 2006) and conformed to the Kaas et al. (1999) model. Tonotopically organized core ACFs had narrow frequency tuning, monotonic intensity functions, and showed enhanced activations in the hemisphere contralateral to the ear of stimulation, whereas lateral belt ACFs were less sensitive to the acoustic features of tone stimuli but were more strongly modulated by attention (Woods et al., 2010c). In the current study we utilized the average ACF coordinates defined in this previous study to characterize the roles of human ACFs in processing more complex stimuli: consonant–vowel–consonant (CVC) syllables and spectrally matched amplitude-modulated noise bursts (AMNBs).
Human studies have long implicated the superior temporal gyrus (STG) and superior temporal sulcus (STS) in the phonological processing of speech sounds. Figure 1A shows the cortical surface locations of peak fMRI activations produced by spoken syllables and acoustically balanced control stimuli in 23 experiments that were meta-analyzed by Turkeltaub and Coslett (2010). The results have been superimposed on the population-averaged ACF boundaries from Woods et al. (2010c). Activations specifically associated with phonological processing are clustered along the STG in the mid-lateral belt and caudal parabelt (CPB) fields in both hemispheres. Figure 1B shows a similar map from Leaver and Rauschecker’s (2010) recent study identifying regions that responded more strongly to consonant–vowel (CV) syllables than to bird song elements, sounds of musical instruments, or animal sounds. Speech-critical regions again cluster in mid-lateral belt fields at locations similar to those reported by Turkeltaub and Coslett (2010).
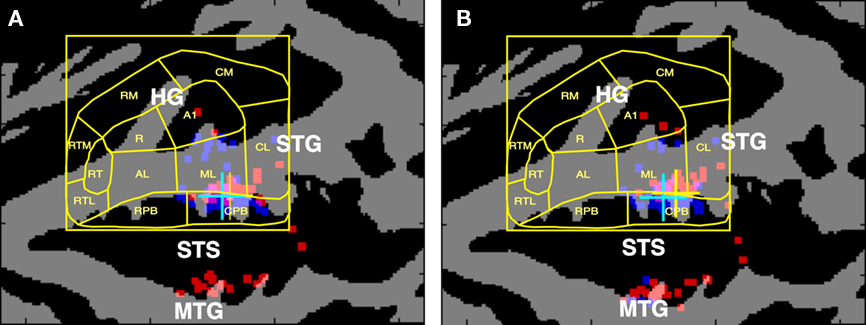
Figure 1. (A) Cortical surface locations of activation peaks associated with the phonological processing of speech sounds as reported in the metanalysis of Turkeltaub and Coslett (2010). Talairach coordinates were projected onto the average cortical surface of 60 subjects using VAMCA (nitrc.org/projects/vamca). Gray = gyri, black = sulci. Dots show the cortical surface locations of the reported Talairach coordinates on each of the hemispheres of 60 individual subjects (red = left, blue = right) that were used to estimate the median location. Cyan crosses show the median location of activations in the left hemisphere, yellow crosses show the median location of activations in the right hemisphere. The results were superimposed on the average cortical surface boundaries of functionally defined auditory cortical fields from Woods et al. (2010b). (B) Cortical surface locations of the regions that responded most strongly to consonant–vowel (CV) syllables in comparison with bird song elements, sounds of musical instruments, or animal sounds, from Leaver and Rauschecker (2010). HG, Heschl’s Gyrus; STG, superior temporal gyrus; STS, superior temporal sulcus; MTG, middle temporal gyrus. Core ACFs: A1, primary auditory cortex; R, rostral field; RT, rostrotemporal field. Medial belt ACFs: CM, caudomedial field; RM, rostromedial field; RTM, rostrotemporal medial field. Lateral belt ACFs: CL, caudolateral field; ML, mid-lateral field; AL, anterior–lateral field; RTL, rostrotemporal lateral field. Parabelt ACFs: CPB, caudal parabelt field; RPB, rostral parabelt field.
While these and other recent studies (Friederici et al., 2010; Liebenthal et al., 2010; Lillywhite et al., 2010; McGettigan et al., 2010; Zheng et al., 2010) provide estimates of the location of speech-critical cortex based on volumetric analyses of fMRI data, activations in auditory cortex can be localized more precisely when cortical-surface analysis techniques are used (Kang et al., 2004; Viceic et al., 2009). However, while a number of investigators have displayed and quantified activations on the cortical surface following volumetric analysis (Skipper et al., 2007; Zevin et al., 2010) only one study to date has used a thoroughgoing cortical surface analysis to analyze the processing of speech sounds. Desai et al. (2005) demonstrated that enhanced responses to CV syllables in comparison with tones were restricted to a region of the STG that encompassed anterior and mid-lateral belt fields. However, when the same data were analyzed with volumetric techniques and then projected onto the cortical surface, activation smearing was observed with activations spreading as far as the middle temporal gyrus (MTG).
In the macaque, neuronal recordings have implicated the anterior–lateral (AL) belt field in the processing of conspecific vocalizations (Rauschecker et al., 1995; Rauschecker and Tian, 2000; Tian et al., 2001). In a recent fMRI study of macaques, Petkov et al. (2008) localized a vocalization-sensitive region on the superior temporal plane that was anterior to the AL field. In contrast, other primate studies have implicated posterior auditory cortex in vocalization processing. For example, neuronal recordings have revealed vocalization-specific responses in the caudal insula of macaques (Remedios et al., 2009) and positron emission tomography studies suggest that conspecific vocalization processing occurs in posterior temporal cortex in chimpanzees (Taglialatela et al., 2009).
While neurophysiological studies of vocalization processing in other primate species have generally focused on differences in the tuning properties of neurons in specific ACFs, most human studies report regions where the most statistically significant contrasts are observed between conditions. While these two approaches generally produce similar results, in some cases they may lead to different conclusions. For example, consider two hypothetical ACFs. Field X shows average activations of 0.10% of the total fMRI signal in speech sound conditions and activations of 0.05% in non-speech sound conditions, whereas Field Y shows activations of 0.60% in speech sound conditions and activations of 0.40% in non-speech sound conditions. Although field X shows greater speech specificity than field Y, the absolute difference in activation magnitudes between speech and non-speech sound conditions is four times as large in field Y as in field X. Thus, overall speech vs. non-speech sound contrasts will show greater statistical significance in field Y than in field X even though field X shows a greater response preference for speech sounds.
In the current study we compared the stimulus preferences and the absolute activation magnitudes to speech sounds (CVCs) and non-speech sounds (AMNBs with spectra identical to those of CVCs) in different ACFs. In our previous study using tonal stimuli (Woods et al., 2010c) we found highly significant differences in the tuning properties of core ACFs in comparison with both medial belt and lateral belt ACFs. However, few functional differences were observed among the different the medial belt or lateral belt ACFs. Because belt fields are known to process more complex sounds (Rauschecker and Scott, 2009), in the current study we evaluated whether functional distinctions might emerge among belt ACFs when CVCs and AMNBs were used.
Another critical issue complicating the identification of speech-sensitive cortex is the potentially confounding effect of attention. While speech sounds reliably produce preferential activations in lateral belt fields, attention to non-speech sounds (e.g., tones) enhances fMRI activations in similar locations (Petkov et al., 2004; Woods et al., 2009). Because the majority of brain imaging studies of phonological processing have used passive listening or relatively undemanding attention tasks, it remains uncertain whether the enhanced lateral belt activations to vocalizations reflect an intrinsic preference or increased overt or covert attention. In a recent study, Sabri et al. (2008) carefully controlled attention in an intermodal selective attention task and found that enhanced activations to speech sounds in the STG occurred only when stimuli were actively attended.
There is also conflicting evidence about hemispheric asymmetries in the phonological processing of speech sounds. In their comprehensive review Turkeltaub and Coslett (2010) found that activations associated with phonological processing were generally enhanced in the left hemisphere. However, Leaver and Rauschecker (2010) found no such asymmetries.
In the current study we quantified both activation magnitude and stimulus preferences in human ACFs using monaural CVCs and AMNBs. By using an intermodal selective attention task it was also possible to determine if regions implicated in the phonological analysis of speech sounds would show similar stimulus preferences when subjects performed a difficult visual task that precluded auditory attention.
Methods
Subjects
Fourteen right-handed subjects (aged 20–35 years, nine females and five males) each participated in three imaging sessions after providing informed consent in accordance with the local Institutional Review Board. All subjects had normal or corrected-to-normal vision and normal hearing by self-report.
Stimuli and Tasks
Figure 2 illustrates the paradigm. Subjects performed a demanding intermodal selective attention task. Subjects always attended to a single modality that was randomly assigned on each block and cued by a semi-transparent letter at fixation. Different blocks were presented according to a randomized factorial design with both stimulus and attention conditions exhaustively crossed in each experiment. There were four different types of blocks: two unimodal blocks with attended auditory or attended visual stimuli presented in isolation and two bimodal blocks where attention was directed to either auditory or visual stimuli. There were equal numbers of each block type, and block order was randomized with the additional constraint that a unimodal visual condition occurred on every 4th block.
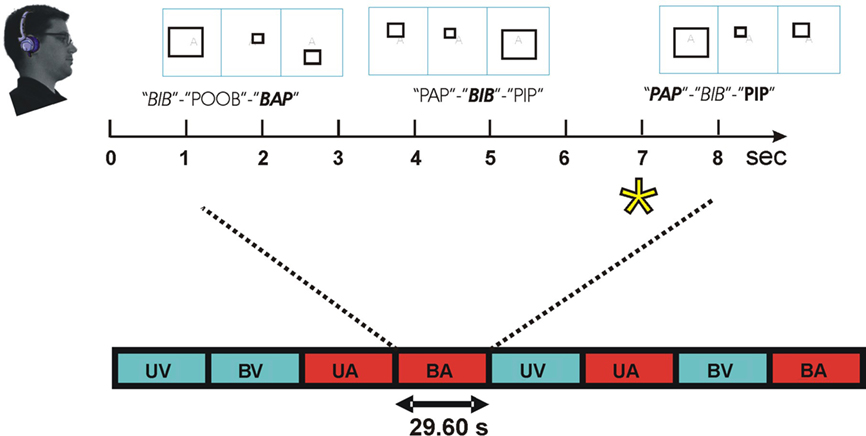
Figure 2. Intermodal selective attention block design. Stimuli were presented in blocks lasting 29.6 s. In speech conditions, subjects discriminated triads of consonant–vowel–consonant (CVC) syllables. Within each block, two consonants (one voiced, one unvoiced) were used that shared place (front, middle, or back) and manner of articulation (plosive or fricative). Consonants were combined with 3 different vowels to create 12 different CVC syllables. Recordings of the 12 CVCs were obtained twice from each of four different talkers to create 96 different tokens that were sampled randomly. Subjects focused attention on the modality cued by a letter at fixation (e.g., “A” = auditory, top) and performed a one-back, triad matching task. During attend-CVC conditions, subjects matched CVC triads regardless of talker. In non-speech conditions, subjects discriminated the frequency-modulation pattern of triads of syllable-length amplitude modulated noise bursts (AMNBs). AMNBs were amplitude modulated at four different frequencies. Different AMNBs were spectrally matched to each of the four talkers. During visual attention conditions subjects discriminated triads of open, closed, or exploded rectangles. On bimodal blocks, auditory and visual stimuli were presented asynchronously to minimize multimodal integration. Attend-auditory (red) and attend-visual (blue) blocks occurred in constrained random order. Block conditions: UV, unimodal visual; UA, unimodal auditory; BV, bimodal, visual attention; BA, bimodal auditory. Enlarged: BA block with front plosives (/p/ and /b/). Talker: female talker 1, female talker 2, male talker 1, male talker 2. Target = asterisk.
Three 1.2-h functional brain imaging sessions were performed on separate days. In each imaging session, there were six 12-min runs (24 blocks per run). Thus, there were a total of 108 blocks containing auditory stimuli, each containing eight triplet trials with CVCs or AMNBs in separate blocks. AMNBs were modulatations of talker-specific speech spectra had been obtained from the CVCs.
One focus of the current study was to compare the distributions of activations to consonants with different manners (fricatives vs. plosives) and places (front, middle, back) of articulation. In order to examine these consonant-specific differences in more detail two-thirds of the auditory blocks contained CVCs and one-third AMNBs. Thus, 1,728 syllables and 864 AMNBs were presented to each subject during each daily session.
The processing of unattended speech sounds and noise bursts were isolated in stimulus-dependent activations (SDAs) by subtracting activations in unimodal visual attention blocks from activations in bimodal visual attention blocks. Attention-related modulations (ARMs), reflecting enhanced auditory activations during auditory attention blocks, were isolated from differences between bimodal blocks during auditory and visual attention conditions. These blocks contained the same physical stimuli, but differed in whether subjects performed auditory or visual tasks of similar difficulty.
In CVC conditions, subjects listened to CVC syllables containing consonants with place of articulation (front, middle or back) and manner of articulation (plosive or fricative) held constant in each block as shown in Table 1. Thus, there were six different types of CVC blocks based on place of articulation (front, middle, or back) and manner of articulation (plosive or fricative). During each CVC block, two different consonants (one voiced, one unvoiced) with the same place and manner of articulation occurred in both initial and final syllable positions. Consonants were combined with three different vowels (/a/,/i/, and /u/) to create 12 different CVC syllables presented in each block. Two different tokens of each CVC were sampled from each of four talkers (two female). This resulted in 96 different CVC tokens that were randomly sampled during each block. Mean CVC durations ranged from 521 (for frontal plosives) to 717 ms (for back fricatives). CVCs were selected from among 9,600 syllables that had previously been used to characterize consonant confusions and evaluate consonant identification ability (Woods et al., 2010a,b).
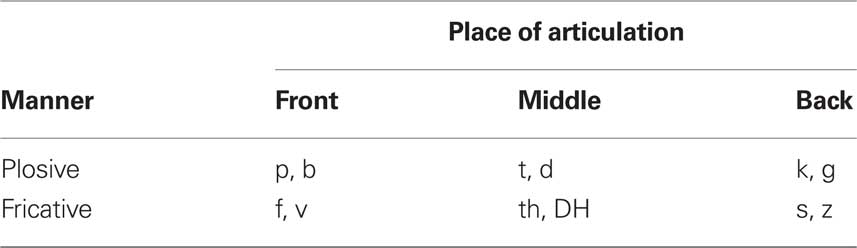
Table 1. Two consonants were delivered in each block with consonants sharing place and manner of articulation. CVCs contained three different vowels: /a/, /i/, and /u/. Syllables were spoken by four different talkers.
Non-speech stimuli were speech-spectrum noise bursts (AMNBs) of 600 ms duration. The spectra had been obtained by averaging the spectra of 2,400 CVC tokens from each talker as described in Woods et al. (2010b). This spectrum was then used to create a finite impulse response (FIR) filter that was used to filter broadband white noise to create 10 different noise segments of 1200-ms duration. Segments of these noise samples were then randomly sampled and amplitude modulated during the testing sessions. Four different types of AMNB tokens per spectrum were created by amplitude modulating the speech-spectrum noise bursts at 0, 4, 8, or 16 Hz. Thus, 16 types of AMNBs were randomly sampled from a set of 160 AMNB tokens that included 10 independent samples of speech spectrum noise from each of four talkers.
Auditory stimuli were presented in groups of three. During attend CVC blocks, subjects performed a one-back syllable matching task searching for repeated syllable triads regardless of variations in the talker’s voices (Figure 2). The talker’s voice, consonant voicing and vowel content varied randomly within each block. During attend AMNB blocks, subjects performed a similar one-back triad-matching task based on the amplitude modulation rates of the three stimuli. Targets occurred one or two times per block with a mean probability of 18.75%. Stimulus intensity was fixed at 88 dB SPL A-weighted so that stimuli were clearly audible above background scanner noise. Auditory stimuli were delivered monaurally to the left or right ear on separate blocks. Interstimulus intervals within the triad were fixed at 100 ms. Inter-triad intervals (range 1000–1600 ms) were slightly adjusted so that the eight triads were equally spaced over each 29.6 s block.
Visual stimuli were line drawings of rectangular shapes whose properties varied independently of auditory stimuli. Visual stimuli varied in the type of line drawing (solid line, broken line segments forming a closed shape, and misoriented broken line segments forming an exploded shape) and the type of shape variation that occurred within each visual triad (surface area variation only, aspect ratio variation only, or width variation only). There were nine different visual conditions (three types of line drawings × three types of shape variation). Subjects performed a one-back matching task with targets defined by a repeating triad of shape changes. To minimize intermodal integration, visual stimulus onsets in bimodal stimulus blocks occurred at random asynchronies (range ±200–500 ms) with respect to the onset of auditory stimuli. During bimodal sequences, auditory blocks were randomly combined with the different types of visual blocks. Randomization and stimulus presentation and response collection were controlled with Presentation software (NBS, Albany, CA, version 13.0).
EPI-related acoustic noise was measured with an MRI compatible microphone head and torso system (Bruel and Kjaer, 2260) and showed an intensity of 105 dB SPL (A-weighted) with a frequency peak at 642 Hz. Scanner noise amplitude was modulated with the acquisition of each axial slice at a frequency of 10 Hz. Pump noise audible during inter-image acquisitions had an intensity of 65 dB SPL (A-weighted) that was dominated by low frequencies. Stimuli were presented through MRI-compatible electrostatic earbuds (Stax MRI-002, Stax Ltd, Saitama prefecture, Japan) that attenuated external noise over the audible frequency range. Further attenuation of ambient sounds was obtained with circumaural ear protectors (Howard Leight LM-77, Howard Leight Industries, San Diego, CA, USA) that provided 25 dB of additional attenuation at 4000 Hz, 18 dB at 1000 Hz, 6 dB at 250 Hz. Thus, the overall attenuation of external noise varied from 16 to 35 dB with greater attenuation of external sounds at high frequencies.
Imaging
Each subject underwent 1 h of behavioral training session followed by high-resolution T1 structural brain imaging on a 1.5 T Philips Eclipse scanner (voxel size 0.94 mm × 1.30 mm × 0.94 mm, TR 15 ms, TE 4.47 ms, flip angle 35). Two such anatomical images were re-sliced to 1 mm × 1 mm × 1 mm resolution, averaged, and then inflated to the cortical surface using FreeSurfer (Dale et al., 1999; Fischl et al., 1999a). The inflated cortical surfaces of the left and right hemispheres were then co-registered to a common spherical coordinate system (Fischl et al., 1999b) based on a reference template derived from the average pattern of 40 individual subjects. The differences in curvature between the mean spherical maps of the left hemisphere and the reflected right hemisphere were then numerically minimized using surface translation and rotation to create a hemispherically unified anatomically based coordinate system (Woods et al., 2009). This resulted in an accurate alignment of the principal gyri, including the STG and Heschl’s gyrus (HG), across subjects and hemispheres.
On three subsequent days, each subject underwent 1.2-h sessions of functional imaging using a spin-echo EPI sequence (29 axial slices 4 mm thick plus 1 mm gap, voxel size 2.5 mm × 2.5 mm × 5 mm, TR = 2.96 s), TE 39.6 ms, flip angle 90°. On each day 144 stimulus blocks were presented across six 12-min runs, with rests between runs provided upon subject request. Eleven images were obtained during each block, with five additional images preceding the start of the experiment in order to reach saturation.
Head movements were measured using SPM5 (Friston et al., 1996). Each functional image was resampled into higher-resolution (1 mm3) anatomical space before realigning and averaging, so-called anatomical space analysis (Kang et al., 2007). This technique, similar to hyper-resolution techniques developed for spy satellite image analysis, improves the spatial resolution of fMRI due to the fact that the relative locations of functional and anatomical voxels change slightly over the course of experiments (due to minor head movements) and across experimental sessions.
Overall mean voxel image values for each imaging session were computed and equalized across each subject’s three sessions. Average percent signal changes in response to auditory stimuli were calculated for each subject relative to the overall mean BOLD response for each voxel. The effects of physiologically implausible BOLD fluctuations (Weisskoff, 2000) were reduced by capping local fluctuations at ±5%, a technique called Winsorization (Marchini and Ripley, 2000). Finally, functional image data were high-pass filtered with a cutoff of 0.006 Hz using orthonormal polynomial detrending.
Delimiting Auditory Cortex
Auditory activations on the cortical surface were visualized using an equal-area Mollweide projection after spherical inflation of each hemisphere using Freesurfer (Figure 3). The Mollweide projection was centered on HG and oriented so that the superior temporal plane lay on the equator. Population-averaged fMRI data was used to define a rectangular region encompassing areas showing significant activations to non-attended sounds. The rectangle included HG, much of the superior temporal plane and STG, and portions of the STS (Figure 2, bottom left). Grid positioning was identical to that used in our previous study (Woods et al., 2010c).
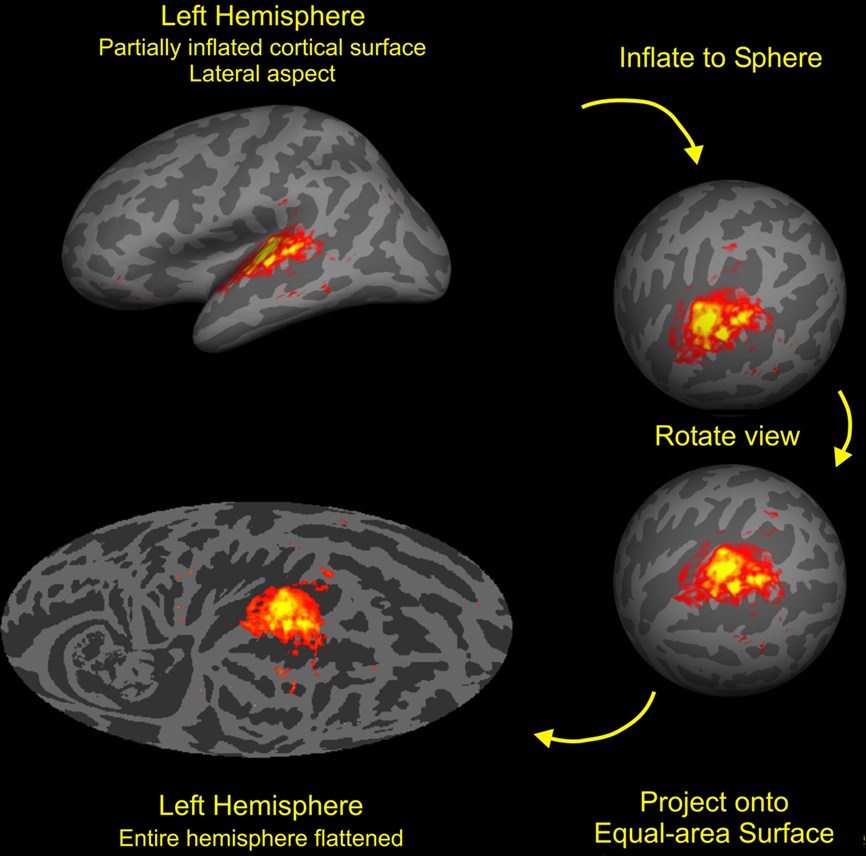
Figure 3. Cortical surface analysis. The cortex from each subject was segmented with FreeSurfer (Fischl et al., 1999b) then inflated to a sphere and aligned to a common coordinate system. The functional and anatomical data were then mapped onto a Mollweide equal-area projection after rotating the sphere so that the intersection of Heschls gyrus (HG) and the superior temporal gyrus (STG) lay at map center with the STG aligned along the equator. Stimulus-dependent activations (SDAs) averaged over all auditory stimulation conditions and subjects are shown on the average anatomy of the left hemisphere. Activations were restricted to the regions of auditory cortex near HG with the outlined region enlarged in the figures shown below. Colored voxels show voxels showing highly significant activations (t > 7.0) with mean percent signal changes ranging from 0.1 to 0.6% (red to yellow).
Activation Alignment with the ACF Model
Activations were assigned to human ACFs based on cortical surface coordinates obtained using tonotopic field mapping (Woods et al., 2010c). Field assignment was based on the Kaas et al. (1999) model of primate auditory cortex. The core included primary auditory cortex (A1), the rostral field (R) and the rostrotemporal (RT) field. The medial belt included the rostrotemporal medial (RTM), rostromedial (RM) and caudomedial (CM) fields. The lateral belt included the caudolateral (CL), middle–lateral (ML), AL, and rostrotemporal-lateral (RTL) fields. The parabelt included the rostral parabelt (RPB) and CPB fields. Auditory activations were compared between field groups and then between fields within each group. ACFs were defined using identical surface coordinates in the left and right hemispheres, following the co-registration of the left and mirror-reversed right hemisphere. Thus, ACF coordinates in both hemispheres shared similar locations relative to HG and other anatomical landmarks.
Quantifying the Functional Properties of ACFs
Auditory CVC and AMNB activations were quantified using a rectangular grid that contained 1,748 1.75-mm × 1.75-mm grid elements as shown in Figure 4. The grid spanned 80.5 mm anterior–posteriorly and 66.5 mm medial–laterally on the cortical surface and covered approximately 5400 mm2, i.e., roughly the full spatial extent of auditory response produced during visual attention conditions. Response magnitude (mean percent signal change) was quantified for each grid element in each field. To compare stimulus preferences across fields, we examined the ratio of CVC activations to the mean of CVC + AMNB activations. Thus, fields showing a CVC preference produce CVC/mean ratios above 100%, while fields with AMNB preferences produced CVC/mean ratios below 100%. Stimulus preferences were statistically evaluated using ANOVA for repeated measures with subjects treated as a random factor and ACF or ACF-group, Stimulus-type (CVC or AMNB), Hemisphere (left or right), Ear of delivery and Time after block onset (i.e., image number) included as factors. Individual ACFs were also analyzed with grid position as a factor to determine if there were significant differences in the distribution of activations within ACFs as a function of stimulus type or ear of delivery.
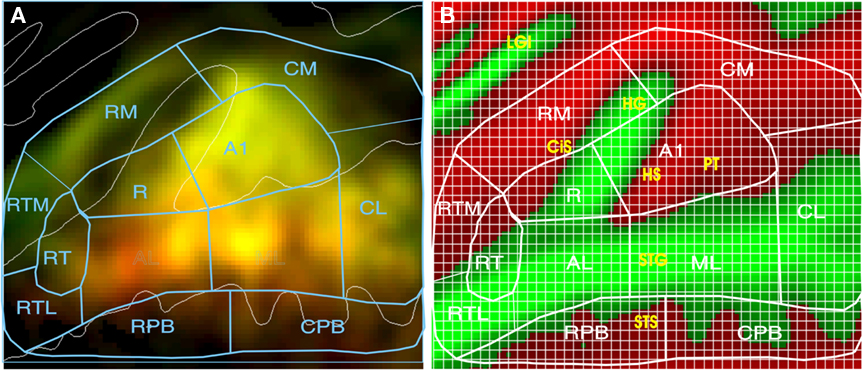
Figure 4. Quantifying activations. (A) Mean percent signal change (0.05–0.58%) of activations coded by brightness. Color shows stimulus preferences (red = CVC, green = AMNB). Yellow areas were activated by both stimulus classes. See text for ACF labels. (B) ACF locations projected on average curvature map of the superior temporal plane (green = gyri, red = sulci), showing anatomical structures and grids used for quantification. Green = gyri, red = sulci. CiS, circular sulcus; HG, Heschl’s gyrus; HS, Heschl’s sulcus; PT, planum temporale; STG, superior temporal gyrus; STS, superior temporal sulcus, LGI, long gyri of the insula.
Statistical Analyses
ANOVA analyses for multifactorial repeated measures were performed with the open source CLEAVE program (www.ebire.org/hcnlab). All analyses were based on a random effects model and using the Box–Greenhouse–Geisser correction to control for any lack of statistical independence due to spatially correlated BOLD signals.
Results
Behavior
Reaction times (RTs) were available for only 11 of 14 subjects due to a problem in response recording. An analysis of the remaining subjects’ data showed that performance in the auditory tasks was superior to performance in the visual tasks [F(1,10) = 8.16, p < 0.02] with hit rates of 84.5% in attend-auditory blocks and 76.8% in attend visual blocks. However, RTs were significantly shorter in visual (644 ms) than auditory (829 ms) blocks [F(1,10) = 249.3, p < 0.0001], due primarily to the fact that auditory target discrimination depended on information at the end of the auditory stimuli (e.g., final consonants).
Performance in the auditory conditions was further examined in 3-way ANOVAs with Stimulus-type (CVCs or AMNBs), Condition (unimodal stimulation vs. bimodal stimulation, auditory attention) and Ear of delivery as factors. Hit rate showed a significant main effect of Stimulus-type [F(1,10) = 68.24, p < 0.0001] due to higher hit rates in CVC (86.3%) than AMNB (74.7%) blocks. However, there were no significant differences in RTs as a function of Stimulus-type, nor were there significant differences in either hit rate or RT as a function of Condition or Ear of delivery.
A second 4-way ANOVA analyzed performance in CVC blocks, with Condition (unimodal stimulation, auditory attention vs. bimodal stimulation, auditory attention), consonant Place of articulation (front, middle, or back), consonant Manner of articulation (fricative or plosive), and Ear of delivery as factors. For RTs, neither Condition [F(1,10) = 0.25], nor Place of articulation [F(1,10) = 1.44] significantly affect performance. However, RTs were significantly affected by Manner of articulation [F(1,10) = 52.31, p < 0.0001], due to shorter RTs for plosives (759 ms) than fricatives (887 ms). This likely reflected differences in mean syllable duration (522 ms for plosive syllables vs. 676 ms for fricative syllables) and was not accompanied by changes in hit rate [F(1,10) = 0.23]. RTs were also shorter to CVC targets in the right ear than to CVC targets in the left ear [812 vs. 832 ms, F(1,10) = 5.45, p < 0.05] and subjects also tended to detect right ear targets more accurately [88.3 vs. 84.4%, F(1,10) = 3.76, p < 0.08] consistent with previous results (Fry, 1974).
Response Properties of ACF Groups
Table 2 shows the activation magnitudes and stimulus preferences of different ACF groups. Activation magnitudes were largest in the core and lateral belt fields and significantly smaller in the medial belt and parabelt field groups [F(3,39) = 50.89, p < 0.0001]. Activation magnitudes were not significantly influenced by the presence of visual distractors in any field group.
To further examine stimulus preferences, amplitudes were normalized across all stimulus conditions within each ACF. Different field groups had distinct stimulus preferences that were reflected in a significant Stimulus-Preference × Field-group interaction [F(3,39) = 31.93, p < 0.0001]. As shown in Figure 5, this was due to the fact that medial belt fields showed a preference for AMNBs [F(1,13) = 11.44, p < 0.005], core fields showed no significant preference for either stimulus category [F(1,13) = 2.37, p < 0.15], while lateral belt and parabelt fields showed marked preferences for CVCs [F(1,13) = 34.36, p < 0.0001 and F(1,13) = 32.86, p < 0.0001, respectively]. Importantly, the highly significant stimulus preferences seen in medial belt, lateral belt and parabelt groups were also evident for unattended stimuli [i.e., p < 0.006 for all comparisons].
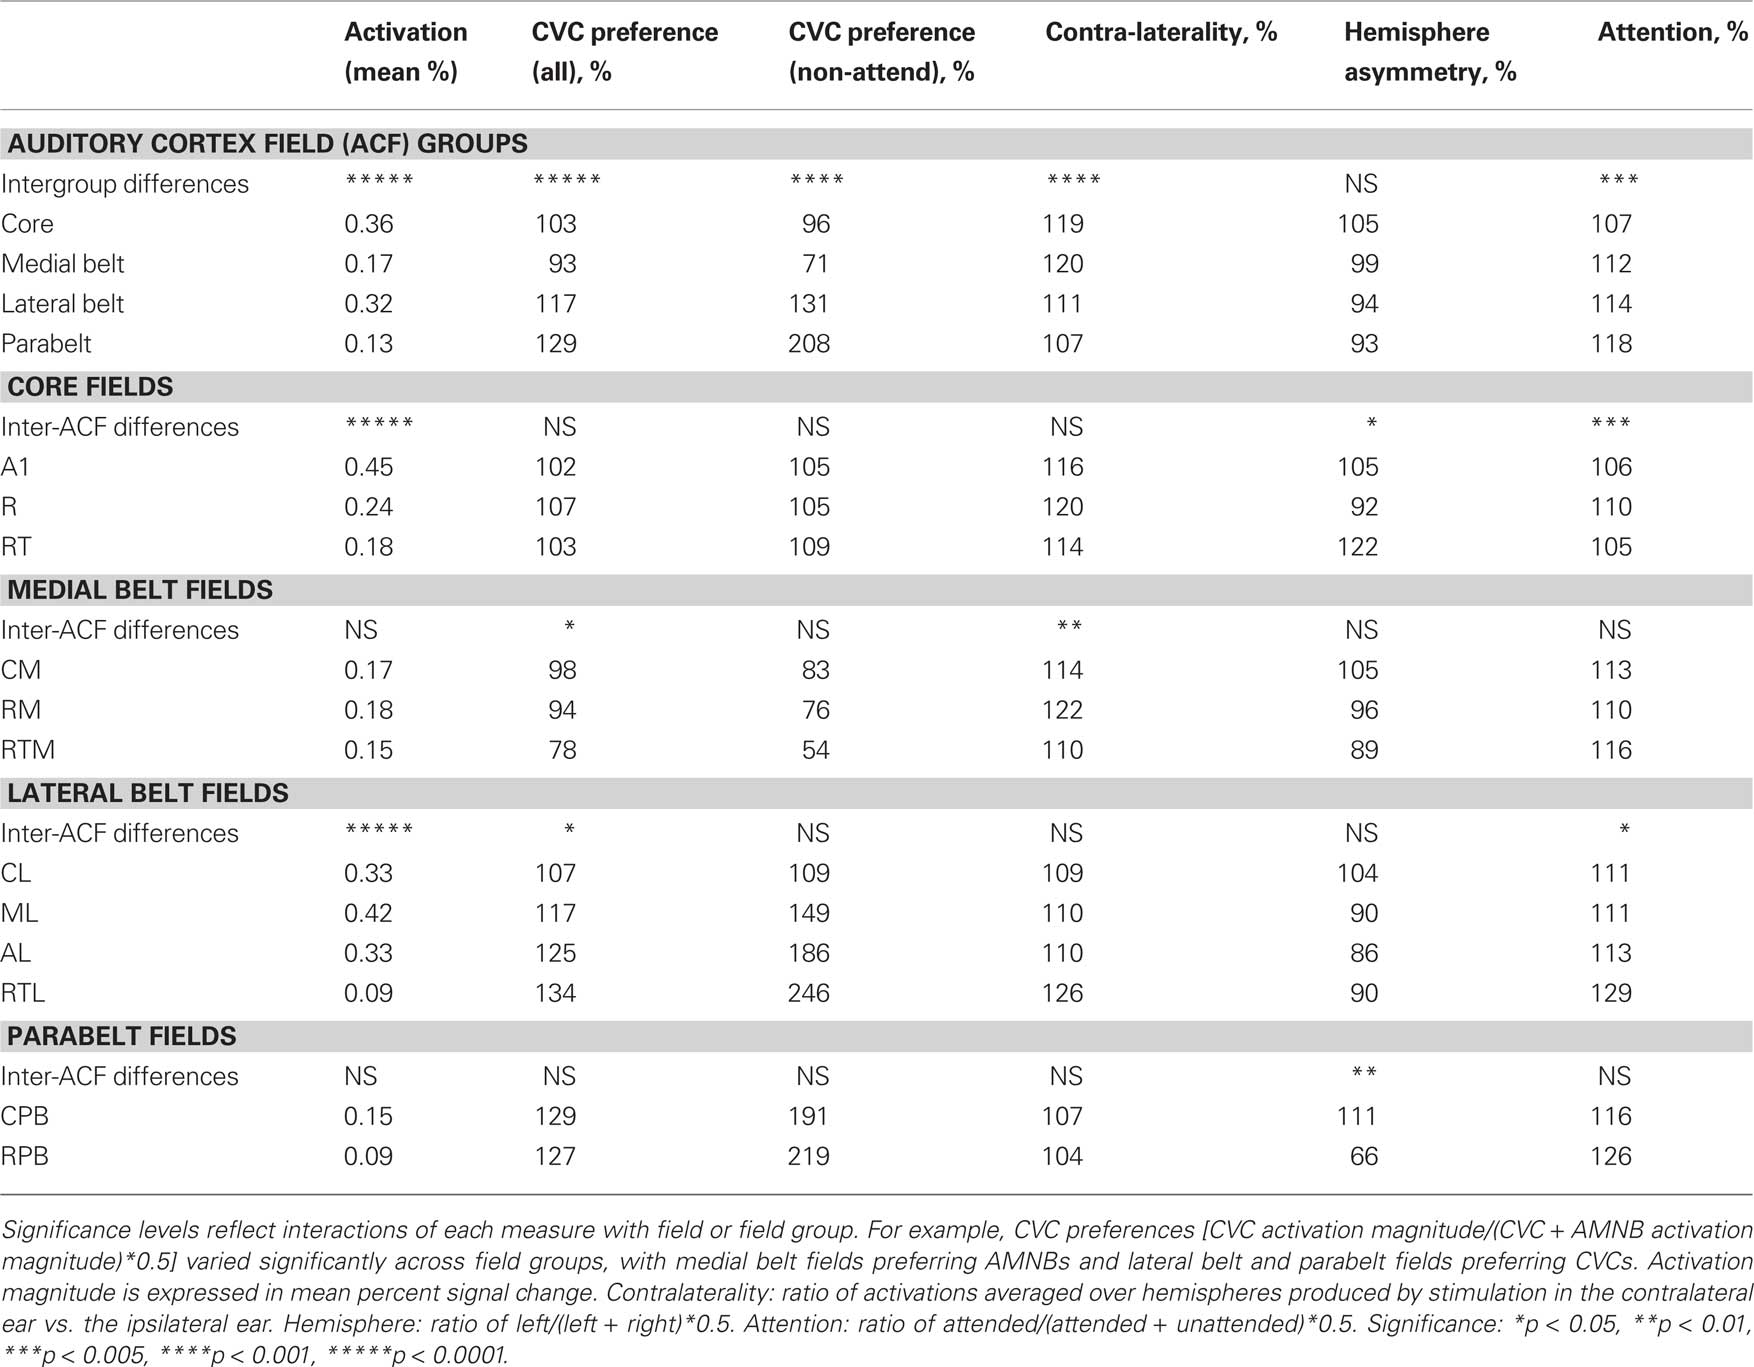
Table 2. Mean activation magnitudes (in %) and stimulus preferences for field groups (top) and for individual core, medial belt, lateral belt, and parabelt fields.
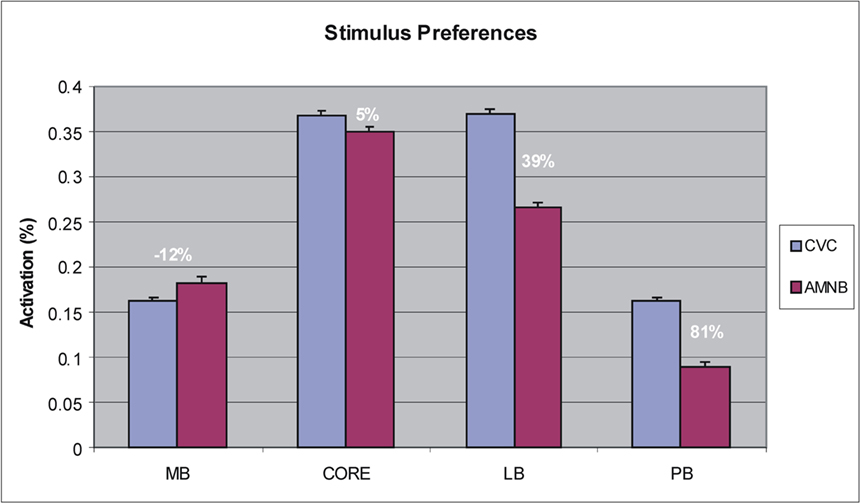
Figure 5. Stimulus preferences of different field groups showing mean activation magnitudes and the percent enhancement within each field group for CVC syllables vs. amplitude modulated speech-spectrum noise bursts (AMNB).
There was also a highly significant contralaterality effect over auditory cortex [F(1,13) = 98.56, p < 0.0001]: activations were about 30% larger in the hemisphere contralateral to stimulated ear than over the ipsilateral hemisphere. In addition, there was also a significant Contralaterality × Field-group interaction [F(3,39) = 8.42, p < 0.0002] due to greater contralaterality in core and medial belt ACFs than in lateral belt or parabelt ACFs. Although contralaterality was greatest in the core and medial belt ACFs, significant contralaterality was still evident in lateral belt ACFs [F(1,13) = 31.51, p < 0.0001], but contralaterality failed to reach significance in parabelt ACFs [F(1,13) = 3.18, p < 0.10].
Figure 6 shows the effects of attention on activations in each field group. There was a significant Condition × Field-group interaction [F(6,78) = 4.83, p < 0.008]: attentional modulation was relatively reduced in core fields in comparison with other field groups. Nevertheless, attention significantly enhanced responses throughout auditory cortex [F(2,26) = 16.04, p < 0.0001] and within every field group [at least p < 0.002 in all field groups, including the core]. Importantly, there were no significant trends in Condition × Stimulus-type or Condition × Stimulus-type × Field-group analyses. This indicates that the attentional enhancements to CVCs and AMNBs had similar magnitudes and distributions over auditory cortex.
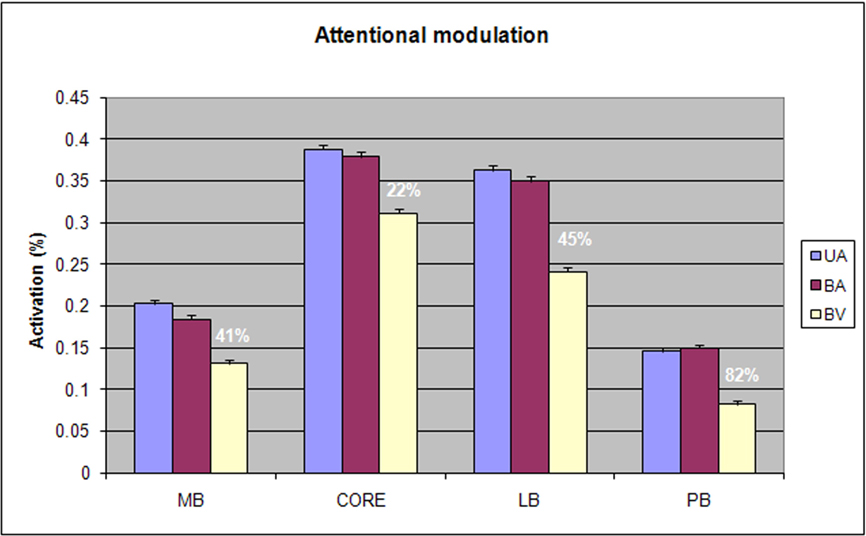
Figure 6. Attentional modulation of different field groups showing activation magnitudes and mean percentage of attentional enhancement for each field group. UA = unimodal auditory, BA = bimodal auditory attention, BV = bimodal visual attention.
Figure 7 shows the timecourse of SDA and ARMs, for the different field groups. As in previous studies, SDAs peaked shortly after sound onset and showed a gradual adaptation throughout the stimulus block (Petkov et al., 2004). In contrast, ARMs were minimal at block onset but increased in magnitude over the first 21 s of sound delivery, remained at a high level until the end of the stimulation (image 10), and continued during the first image of the next stimulation block. As a consequence, field groups with relatively larger ARMs would be expected to show delays in the timecourse of activations. We did find small but significant differences in the timecourse of amplitude-normalized activations between field groups [F(30,390) = 2.49, p < 0.04], with delays in lateral belt and parabelt fields and increased persistence of activations after sound offset in comparison with activations in the core and medial belt. However, when SDAs alone were analyzed, the differences in time courses of different field groups failed to reach significance [F(30,390) = 1.35].
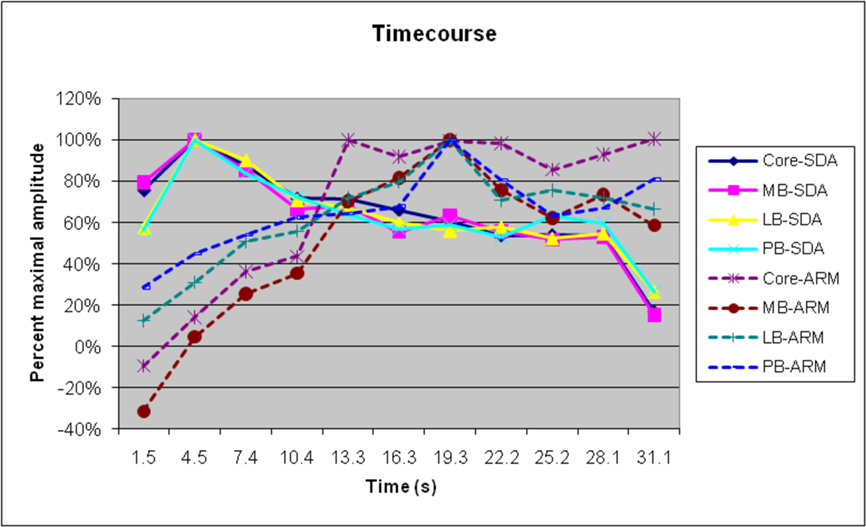
Figure 7. Normalized timecourses of SDAs and ARMs in different ACF groups. Auditory stimulus delivery ceased at approximately 28.5s, but attention effects persisted into the next stimulus block.
Activation contralaterality also reflected the relative contributions of SDAs and ARMs in different field groups. As in previous studies (Petkov et al., 2004; Woods et al., 2009), ARMs showed insignificant contralaterality [F(3,39) = 2.25, NS] whereas SDAs showed large contralateral enhancements [F(3,39) = 7.98, p < 0.001]. Thus, fields with large ARM/SDA ratios (e.g., parabelt) would be expected to show reduced contralaterality in comparison with core fields with smaller ARM/SDA ratios, as observed.
Activation magnitudes were similar in the left and right hemisphere [F(1,16) = 0.65, NS] without significant hemisphere asymmetries noted for any ACF group. CVC blocks were further analyzed as function of the place and manner of consonant articulation. No significant main effects or interactions of Place or Manner with ACF-group, Ear of delivery, Condition or Hemisphere were observed.
Response Properties of Core Fields
Table 2 shows activation magnitudes in the three different core fields: A1, R and RT. There was no significant main effect of Stimulus type nor was there a significant Stimulus-type × ACF interaction. However, there was a small but significant Hemisphere × ACF interaction [F(2,26) = 4.94, p < 0.03], due to the fact that activations were larger over the left hemisphere in A1 and RT, but over the right hemisphere in R. In A1 there was also a significant Stimulus-type × Hemisphere interaction [F(1,13) = 6.13, p < 0.03]: CVCs produced larger activations in left hemisphere whereas AMNBs produced larger activations in the right hemisphere. This asymmetry was also seen in SDAs alone [F(1,13) = 9.33, p < 0.01] and did not interact with Ear of stimulation.
Further analysis of activation distributions was performed in A1 and R. In A1, there was no significant overall preference for CVCs [F(1,13) = 2.40, NS]. However, there was a significant variation in stimulus preferences with grid position [F(172,2236) = 3.57, p < 0.007]. Figure 8 shows an analysis of stimulus preferences for different isofrequency contours as estimated from Woods et al. (2010c). Two effects were observed. First, CVC preferences interacted with frequency preferences: high-frequency responsive regions preferred AMNBs, mid-frequency responsive regions slightly preferred CVCs, and low-frequency responsive regions strongly preferred CVCs. Second, there was a medial-to-lateral gradient in stimulus preferences within isofrequency bands: medial regions preferred AMNBs and lateral regions preferred CVCs.
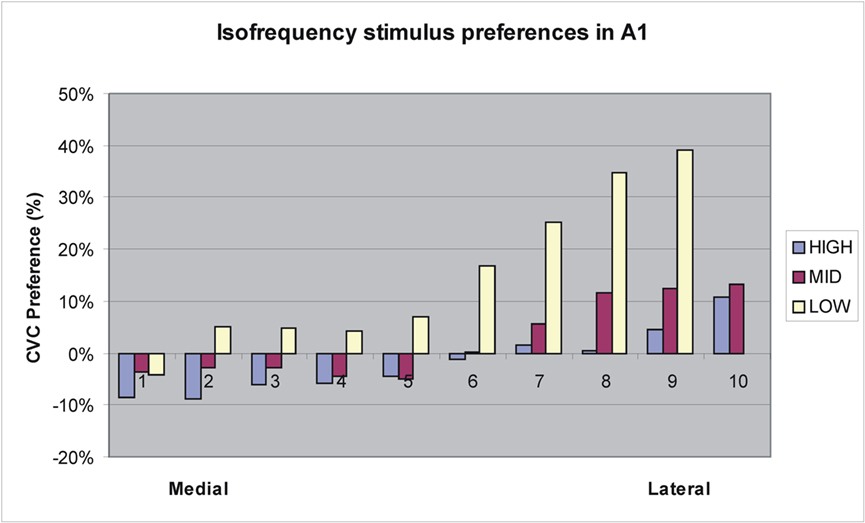
Figure 8. Tuning preferences of grid elements in A1 from medial to lateral boundaries along approximate isofrequency contours estimated using tonotopic maps from Woods et al. (2010c). Low = 125–500 Hz, Mid = 500–2000 Hz, High = 2000–8000 Hz.
Like A1, R showed a significant Stimulus-type with Grid-position interaction [F(172,2236) = 3.61, p < 0.008]. However, unlike A1, R also showed a small but significant overall preference for CVCs [F(1,13) = 5.26, p < 0.04]. Figure 9 shows an analysis of stimulus preferences along isofrequency contours in R. As in A1, CVC preferences generally increased at the lateral boundary of R, particularly in regions responding to middle and low spectral frequencies. In contrast, no significant Stimulus-type with Grid-position interaction was found in core field RT [F(46,598) = 1.01, NS].
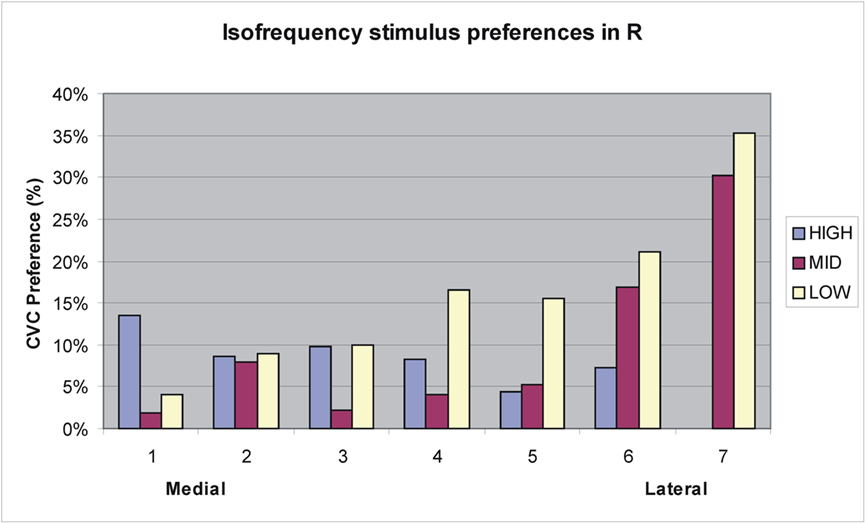
Figure 9. Tuning preferences of grid elements in R from medial to lateral boundaries along approximate isofrequency contours estimated from tonotopic maps from Woods et al. (2010c). See Figure 8 for frequency values.
Attention significantly enhanced activations in core fields as a whole [F(2,26) = 11.34, p < 0.003] and in each core field individually [p < 0.05 to p < 0.0001]. However, attention effects were relatively larger in RT than in R or A1, producing a significant Attention-condition × ACF interaction [F(4,52) = 7.13, p < 0.006]. Finally, a further analysis restricted to blocks containing CVCs showed a main effect of Manner of articulation in A1 [F(1,13) = 11.54, p < 0.005]: fricatives produced larger activations than did plosives. No Manner effects were found in other core ACFs nor did Place of articulation affect activation magnitudes in any core ACF.
Response Properties of Medial Belt Fields
As shown in Table 2, there was no significant difference in the magnitude of activations in different medial belt ACFs [F(2,26) = 0.62]. AMNBs produced significantly larger activations than CVCs in medial belt ACFs [F(1,13) = 11.44, p < 0.005] and significant AMNB preference was also found to non-attended sounds [F(1,13) = 16.61, p < 0.002]. ARMs did not differ in magnitude for AMNBs and CVCs [F(1,13) = 0.99, NS]. There was also a significant Stimulus-type × ACF interaction [F(2,26) = 6.50, p < 0.02] that reflected an increasing preference for AMNBs in more anterior fields. AMNB-preferences were significantly greater in RTM than RM or CM [p < 0.01 both comparisons], with CM being the only medial belt field that failed to show a significant preference for AMNBs. There was also a significant difference in contralaterality in medial belt fields [F(2,26) = 8.05, p < 0.03] due to increased contralaterality in RM in comparison with RTM and CM.
Attention significantly enhanced medial belt activations [F(2,26) = 11.24, p < 0.002] without significant Attention-condition × ACF interactions [F(4,52) = 0.72, NS]. No significant main effects or 1st order interactions were found for place or manner of articulation when analyzed in CVC-only blocks either in all medial belt fields or in individual medial belt fields.
Response Properties of Lateral Belt Fields
As shown in Table 2, activation magnitudes differed significantly among lateral belt fields [F(3,39) = 28.49, p < 0.0001] with larger activations seen in ML (0.42%), AL (0.33%) and CL (0.28%), than in RTL (0.09%). CVCs produced larger activations than AMNBs in all lateral belt fields. However, the differences in activation magnitudes between CVC and AMNB blocks were larger in AL (0.16%) and ML (0.14%) than in CL (0.04%) or RTL (0.06%). Further analysis showed that CVCs produced significantly larger activations than AMNBs in lateral belt ACFs [F(1,13) = 33.36, p < 0.0001]. This preference was also evident in visual attention conditions [F(1,13) = 15.14, p < 0.002]. Although all lateral belt ACFs preferred CVCs [least significant: p < 0.02 for CL], CVC preferences increased in more AL belt ACFs resulting in a significant Stimulus-type × ACF interaction [F(2,26) = 6.83, p < 0.02]. Pairwise comparisons showed the greatest CVC preferences were seen in the AL belt fields, RTL and AL, with significant pairwise differences between AL and ML and between ML and CL.
Attention significantly enhanced activations in all lateral belt fields [F(2,26) = 33.36, p < 0.0001]. There was also an Attention × ACF interactions [F(3,39) = 3.89, p < 0.04] due to the fact that attentional enhancements were relatively larger in more AL belt ACFs. Attention effects tended to be larger for CVCs than AMNBs, but this effect failed to reach significance [F(1,13) = 3.06, p < 0.11]. There were no significant hemisphere asymmetries either in the lateral belt as a whole or in any individual field. The further analysis of CVC-blocks revealed no main effects of Place or Manner of consonant articulation and no significant Consonant-type × Grid-position interactions.
Response Properties of Parabelt Fields
As shown in Table 2, activation magnitudes were small in parabelt ACFs (0.12%) and did not differ between RPB and CPB. CVCs produced significantly larger activations than AMNBs [F(1,13) = 32.86, p < 0.0001], an effect that was also observed during visual attention conditions only [F(1,13) = 9.67, p < 0.01]. The magnitude of attention effects was similar for AMNBs and CVCs [F(1,13) = 1.06, NS]. There were no significant Stimulus-type × ACF interactions. However, there was a Hemisphere × ACF interaction [F(1,13) = 9.40, p < 0.01]: larger activations were seen in the right hemisphere RPB and the left hemisphere CPB. There was no significant Consonant-type × Grid-position interaction in any lateral belt field.
Attention significantly enhanced parabelt activations during CVC-only blocks [F(2,26) = 10.12, p < 0.002] without significant Attention × ACF interactions. We found no significant main effects of place or manner of articulation in CVC blocks, and no significant topographic differences as a function of Place or Manner of articulation.
ACF Functional Specialization for Processing CVCs and AMNBs
Figure 10 shows ACFs color coded by relative activation magnitudes to CVCs (red) and AMNBs (green). Significant pairwise differences in response properties for adjacent ACFs are shown for CVC stimulus preference (S), contralaterality (C), Attention (A) and Hemisphere (H). There was a clear medial-to-lateral gradient of CVC-selectivity: medial belt fields preferred AMNBs, core fields showed minimal stimulus preferences, and lateral belt and parabelt fields strongly preferred CVCs. This gradient extended through tonotopic fields A1 and R: medial regions of these fields preferred AMNBs and lateral regions preferred CVCs. There was also a posterior to anterior gradient of increased stimulus selectivity: rostral fields produced small activations with increasingly clear stimulus preferences. The most rostral medial belt field (RTM) showed the greatest preference for AMNBs and the most rostral–lateral belt field (RTL) showed the greatest preference for CVCs.
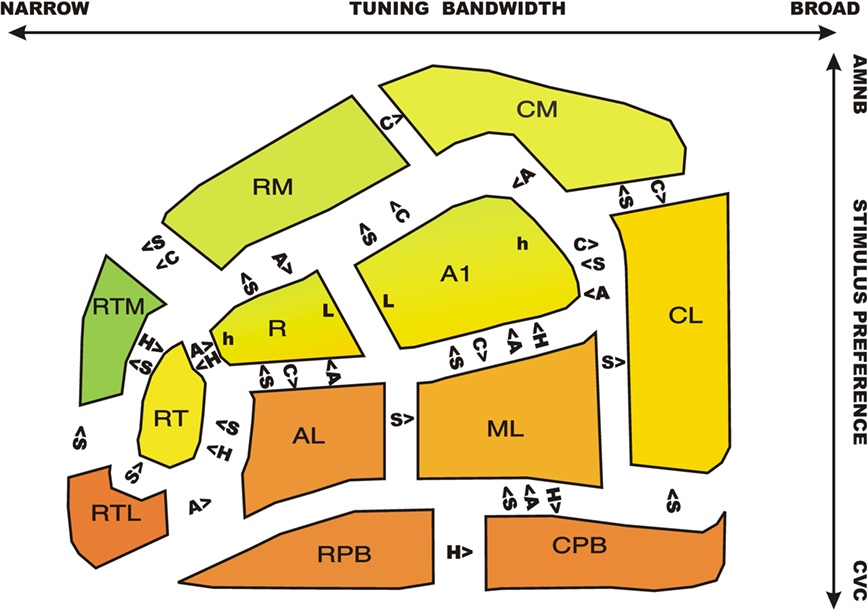
Figure 10. A schematic map of ACFs showing stimulus preferences (red = CVC, green = SSNB) with the R/G color mixture reflecting the relative magnitude of activations to the two stimulus categories. Significant differences in tuning properties of adjacent fields are indicated. S = CVC stimulus preference, C = contralaterality, A = attentional modulation, H = right/left hemispheric asymmetry. For example, primary auditory cortex (A1) showed significantly greater contralaterality, but reduced speech-preference, attentional modulation, and relative right-hemisphere amplitudes in comparison with the adjacent lateral belt field, ML. Tonotopic extrema of A1 and R: h = high frequency responsive area, L = low frequency responsive area.
Significant differences in response properties were particularly evident in pairwise comparisons of adjacent core and belt fields: core fields showed less marked stimulus preferences than adjacent belt fields: i.e., less AMNB preference than adjacent medial belt fields and less CVC preference than adjacent lateral belt fields. As in previous studies (Woods et al., 2010c) core fields also showed increased contralaterality in comparison with adjacent belt fields, as well as reduced attentional lability. At the lateral belt/parabelt boundary, the response properties of RPB were similar to those of adjacent lateral belt fields AL and RTL. However, the CPB field showed a greater CVC-preference and attentional lability than ML and a greater CVC preference than CL.
Discussion
General Properties of Core and Belt ACFs
Several properties of ACFs and ACF field groups were similar to those noted in previous studies using pure tone stimuli (Woods et al., 2010c): (1) overall activation magnitudes were largest in posterior lateral auditory cortex in fields A1 and ML; (2) greater contralaterality was seen in core fields than lateral belt or parabelt fields, with medial belt fields showing an intermediate pattern; and (3) attention effects were enhanced in belt fields in comparison with the core. Thus, belt fields appear to be generally less sensitive to basic acoustic properties of stimuli (e.g., ear of delivery) and more responsive to their behavioral relevance. However, unlike the previous study where stimulus-related differences between activations were largest in core fields to sounds differing in frequency or intensity, in the current experiment sounds differing in more complex features produced larger stimulus-related differences in the medial and lateral belt fields.
We also found differences between sensory responses to non-attended sounds (SDAs) and ARMs that replicated those seen in previous studies. SDAs showed strong contralaterality while ARMs were symmetrically distributed over the hemisphere ipsilateral and contralateral to stimulation (Petkov et al., 2004; Woods et al., 2009). These results contrast with those of selective attention studies using dichotic inputs where ARMs can show a contralateral distribution that reflects the direction of attention (Rinne et al., 2008).
In addition, there were striking differences in the adaptation of SDAs and ARMs similar to those that we have found in previous studies (Petkov et al., 2004). SDAs peaked shortly after stimulation began and showed gradual adaptation through the stimulus block, diminishing to about 60% of peak amplitudes. SDA adaptation occurred in all ACF field groups and was not stimulus specific. For example, in CVC blocks both the syllables and the talkers changed randomly. This pattern could reflect different adaptation of transient and sustained responses (Lehmann et al., 2007) or alternatively transient involuntary attention effects elicited by the onset of auditory stimuli. In contrast, ARMs were initially small, but increased in amplitude throughout the block. This likely reflects delays in the switching of focus of attention from the previous block as well as an improvement in the attentional focus that occurred as subjects gained familiarity with the specific stimulus set being presented.
Complex Sound Processing in Core Fields
As in previous studies (Woods et al., 2010c) core fields showed the largest overall activation magnitudes of any field group, with the largest activations seen in A1. Overall activation magnitudes in A1 were similar to CVCs and AMNBs. However, A1 showed two gradients of stimulus-preference. First, there was a medial-to-lateral gradient in stimulus preferences along isofrequency contours: medial regions of A1 showed a preference for AMNBs while lateral regions showed a preference for CVCs. In addition, high frequency responsive regions of A1 generally preferred AMNBs, mid-frequency regions show no clear stimulus preference, and low frequency regions generally preferred CVCs. Since CVCs and AMNBs had identical average frequency spectra, this finding suggests that the low- and mid-frequency sensitive regions of A1 (responding to pure tones in 250–2000 Hz frequency range) are biased for processing the acoustic features of human vocalizations. Unlike A1, the tonotopic field R showed an overall preference for CVCs. However, like A1, R showed a medial-to-lateral stimulus preference gradient: medial regions preferred AMNBs and lateral regions preferred CVCs and regions tuned to low frequencies tended to show the greatest preference for CVCs.
One possible explanation for these results is that human A1 and R contain receptive field gradients within isofrequency bands that are tuned to complex acoustic features. In core fields A1 and R, lateral regions, particularly those tune to low frequencies, respond maximally to sounds with the spectrotemporal features that characterize speech (e.g., harmonic structure, formant characteristics, etc.). The preferential activation of low-frequency regions of auditory cortex by CVCs may reflect the critical role played by consonant voicing and vowels in speech discrimination. In contrast, medial belt ACFs may respond maximally to sounds with other complex spectrotemporal features (e.g., broadband non-periodic noise, envelope amplitude modulation, etc.).
Preferential tuning of regions of human auditory cortex to acoustic features that characterize speech might be expected on evolutionary grounds. In bats, another species with a highly specialized vocalization system, neurons in primary auditory cortex are tuned to vocalization-specific acoustic cues (Kanwal and Rauschecker, 2007) that are refined with experience (Razak and Fuzessery, 2010). The auditory system of songbirds is also highly specialized to process conspecific vocalizations and shares functional and developmental properties with human brain regions implicated in speech processing (Bolhuis et al., 2010). In the zebra finch the A1 homologue is preferentially responsive to conspecific vocalizations in comparison with spectrally matched control stimuli (Grace et al., 2003; Hauber et al., 2007).
The hypothesis that lateral regions of core ACFs are specialized to process speech sounds is consistent with a number of studies that have shown that sound with harmonic pitch structure of the sort that characterize vocalizations preferential activate lateral regions of auditory cortex (Warren et al., 2005; von Kriegstein et al., 2007, 2010; Garcia et al., 2010; Overath et al., 2010; Puschmann et al., 2010). Rapid acoustic transients that provide consonant cues also produce enhanced activations in lateral auditory cortex (Rimol et al., 2005; Hutchison et al., 2008; McGettigan et al., 2010).
However, the stimulus preferences gradients seen within A1 and R may also have reflected the smearing of functional properties at ACF boundaries that occurs as a consequence of population averaging (Woods et al., 2009). Because of intersubject and interhemispheric differences in the size and anatomical locations of ACFs, population averaging based on anatomical coordinates will result in a mixture of the functional properties at field boundaries. For example, lateral regions of A1 in one subject may overlap with medial regions of ML in another. As a result, the functional properties of voxels at the A1/ML border will reflect a blending of properties of A1 and ML from different subjects. While stimulus preference gradients in A1 and R would have reflected the blending of stimulus preferences across core and adjacent belt fields, blending is probably not the only explanation for regional variation in stimulus preferences within core fields. If blending were the sole contributor to selectivity gradients within core fields, the sharpest gradients would have been expected in RT, a small core ACF bounded medially by strongly AMNB-preferring RTM and laterally by strongly CVC-preferring RTL. In fact, RTM failed to show a clear gradient in stimulus selectivity.
The Specialization of Medial Belt Fields for Processing AMNBs
Medial belt activations were markedly enhanced to AMNBs. The preference of medial belt fields for AMNBs did not depend upon attention. Thus, medial belt fields preferentially process amplitude-modulated noise that lacks the pitch and formant structure that characterizes speech. AMNB stimuli also revealed functional distinctions among medial belt fields that were not evident in previous studies that used pure tone stimuli (Woods et al., 2010c). For example, RM showed greater contralaterality than other medial belt fields. There was also a posterior to anterior gradient of stimulus preference that was increased in the most anterior medial belt field, RTM. The results confirm suggestions that medial belt fields require acoustically complex stimuli to elucidate their tuning properties (Kusmierek and Rauschecker, 2009).
The Specialization of Lateral Belt and Parabelt Fields for Phonological Processing
Human studies have long implicated the STG and STS in the phonological processing of speech sounds (Obleser et al., 2007; Rauschecker and Scott, 2009; Leaver and Rauschecker, 2010; Turkeltaub and Coslett, 2010). Consistent with previous reports, we found strong response preferences for CVCs in lateral belt fields and parabelt fields. This CVC preference was not dependent on attention: similar CVC preferences were seen for unattended sounds.
Although the largest differences in absolute activation magnitudes were found in AL and ML, ML showed large activations to both CVCs and AMNBs while AL showed a greater CVC preference. Additional analysis of the stimulus preferences of lateral belt fields suggested that CVC-preferences increased further in the more anterior field, RTL. Thus, in both medial belt and lateral belt fields there was an increase in stimulus preferences from posterior to anterior regions of auditory cortex. This is consistent with the what/where dichotomy that has been reported in many studies of auditory cortex (Rauschecker and Scott, 2009), with posterior cortical regions more response to the spatial location of stimuli and anterior regions more sharply tuned for the complex acoustic features that characterize particular stimulus categories. Parabelt fields also showed a strong preference for CVCs, with CVC-preferences that equaled or exceeded those seen in adjacent lateral belt fields. As in lateral belt ACFs, CVC preferences in parabelt fields were not dependent on attention.
Although the experimental design was optimized to detect differences in activation distributions associated with different consonant features, no consistent differences were found as a function of the place or manner of articulation. This contrasts with reports of distinct activation distributions that have been associated with the processing of different vowels (Obleser et al., 2006).
Attention and ACF Stimulus Preferences
Although attention significantly enhanced activation magnitudes in all ACFs, belt ACFs showed greater attentional modulation than core ACFs. Unexpectedly, although stimulus-preferences were clearly evident in SDAs (i.e., medial belt fields preferred AMNBs and lateral belt/parabelt fields preferred CVCs) no stimulus preferences were evident in ARMs: ARMs did not simply reflect the amplification of local sensory processing. Rather, ARM magnitudes to AMNBs and CVCs did not differ significantly in any ACF group. These results suggest that auditory attention in our 1-back triad-matching task engaged a common network of auditory areas regardless of the type of stimuli that are presented.
Hemispheric Specialization for Phonological Processing
Unlike previous studies (Turkeltaub and Coslett, 2010), we found no evidence of hemispheric asymmetries in phonological processing in lateral belt and parabelt fields (cf. Leaver and Rauschecker, 2010). These results contrast with the consistent lateral belt asymmetries (right > left) that are observed in the processing of tone stimuli in pitch discrimination tasks (Woods et al., 2010c) or when discriminating musical sounds (Johnsrude et al., 2000; Zatorre and McGill, 2005; Zatorre et al., 2007). Nevertheless, we did find evidence of small but significant hemisphere asymmetries in primary auditory cortex, even in the absence of attention. Left hemisphere A1 showed a preference for CVCs while right hemisphere A1 showed a preference for AMNBs. This may reflect asymmetries in the acoustic feature preferences of A1 or differences in the thalamo-cortical projections to the two hemispheres (Rademacher et al., 2002).
Conclusion
Population-averaged fMRI activations in human ACFs to CVCs and spectrally matched AMNBs showed a medial-to-lateral stimulus-preference gradient with medial belt fields preferring AMNBs and lateral belt and parabelt fields preferring CVCs. A similar pattern was noted within isofrequency bands of A1 and R, suggesting that even at early cortical stages sound processing is segregated based on sound spectrotemporal features. Within the medial belt and lateral belt there was a posterior-to-anterior preference-specificity gradient with anterior fields showing clearer stimulus preferences. ACF preferences were similar for attended and non-attended sounds suggesting that medial regions of human auditory cortex are tuned to process aspects of environmental sounds whereas lateral regions are tuned to process the spectrotemporal features of vocalizations, even in the absence of attention.
Conflict of Interest Statement
David L. Woods is affiliated with NeuroBehavioral Systems, Inc., the developers of Presentation software that was used to create this experiment.
Acknowledgments
Special thanks to Teemu Rinne and Kimmo Alho for critical reviews of earlier versions of this manuscript.
References
Blumstein, S. E., Myers, E. B., and Rissman, J. (2005). The perception of voice onset time: an fMRI investigation of phonetic category structure. J. Cogn. Neurosci. 17, 1353–1366.
Bolhuis, J. J., Okanoya, K., and Scharff, C. (2010). Twitter evolution: converging mechanisms in birdsong and human speech. Nat. Rev. Neurosci. 11, 747–759.
Dale, A. M., Fischl, B., and Sereno, M. I. (1999). Cortical surface-based analysis. I. Segmentation and surface reconstruction. Neuroimage 9, 179–194.
Desai, R., Liebenthal, E., Possing, E. T., Waldron, E., and Binder, J. R. (2005). Volumetric vs. surface-based alignment for localization of auditory cortex activation. Neuroimage 26, 1019–1029.
Desai, R., Liebenthal, E., Waldron, E., and Binder, J. R. (2008). Left posterior temporal regions are sensitive to auditory categorization. J. Cogn. Neurosci. 20, 1174–1188.
Fischl, B., Sereno, M. I., and Dale, A. M. (1999a). Cortical surface-based analysis. II: inflation, flattening, and a surface-based coordinate system. Neuroimage 9, 195–207.
Fischl, B., Sereno, M. I., Tootell, R. B., and Dale, A. M. (1999b). High-resolution intersubject averaging and a coordinate system for the cortical surface. Hum. Brain Mapp. 8, 272–284.
Flinker, A., Chang, E. F., Barbaro, N. M., Berger, M. S., and Knight, R. T. (2011). Sub-centimeter language organization in the human temporal lobe. Brain Lang. (in press).
Friederici, A. D., Kotz, S. A., Scott, S. K., and Obleser, J. (2010). Disentangling syntax and intelligibility in auditory language comprehension. Hum. Brain Mapp. 31, 448–457.
Friston, K. J., Williams, S., Howard, R., Frackowiak, R. S., and Turner, R. (1996). Movement-related effects in fMRI time-series. Magn. Reson. Med. 35, 346–355.
Fullerton, B. C., and Pandya, D. N. (2007). Architectonic analysis of the auditory-related areas of the superior temporal region in human brain. J. Comp. Neurol. 504, 470–498.
Galaburda, A. M., and Pandya, D. N. (1983). The intrinsic architectonic and connectional organization of the superior temporal region of the rhesus monkey. J. Comp. Neurol. 221, 169–184.
Garcia, D., Hall, D. A., and Plack, C. J. (2010). The effect of stimulus context on pitch representations in the human auditory cortex. Neuroimage 51, 806–816.
Grace, J. A., Amin, N., Singh, N. C., and Theunissen, F. E. (2003). Selectivity for conspecific song in the zebra finch auditory forebrain. J. Neurophysiol. 89, 472–487.
Hackett, T. A. (2008). Anatomical organization of the auditory cortex. J. Am. Acad. Audiol. 19, 774–779.
Hackett, T. A., Preuss, T. M., and Kaas, J. H. (2001). Architectonic identification of the core region in auditory cortex of macaques, chimpanzees, and humans. J. Comp. Neurol. 441, 197–222.
Hauber, M. E., Cassey, P., Woolley, S. M., and Theunissen, F. E. (2007). Neurophysiological response selectivity for conspecific songs over synthetic sounds in the auditory forebrain of non-singing female songbirds. J. Comp. Physiol. A Neuroethol. Sens. Neural. Behav. Physiol. 193, 765–774.
Hutchison, E. R., Blumstein, S. E., and Myers, E. B. (2008). An event-related fMRI investigation of voice-onset time discrimination. Neuroimage 40, 342–352.
Johnsrude, I. S., Penhune, V. B., and Zatorre, R. J. (2000). Functional specificity in the right human auditory cortex for perceiving pitch direction. Brain 123 (Pt 1):155–163.
Kaas, J. H., and Hackett, T. A. (2000). Subdivisions of auditory cortex and processing streams in primates. Proc. Natl. Acad. Sci. U.S.A. 97, 11793–11799.
Kaas, J. H., Hackett, T. A., and Tramo, M. J. (1999). Auditory processing in primate cerebral cortex. Curr. Opin. Neurobiol. 9, 164–170.
Kang, X. J., Bertrand, O., Alho, K., Yund, E. W., Herron, T. J., and Woods, D. L. (2004). Local landmark-based mapping of human auditory cortex. Neuroimage 22, 1657–1670.
Kang, X. J., Yund, E. W., Herron, T. J., and Woods, D. L. (2007). Improving the resolution of functional brain imaging: analyzing functional data in anatomical space. Magn. Reson. Imaging 25, 1070–1078.
Kanwal, J. S., and Rauschecker, J. P. (2007). Auditory cortex of bats and primates: managing species-specific calls for social communication. Front. Biosci. 12, 4621–4640.
Kusmierek, P., and Rauschecker, J. P. (2009). Functional specialization of medial auditory belt cortex in the alert rhesus monkey. J. Neurophysiol. 102, 1606–1622.
Leaver, A. M., and Rauschecker, J. P. (2010). Cortical representation of natural complex sounds: effects of acoustic features and auditory object category. J. Neurosci. 30, 7604–7612.
Leff, A. P., Iverson, P., Schofield, T. M., Kilner, J. M., Crinion, J. T., Friston, K. J., and Price, C. J. (2009). Vowel-specific mismatch responses in the anterior superior temporal gyrus: an fMRI study. Cortex 45, 517–526.
Lehmann, C., Herdener, M., Schneider, P., Federspiel, A., Bach, D. R., Esposito, F., di Salle, F., Scheffler, K., Kretz, R., Dierks, T., and Seifritz, E. (2007). Dissociated lateralization of transient and sustained blood oxygen level-dependent signal components in human primary auditory cortex. Neuroimage 34, 1637–1642.
Liebenthal, E., Binder, J. R., Spitzer, S. M., Possing, E. T., and Medler, D. A. (2005). Neural substrates of phonemic perception. Cereb. Cortex 15, 1621–1631.
Liebenthal, E., Desai, R., Ellingson, M. M., Ramachandran, B., Desai, A., and Binder, J. R. (2010). Specialization along the left superior temporal sulcus for auditory categorization. Cereb. Cortex 20, 2958–2970.
Lillywhite, L. M., Saling, M. M., Demutska, A., Masterton, R., Farquharson, S., and Jackson, G. D. (2010). The neural architecture of discourse compression. Neuropsychologia 48, 873–879.
Marchini, J. L., and Ripley, B. D. (2000). A new statistical approach to detecting significant activation in functional MRI. Neuroimage 12, 366–380.
McGettigan, C., Warren, J. E., Eisner, F., Marshall, C. R., Shanmugalingam, P., and Scott, S. K. (2010). Neural correlates of sublexical processing in phonological working memory. J. Cogn. Neurosci. 23, 961–977.
Morosan, P., Schleicher, A., Amunts, K., and Zilles, K. (2005). Multimodal architectonic mapping of human superior temporal gyrus. Anat. Embryol. 210, 401–406.
Obleser, J., Boecker, H., Drzezga, A., Haslinger, B., Hennenlotter, A., Roettinger, M., Eulitz, C., and Rauschecker, J. P. (2006). Vowel sound extraction in anterior superior temporal cortex. Hum. Brain Mapp. 27, 562–571.
Obleser, J., Zimmermann, J., Van Meter, J., and Rauschecker, J. P. (2007). Multiple stages of auditory speech perception reflected in event-related FMRI. Cereb. Cortex 17, 2251–2257.
Overath, T., Kumar, S., Stewart, L., von Kriegstein, K., Cusack, R., Rees, A., and Griffiths, T. D. (2010). Cortical mechanisms for the segregation and representation of acoustic textures. J. Neurosci. 30, 2070–2076.
Petkov, C. I., Kang, X., Alho, K., Bertrand, O., Yund, E. W., and Woods, D. L. (2004). Attentional modulation of human auditory cortex. Nat. Neurosci. 7, 658–663.
Petkov, C. I., Kayser, C., Augath, M., and Logothetis, N. K. (2006). Functional imaging reveals numerous fields in the monkey auditory cortex. PLoS Biol. 4, e215. doi: 10.1371/journal.pbio.0040215
Petkov, C. I., Kayser, C., Steudel, T., Whittingstall, K., Augath, M., and Logothetis, N. K. (2008). A voice region in the monkey brain. Nat. Neurosci. 11, 367–374.
Puschmann, S., Uppenkamp, S., Kollmeier, B., and Thiel, C. M. (2010). Dichotic pitch activates pitch processing centre in Heschl’s gyrus. Neuroimage 49, 1641–1649.
Rademacher, J., Burgel, U., and Zilles, K. (2002). Stereotaxic localization, intersubject variability, and interhemispheric differences of the human auditory thalamocortical system. Neuroimage 17, 142–160.
Rauschecker, J. P. (1998). Cortical processing of complex sounds. Curr. Opin. Neurobiol. 8, 516–521.
Rauschecker, J. P., and Scott, S. K. (2009). Maps and streams in the auditory cortex: nonhuman primates illuminate human speech processing. Nat. Neurosci. 12, 718–724.
Rauschecker, J. P., and Tian, B. (2000). Mechanisms and streams for processing of “what” and “where” in auditory cortex. Proc. Natl. Acad. Sci. U.S.A. 97, 11800–11806.
Rauschecker, J. P., Tian, B., and Hauser, M. (1995). Processing of complex sounds in the macaque nonprimary auditory cortex. Science 268, 111–114.
Razak, K. A., and Fuzessery, Z. M. (2010). Experience-dependent development of vocalization selectivity in the auditory cortex. J. Acoust. Soc. Am. 128, 1446–1451.
Recanzone, G. H., and Sutter, M. L. (2008). The biological basis of audition. Annu. Rev. Psychol. 59, 119–142.
Remedios, R., Logothetis, N. K., and Kayser, C. (2009). An auditory region in the primate insular cortex responding preferentially to vocal communication sounds. J. Neurosci. 29, 1034–1045.
Rimol, L. M., Specht, K., Weis, S., Savoy, R., and Hugdahl, K. (2005). Processing of sub-syllabic speech units in the posterior temporal lobe: an fMRI study. Neuroimage 26, 1059–1067.
Rinne, T., Balk, M. H., Koistinen, S., Autti, T., Alho, K., and Sams, M. (2008). Auditory selective attention modulates activation of human inferior colliculus. J. Neurophysiol. 100, 3323–3327.
Sabri, M., Binder, J. R., Desai, R., Medler, D. A., Leitl, M. D., and Liebenthal, E. (2008). Attentional and linguistic interactions in speech perception. Neuroimage 39, 1444–1456.
Skipper, J. I., Goldin-Meadow, S., Nusbaum, H. C., and Small, S. L. (2007). Speech-associated gestures, Broca’s area, and the human mirror system. Brain Lang. 101, 260–277.
Taglialatela, J. P., Russell, J. L., Schaeffer, J. A., and Hopkins, W. D. (2009). Visualizing vocal perception in the chimpanzee brain. Cereb. Cortex 19, 1151–1157.
Tian, B., Reser, D., Durham, A., Kustov, A., and Rauschecker, J. P. (2001). Functional specialization in rhesus monkey auditory cortex. Science 292, 290–293.
Turkeltaub, P. E., and Coslett, H. B. (2010). Localization of sublexical speech perception components. Brain Lang. 114, 1–15.
Viceic, D., Campos, R., Fornari, E., Spierer, L., Meuli, R., Clarke, S., and Thiran, J. P. (2009). Local landmark-based registration for fMRI group studies of nonprimary auditory cortex. Neuroimage 44, 145–153.
von Kriegstein, K., Smith, D. R., Patterson, R. D., Ives, D. T., and Griffiths, T. D. (2007). Neural representation of auditory size in the human voice and in sounds from other resonant sources. Curr. Biol. 17, 1123–1128.
von Kriegstein, K., Smith, D. R., Patterson, R. D., Kiebel, S. J., and Griffiths, T. D. (2010). How the human brain recognizes speech in the context of changing speakers. J. Neurosci. 30, 629–638.
Warren, J. D., Jennings, A. R., and Griffiths, T. D. (2005). Analysis of the spectral envelope of sounds by the human brain. Neuroimage 24, 1052–1057.
Weisskoff, R. M. (2000). “Theoretical models of BOLD signal change,” in Functional MRI, eds C. W. Moonen and P. Bandettini (Berlin: Springer), 115–123.
Woods, D. L., Stecker, G. C., Rinne, T., Herron, T. J., Cate, A. D., Yund, E. W., Liao, I., and Kang, X. (2009). Functional maps of human auditory cortex: effects of acoustic features and attention. PLoS ONE 4, e5183. doi: 10.1371/journal.pone.0005183
Woods, D. L., Yund, E. W., and Herron, T. J. (2010a). Measuring consonant identification in nonsense syllables, words, and sentences. J. Rehabil. Res. Dev. 47, 243–260.
Woods, D. L., Yund, E. W., Herron, T. J., and Cruadhlaoich, M. A. (2010b). Consonant identification in consonant-vowel-consonant syllables in speech-spectrum noise. J. Acoust. Soc. Am. 127, 1609–1623.
Woods, D. L., Herron, T. J., Cate, A. D., Yund, E. W., Stecker, G. C., Rinne, T., and Kang, X. J. (2010c). Functional properties of human auditory cortical fields. Front. Neurosci. 4:155. doi: 10.3389/fnsys.2010.00155
Zatorre, R. J., Chen, J. L., and Penhune, V. B. (2007). When the brain plays music: auditory-motor interactions in music perception and production. Nat. Rev. Neurosci. 8, 547–558.
Zevin, J. D., Yang, J., Skipper, J. I., and McCandliss, B. D. (2010). Domain general change detection accounts for “dishabituation” effects in temporal-parietal regions in functional magnetic resonance imaging studies of speech perception. J. Neurosci. 30, 1110–1117.
Keywords: fMRI, phonemes, auditory cortex, selective attention, asymmetry, consonant, primary auditory cortex, speech
Citation: Woods DL, Herron TJ, Cate AD, Kang X and Yund EW (2011) Phonological processing in human auditory cortical fields. Front. Hum. Neurosci. 5:42. doi: 10.3389/fnhum.2011.00042
Received: 22 December 2010;
Accepted: 01 April 2011;
Published online: 20 April 2011.
Edited by:
Srikantan S. Nagarajan, University of California San Francisco, USAReviewed by:
Frederic Dick, University of California San Francisco, USAShozo Tobimatsu, Kyushu University, Japan
Russell A. Poldrack, University of California, USA
Copyright: © 2011 Woods, Herron, Cate, Kang and Yund. This is an open-access article subject to a non-exclusive license between the authors and Frontiers Media SA, which permits use, distribution and reproduction in other forums, provided the original authors and source are credited and other Frontiers conditions are complied with.
*Correspondence: David L. Woods, Neurology Service (127E), Department of Veterans Affairs Northern California Health Care System, 150 Muir Road, Martinez, CA 94553, USA. e-mail: dlwoods@ucdavis.edu