Rational decision-making in inhibitory control
- Department of Cognitive Science, University of California, San Diego, La Jolla, CA, USA
An important aspect of cognitive flexibility is inhibitory control, the ability to dynamically modify or cancel planned actions in response to changes in the sensory environment or task demands. We formulate a probabilistic, rational decision-making framework for inhibitory control in the stop signal paradigm. Our model posits that subjects maintain a Bayes-optimal, continually updated representation of sensory inputs, and repeatedly assess the relative value of stopping and going on a fine temporal scale, in order to make an optimal decision on when and whether to go on each trial. We further posit that they implement this continual evaluation with respect to a global objective function capturing the various reward and penalties associated with different behavioral outcomes, such as speed and accuracy, or the relative costs of stop errors and go errors. We demonstrate that our rational decision-making model naturally gives rise to basic behavioral characteristics consistently observed for this paradigm, as well as more subtle effects due to contextual factors such as reward contingencies or motivational factors. Furthermore, we show that the classical race model can be seen as a computationally simpler, perhaps neurally plausible, approximation to optimal decision-making. This conceptual link allows us to predict how the parameters of the race model, such as the stopping latency, should change with task parameters and individual experiences/ability.
1 Introduction
Humans and animals often need to choose among actions with uncertain consequences, and to modify those choices according to ongoing sensory information and changing task demands. The requisite ability to dynamically modify or cancel planned actions is termed inhibitory control, considered a fundamental component of flexible cognitive control (Barkley, 1997; Nigg, 2000). In this paper, we examine optimal inhibitory control in the context of the widely studied stop signal paradigm (Logan and Cowan, 1984), where the subject’s go response on a primary task, such as a two-alternative forced choice discrimination task, is interrupted by a stop signal on some trials. Subjects are instructed to withhold the go response on stop trials: a successful response cancelation is a stop success (SS), whereas a response is considered a stop error (SE, see Figure 1). Typically, SE rate increases as the presentation time of the stop signal is delayed with respect to the go stimulus onset, in a characteristic pattern known as the inhibition function (e.g., Figure 5A, adapted from Emeric et al., 2007). More subtly, SE reaction time (RT) tends to be faster than go RT (e.g., Figure 5C, adapted from Emeric et al., 2007).
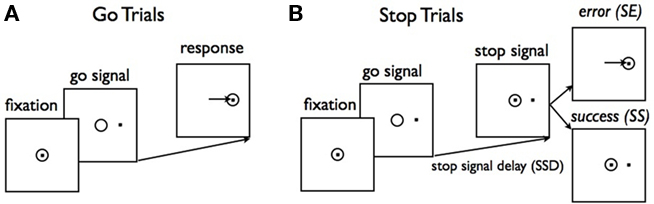
Figure 1. Schematic illustration of a saccadic version of the stop signal task. (A) On a majority of trials (go trials), a central fixation dot is followed by one of two targets requiring a saccade to the indicated location. (B) On stop trials, the target presentation is followed after a short delay (SSD) by reappearance of the fixation point. A saccade on a stop trial is a stop error (SE), and a successfully canceled movement is a stop success (SS). Figure adapted from Hanes and Schall (1995).
The classical model for the stop signal task is the race model (Logan and Cowan, 1984), where behavioral outcome on each trial is conjectured to arise from the competition of two independent processes: go and stop. In this model, a stop trial results in error if the go process finishes before the stop process (Figure 2A). Thus, the average stopping latency, called stop signal reaction time (SSRT) by the race model, determines how successfully the observer can interrupt the go process. Since the stop process and its outcomes are unobservable, SSRT is estimated from the observed go RT distribution and the error rate on stop trials at a given stop signal delay (SSD). Specifically, if SSRT is constant, and the go and stop processes are independent, then the SE rate at a given SSD corresponds to the fraction of go RT distribution cut off by SSD + SSRT (the dark shaded region in Figure 2A). Conversely, given the SE rate for a particular SSD, SSRT can be estimated by subtracting SSD from the appropriate percentile of go RTs. Subject-specific SSRT is typically estimated by averaging the SSRT estimates from different SSDs, or simply taken as the SSRT best explaining the SSD giving rise to 50% error rate on stop strials. Consistent with the interpretation that SSRT measures some aspect of inhibitory ability, SSRT has been measured as longer in populations with presumed inhibitory deficits, such as attention-deficit hyperactivity disorder (Alderson et al., 2007), substance abuse (Nigg et al., 2006), and obsessive-compulsive disorder (Menzies et al., 2007). Although the race model yields an elegantly simple description of classical behavioral data, it does not address how different cognitive processes contribute to stopping behavior, thereby precluding the possibility of predicting how experimental manipulations of different cognitive factors, such as reward and context, should affect stopping behavior. Relatedly, it cannot readily differentiate the underlying cognitive deficits seen in the various clinical populations.
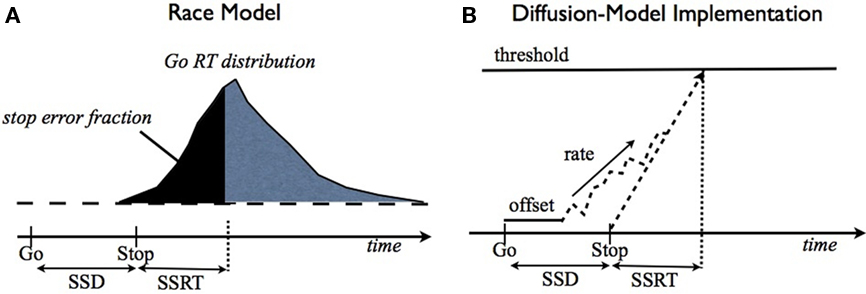
Figure 2. Race model and drift-diffusion model for the stop signal task. (A) The race model (Logan and Cowan, 1984) proposes that the finishing times of two independent (go and stop) processes determine trial outcome: stop or go, depending on which finishes first. SSD + SSRT (stop signal reaction time) specifies the finishing time of the stop process, and determines what fraction of go trials will finish earlier and therefore result in a stop error. (B) An implementation of the race model using a drift-diffusion process, similar to (Verbruggen and Logan, 2009b). The go process consisting of a constant drift rate corrupted by additive Wiener (Gaussian, white) noise on each time step, a temporal offset (also known as the non-decision time), and a threshold for evoking the go response. The stop process is assumed to initiate at a time SSD after the go stimulus, and to take a time of SSRT (assumed to be fixed here) to reach the threshold. Whichever process finishes first determines trial outcome: go or stop.
We present a rational decision-making framework for inhibitory control in the stop signal task. In our framework, sensory processing and action choice are optimized relative to a quantitative, global behavioral objective function that takes into account the costs associated with go errors, stop errors, and response delay. Classical behavioral results in the stop signal task are shown to be natural consequences of rational decision-making in the task. Moreover, the model can quantitatively predict changes in stopping behavior as a consequence of manipulations in task demands such as reward contingencies (Leotti and Wager, 2009). We show that a drift-diffusion model implementation of the race model (e.g., Verbruggen and Logan, 2009b) can be seen as a simpler approximation to optimal decision-making, whereby parameters of the race model, such as the SSRT, must vary with task parameters in a systematic way to maintain the best approximation to optimal decision-making. Thus, race model-like behavior, including the well-studied SSRT, can be understood as emergent properties of rational decision-making. Altogether, our results suggest that cognitive control plays a critical role in stopping behavior, and the brain implements optimal or near-optimal decision-making, possibly via a race-model-like process, in an adaptive and context-dependent manner.
2 Methods
Our computational model consists of two main components: (1) a monitoring process, which models sensory inference and learning about the identity, prevalence, and timing of the stimuli as hierarchical Bayesian inference, and (2) a decision process, formalized in terms of stochastic control theory, that translates the current expectations based on sensory evidence into a choice of action. In our model, the available actions at any given time include the two possible go responses and waiting one more time step. Repeated selection of the wait option results in a stop response on a given trial. Consistent with typical experimental design, the model assumes that subjects are given a deadline for responding, and that they must withhold the go response for the same amount of time to indicate a stop response.
2.1 The Monitoring Process: Bayesian Statistical Inference
The monitoring process in our model tracks sensory information about the go and stop stimuli during each trial, integrating it with prior belief about the distribution of go stimulus identity, and the prevalence and timing of the stop signal. Figure 3 shows the generative model for sensory evidence in the task. The model assumes that subjects believe there are two hidden variables, corresponding to the identity of the go stimulus (d = {0,1}), and whether or not the current trial is a stop trial (s = 1 for stop, s = 0 for go). Priors over d and s reflect experimental parameters: P(d = 1) = 0.5, P(s = 1) = r = 0.25, where r is the prior probability that a trial is a stop trial. Conditioned on d, a stream of independent and identical (iid) inputs are generated on each trial, x1,…,xt… where t indexes time within a trial from go signal onset, and the likelihood functions are p(xt|d = 0) = f0(xt) and p(xt|d = 1) = f1(xt). Without loss of generality, we assume f0 and f1 to be Bernoulli distributions with rate parameters qd and 1 − qd, respectively. The dynamic variable zt denotes the presence/absence of the stop signal: if the stop signal appears at time θ then z1 = … = zθ− 1 = 0 and zθ = … = 1. On a go trial, s = 0, the stop signal of course never appears, P(θ = ∞) = 1. On a stop trial, s = 1, we assume that the onset of the stop signal has a constant hazard rate, i.e., θ is generated from a geometric distribution: p(θ|s = 1) = (1 − λ)θ − 1λ. Conditioned on zt, there is a second, conditionally independent, stream of observations associated with the stop signal: p(yt|zt = 0) = g0(yt), and p(yt|zt = 1) = g1(yt). Again, we assume for simplicity that g0 and g1 are Bernoulli distributions with rate parameters qs and 1 − qs, respectively.
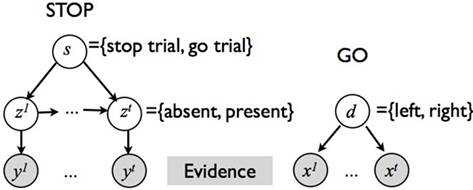
Figure 3. Graphical model for sensory input generation in our Bayesian model. Two separate streams of observations, {x1,…,xt,…} and {y1,…,yt,…}, are associated with the go and stop stimuli, respectively. xt depend on the identity of the target, d∈{0,1}. yt depends on whether the current trial is a stop trial, s = {0,1}, and whether the stop signal has already appeared by time t,zt∈{0,1}.
The counterpart to the generative model is the recognition model, which specifies statistically optimal reverse-inference of the hidden variables based on the continual stream of sensory inputs. In the stop signal task, this means computing the posterior probability about go stimulus identity,  and the stop signal presence,
  where
where  denotes all the sensory inputs associated with the go stimulus, and
  denotes all the sensory inputs associated with the stop signal observed so far. Note that
  , and
, and 
The computation of  is a simple application of Bayes’ rule:
Inference about the stop signal is slightly more complicated due to the hidden dynamics in zt (going from signal-absent to signal-present at a stochastic onset time). We first compute  , the posterior probability that the stop signal has already appeared.
where  (stop signal never occurs at the same time as the go signal), and h(t) is the conditional probability that the stop signal will appear in the next instant given it has not appeared already,
  :
:
where, recall, r is the prior probability of a stop trial. h(t) does not depend on the observations, since given that the stop signal has not yet appeared, whether it will appear in the next instant does not depend on previous observations.
In the stop signal task, a stop trial is typically considered a stop trial even if the subject makes the go response before the stop signal. Following this experimental convention, we need to compute the posterior probability that the current trial is a stop trial, denoted  , which depends both on the current belief about the presence of the stop signal, and the expectation that it will appear in the future:

where P(s = 1|θ > t, y t) = P(s = 1|θ > t) again does not depend on past observations:
The belief state at time t, the vector  , represents all the information the ideal observer has about the stimulus properties on the current trial.
Figure 4A illustrates the behavior of this inference procedure, averaged across trials, for different types of trials. The evolution of the beliefs corresponding to the identity of the go stimulus (pd), and whether the trial is a stop trial (ps), are shown on trials without a stop signal (GO), as well as successful (SS) and error (SE) stop trials; in all examples, true d = 1. Over time, pd increases in all three kinds of trials as sensory evidence about the go stimulus accumulates. On the other hand, ps shows an initial rise due to prior expectation and then either decays to 0 on GO trials, or rises toward 1 on stop trials. Individual trajectories are stochastic due to noise in the sensory inputs. This stochasticity induces a go response on some stop trials and not others: stop error trials (non-canceled trials) are those on which the go stimulus belief state happens to be rising fast, and the stop signal is processed slower than average. Successful stop trials show the opposite trend.
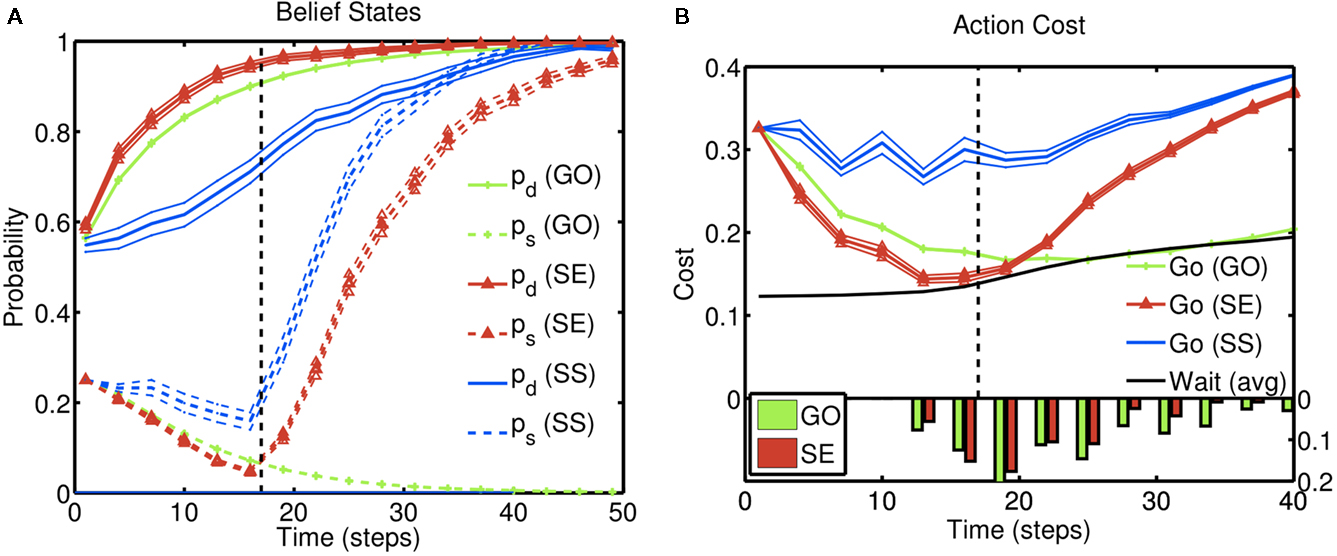
Figure 4. Inference and action selection in the stop signal task. (A) Evolution of the belief state over time, on go trials (green), successful stop trials (SS; blue), and error stop trials (SE; red). Solid lines represent the posterior probabilities assigned to the true identity of the go stimulus (one of two possibilities) for the three types of trials – they all rise steadily toward the value 1, as sensory evidence accumulates. The dashed black vertical line represents the onset of the stop signal on stop trials. The probability of a stop signal being present (dashed lines) rises initially in a manner dependent upon prior expectations of frequency and timing of the stop signal, and subsequently rises farther toward the value 1 (stop trials), or drops to 0 (go trials), based on sensory evidence. (B) Average action costs corresponding to going ( ,see text) and waiting (
 , see text), using the same sets of trials as (A). The black dashed vertical line denotes the onset of the stop signal. A response is initiated when the cost of going drops below the cost of waiting. The RT histograms for go and error stop trials (bottom) indicate the temporal distribution of when the go cost crosses the stop cost in each simulated trial. Each data point is an average of 10,000 simulated trials. Error bar = SEM. Simulation parameters: qd = 0.68, qs = 0.72, λ = 0.2, r = 0.25, D = 50, cs = 0.2, cs = 0.004. See section 2 for definition of parameters. Unless otherwise specified, these parameters were used in all subsequent simulations.
2.2 The Decision Process: Optimal Stochastic Control
Based on the belief state, subjects have to make a decision at each moment about whether to go now or wait at least one more time point in case this is a stop trial; and if they wait, they need to make the same decision again using one more data point. To model this decision process, we again assume an ideal observer implementing a Bayes-optimal decision policy. To say what is optimal, we need to specify a loss function that captures the reward structure of the task, against which the decision policy can be optimized. We assume there is a time cost of c per unit time on each trial to capture the opportunity cost of not responding quickly. Consistent with experimental design, we also assume a deadline D for responding on go trials and for determining a subject has withheld a go response long enough on a stop trial. In addition, there is a penalty cs for choosing to respond on a stop signal trial, and a unit cost for making an error on a go trial (by choosing the wrong discrimination response or exceeding the deadline for responding). Because only the relative costs matter in the optimization, we can normalize the coefficients associated with all the costs such that one of them is unit cost. Let τ denote the trial termination time, so that τ = D if no go response is made before the deadline, and τ < D if a response is made. On each trial, the policy π produces a response time τ ≤ D, as well as a binary response δ ∈ {0,1} if a go response is made (τ < D). The loss function is:

where 1{·} is the indicator function, evaluating to 1 if the conditions in {·} are met, and 0 otherwise. The optimal decision policy minimizes the average or expected loss,  ,
,
Minimizing Lπ over the policy space directly can seem computationally daunting, since there is no obvious parameterization of the policy space; however, Bellman’s dynamic programming principle (Bellman, 1952) provides an iterative relationship in terms of the value function (defined in terms of costs here), Vt(bt)

where  is the belief state, and a ranges over all possible actions.
In our model, the action (decision) space consists of {go,wait}, with the corresponding expected costs (also known as Q-factors),  and
and  , respectively. Note that our model produces a “stop” response on a trial by repeatedly deciding to wait rather than go until the deadline is reached.


The optimal decision policy chooses the action corresponding to the smaller Q-factor, and the value function is the smaller of the Q-factors  and
and  Note that the go action results in either δ = 1 or δ = 0, depending on whether
  is greater or smaller than 0.5, respectively. The dependence of
  on Vt + 1 allows us to recursively compute the value function backward in time. Given Vt + 1 and bt, we can compute 〈Vt + 1〉 by summing over the uncertainty about the next observations xt + 1, yt + 1, since the belief state bt + 1 is a deterministic function of bt and the observations (Eqs 1 and 4).
The initial condition of the value function can be computed exactly at the deadline since there is only one outcome (subject is no longer allowed to go or stop):  We can then compute
  and the corresponding optimal decision policy backward in time from t = D − 1 to t = 1. In our simulations, we do so numerically by discretizing the probability space for
  into 1000 bins;
  is represented exactly using its sufficient statistics.
Figure 4B illustrates how these action costs evolve over the course of a trial, averaged across trials of different types as before: go (GO) trials, stop error (SE) trials, and successful stop (SS) trials. Since the probability associated with the (correct) go stimulus identity increases with accumulating sensory evidence, the cost of going drops, eventually crossing the cost of waiting and triggering a go response. On stop trials, the onset of the stop signal initiates an increase in the cost of going, when the cost of a stop error is factored in. In error stop trials, the go cost ( ) crosses the wait cost (
 ) before the stop stimulus is fully processed. In successful stop trials, the go cost never dips below the wait cost. The RT histograms for go and error stop trials illustrate that, although the average go cost trajectories do not cross the average wait cost, every individual trajectory crosses over at some point on each trial.
2.3 Approximating Optimal Decision-Making by a Race Model
We make the relationship between optimal decision-making and race-like behavior concrete by considering a specific implementation of the race model. One reason for examining this connection is that race-like processes may serve as a neural implementation of behavior in the stopping task (Hanes et al., 1998; Pare and Hanes, 2003; Boucher et al., 2007). In particular, we examine a diffusion model implementation which has long been used to model reaction times (Stone, 1960; Laming, 1968; Ratcliff, 1978; Luce, 1986; Hanes and Schall, 1996; Gold and Shadlen, 2002; Mazurek et al., 2003; Bogacz et al., 2006). Variants of the drift diffusion model have also been applied specifically to the stop signal task (Hanes and Carpenter, 1999; Verbruggen and Logan, 2009b).
Our implementation is illustrated in Figure 2B, where the go process consists of a constant drift rate with a starting point or offset, and additive, cumulative Gaussian noise on each time step of a trial. The stop process is modeled as a fixed-latency process with a corresponding latency parameter (SSRT). Although we could easily consider a stochastic stop process with its attendant rate and threshold, we specifically wish to model SSRT as measured in practice, i.e., by using a constant-SSRT assumption (Logan and Cowan, 1984). Finally, go responses are initiated by the process crossing a threshold, unless it is at a time exceeding SSD + SSRT, which is the finishing time of the stop process – in the latter case, no response is produced. For each condition in the reward manipulation task (Section 3.2), we select values for these four parameters, rate, offset, threshold, and SSRT, in order to best approximate the cumulative RT and stop error distributions of the optimal model.
The basic drift-diffusion model has the following form:

where the rate parameter β determines the direction (positive or negative) and speed of the average movement of the dynamic parameter κ, and dW denotes Wiener noise, such that ε dW is normally distributed with mean 0 and variance ε2dt. In practice, we simulate this process by discretizing time and approximating it with a random-walk:

with drift parameter β, and normally distributed noise w ∼ 𝒩(0, σ2). We assume that a decision is made when k(τ) first crosses the threshold h or −h, whichever first. The simulated RT for a trial is τ + τ0, where τ0 is a temporal offset parameter denoting non-decision time (Ratcliff, 1978; Bogacz et al., 2006). For β > 0, the response is correct if h is first crossed, and incorrect if −h is first crossed; vice versa if β < 0. We note that there is redundancy in the parameterization, such that β, σ, and h can all be scaled by the same constant and remain an identical process; we can therefore fix σ = 1 without loss of generality. Thus, the go process has three free parameters: β, h, and τ0.
The stop process, as typically modeled in the literature, (Logan and Cowan, 1984), is assumed to have a fixed finishing time of SSD + SSRT. Since SSD is given by experimental design, SSRT is the only free parameter for the stop process. On stop trials, if τ + τ0 < SSD + SSRT, an error response occurs at τ + τ0; otherwise, it is a correct stop trial and τ is assumed to take on the value ∞.
Our goal is to find a diffusion model approximation to optimal decision-making. To do this, we compare the joint distribution of RT and choice based on simulation of the optimal model, p(τ,δ), and that from a parametrization of the race model p(τ,δ|θ). We look for settings of the diffusion model parameters  that would minimize the KL divergence between the two distributions:
where the approximation comes from the fact that the expectation of the log likelihood ratio 〈logp(τ,δ)/p(τ,δ|θ)〉 under the distribution p(τ,δ) can be approximated by a finite sum based on samples from p(τ,δ) – the approximation becomes exact as n → ∞. We note the interesting observation that minimizing the KL divergence is identical to minimizing the coding cost of the samples from the true (optimal) distribution by the approximate diffusion model distributions; it is also identical to maximum likelihood estimation of parameters of the approximate model as a function of the samples generated from the true (optimal) model.
To evaluate the sum, we generate n = 10,000 samples from the optimal model:  where the probability of each trial being a stop trial is r, and the probability of the go stimulus being each of the two alternatives is 0.5, both given by the actual experimental design in question. We can compute p(τ,δ|θ) exactly, up to a discretization of values of k(t), by convolving p(k(t)) with standard-normal noise and removing probability mass beyond both thresholds at the next timestep, to get p(k(t + 1)). This gives p(τ,δ|θ) on go trials. On stop trials, we truncate the distribution at SSD + SSRT, which then gives us both the error stop trial RT distribution, as well as the error rate, for each SSD. We then sum the log likelihood of each sample (τi,δi) under p(τ,δ|θ) over all 10,000 samples. We do so for each setting of the diffusion model parameters θ, and use Matlab’s fmincon function to find the best-fitting parameters.
3 Results
3.1 Stopping Behavior as a Natural Consequence of Rational Decision-making
In the stop signal task, subjects typically make more stop errors when the stop signal delay (SSD) is longer, and response times on stop error trials are on average faster than go RTs (Logan and Cowan, 1984; Hanes and Schall, 1995; also see Verbruggen and Logan, 2009a for a recent review). Figure 5 shows how this behavior arises naturally as a consequence of rational decision-making in the task. Data from human subjects performing a saccade version of the stop signal task (Emeric et al., 2007; Figures 5A,C), and from model simulations (Figures 5B,D), show the same characteristics: error rate increases as SSD increases, and RTs on stop error trials are on average faster than go trials.
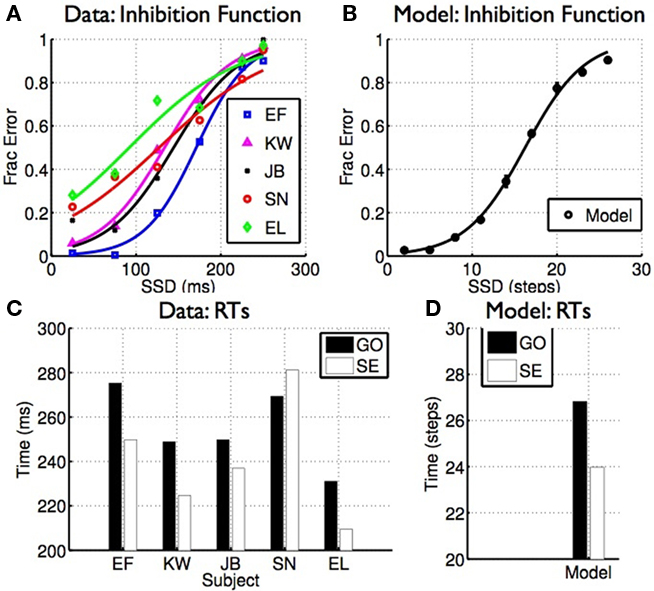
Figure 5. Classical properties of stopping behavior arise naturally from optimal decision-making. (A) Inhibition function: errors on stop trials increase as a function of SSD. (B) Similar inhibition function seen for the model. (C) Discrimination RT is generally faster on stop error trials than go trials. (D) Similar results seen in the model. (A,C) Data adapted from Emeric et al. (2007)with permission from Elsevier.
Intuitively, the later the stop signal, the more likely that the cost of going has already dropped below the cost of waiting before the stop signal information can be factored in (see Figure 4B), leading to the increasing SE curve or inhibition function shown here. Faster RT on SE trials is an outcome of stochasticity in the processing of the go and stop signals; as shown in Figures 4A,B, stop error trials are those in which the go stimulus is processed faster than average (and the stop stimulus slower than average). This difference gives rise to the observed faster RT, illustrated by the histograms in Figure 4B.
The race model explains these results as well, utilizing a similar proximate explanation: later initiation of the stop process allows more go trials to “escape,” giving rise to the form of the inhibition function; stochasticity in the go process allows the go process to sometimes escape the stop process, and those that do happen to escape have shorter finishing times (Logan and Cowan, 1984). A critical difference is that by focusing on the finishing times of the stop and go processes, but not their underlying computational import, the race model cannot predict a priori the effect of changes in experimental constraints on stopping behavior. We elaborate further on this contrast by considering the effect of reward manipulations on stopping behavior.
3.2 Influence of Reward Structure on Stopping
Leotti and Wager (2009) showed that subjects can be biased toward stopping or going by experimentally manipulating the relative penalties associated with go and stop errors. Their experiments associated a reward for fast go response times and penalty for stop errors, and manipulated these values in an iterative fashion to induce a particular degree of bias in each subject, as measured by the fraction of stop errors committed. Figures 6A,B shows that as subjects are biased toward stopping, they make fewer stop errors and have slower go responses. Since our model explicitly parametrizes the relative costs of go and stop errors (cs in Eq. 6), we can easily simulate such a manipulation by setting cs to a higher or lower value in Eq. 6. The new cost function induces different statistics in the trajectories of the action costs as in Figure 4B. In particular, making cs larger makes expected go cost higher, as the same probability of a stop trial lead to a greater stop error cost, and this has the effect of slowing the initial downward trajectory of the go cost curve, and speed its repulsion away from the wait cost if later the stop signal is introduced – the over all effect, is to slow down go reaction times and lower stop error frequency. Simulation results from the optimal model (Figures 6D,E filled) confirm these intuitions and are similar to subjects’ actual behavior (top row).
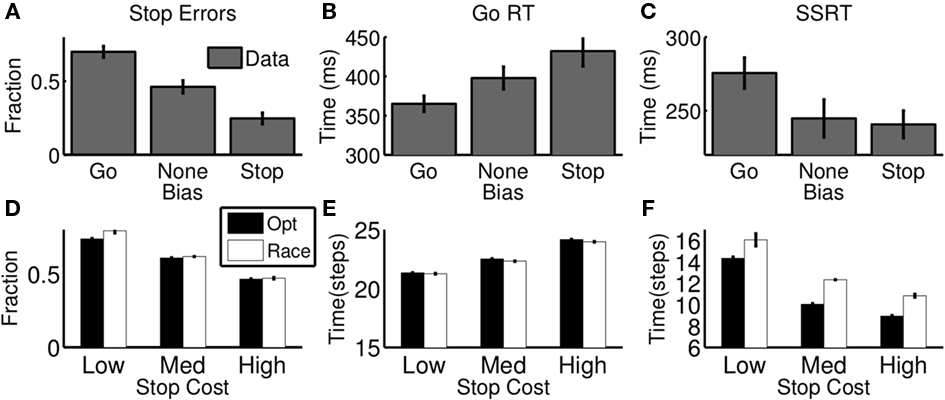
Figure 6. Effect of reward manipulation on stopping behavior. (A–C) Data from human subjects performing a variant of the stop signal task where the ratio of rewards for quick go responses and successful stopping was varied, inducing a bias toward going or stopping (adapted from Leotti and Wager, 2009with permission from APA). As stop errors are punished more severely, subjects have lower stop error rate (A), slower go RT (B), and faster SSRT (C); low stop error penalty induces the opposite pattern. (D–F) The optimal decision model (black) and its best-fitting race model approximation (white) show similar trends as a function of stop error penalty (relative to go errors). “High,” “Med,” “Low” refer to high (cs = 0.5, medium (cs = 0.25), and low (cs = 0.15) stop error penalty, respectively. For model simulations (D-F), each bar denotes average of 10 simulated “sessions,” each session consisting of 10,000 trials. Error bar = SEM.
Also shown in Figures 6C,F is the measure of stopping latency (SSRT) assumed by the race model, for human behavior and for the optimal model. Since the race model’s conjectured stop process is not observable, the SSRT must be inferred from the go RT distribution and the stop error distribution. In particular, if going and stopping are assumed independent, and the SSRT is approximated as constant, then the difference between the midpoints of the RT and stop error cumulative distribution functions is an estimate of the SSRT (Logan and Cowan, 1984). Note, however, that when this estimation process is applied to human data in the experiment, the SSRT changes with reward manipulation (Figure 6C), and therefore cannot be used in isolation as a subject-specific index of inhibition. Although SSRT is not an explicit component of our framework, nevertheless the same procedure outlined above can be used to estimate it for our model simulations, yielding the very same trend (Figure 6F, filled). The close match with human behavior suggests that SSRT is an emergent property of the interaction between going and stopping, and variations in SSRT are directly explained by optimal adjustments to the tradeoff between them.
3.3 Race Model and SSRT as Emergent Properties of Optimal Behavior
We examine the relationship between the race model and optimal behavior by fitting a diffusion model implementation of the race model to output from the optimal model (Figure 2B, see section 2 for details). We examined how parameters of the best-fitting diffusion model vary as the reward structure of the task is manipulated (i.e., cs takes on different values). The best-fitting parameters are shown in Figure 7, and indicate that the SSRT parameter indeed has to be adjusted in a manner consistent with our optimal model’s predictions, as well as the experimental data (Leotti and Wager, 2009). The fit also shows that the rate and threshold do not vary substantially. However, the offset parameter (non-decision time) increases with increasing stop error cost – this is consistent with later response times, without apparent informational gain, as cs increases. In general, the best-fitting race model for each cs behaves very similarly to the optimal model (Figures 6D–F, unfilled).
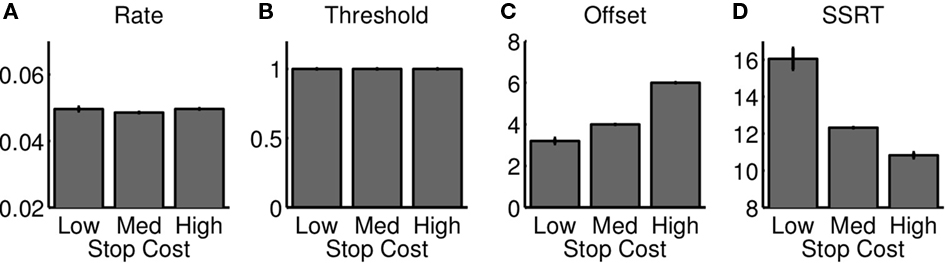
Figure 7. Race model approximation to optimal decision-making as stop error penalty is varied. The figure shows the best race parameters, implemented as a diffusion model shown in Figure 2, that approximate the behavior of the optimal model, as the cost of stop errors is changed. The temporal offset to the start of the diffusion process increases (C), and SSRT decreases (D); rate and threshold parameters are unaffected (A, B). Changes in SSRT are similar to those in optimal model and experimental data (Figure 5). Each bar denotes average of 10 simulated “sessions,” each session consisting of 10,000 trials. Error bar = SEM.
Figure 8 shows the race model fits resulting from this optimization procedure, with (Figures 8A,B) showing the reaction time distribution of GO and stop error trials, as well as the cumulative SE distributions from the optimal model. Figures 8C,D show that the resulting race model fit is able to approximate the RT distributions and the stop error distribution functions qualitatively well, as a result of the optimization procedure selecting the appropriate race model parameters for each condition.
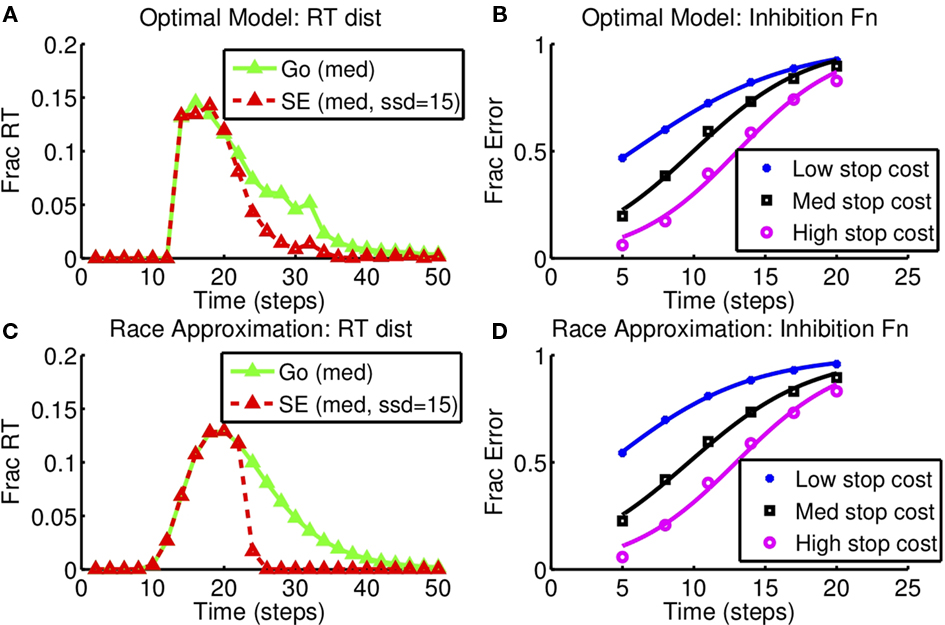
Figure 8. Race model approximation to optimal decision-making as stop error penalty is varied: inhibition function and RT distribution. (A,B) Optimal model. (C,D) Diffusion race model. Left: RT distributions for GO and SE trials. SSD = 15, cs = 0.25, as in Figure 6. Right: Inhibition function for different stop error costs (low: cs = 0.15, med: cs = 0.25, high: cs = 0.5). Results based on 10,000 simulated trials from the optimal model, and also from the corresponding best-fitting diffusion race model.
In summary, optimal decision-making may be implemented by a suitably parameterized race-diffusion model, suggesting one possible neural mechanism for behavior in the task. Furthermore, with an explicit procedure for fitting the race model to the optimal model, we can predict a priori how the race model parameters, such as SSRT, should change under different experimental manipulations, since the optimal model encodes the experimental parameters in a principled manner and gives precise predictions of associated behavioral changes.
4 Discussion
We presented a rational decision-making framework for inhibitory control in the stop signal task. Our framework optimizes sensory processing and action choice relative to a quantitative, global behavioral objective function that explicitly takes into account the various costs associated with go errors, stop errors, and response delay. We show that classical behavioral results in the stop signal task are natural consequences of rational decision-making. Moreover, the model can quantitatively predict the influence of subtle manipulations of task parameters, such as reward contingencies (Leotti and Wager, 2009), on stopping behavior. Our results suggest, therefore, that cognitive processing in the task is a continual, intertwined choice between go and wait (stop), under the influence of multiple cognitive factors in a computationally optimal manner.
We also examined the relationship between the race model and the rational decision-making model. The two models are motivated by fundamentally different levels of analysis, corresponding to algorithmic and computational models in Marr’s (1982)levels of analysis. Despite its elegant simplicity and ability to explain a number of classical behavioral results, the descriptive nature of the race model precludes an a priori prediction of how behavior should change in order to accommodate various cognitive goals and task constraints. On the other hand, the optimal model requires complex computations unlikely to be directly implemented by the brain. Even if subjects’ behavior is similar to model predictions, the brain may well implement a simpler approximation to the optimal algorithm. Recent studies suggest that the activity of neurons in the frontal eye fields (FEF; Hanes et al., 1998) and superior colliculus (Pare and Hanes, 2003) of monkeys could be implementing a version of the race model (Hanes et al., 1998; Boucher et al., 2007; Wong-Lin et al., 2009). Specifically, movement and fixation neurons in the FEF show responses that diverge on go and correct stop trials, indicating that they may encode computations leading to the execution or cancelation of movement. If the race model is an appropriate description of these neural activities, however, we showed that the race model (and its diffusion model elaboration) will need its parameters, such as SSRT, carefully adjusted in different task conditions in order to best approximate the optimal model, and in order to account for experimental data (Emeric et al., 2007; Leotti and Wager, 2009). Our framework can therefore guide the search for, and provide a computational understanding of, the neural mechanisms underlying stopping behavior. For example, we conjecture that FEF neurons represent and track the relative values of various available actions such as going, waiting, and cancelation.
In our model, the RT distribution is the outcome of an adaptively optimal policy acting on accumulated noisy sensory evidence, in light of the global objective function. Notably, the optimal policy is deterministic given a particular sequence of sensory inputs, so that stochasticity in response latency is entirely driven by stochasticity in sensory inputs, which determine RT variance and all other higher-order moments in the RT distribution. A related but distinct framework (Daunizeau et al., 2010) considers the restricted space of non-adaptive policies where a fixed stopping time is chosen at the outset of the trial, based on minimizing the expected cost for the chosen stopping time. It is non-adaptive in the sense that it chooses a mean stop time without considering the actual sequence of sensory inputs observed, and assumes variability around that mean to arise independently from a non-sensory origin. However, substantial experimental data suggest that simple perceptual decisions involve accumulation of evidence up to a bound, related to a specific confidence level in the probability space (and therefore dependent on the actual sequence of noisy inputs observed), rather than up to a chosen stopping time (see e.g., Gold and Shadlen, 2007 for a review). Moreover, from a theoretical perspective, optimal policies for the type of stopping problems, including the stop signal task considered here as well as the simpler two-alternative forced choice tasks (e.g., Gold and Shadlen, 2007), are known to live within the adaptive policy space, and not in the very restrictive sub-class of non-adaptive policies (Wald and Wolfowitz, 1948; Chow et al., 1971). In particular, adaptive policies can better accommodate moment-by-moment changes in perceived sensory information (Kiani et al., 2008). We note here that the original race model is agnostic with respect to to the source of stochasticity in reaction times, taking it as the consequence of some inherent stochasticity in the unspecified go and stop processes. However, the race model can be implemented using a drift-diffusion model to make explicit the role of sensory noise in decision-making, as we demonstrate in our simulations.
In our model, a stop decision is implemented as a sequence of wait actions. Neurophysiological evidence from monkeys (Hanes et al., 1998) and humans (Aron et al., 2007a,b) suggest that successfully stopped actions may involve increased activity in certain neural populations such as the fixation neurons of the FEF, or cortical regions such as the inferior frontal gyrus and subthalamic nucleus implicated by human imaging studies. Studies in humans involving fMRI and tractography data suggest that the inferior frontal gyrus may implement a stop action via a hyperdirect pathway to the subthalamic nucleus (Aron et al., 2007a,b). One important and planned line of inquiry for our work is to consider a rational model with an explicit stop action, in order to better account for what is known about the neurophysiology of stopping.
The stop signal task is traditionally thought of as probing behavioral inhibition, whereas other tasks such as the Stroop and Eriksen tasks (Stroop, 1935; Eriksen and Eriksen, 1974) are thought to engage cognitive inhibition (see e.g., Nigg, 2000 for a taxonomy). In contrast to this view, the close correspondence between our rational decision-making model and human behavior at the task demonstrates the influence of multiple cognitive factors on stopping behavior. Our previous work also showed that behavior in the Eriksen task (Yu et al., 2009) can arise from Bayesian statistical inference in a bounded rational manner (Simon, 1956). An interesting challenge is to explore how performance measures from these various inhibitory control tasks relate to each other within individuals, both empirically and from a computational perspective (Friedman and Miyake, 2004).
One major aim of our work is to understand how stopping ability and SSRT arise from various cognitive factors. Our work shows that SSRT arises from number of contributing elements: reward/penalty-sensitivity, sensory processing rate, and top-down expectations such as that of stop signal frequency. Thus, SSRT should not be viewed as a unique, invariant measure of stopping ability for each subject, but rather as an emergent property of the dynamic, context-dependent comparison between going and stopping. This more nuanced view of stopping ability and SSRT may aid in the careful analysis of impaired stopping ability, e.g., longer measured SSRTs, in a number of psychiatric and neurological conditions, such as substance abuse (Nigg et al., 2006), attention-deficit hyperactivity disorder (Alderson et al., 2007), schizophrenia (Badcock et al., 2002), obsessive-compulsive disorder (Menzies et al., 2007), Parkinson’s disease (Gauggel et al., 2004), Alzheimer’s disease (Amieva et al., 2002), and so on. It is unlikely that these various conditions share an identical set of underlying neural and cognitive deficits. In our framework, almost all model parameters, such as the fraction of stop trials, the SSD distribution, stop error cost, and go response deadline, are set directly by the experimental design. The only exceptions are parameters representing the sensory noise corrupting go stimulus and stop signal processing. These sensory parameters may be one important source of inter-subject differences. However, it is also likely that in practice, individuals have different estimates for the other parameter values on any given trial in an experiment, given their prior biases, memory capacity, individual experiences, and learning rates. Since our model makes explicit the dependence of subject behavior on subtle differences in these subject-specific parameters, these parameters can be inferred from behavioral data directly via model-fitting. In the future, we plan to use model-fitting techniques, in conjunction with calibration experiments for independent estimation of behavioral biases, to study individual and group differences in inhibitory control.
Conflict of Interest Statement
The authors declare that the research was conducted in the absence of any commercial or financial relationships that could be construed as a potential conflict of interest.
Acknowledgments
We thank Jaime Ide, Chiang-shan Li, Gordon Logan, Martin Paulus, Rajesh Rao, Jeffrey Schall, Veit Stuphorn, and Nick Yeung for stimulating discussions and helpful suggestions. Funding was partly from CAN CTA (ARL/DCS).
References
Alcock, J., and Sherman, P. (1994). The utility of the proximate-ultimate dichotomy in ethology. Ethology 96, 58–62.
Alderson, R., Rapport, M., and Kofler, M. (2007). Attention-deficit/hyperactivity disorder and behavioral inhibition: a meta-analytic review of the stop-signal paradigm. J. Abnorm. Child Psychol. 35, 745–758.
Amieva, H., Lafont, S., Auriacombe, S., Le Carret, N., Dartigues, J. F., Orgogozo, J. M., and Fabrigoule, C. (2002). Inhibitory breakdown and dementia of the Alzheimer type: a general phenomenon? J. Clin. Exp. Neuropsychol. 24, 503–516.
Aron, A., Behrens, T., Smith, S., Frank, M., and Poldrack, R. (2007a). Triangulating a cognitive control network using diffusion-weighted magnetic resonance imaging (MRI) and functional MRI. J. Neurosci. 27, 3743.
Aron, A., Durston, S., Eagle, D., Logan, G., Stinear, C., and Stuphorn, V. (2007b). Converging evidence for a fronto-basal-ganglia network for inhibitory control of action and cognition. J. Neurosci. 27, 11860.
Badcock, J. C., Michie, P. T., Johnson, L., and Combrinck, J. (2002). Acts of control in schizophrenia: dissociating the components of inhibition. Psychol. Med. 32, 287–297.
Barkley, R. (1997). Behavioral inhibition, sustained attention, and executive functions: constructing a unifying theory of ADHD. Psychol. Bull. 121, 65–94.
Bellman, R. (1952). On the theory of dynamic programming. Proc. Natl. Acad. Sci. U.S.A. 38, 716–719.
Bogacz, R., Brown, E., Moehlis, J., Hu, P., Holmes, P., and Cohen, J. D. (2006). The physics of optimal decision making: A formal analysis of models of performance in two-alternative forced choice tasks. Psychol. Rev. 113, 700–765.
Boucher, L., Palmeri, T., Logan, G., and Schall, J. (2007). Inhibitory control in mind and brain: an interactive race model of countermanding saccades. Psychol. Rev. 114, 376–397.
Chow, Y., Robbins, H., and Siegmund, D. (1971). Great Expectations: The Theory of Optimal Stopping. Boston, MA: Houghton Mifflin.
Daunizeau, J., den Ouden, H., Pessiglione, M., Kiebel, S., Friston, K., and Stephan, K. (2010). Observing the observer (ii): deciding when to decide. PLoS ONE 5, e15555.
Emeric, E., Brown, J., Boucher, L., Carpenter, R., Hanes, D., Harris, R., Logan, G., Mashru, R., Paré, M., Pouget, P., Stuphorn, V., Taylor, T., and Schall, J. (2007). Influence of history on saccade countermanding performance in humans and macaque monkeys. Vision Res. 47, 35–49.
Eriksen, B., and Eriksen, C. (1974). Effects of noise letters upon the identification of a target letter in a nonsearch task. Percept. Psychophys. 16, 143–149.
Friedman, N., and Miyake, A. (2004). The relations among inhibition and interference control functions: a latent-variable analysis. J. Exp. Psychol. 133, 101.
Gauggel, S., Rieger, M., and Feghoff, T. (2004). Inhibition of ongoing responses in patients with Pakingson’s disease. J. Neurol. Neurosurg. Psychiatry 75, 539–544.
Gold, J. I., and Shadlen, M. N. (2002). Banburismus and the brain: decoding the relationship between sensory stimuli, decisions, and reward. Neuron 36, 299–308.
Gold, J. I., and Shadlen, M. N. (2007). The neural basis of decision making. Annu. Rev. Neurosci. 30, 535–574.
Hanes, D., Patterson, W., and Schall, J. (1998). The role of frontal eye field in countermanding saccades: visual, movement and fixation activity. J. Neurophysiol. 79, 817–834.
Hanes, D., and Schall, J. (1996). Neural control of voluntary movement initiation. Science 274, 427–430.
Kiani, R., Hanks, T., and Shadlen, M. (2008). Bounded integration in parietal cortex underlies decisions even when viewing duration is dictated by the environment. J. Neurosci. 28, 3017.
Leotti, L., and Wager, T. (2009). Motivational influences on response inhibition measures. J. Exp. Psychol. Hum. Percept. Perform. 36, 430–447.
Logan, G., and Cowan, W. (1984). On the ability to inhibit thought and action: A theory of an act of control. Psychol. Rev. 91, 295–327.
Luce, R. D. (1986). Response Times: Their Role in Inferring Elementary Mental Organization. New York: Oxford University Press.
Marr, D. (1982). Vision: a computational investigation into the human representation and processing of visual information. San Francisco, CA: WH Freeman.
Mazurek, M. E., Roitman, J. D., Ditterich, J., and Shadlen, M. (2003). A role for neural integrators in perceptual decision making. Cerebr. Cortex 13, 1257–1269.
Menzies, L., Achard, S., Chamberlain, S., Fineberg, N., Chen, C., del Campo, N., Sahakian, B., Robbins, T., and Bullmore, E. (2007). Neurocognitive endophenotypes of obsessive-compulsive disorder. Brain 130, 3223.
Nigg, J. (2000). On inhibition/disinhibition in developmental psychopathology: views from cognitive and personality psychology and a working inhibition taxonomy. Psychol. Bull. 126, 220–246.
Nigg, J., Wong, M., Martel, M., Jester, J., Puttler, L., Glass, J., Adams, K., Fitzgerald, H., and Zucker, R. (2006). Poor response inhibition as a predictor of problem drinking and illicit drug use in adolescents at risk for alcoholism and other substance use disorders. J. Am. Acad. Child Adolesc. Psychiatr. 45, 468.
Pare, M., and Hanes, D. (2003). Controlled movement processing: superior colliculus activity associated with countermanded saccades. J. Neurosci. 23, 6480–6489.
Simon, H. A. (1956). Rational choice and the structure of the environment. Psychol. Rev. 63, 129–138.
Stroop, J. (1935). Studies of interference in serial verbal reactions. J. Exp. Psychol. 18, 643–662.
Verbruggen, F., and Logan, G. (2009a). Models of response inhibition in the stop-signal and stop-change paradigms. Neurosci. Biobehav. Rev. 33, 647–661.
Verbruggen, F., and Logan, G. (2009b). Proactive adjustments of response strategies in the stop-signal paradigm. J. Exp. Psychol. Hum. Percept. Perform. 35, 835–854.
Wald, A., and Wolfowitz, J. (1948). Optimum character of the sequential probability ratio test. Ann. Math. Stat. 19, 326–339.
Keywords: inhibitory control, optimal decision-making, speed-accuracy tradeoff, stop signal task
Citation: Shenoy P and Yu AJ (2011) Rational decision-making in inhibitory control. Front. Hum. Neurosci. 5:48. doi: 10.3389/fnhum.2011.00048
Received: 30 December 2010; Paper pending published: 31 January 2011;
Accepted: 08 May 2011; Published online: 27 May 2011.
Edited by:
Francisco Barcelo, University of Illes Balears, SpainReviewed by:
Christopher Summerfield, Oxford University, UKHarriet Feldman, University College London, UK
Copyright: © 2011 Shenoy and Yu. This is an open-access article subject to a non-exclusive license between the authors and Frontiers Media SA, which permits use, distribution and reproduction in other forums, provided the original authors and source are credited and other Frontiers conditions are complied with.
*Correspondence: Angela J. Yu, Department of Cognitive Science, University of California, MC 0515, 9500 Gilman Drive, San Diego, La Jolla, 92093 CA, USA. e-mail: ajyu@ucsd.edu