Human scalp electroencephalography reveals that repetition suppression varies with expectation
- Department of Experimental Psychology, University of Oxford, Oxford, UK
Repetitions of a sensory event elicit lower levels of brain activity than its initial presentation (“repetition suppression,” RS). According to one view, RS depends on the biophysics of neuronal discharge, and is thus an automatic consequence of stimulus processing (“fatigue” model). Another account suggests that RS depends on the statistical structure of the environment, and occurs when repeated stimuli are less surprising than novel stimuli (“surprise reduction” model). In support of the latter view, functional magnetic resonance imaging studies have shown that RS is modulated by the local probability of repetition. However, single-cell recordings from macaque inferotemporal area (IT) have failed to replicate this finding. Here, we recorded scalp electroencephalography from human participants viewing pairs of faces that repeated (face1–face1) or alternated (face1–face2), in contexts in which repetitions were expected or unexpected. As previously described, event-related potentials in the range of 100–400 ms recorded at posterior electrode sites and at the vertex differed between repetitions and alternations. Critically, at central electrodes, we observed that the difference between repeated and alternating stimuli was attenuated when repetitions were unexpected, as predicted by the surprise reduction model. These findings demonstrate that the modulation of RS by repetition probability is observable using direct neural recording methods in human participants, and that it occurs relatively late (>300 ms) post-stimulus. Finally, we found that theta-band (4–8 Hz) spectral power over central electrodes varied with the three-way interaction between of repetition, expectation, and the rate of change of the environment, consistent with recent reports that frontal theta may be a hallmark of learning processes originating in the anterior cingulate and medial prefrontal cortex.
Introduction
Neural responses elicited by the second and subsequent occurrence of a stimulus are reduced relative to its initial presentation (Desimone, 1996; Wiggs and Martin, 1998; Grill-Spector et al., 2006). This phenomenon, often termed “repetition suppression” (RS), is one of the most robust and ubiquitous findings in the behavioral and cognitive neurosciences, having been observed at the level of single neurons (Carandini and Ferster, 1997), with non-invasive neurophysiological recordings such as electroencephalography (EEG; Nagy and Rugg, 1989; Henson et al., 2003), and the blood-oxygen level dependent (BOLD) signal measured with functional magnetic resonance imaging (Henson, 2003; Dobbins et al., 2004). RS has been observed across modalities and at numerous neocortical sites, from primary sensory cortices to the prefrontal cortex, but has been most extensively studied in the human extrastriate visual cortex, and homologous regions of the macaque (e.g., inferotemporal cortex, or area IT; Gross et al., 1967; Miller et al., 1991). However, despite many years of investigation, the biophysical or computational properties of neurons that give rise to RS remain controversial (Wiggs and Martin, 1998; Friston, 2005; Grill-Spector et al., 2006; Summerfield et al., 2008; De Baene and Vogels, 2010; Kaliukhovich and Vogels, 2010).
According to one view, RS may simply occur because of biophysics of neuronal discharge and short-term synaptic mechanisms that follow it (De Baene and Vogels, 2010; Kaliukhovich and Vogels, 2010). For example, immediately repeated stimuli may occur during a tonic hyperpolarization that follows the initial presentation (Carandini and Ferster, 1997), resulting either from synaptic depression at the neuron, or interactions at the local network level (Sawamura et al., 2006). Under this “bottom-up” account, RS is an automatic consequence of local neuronal activity engendered by physical stimulation (“fatigue” hypothesis). An alternative “top-down” account views RS in the broader context of learning and inference in the brain, suggesting that it may reflect an attenuation of surprise responses (or prediction errors) elicited by novel or unexpected sensory events (Henson, 2003; Friston, 2005; Baldeweg, 2007). Under this “surprise reduction” theory, RS will be sensitive to contextual factors beyond the physical properties of the stimulus itself, such as the probability that a repetition will occur, or the relevance of the repeated stimulus to the task at hand.
Proponents of both bottom-up and top-down views of RS can find supporting evidence in the past literature. For example, studies have variously found that attention does (Murray and Wojciulik, 2004; Vuilleumier et al., 2005; Yi and Chun, 2005; Chee and Tan, 2007; Henson and Mouchlianitis, 2007) or does not (Bentley et al., 2003; De Baene and Vogels, 2010) modulate the amplitude of the BOLD reduction to a repeated visual event. Here, however, we focus on another issue, namely, whether RS depends upon the probability that a repetition will occur. If RS reflects the reduction in surprise occurring to repeated (relative to novel) stimuli, then it may in turn depend upon the probability that a repetition will occur. For example, in an (perhaps atypical) situation where repetitions themselves are surprising (i.e., the sensory world is noisy or changeable, and novel information is the norm), an alternation will be less surprising, and so RS should be reduced. By contrast, the fatigue hypothesis predicts that RS is independent of the probabilistic structure of the environment, so equal levels of RS should occur for rare and frequent repetitions. In a recent fMRI experiment using face stimuli, we have demonstrated evidence in favor of the former view: RS in face-selective regions of extrastriate visual cortex (the “fusiform face area” or FFA) was reduced in situations where face repetitions were rare, even when those stimuli were irrelevant to the task at hand (Summerfield et al., 2008). This supports the surprise reduction hypothesis, but is inconsistent with accounts that emphasize automatic, bottom-up processes as the sole mechanism underlying RS.
However, in a recent report using an almost identical paradigm, Kaliukhovich and Vogels (2010) demonstrate convincingly that single neurons in macaque inferotemporal cortex show no modulation of RS by context, i.e., statistically indistinguishable levels of RS were observed for repetitions that occurred in contexts where repetitions were rare (25%) or frequent (75%). This was the case both for spike rates and for gamma-band activity in the local field potential (LFP), two phenomena that are thought to show a good correspondence with the amplitude of the BOLD signal (Logothetis et al., 2001). The authors consider a number of reasons why their results differed from our earlier findings, including (i) the use of face stimuli vs. other objects, (ii) the use a detection task vs. passive fixation, (iii) the degree of selectivity of the relevant neurons to the stimulus, or (iv) the possibility that the monkeys simply failed to learn the higher-order probability of repetition. Although all of these are theoretically possible, perhaps the simplest and most plausible explanation is that neural signaling of expectations is more likely to be detected in the BOLD signal, for instance because the BOLD signal reflects sustained better than transient responses (Logothetis et al., 2001). As the authors point out, the relationship between the BOLD signal and the underlying neuronal activity remains controversial, and at least one study has reported anticipation-related vascular responses that were unrelated to local neural responses (Sirotin and Das, 2009). Another possibility is that the neurons targeted by Kaliukhovich and Vogels (2010) were not representative of the computational status quo in area IT, and that expectation-related modulation of RS is present at the global electrophysiological level, but not at those neurons recorded in that study.
One way to arbitrate among these two possibilities is to record electrophysiological signals in humans using scalp EEG, and to ask whether repetition-sensitive differences in event-related potentials (ERPs) and oscillatory activity vary with repetition probability. We thus recorded scalp EEG whilst human participants viewed face repetitions (face1–face1) and alternations (face1–face2) that occurred under circumstances where repetitions and alternations were either probable (20%) or improbable (80%). An extensive literature has documented the influence of stimulus repetition or alternation on early, “exogenous” evoked potentials, which may index the arrival of information to the cortex (Naatanen and Picton, 1987), and late, “endogenous” components previously associated with expectation, attention, and memory (Sutton et al., 1965; Donchin et al., 1978). In order to focus our hypotheses, however, we turned to a literature that has measured ERPs responding to faces and the modulation by repetition or alternation (Barrett et al., 1988; George et al., 1997; Eimer, 2000; Schweinberger et al., 2002a; Henson et al., 2003; Trenner et al., 2004). Here, we asked whether this sensitivity to face repetition in the ERP signal was modulated by the higher-order statistical structure of the task, i.e., by whether repetitions themselves were probable or improbable. This allowed us to test (i) whether previously described modulation of RS by expectation was observable in human electrophysiological signals, and (ii) whether it was associated with early or late potentials.
One possible function of “surprise” responses in the visual system (such as those potentially elicited by alternations relative to repetitions in our task), is to promote learning about the frequencies or conditional probabilities of sensory events. However, the extent to which surprise responses offer new information about the environment in turn depends on a yet higher-order factor – the rate at which the environment is subject to change. Specifically, in stable environments, unexpected events are highly informative, whereas in volatile environments, a surprising event is more likely to reflect noise than a change in the environment (Yu and Dayan, 2005; Behrens et al., 2007). This intuition allows us to make a further prediction about brain activity recorded during the task: (iii) that the repetition × expectation interaction should be more prominent during stable periods than during volatile periods. With this in mind, we explicitly presented faces during epochs in which, unbeknownst to the observer, the probability of repetition changed rapidly (every 10 trials) or at a slower pace (every 30–40 trials). This allowed us to assess the independent influences of volatility, expectation, and repetition on human EEG activity.
Materials and Methods
Participants
Fourteen healthy adults aged between 18 and 30 with no history of psychiatric or neurological disorder, and normal or corrected-to-normal vision, participated in the experiment. All participants provided informed consent in accordance with local ethical guidelines, and £20 was offered as reimbursement for their time and inconvenience. One participant was excluded due to an exceptionally large number of artifactual trials, leaving n = 13.
Stimuli and Design
Face stimuli were 250 × 300 pixel color images of males and females of variable race and age, with hair of differing styles and colors, created using FaceGen (Singular Inversions, ON, Canada). Faces were presented centrally on a gray background and subtended 5.9 × 7.2 degrees visual arc at a distance of ∼80 cm. On each run of 140 trials (∼7 min) participants viewed two faces on each trial, the first for 750 ms, and the second for 1000 ms; the two faces were separated by a blank screen for 250 ms (Figure 1B). Faces were either the same (50% of trials) or different (50% of trials). No face was repeated between trials at any stage of the experiment; in other words, each trial contained a unique face (repetitions) or two unique faces (alternations). Participants completed 4 runs, i.e., 560 trials in total. An interval of 1 s was interposed between trials.
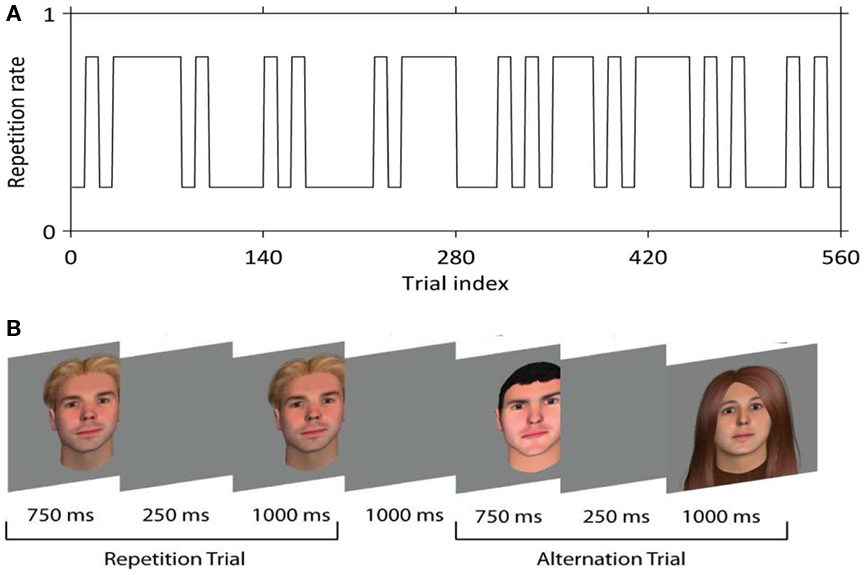
Figure 1. (A) The trial sequence. An example of how repetition rate (the probability of repetition) varied across the experiment, switching from 0.2 to 0.8 every 10 trials (in volatile conditions) or 30–40 trials (in stable conditions). (B) Two example trials. Each trial consisted of the presentation of a face for 750 ms, followed by a blank screen for 250 ms, followed by a second face for 1000 ms. A further blank screen of 1000 ms was interposed between trials.
As shown in Figure 1A, trial sequences were constructed such that the probability of a repetition vs. an alternation jumped between 0.2 and 0.8 every 10 trials (volatile condition) or 30–40 trials (stable condition). We verified that participants learned this pattern with a behavioral pilot experiment in which responses were required on every trial. Our experiment was thus a 2 × 2 × 2 factorial design crossing stimulus repetition or alternation (REP vs. ALT) with expectation (expect repetition vs. expect alternation) and volatility (volatile vs. stable).
On ∼17% of trials (i.e., 24 per run) either the first face (12 trials per run) or the second face (12 trials per run) rotated slightly to the left or right; this occurred equally often for repetitions and alternations. Participants were instructed that on these trials (and these trials only) they should respond with a key press to the onset of the second face (target trials). These trials were discarded to avoid contamination of the main effects with motor variables. Responses were made with a mouse button held in the right hand.
Bayesian Modeling
We used a sequential Bayesian learner (Behrens et al., 2007) to calculate the probability of repetition that would be estimated by an ideal observer performing the task. The Bayesian learner assumes that face repetitions and alternations are generated using an underlying probability of repetition p(rep). Like classical reinforcement-learning models, the goal of the sequential Bayesian learner is to track changes in p(rep) over time. The additional problem addressed by the Bayesian learner is how much the current estimate of p(rep) should be updated when a repetition (or an alternation) is observed. To do so, the Bayesian learner keeps track of the expected rate of change in p(rep) over time – namely, the volatility v of p(rep). A fast-changing p(rep) will increase the volatility v, and consequently increase the influence of the current observation (either a repetition or an alternation) on the next estimate of p(rep). In contrast, a slow-changing p(rep) will decrease the volatility v, and decrease the influence of the current observation of the next estimate of p(rep). Importantly, the speed of change between stable and volatile blocks is parameterised by a third parameter k – i.e., the distrust in the consistency of v.
Like previous attempts (Behrens et al., 2007; Boorman et al., 2009), we implemented this Bayesian learner using a Markovian scheme: when a repetition (or an alternation) is observed, the updated probability of repetition p(rep)i+1 depends only on this repetition (or alternation) and on the previous probability of repetition p(rep)i. Within this Markovian scheme, the transition probability between consecutive estimates of p(rep) is represented by the conditional probability distribution p[p(rep)i+1 | p(rep)i]. This probability distribution is centered on p(rep)i and is modeled as a beta distribution β[p(rep)i, V], where V = exp(v) parameterises the width of the distribution. A large v leads to a wide distribution, indicating that the estimate of p(rep) can change quickly between consecutive updates. In contrast, a small v leads to a narrow distribution, indicating that the estimate of p(rep) can only change slowly between consecutive updates. Similarly, the transition probability between consecutive estimates of the volatility v is represented by p(vi+1 | vi), where v is expressed in logarithmic units. This probability distribution is simply modeled as a normal distribution N(vi, K), where K = exp(k) parameterises the speed of change of the volatility. A large k indicates that the volatility changes quickly over time, whereas a small k indicates that the volatility changes slowly over time.
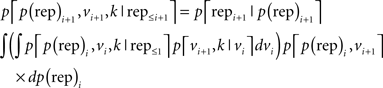
Bayes rule was used to update the joint probability p[p(rep)i+1, vi+1, k | rep≤i+1] of all three parameters [the probability of repetition p(rep), the volatility v, and the rate of change in volatility k] after the current face pair repi+1 (repetition or alternation), given all past face pairs rep ≤ i in the sequence:
This equation provides a way of updating our belief in the parameters p(rep), v, and k on a trial-by-trial basis in a Markovian transitional fashion – i.e., without needing to store explicitly the full history of past face pairs. As described in (Behrens et al., 2007), we performed numerical integration using a 5D grid [the five dimensions represent p(rep)i+1, vi+1, p(rep)i, vi and k, with integration over p(rep)i and vi]. The resulting three-dimensional grid, representing the joint probability distribution p[p(rep)i+1, vi+1, k | rep≤i+1], was stored between trials. At the beginning of the experiment, the joint probability distribution was set to be uniform.
To summarize, we used the Bayesian learner to compute single-trial maximum likelihood estimates of the expected probability of repetition p(rep) and the volatility v for each subject, and subsequently used these single-trial estimates as regressors for EEG single-trial analyses. As expected, the Bayesian learner successfully tracked “first-order” jumps in p(rep) between 0.2 and 0.8, but also “second-order” jumps in v between stable and volatile blocks.
EEG Recording
Electroencephalography was recorded continuously (1000 Hz sampling rate; left mastoid reference; NuAmps digital amplifiers; Neuroscan, El Paso, TX, USA) from 36 scalp sites using Ag/AgCl electrodes mounted on an elastic cap (Easy Caps, Germany) according to the 10–20 international system. The montage included seven midline sites (OZ, POZ, PZ, CPZ, CZ, FCZ, and FZ), 12 sites over each hemisphere (O1/O2, PO3/PO4, PO7/PO8, P3/P4, P7/P8, CP3/CP4, C3/C4, FC3/FC4, FT7/FT8, F3/F4, F7/F8, and FP1/FP2), left and right mastoids, HEOG, and VEOG electrodes to monitor the EOG bipolarly, and an additional electrode (AFZ) used as ground. Offline pre-processing of EEG data was carried out using EEGLAB (Delorme and Makeig, 2004). Recordings were re-referenced to the average across all electrodes, and (for ERP analyses only) a low-pass filter was applied (30 Hz, 24 dB/octave). Continuous epochs from 500 ms before the second face to 1000 ms after the second face stimulus were included in the analyses except when these showed recording artifacts other than saccades or blinks occurred in the EEG; these were identified using semi-automatic routines, and then verified by eye. After epoching, independent component analysis (ICA) was used to unmix the data into 40 components, each characterized by time course (projection matrix) and scalp map (weighting matrix). Time course/scalp map pairs were visually inspected to identify components associated with eye movements and blinks, and EEG data was reconstituted into electrode space without these components (about 2–4 components rejected per participant). Subsequent analyses were carried out with in-house scripts.
Time-Frequency Decomposition
All cleaned epochs were Morlet wavelet (ω = 6) transformed (Torrence and Compo, 1998) between 4 and 100 Hz in 38 logarithmically spaced frequency bands. To reduce artifacts, wavelet values were windsorized at 5 SD above the mean. Trials in each condition were subsequently averaged, yielding mean time-frequency information for each condition, at each electrode, for each subject. The condition-specific ERP was subtracted from each trace prior to wavelet analysis, such that wavelet data reflect neural activity that is not time-locked to stimulus onset (e.g., variable phase across trials). Averaged wavelet values in each frequency band were normalized by the mean power in the baseline period (500 ms pre-stimulus) and converted to decibels (log10 units).
Statistical Analyses
Statistical testing was carried out with ANOVAs and t-tests on averaged ERP amplitudes and wavelet power values. Our strategy was as follows: we first identified neural phenomena that varied with the main effect of repetition, i.e., whether the trial was a repetition or an alternation. We did not have a strong a priori hypothesis concerning how the ERPs would vary with repetition, as effects have been reported at a variety of latencies and electrode sites from early (∼100 ms) to late (>800 ms). We thus used a non-parametric approach as follows: (1) point-estimate statistics (F-values associated with the main effect of repetition) were calculated at every time point from −100 to +1000 ms; (2) condition-subject assignments were shuffled and statistics computed 1000 times, to provide a null distribution associated with each time point; (3) the maximum F-value from the shuffled distribution across the entire time period was logged, providing a null distribution of maxima; (4) point-estimates were compared to this distribution, with those falling in 95th percentile or above deemed to be significant. This previously described (Burgess and Gruzelier, 1999; Summerfield and Mangels, 2005) non-parametric method provides exact statistics that are corrected for multiple comparisons in a manner that is equivalent to the “family wise error,” the gold standard in functional neuroimaging (Nichols and Holmes, 2002). In an auxiliary analysis, we additionally corrected for spatial observations (i.e., electrodes) in the same fashion. Nevertheless, we report these more conservative statistics along with our main results. Subsequently, latencies/electrode groups demonstrating RS (or enhancement) effects were selected for targeted ANOVAs that tested for the interaction between repetition and expectation. This strategy avoids the problem of circular analysis (Kriegeskorte et al., 2009) because the contrast weights associated with the main effects (e.g., [1 1; −1 −1]) and the interaction (e.g., [1 −1; −1 1]) are orthogonal to one another; an identical logic applies to balanced post hoc t-tests conducted within a level (e.g., [1 −1; 0 0]). Time-frequency data were analyzed by averaging across theta (4–8 Hz), alpha/beta (9–35 Hz), and gamma (35–100 Hz) frequency bands between 200 and 700 ms post-stimulus, and analyzing the resulting averages with factorial ANOVAs. A Bonferroni correction was employed to correct for the multiple comparisons over electrode groups (central, parietal) and frequency bands (theta, alpha/beta, gamma).
Results
Behavioral Data
Participants responded to 91.1 ± 11.2% of rotated faces. Reaction times on responded trials (mean = 635 ± 156 ms) did not differ as a function of repetition, expectation or their interaction (all p-values > 0.25). In other words, we observed no significant evidence that participants exhibited different levels of global attention or vigilance as a function of the experimental manipulations.
EEG Data
All EEG analyses described here focused on epochs in which the second of the two faces was presented (as anticipated, none of the results reported below held for the first face). Scalp maps showing the average voltage values across the scalp and electrode sites at which a main effect of repetition (ALT vs. REP) was observed are shown in Figures 2A,B respectively. The red–yellow–white color scale indicates the minimum p-value (within the range 0.001–0.05) observed at that electrode site within the relevant time bin, interpolated across the scalp. p-Values were adjusted using a non-parametric method, which provides a family wise error correction for multiple comparisons across time points (here, n = 375). Main effects of repetition were observed mainly at parietal electrodes and at the vertex between 300 and 400 ms post-stimulus, with somewhat weaker but still statistically reliable differences also observed at 100–200 ms over occipital electrodes.
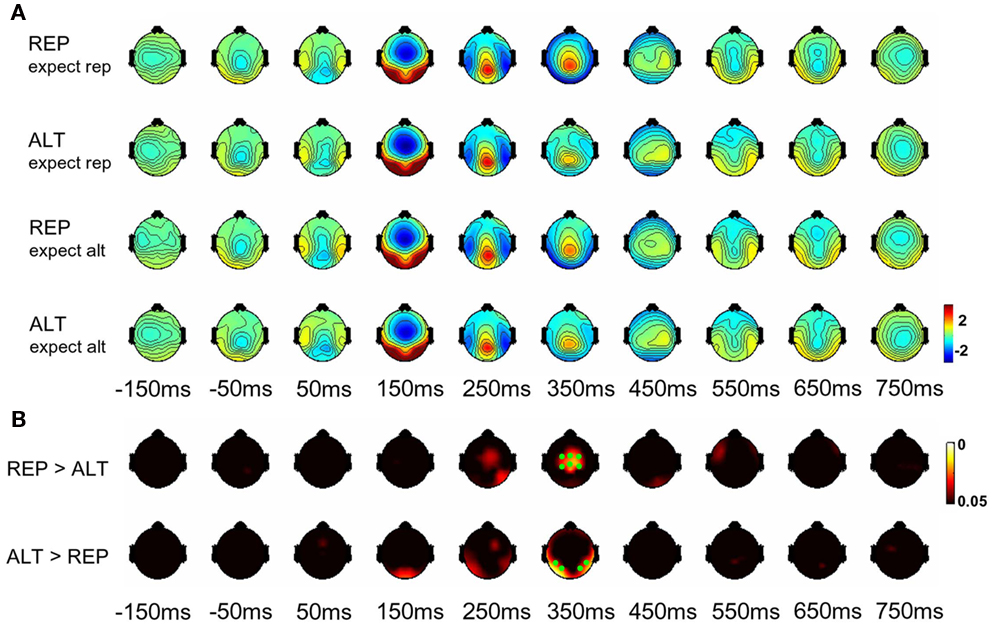
Figure 2. (A) Event-related potential scalp maps for REP and ALT trials where repetitions were expected or unexpected, in bins of 100 ms. (B) Significance maps showing electrodes where statistically reliable (p < 0.05, corrected for multiple comparisons) effects of repetition vs. alternation were observed. Red–yellow color map indicates the lowest observed p-value across the relevant time bin. Time values (in ms) show the mid-point of the relevant time bin. Time = 0 indicates the onset of the second face. Green dots show the locations of parietal (lower row, 350 ms time bin) and central (upper row, 350 ms time bin) electrodes included in analyses here.
The main purpose of this experiment was to determine whether RS measured in the scalp EEG response was modulated by repetition probability. To begin with, thus, we (i) collapsed across the volatility factor, and (ii) focused on those electrodes/time bins that showed a main effect of repetition, to ask whether their sensitivity to repetition varied with the probability that a repetition would occur (repetition × expectation interaction). This approach avoids circular inference (or “double-dipping”) because the main effects and the interaction of the ANOVA are orthogonal to one another (see Materials and Methods).
Parietal Electrodes
Event-related potentials from electrodes P7, P8, PO7, and PO8 are shown in Figure 3, for repetitions (green) and alternations (red) under conditions where repetitions were either expected (full lines) or unexpected (dashed lines). The main effect of repetition can be seen at about 300–400 ms post-stimulus. Initially, we calculated the mean signal amplitude for each condition, defining expect rep and expect alt according to whether the underlying probability of repetition was 0.8 or 0.2. Collapsing across those four electrodes for the 300- to 400-ms time bin, the main effect of repetition was significant [F(1,12) = 20.2 p < 0.001] but there was no significant effect of expectation (p = 0.08) and no interaction (p = 0.45). Accordingly REP vs. ALT comparisons were reliable in both expect rep [t(12) = 2.86, p < 0.05] and expect alt conditions [t(12) = 3.35, p < 0.01] independently (Figures 5A,C). Moreover, we failed to observe a repetition × expectation interaction when volatile (p = 0.21) and stable (p = 0.17) trials were considered separately.
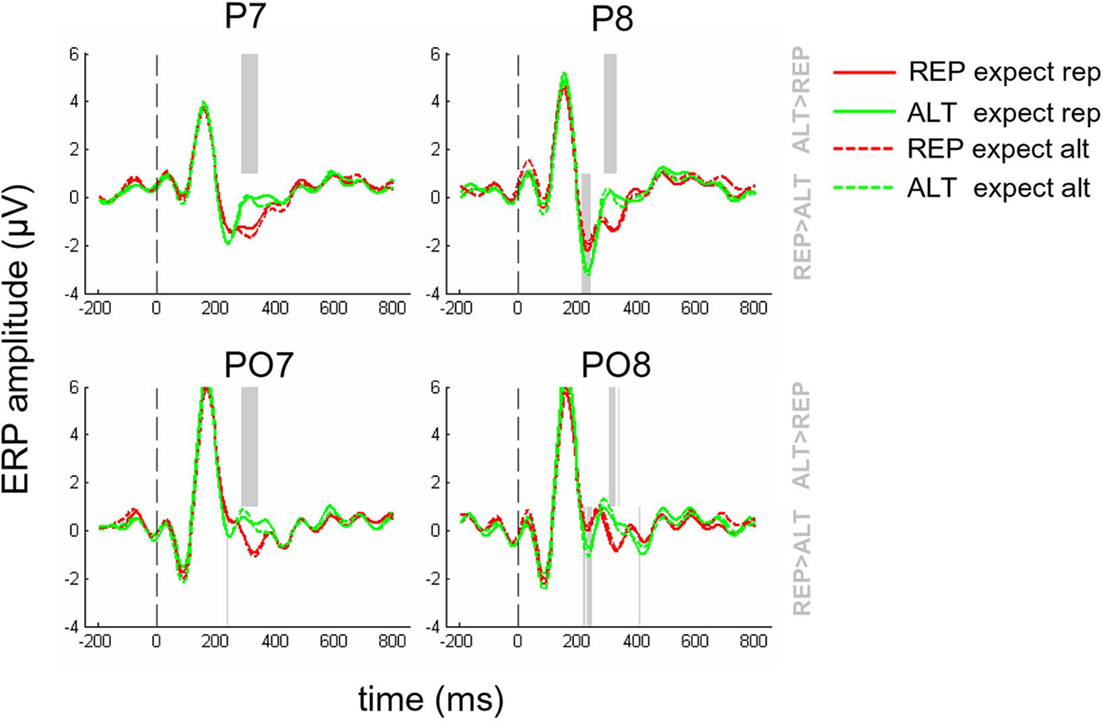
Figure 3. Event-related potentials for REP (red lines) and ALT (green lines) trials where repetitions were expected (full lines) or unexpected (dashed lines), at electrodes P7, P8, PO7, and PO8. Dashed gray line at time = 0 indicates the onset of the second face. Faded gray lines in the upper half of the plot indicate time points where the voltages associated with ALT trials are significantly more positive-going than those associated with REP trials (p < 0.05, corrected for multiple comparisons). Equivalent lines in the lower half of the plot show time points where REP trials were most positive-going.
Central Electrodes
Repeating the above analyses for central electrodes, however, yielded a different pattern of data. ERPs from electrodes C3, C4, CP3, CP4, CPz, and Cz are shown in Figure 4. Once again, a significant main effect of repetition is clearly visible at approximately 300–400 ms post-stimulus. The polarity is opposite to that observed at parietal electrodes, with more negative-going potentials observed for ALT than REP trials, consistent with the established view that face-sensitive potentials at the vertex may reflect an inversion of the dipole observed at lateral visual cortex sites (Joyce and Rossion, 2005). However, unlike at parietal electrodes, visual inspection suggests that the difference between ALT and REP trials is greater for the expect rep conditions (dashed lines) than the expect alt condition (full lines). This can be seen in Figure 5B, and also in Figure 5D, where the mean amplitude between 300 and 400 ms, averaged across these electrodes, is presented as a bar plot. ANOVAs revealed that at central electrodes, there was a main effect of repetition [F(1,12) = 17.8, p < 0.002], and no main effect of expectation (p = 0.78) but, critically, there was a repetition × expectation interaction [F(1,12) = 20.6, p < 0.001]. This was driven by strong differences between REP and ALT trials in expect rep contexts [t(12) = 5.35, p < 0.001] but a difference between REP and ALT in expect alt contexts that was at best marginal [t(12) = 1.98, p = 0.08]. Breaking down the conditions further according to volatility, it became clear that this interaction was largely driven by stable trials [F(1,12) = 10.5, p < 0.008] rather than volatile trials (p = 0.21), but the three-way volatility × expectation × repetition interaction remained non-significant (p = 0.29).
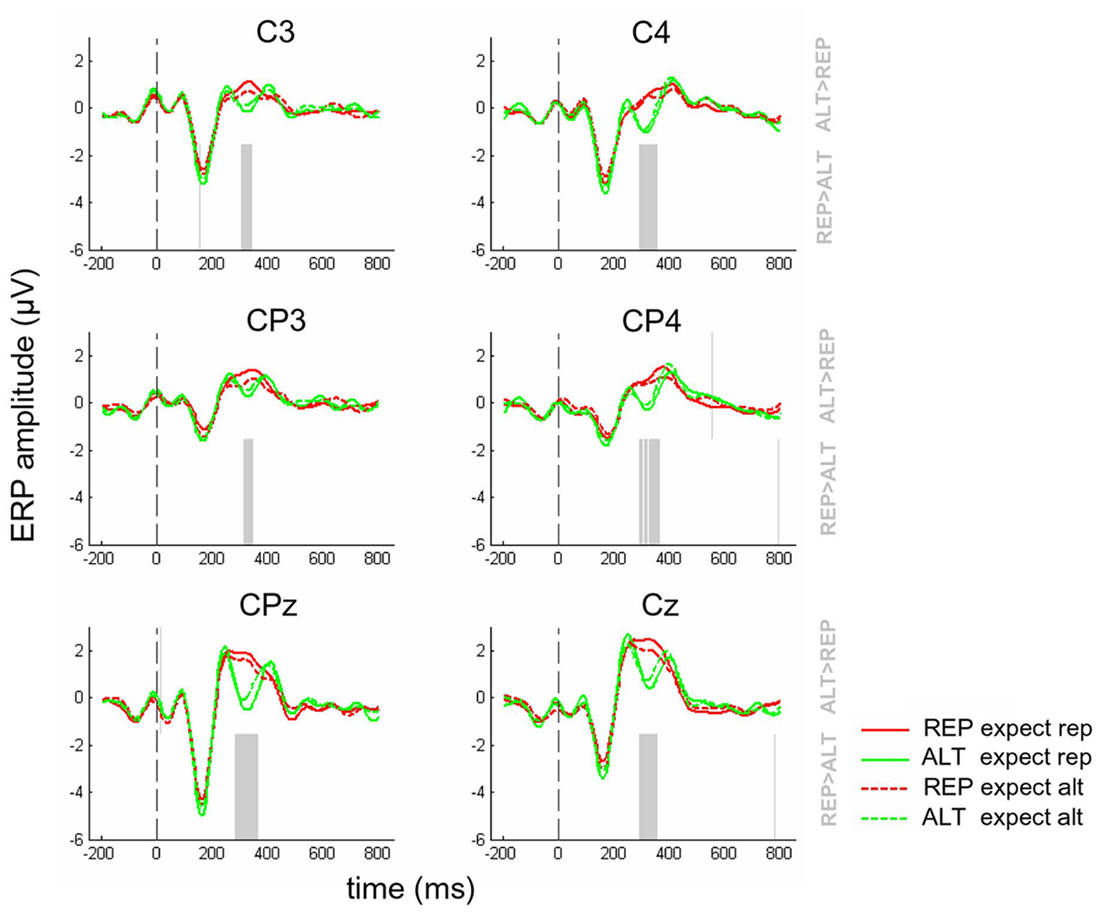
Figure 4. Event-related potentials for REP (red lines) and ALT (green lines) trials where repetitions were expected (full lines) or unexpected (dashed lines), at electrodes C3, C4, CP3, CP4, CPz, and Cz. Dashed gray line at time = 0 indicates the onset of the second face. Faded gray lines in the upper half of the plot indicate time points where the voltages associated with ALT trials are significantly more positive-going than those associated with REP trials (p < 0.05, corrected for multiple comparisons). Equivalent lines in the lower half of the plot show time points where REP trials were most positive-going.
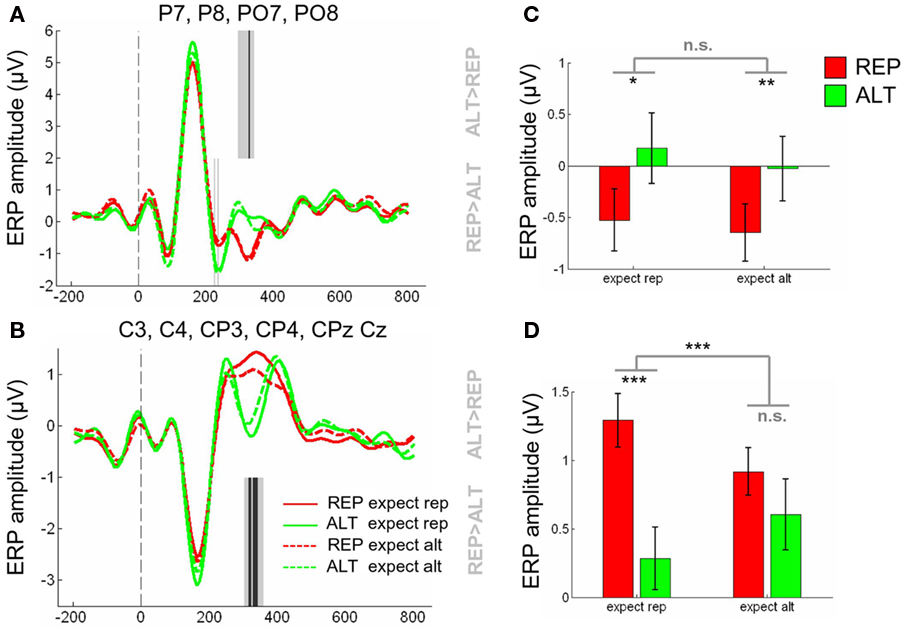
Figure 5. (A) Event-related potentials averaged across electrodes P7, P8, PO7, PO8, for REP (red lines) and ALT (green lines) trials where repetitions were expected (full lines) or unexpected (dashed lines. Dashed gray line at time = 0 indicates the onset of the second face. Gray lines in the upper half of the plot indicate time points where the voltages associated with ALT trials are significantly more positive-going than those associated with REP trials [p < 0.05, corrected for multiple comparisons across time (light gray lines) and time and electrodes (dark gray lines)]. Equivalent lines in the lower half of the plot show time points where REP trials were most positive-going. (B) Equivalent plot for electrodes C3, C4, CP3, CP4, CPz, and Cz. (C) Mean ERP amplitude from 300 to 400 ms, averaged across parietal electrodes shown in (A), for REP trials (red bars) and ALT trials (green bars), in contexts where repetitions were expected (left bars) or unexpected (right bars). (D) Equivalent bar plot showing mean ERP amplitude from 300 to 400 ms, averaged across central electrodes shown in (B). Stars above each pair of bars indicate the significance of a paired t-test between REP and ALT trials in that context; central stars indicate the significance of the repetition × expectation interaction, with the following alphas: ***p < 0.001, **p < 0.01, *p < 0.05.
Single-Trial Analyses
Expectation values were not overtly signaled to the participants; they had to learn them from the task structure. Because the probability of repetition [hereafter, denoted p(rep)] was not fully determined by the expectation condition, participants were not able to immediately identify state changes in the probability structure. A form of ideal observer analysis based on a hierarchical Bayesian model can be used to estimate p(rep) that an optimal agent would calculate for any given point in the experiment. This permits expectations about repetition to be estimated in a continuous, trial-by-trial fashion, rather than as a binary variable that depends exclusively on the task structure. From then, we used this trial-by-trial estimate of p(rep) in a simple linear regression analysis to predict the trial-by-trial EEG activity, averaged between 300 and 400 ms post-stimulus, separately for two groups of electrodes covering parietal (P7, P8, PO7, and PO8) or central sites (C3, C4, CP3, CP4, CPz, and Cz). We note that these regressions took the ideal estimate of p(rep) as a predictor for the EEG as if no uncertainty was associated with this estimate, i.e., we regressed the EEG with the “best guess” (the Maximum Likelihood Estimator) of the Bayesian model about p(rep).
These trial-wise regressions were carried out independently for REP and ALT trials, and a comparison of the two intercepts gave an estimate of the main effect of repetition, whereas comparing the two slopes allowed us to assess the interaction between repetition and expectation. For both electrode groups, these single-trial analyses yielded comparable results to the ANOVA-based analyses described above, but with somewhat enhanced statistical significance. For parietal electrodes, the main effect of repetition was highly significant [F(1,12) = 21.9 p < 0.001], with a marginal effect of expectation [F(1,12) = 3.8, p < 0.08], but the interaction remained non-significant (p = 0.96). For central electrodes, there was a main effect of stimulus [F(1,12) = 21.9, p < 0.001], no effect of expectation (p = 0.46), and a repetition × expectation interaction [F(1,12) = 31.3, p < 1 × 10⁻⁶]. These results are shown in Figures 6A,B.
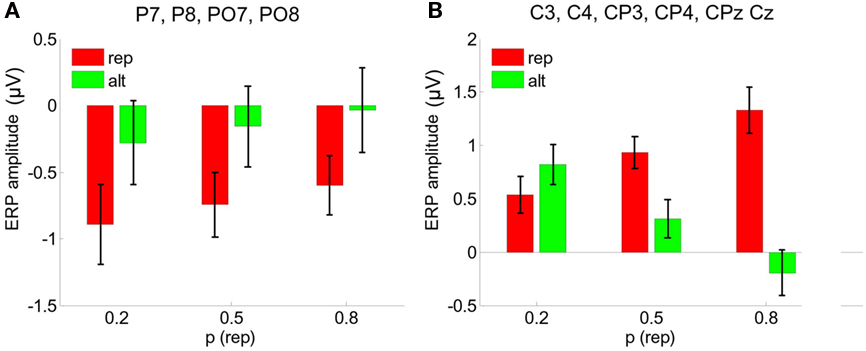
Figure 6. (A) Single-trial analyses averaged over parietal electrodes P7, P8, PO7, PO8. Bars show neural responses estimated from the best-fitting linear function relating the probability of repetition (from the Bayesian model) to ERP signals at the single-trial level. Values are plotted for 20%, 50%, and 80% probability of repetition. (B) Equivalent analyses for C3, C4, CP3, CP4, CPz, Cz.
Time-Frequency Analysis
Surprisingly little is known about how repetition influences the synchronization or desynchronisation of neural activity detectable in the scalp electroencephalogram. Here, we thus calculated changes in spectral power across the time-frequency spectrum (from 4 to 100 Hz) elicited by the second face in each of the crossed repetition and expectation conditions. This approach generates a large quantity of data, and in order to constrain our predictions we carried out targeted analyses averaged across the parieto-occipital and central electrode clusters employed above, in the theta (4–8 Hz), alpha/beta (9–35 Hz), and gamma (35–100 Hz) ranges at between 200 and 700 ms post-stimulus (Figures 7A,B). Searching more widely across the brain failed to reveal significant effects once appropriate statistical correction for multiple comparisons across time, frequency and electrodes had been imposed. We tested for the main effects of repetition, expectation, and volatility and their two- and three-way interactions using factorial ANOVAs. Because this analysis necessitated a number of (only partially independent) statistical tests, we only report results that breached a threshold of p < 0.0083 [i.e., p < 0.05/6], thereby implementing a Bonferroni correction for the 2 (electrode groups) × 3 (frequency bands) tested.
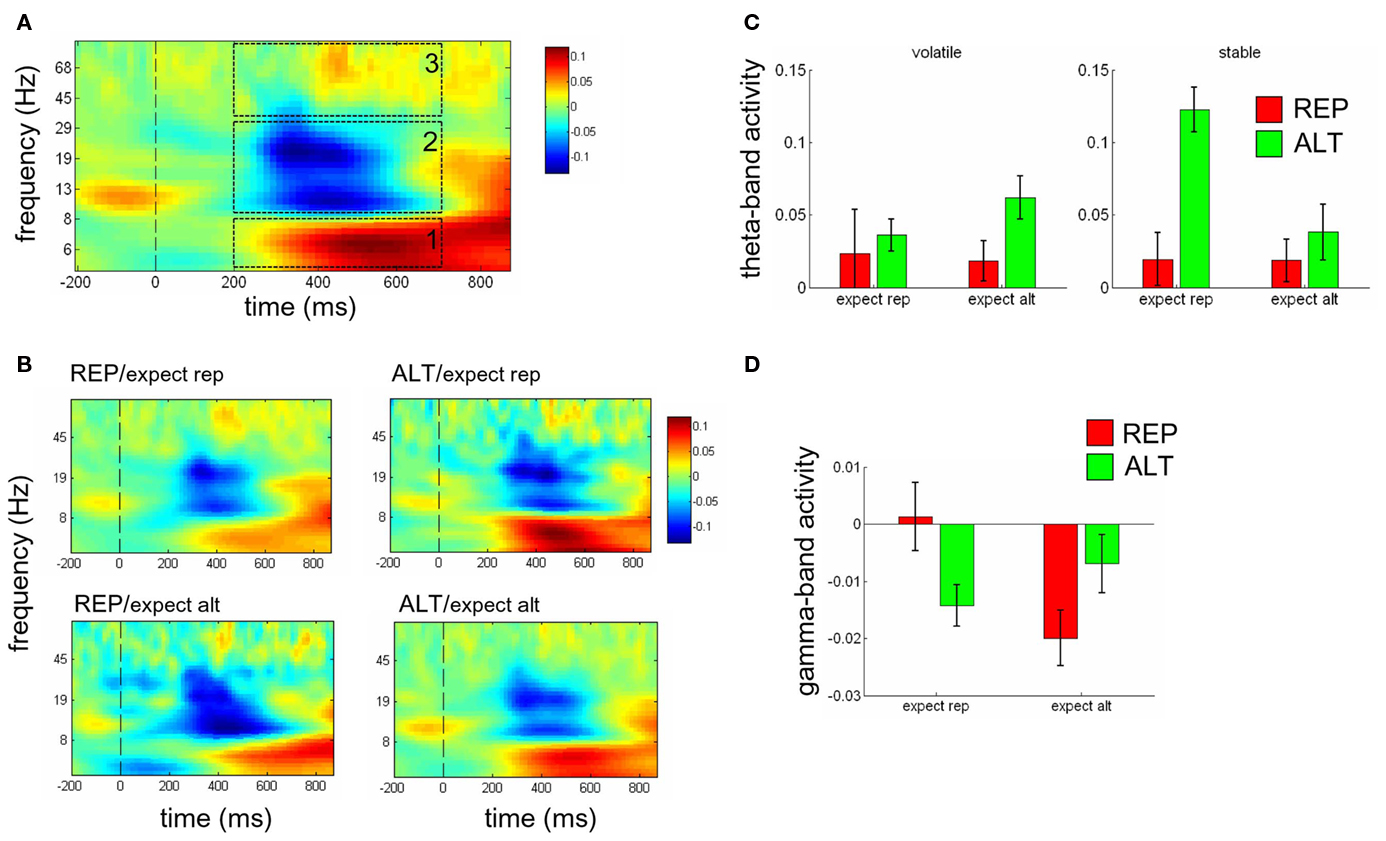
Figure 7. (A) Time-frequency plots showing average spectral power from 4 to 100 Hz (logarithmically spaced bands) for electrodes C3, C4, CP3, CP4, CPz, Cz across the epoch, averaged across conditions. Dashed boxes show the time-frequency regions of interest from 200 to 700 ms in the theta (1), alpha (2), beta (3), and gamma (4) bands. Vertical dashed line indicates onset of the second face. (B) Spectral power plotted separately for REP (left panels) and ALT (right panels) trials in contexts where repetitions were expected (upper panels) or unexpected (lower panels). Dashed black line at time = 0 indicates the onset of the second face. (C) Theta power values averaged across 200–800 ms post-stimulus [(within the dashed white box in (A)], for REP (red bars) and ALT (green bars) trials, in contexts where repetitions were expected (left bars in each panel) or unexpected (right bars in each panel), when the environment was volatile (left panel), or stable (right panel). (D) Gamma power values for REP (red bars) and ALT (green bars) trials in expect rep (left) and expect alt (right) contexts. Error bars show SEM.
For parietal electrodes, none of the comparisons reached statistical threshold. For central electrodes, we did not found any reliable effects in the alpha/beta band. We did however observe significant modulations of the theta-band activity and the gamma-band activity. We report these effects in turn.
In the theta-band, central electrodes exhibit a three-way interaction of repetition, expectation, and volatility [F(1,12) = 9.92, p < 0.008]; none of the other effects reached our significance threshold. Plotting the theta-band response to expected and unexpected ALT and REP trials when the environment was volatile (Figure 7C, left panel) and stable (Figure 7C, right panel) reveals that this three-way interaction was driven by a repetition × expectation interaction for stable trials [F(1,12) = 6.77, p < 0.024] but not for volatile trials (p = 0.64). Exploring beyond our parietal and central electrode groups, this effect became yet more pronounced over the frontal midline (“FM”; electrode FC3, FC4, FCz); however we omit these analyses in the interests of brevity.
In the gamma-band, we observed a significant repetition × expectation interaction [F(1,12) = 34.8, p < 0.0001], in the absence of any other significant effects. However, plotting the gamma-band response for expected and unexpected ALT and REP trials revealed that unlike for the ERP data, the interaction crossed over, such that gamma-band activity was relatively greater whenever expectations were satisfied [i.e., for REP/expect rep vs. ALT/expect rep, t(12) = 3.41, p < 0.004, and for ALT/expect alt vs. ALT/expect rep, t(12) = 3.52, p < 0.003]. This can be seen in Figure 7D. Although the profile of mean gamma power across conditions resembled the distribution of trial counts, no correlation across subjects was observed between gamma power and number of included trials (r = −0.15, p = 0.62), mitigating against the possibility that unexpected conditions contained too few trials to compute gamma power effectively.
Discussion
Previous work using fMRI with human participants has revealed that RS is sensitive to repetition probability, i.e., that expected repetitions give rise to stronger suppressive effects than unexpected repetitions (Summerfield et al., 2008; Larsson and Smith, 2011). Here, we extend this finding, showing that RS of ERPs recorded at the scalp is more pronounced when repetitions are expected. The data reported here also offer insights into the latency and topography of RS recorded with scalp ERPs, and its modulation by expectation. Finally, we show that theta-band EEG activity over the FM is also more sensitive to frequent than rare repetitions, but only when environmental volatility is low.
We first identified two main scalp sites at which strong differences in the ERP elicited by face repetitions and face alternations were observed. Repetition effects were observed at parietal electrodes (P7, P8, PO7, PO8) and at central electrodes (CP3, CP4, C3, C4, CPz, Cz) between ∼300 and 400 ms post-stimulus. These findings are consistent with an extensive literature that has documented the evoked neuroelectric response to faces, and described how these ERPs vary when faces are familiar or unfamiliar. Previous studies have repeatedly identified posterior evoked potentials that are more positive for unfamiliar than familiar faces at approximately 200–350 ms post-stimulus, and a central component that is more negative for unrepeated than repeated faces beginning at ∼350 ms post-stimulus (Barrett et al., 1988; George et al., 1997; Eimer, 2000; Itier and Taylor, 2002; Schweinberger et al., 2002a,b, 2004; Henson et al., 2003; Trenner et al., 2004).
Having isolated parietal and central ERPs that are sensitive to face repetition, we went on to test whether RS observed at these sites varied with repetition probability. Interestingly, for parietal electrodes, RS did not vary with repetition probability, but at central electrodes RS was considerably more pronounced when repetitions were expected than when they were unexpected (repetition × expectation interaction). This result was consistent irrespective of whether expectation was considered as a binary, blockwise factor (expect rep vs. expect alt) or whether the probability of repetition vs. alternation was parametrically estimated from the trial history using an ideal observer analysis (Behrens et al., 2007). Interestingly, in previous ERP studies of face repetition, this later component has been associated with processing of higher-order information about the face that is learned as the face is repeated in various contexts – e.g., the individual’s name, occupation or character (Schweinberger et al., 1995; Trenner et al., 2004) – much as the likelihood of repetition is learned via the statistical context provided by the sequence history in our task. These authors have associated this late face-evoked component with the N400 more classically found to respond to semantically deviant words (Kutas and Hillyard, 1980; Kutas and Federmeier, 2011). A related possibility is that this negativity for alternations is related to the mismatch negativity (Baldeweg, 2007), although this potential, even in the visual domain, often occurs earlier than the central effects described here (Pazo-Alvarez et al., 2003), and has a more posterior topography, with putative generators in early visual regions (Heslenfeld, 2002; Stefanics et al., 2011). Note that the component observed here to respond to expectation × repetition is more positive for familiar than unfamiliar faces, and does not thus reflect a classical P3 component (Donchin et al., 1978), which is known to exhibit a higher amplitude to more surprising stimuli (Mars et al., 2008).
Nevertheless, the very limited localization afforded by scalp EEG leaves unresolved the question of where these face-related potentials originate in the cortex. Drawing upon a substantial neuroimaging literature, many authors have proposed that extrastriate or superior temporal sites that respond prominently to faces in fMRI studies may be a good candidate sources for face-evoked potentials observed both over posterior regions and at the midline. Previous studies using complementary methods such as intra-cranial recordings (Rosburg et al., 2010), or EEG in conjunction with source localization (Schweinberger et al., 2002b; Shibata et al., 2002; Deffke et al., 2007) have identified the fusiform region as a major generator of face-evoked potentials occurring at approximately the latency of those discussed here. However, other studies using more sophisticated modeling of EEG and MEG data suggest that multiple posterior cortical sites may contribute (Watanabe et al., 2005; Henson et al., 2009). Indeed, faces (relative to other objects) elicit heightened BOLD signals in a wide range of cortical regions, including extrastriate, superior temporal lobe, medial temporal lobe, and prefrontal cortex (Ishai, 2008). One further consideration is that the relatively sharp dissociation in our data between the pattern of results observed at parieto-occipital sites (where there was a strong main effect of repetition, but no interaction with expectation) and that observed at central sites (where there was a strong repetition × expectation interaction) may suggest their origin lies in each case relatively close to the scalp maxima – not in a relatively distant portion of the extrastriate visual cortex. Thus, although our previous work with fMRI identified FFA (and primary visual cortex) as the only regions responding to the interaction of face × repetition (Summerfield et al., 2008), a finding we have subsequently replicated (unpublished observations), we acknowledge that it is difficult to draw any firm conclusions about the neuroanatomical origins of the effects described here. It thus falls to future studies, perhaps with MEG, to pinpoint more carefully the precise neural origin of the effects described in the current report.
The finding that expectation and repetition interact in modulating late ERP components is also consistent three recent EEG/MEG studies involving humans. Valentini et al. (2011) examined inter- and intra-modal habituation of laser-evoked and auditory potentials, demonstrating that expectations about the modality of the repeated stimulus modulated the amplitude of the habituation response. The authors found that differences between within-modality and between-modality evoked potentials at 200–400 ms post-stimulus were enhanced when participants expected stimulation in that modality, in a close parallel to the data reported here. In another recent report (Todorovic et al., 2011), expectation modulated RS of auditory evoked potentials observed using MEG, although these effects occurred somewhat earlier, perhaps because stimuli were presented in the auditory modality. Thirdly, a recent study in which colored stimuli alternated or repeated with varying probability demonstrated that the mismatch negativity elicited by alternating colors (red–green pairs rather than red–red or green–green) was heightened when those pairs were very rare (10%) compared to when they were less rare (30%) or equiprobable (Stefanics et al., 2011). These effects also occurred early (<200 ms post-stimulus) and were prominent over primary sensory regions; again, this may reflect the fact that stimuli differed on a basic feature dimension, i.e., color. Taken together with our work, however, these findings support the view that RS in humans is not a mere function of the biophysics of sensory neurons, or a product of local network interactions that automatically and inevitably succeed sensory processing. Rather, RS depends on the context provided by recent learning about the probability that an event will repeat or change.
The finding that RS is modulated by expectation contradicts, however, a recent report in which single-cell recordings from macaque area IT were used to assess whether RS varied with expectation at the single-neuron level (Kaliukhovich and Vogels, 2010), where a main effect of repetition, but no interaction with expectation, is reported. The reason for this discrepancy remains unexplained, but the EEG data reported here offer new insights relevant to the question. Firstly, the finding that RS is modulated by expectation in human participants using both EEG and fMRI demonstrates that previously observed repetition × expectation interaction is not a curiosity of the BOLD signal, but is also visible in directly measured neural activity in humans. Secondly, although we observed RS both early (on the P100 at occipital electrodes) and late (at >300 ms), in the current study only the later potential at central electrodes was modulated by expectation. One likely explanation is that expectation does not modulate the initial, feedforward sweep of processing through the visual system, but rather, may reflect modulatory, top-down processes that index the updating of information about the environment. Interestingly, the main effect of RS on IT firing rates reported by Kaliukhovich and Vogels (2010) emerged early (at ∼100 ms) and was relatively short-lived (lasting until 300–350 ms post-stimulus); one possibility is that the neurons recorded in that report may be among those contributing to the earlier RS effects observed here over posterior electrodes (at 100–200 ms), which also remained unmodulated in our EEG study. In other words, early spiking activity may habituate automatically, but sustained, post-synaptic activity may not. This would be consistent with our previous results with fMRI, given that the BOLD signal may preferentially index reentrant processes or sustained network interactions over input-related spiking activity (Logothetis et al., 2001).
However, this explanation cannot account for the fact that Kaliukhovich and Vogels (2010) also found that high-frequency (gamma-band) oscillatory activity in the LFP also adapted in an automatic, expectation-independent fashion. Here, we observed sustained, induced gamma-band activity that responded to the crossover interaction between repetition and expectation; in other words, gamma-band responses were more pronounced for REP trials in expect rep conditions, and ALT trials in expect alt conditions. Gamma-band responses have previously been associated with the satisfaction of expectations in a similar manner (Herrmann et al., 2004). However, we interpret these data with extreme caution, because high-frequency activity recorded with scalp EEG is not only elusive but hard to interpret, as it may reflect potentials generated by extra-ocular muscles or other artifacts (Yuval-Greenberg et al., 2008); although other views exist (Schwartzman and Kranczioch, 2011).
Moreover, other explanations for the discrepancy between our findings and those of Kaliukhovich and Vogels (2010) remain possible. It could be, for example, that the monkeys failed to learn the contingencies, or that the effects described here are not generally applicable to visual processing but apply only to faces. Further studies are required to rule out these interpretations; fMRI studies in non-human primates would be particularly useful in this regard.
One proposal that helps explain the current findings argues that RS is due to a reduction in the surprise elicited by repeated relating relative to alternating stimuli (Henson, 2003; Friston, 2005). The logic of this interpretation is that the level of surprise elicited by the novel, unrepeated stimulus will depend on the context provided by the trial history. Where alternations are more frequent than repetitions, surprise elicited by an alternation should be reduced, and hence RS attenuated. However, it may be appropriate here to mention the caveat that whilst the type of hierarchical inference in the visual system proposed by “predictive” models of perception (Mumford, 1992; Friston, 2005) may require information about the recent stimulation history to mediate short-term synaptic changes that engender more accurate predictions, the type of information on which predictions might be conditioned remains unknown. Indeed, the effect of expectation in our task is a relatively high-order statistical quantity probably associated with integration of information over the extended stimulation history, and quite possibly computed outside the visual system. In other words, even if RS were immune to the impact of expectation, this would not require us to rule out predictive models of perception en masse.
Interestingly, this information theoretic account permits us to make a new prediction, concerning the rate of change of the probability of repetition across trials (the “volatility” of the relevant expectation). Environmental volatility determines how surprising information should be interpreted, because surprising events occurring in a stable environment are more indicative of a change in the true, underlying state of world, whereas in a volatile environment, surprising events may simply reflect noise (Yu and Dayan, 2005; Behrens et al., 2007). If RS occurs because alternations are more surprising than repetitions, then it follows that the modulation of repetition by expectation will be heightened in stable relative to volatile environments (repetition × expectation × volatility interaction). We thus measured the modulation of RS by expectation separately for trials occurring during relatively volatile periods (reversal of probability of repetition every 10 trials) and during relatively stable periods (reversal every 30–40 trials). At central electrodes, expectation modulated RS reliably during stable periods, and no reliable modulation was observed during volatile periods. However, the three-way interaction fell short of significance, precluding strong conclusions being drawn from this pattern of data.
However, when we turned to the estimation of theta-band spectral power in each condition, a different pattern emerged. Theta-band activity was sensitive to the three-way interaction between repetition, expectation, and volatility: it was reduced on repetitions relative to alternations only when the repetitions were expected, and only the environment was stable – i.e., when the alternation was not only most surprising, but also prompted the most radical revision of the observers’ statistical model of the environment. The functional significance of theta-band activity over central and FM scalp sites remains to be fully described; early reports emphasized its contribution to attention, working memory, or episodic encoding, in particular of novel or unexpected events (Klimesch, 1996; Gevins et al., 1997; Bastiaansen and Hagoort, 2003; Summerfield and Mangels, 2005). Recent work has drawn a link between FM theta and the error-related signals recorded in the evoked potential (Trujillo and Allen, 2007; Cohen et al., 2008; Womelsdorf et al., 2010a), or to prediction error signals arising in the context of reward-guided learning (Cavanagh et al., 2010; Womelsdorf et al., 2010b). These findings suggest that theta-band activity may play a key role in the monitoring, adjustment, and updating mechanisms by which we learn the value of actions (Ridderinkhof et al., 2004; Rushworth and Behrens, 2008), a view which is commensurate with a source for FM theta in the anterior midline structures of the medial prefrontal and anterior cingulate cortices. Indeed, intra-cranial recordings highlight the cingulate cortex and surrounding medial cortical zones as likely contributors to the prominent theta rhythm recorded over FM electrodes (Tsujimoto et al., 2006; Cohen et al., 2008). We thus observed signals that varied with the extent to which a participant learns new information from the statistical structure of the environment, but this yet higher-order statistical information probably arose in the medial PFC, and not in the ventral visual areas. We should also emphasize that although the faces were presented incidentally in our paradigm, whether this learning was achieved implicitly or explicitly remains an open question for future investigations.
To conclude, we report evidence that neural repetition effects observable directly at the human scalp index not only bottom-up stimulus information, but are also modulated by higher-order statistical information about the probability that a repetition will occur. Like other studies, we found widespread modulation of face-evoked potentials by face repetition, and potentials occurring more posteriorly were insensitive to the probability of repetition – a finding which can be explained by traditional habituation-based accounts of RS. Over central electrodes, however, we report signals that were sensitive to the (first order) expectation that a repetition would occur. Finally, we identified a third class of response, expressed in spectral power in the theta-band over central electrode sites, which was also modulated by a second order expectation (the volatility in the environment). Overall, our results are consistent with previous work showing that RS of BOLD signals in the fusiform cortices vary with the probability of repetition (Summerfield et al., 2008; Larsson and Smith, 2011), and support the view that RS is at least in part driven by top-down factors.
Conflict of Interest Statement
The authors declare that the research was conducted in the absence of any commercial or financial relationships that could be construed as a potential conflict of interest.
Acknowledgments
We thank Tobias Egner for comments on the manuscript. This work was supported by Wellcome Trust Award WT092646AIA to Christopher Summerfield.
References
Baldeweg, T. (2007). ERP repetition effects and mismatch negativity generation. J. Psychophysiol. 21, 204–213.
Barrett, S. E., Rugg, M. D., and Perrett, D. I. (1988). Event-related potentials and the matching of familiar and unfamiliar faces. Neuropsychologia 26, 105–117.
Bastiaansen, M., and Hagoort, P. (2003). Event-induced theta responses as a window on the dynamics of memory. Cortex 39, 967–992.
Behrens, T. E. J., Woolrich, M. W., Walton, M. E., and Rushworth, M. F. S. (2007). Learning the value of information in an uncertain world. Nat. Neurosci. 10, 1214–1221.
Bentley, P., Vuilleumier, P., Thiel, C. M., Driver, J., and Dolan, R. J. (2003). Effects of attention and emotion on repetition priming and their modulation by cholinergic enhancement. J. Neurophysiol. 90, 1171–1181.
Boorman, E. D., Behrens, T. E. J., Woolrich, M. W., and Rushworth, M. F. S. (2009). How green is the grass on the other side? Frontopolar cortex and the evidence in favor of alternative courses of action. Neuron 62, 733–743.
Burgess, A. P., and Gruzelier, J. H. (1999). “Methodological advances in the analysis of event-related desynchronisation data: reliability and robust analysis,” in Event-Related Desynchronisation (ERD), Handbook of Electroencephalography and Clinical Neurophysiology, eds G. Pfurtscheller and F. H. Lopes Da Silva (Amsterdam: Elsevier), 139–160.
Carandini, M., and Ferster, D. (1997). A tonic hyperpolarization underlying contrast adaptation in cat visual cortex. Science 276, 949–952.
Cavanagh, J. F., Frank, M. J., Klein, T. J., and Allen, J. J. (2010). Frontal theta links prediction errors to behavioral adaptation in reinforcement learning. Neuroimage 49, 3198–3209.
Chee, M. W., and Tan, J. C. (2007). Inter-relationships between attention, activation, fMR adaptation and long-term memory. Neuroimage 37, 1487–1495.
Cohen, M. X., Ridderinkhof, K. R., Haupt, S., Elger, C. E., and Fell, J. (2008). Medial frontal cortex and response conflict: evidence from human intracranial EEG and medial frontal cortex lesion. Brain Res. 1238, 127–142.
De Baene, W., and Vogels, R. (2010). Effects of adaptation on the stimulus selectivity of macaque inferior temporal spiking activity and local field potentials. Cereb. Cortex 20, 2145–2165.
Deffke, I., Sander, T., Heidenreich, J., Sommer, W., Curio, G., Trahms, L., and Lueschow, A. (2007). MEG/EEG sources of the 170-ms response to faces are co-localized in the fusiform gyrus. Neuroimage 35, 1495–1501.
Delorme, A., and Makeig, S. (2004). EEGLAB: an open source toolbox for analysis of single-trial EEG dynamics including independent component analysis. J. Neurosci. Methods 134, 9–21.
Desimone, R. (1996). Neural mechanisms for visual memory and their role in attention. Proc. Natl. Acad. Sci. U.S.A. 93, 13494–13499.
Dobbins, I. G., Schnyer, D. M., Verfaellie, M., and Schacter, D. L. (2004). Cortical activity reductions during repetition priming can result from rapid response learning. Nature 428, 316–319.
Donchin, E., Ritter, W., and Mc Callum, W. C. (1978). “Cognitive psychophysiology: the endogenous components of the ERP,” in Event-related Brain Potentials in Man, eds E. Callaway, P. Tueting and S. H. Koslow (New York: Academic Press), 349–411.
Eimer, M. (2000). Event-related brain potentials distinguish processing stages involved in face perception and recognition. Clin. Neurophysiol. 111, 694–705.
Friston, K. (2005). A theory of cortical responses. Philos. Trans. R. Soc. Lond. B Biol. Sci. 360, 815–836.
George, N., Jemel, B., Fiori, N., and Renault, B. (1997). Face and shape repetition effects in humans: a spatio-temporal ERP study. Neuroreport 8, 1417–1423.
Gevins, A., Smith, M. E., McEvoy, L., and Yu, D. (1997). High-resolution EEG mapping of cortical activation related to working memory: effects of task difficulty, type of processing, and practice. Cereb. Cortex 7, 374–385.
Grill-Spector, K., Henson, R., and Martin, A. (2006). Repetition and the brain: neural models of stimulus-specific effects. Trends Cogn. Sci. (Regul. Ed.) 10, 14–23.
Gross, C. G., Schiller, P. H., Wells, C., and Gerstein, G. L. (1967). Single-unit activity in temporal association cortex of the monkey. J. Neurophysiol. 30, 833–843.
Henson, R. N., Goshen-Gottstein, Y., Ganel, T., Otten, L. J., Quayle, A., and Rugg, M. D. (2003). Electrophysiological and haemodynamic correlates of face perception, recognition and priming. Cereb. Cortex 13, 793–805.
Henson, R. N., and Mouchlianitis, E. (2007). Effect of spatial attention on stimulus-specific haemodynamic repetition effects. Neuroimage 35, 1317–1329.
Henson, R. N., Mouchlianitis, E., and Friston, K. J. (2009). MEG and EEG data fusion: simultaneous localisation of face-evoked responses. Neuroimage 47, 581–589.
Herrmann, C. S., Munk, M. H., and Engel, A. K. (2004). Cognitive functions of gamma-band activity: memory match and utilization. Trends Cogn. Sci. (Regul. Ed.) 8, 347–355.
Heslenfeld, D. J. (2002). “Visual mismatch negativity,” in Detection of Change: Event-related Potential and fMRI Findings, ed. J. Polich (Dordrecht: Kluwer), 41–60.
Itier, R. J., and Taylor, M. J. (2002). Inversion and contrast polarity reversal affect both encoding and recognition processes of unfamiliar faces: a repetition study using ERPs. Neuroimage 15, 353–372.
Joyce, C., and Rossion, B. (2005). The face-sensitive N170 and VPP components manifest the same brain processes: the effect of reference electrode site. Clin. Neurophysiol. 116, 2613–2631.
Kaliukhovich, D. A., and Vogels, R. (2010). Stimulus repetition probability does not affect repetition suppression in macaque inferior temporal cortex. Cereb. Cortex 21, 1547–1558.
Klimesch, W. (1996). Memory processes, brain oscillations and EEG synchronization. Int. J. Psychophysiol. 24, 61–100.
Kriegeskorte, N., Simmons, W. K., Bellgowan, P. S., and Baker, C. I. (2009). Circular analysis in systems neuroscience: the dangers of double dipping. Nat. Neurosci. 12, 535–540.
Kutas, M., and Federmeier, K. D. (2011). Thirty years and counting: finding meaning in the N400 component of the event-related brain potential (ERP). Annu. Rev. Psychol. 62, 621–647.
Kutas, M., and Hillyard, S. A. (1980). Reading senseless sentences: brain potentials reflect semantic incongruity. Science 207, 203–205.
Larsson, J., and Smith, A. T. (2011). fMRI repetition suppression: neuronal adaptation or stimulus expectation? Cereb. Cortex. [Epub ahead of print].
Logothetis, N. K., Pauls, J., Augath, M., Trinath, T., and Oeltermann, A. (2001). Neurophysiological investigation of the basis of the fMRI signal. Nature 412, 150–157.
Mars, R. B., Debener, S., Gladwin, T. E., Harrison, L. M., Haggard, P., Rothwell, J. C., and Bestmann, S. (2008). Trial-by-trial fluctuations in the event-related electroencephalogram reflect dynamic changes in the degree of surprise. J. Neurosci. 28, 12539–12545.
Miller, E. K., Li, L., and Desimone, R. (1991). A neural mechanism for working and recognition memory in inferior temporal cortex. Science 254, 1377–1379.
Mumford, D. (1992). On the computational architecture of the neocortex. II. The role of cortico-cortical loops. Biol. Cybern. 66, 241–251.
Murray, S. O., and Wojciulik, E. (2004). Attention increases neural selectivity in the human lateral occipital complex. Nat. Neurosci. 7, 70–74.
Naatanen, R., and Picton, T. (1987). The N1 wave of the human electric and magnetic response to sound: a review and an analysis of the component structure. Psychophysiology 24, 375–425.
Nagy, M. E., and Rugg, M. D. (1989). Modulation of event-related potentials by word repetition: the effects of inter-item lag. Psychophysiology 26, 431–436.
Nichols, T. E., and Holmes, A. P. (2002). Nonparametric permutation tests for functional neuroimaging: a primer with examples. Hum. Brain Mapp. 15, 1–25.
Pazo-Alvarez, P., Cadaveira, F., and Amenedo, E. (2003). MMN in the visual modality: a review. Biol. Psychol. 63, 199–236.
Ridderinkhof, K. R., Ullsperger, M., Crone, E. A., and Nieuwenhuis, S. (2004). The role of the medial frontal cortex in cognitive control. Science 306, 443–447.
Rosburg, T., Ludowig, E., Dumpelmann, M., Alba-Ferrara, L., Urbach, H., and Elger, C. E. (2010). The effect of face inversion on intracranial and scalp recordings of event-related potentials. Psychophysiology 47, 147–157.
Rushworth, M. F., and Behrens, T. E. (2008). Choice, uncertainty and value in prefrontal and cingulate cortex. Nat. Neurosci. 11, 389–397.
Sawamura, H., Orban, G. A., and Vogels, R. (2006). Selectivity of neuronal adaptation does not match response selectivity: a single-cell study of the FMRI adaptation paradigm. Neuron 49, 307–318.
Schwartzman, D. J., and Kranczioch, C. (2011). In the blink of an eye: the contribution of microsaccadic activity to the induced gamma band response. Int. J. Psychophysiol. 79, 73–82.
Schweinberger, S. R., Huddy, V., and Burton, A. M. (2004). N250r: a face-selective brain response to stimulus repetitions. Neuroreport 15, 1501–1505.
Schweinberger, S. R., Pfutze, E. M., and Sommer, W. (1995). Repetition priming and associative priming of face recognition – evidence from event-related potentials. J. Exp. Psychol. Learn. Mem. Cogn. 21, 722–736.
Schweinberger, S. R., Pickering, E. C., Burton, A. M., and Kaufmann, J. M. (2002a). Human brain potential correlates of repetition priming in face and name recognition. Neuropsychologia 40, 2057–2073.
Schweinberger, S. R., Pickering, E. C., Jentzsch, I., Burton, A. M., and Kaufmann, J. M. (2002b). Event-related brain potential evidence for a response of inferior temporal cortex to familiar face repetitions. Brain Res. Cogn. Brain Res. 14, 398–409.
Shibata, T., Nishijo, H., Tamura, R., Miyamoto, K., Eifuku, S., Endo, S., and Ono, T. (2002). Generators of visual evoked potentials for faces and eyes in the human brain as determined by dipole localization. Brain Topogr. 15, 51–63.
Sirotin, Y. B., and Das, A. (2009). Anticipatory haemodynamic signals in sensory cortex not predicted by local neuronal activity. Nature 457, 475–479.
Stefanics, G., Kimura, M., and Czigler, I. (2011). Visual mismatch negativity reveals automatic detection of sequential regularity violation. Front. Hum. Neurosci. 5:46.
Summerfield, C., and Mangels, J. A. (2005). Coherent theta-band EEG activity predicts item-context binding during encoding. Neuroimage 24, 692–703.
Summerfield, C., Trittschuh, E. H., Monti, J. M., Mesulam, M. M., and Egner, T. (2008). Neural repetition suppression reflects fulfilled perceptual expectations. Nat. Neurosci. 11, 1004–1006.
Sutton, S., Braren, M., Zubin, J., and John, E. R. (1965). Evoked-potential correlates of stimulus uncertainty. Science 150, 1187–1188.
Todorovic, A., van Ede, F., Maris, E., and de Lange, F. P. (2011). Prior expectation mediates neural adaptation to repeated sounds in the auditory cortex: an MEG study. J. Neurosci. 31, 9118–9123.
Torrence, C., and Compo, G. P. (1998). A practical guide to wavelet analysis. Bull. Am. Meteor. Soc. 79, 61–78.
Trenner, M. U., Schweinberger, S. R., Jentzsch, I., and Sommer, W. (2004). Face repetition effects in direct and indirect tasks: an event-related brain potentials study. Brain Res. Cogn. Brain Res. 21, 388–400.
Trujillo, L. T., and Allen, J. J. (2007). Theta EEG dynamics of the error-related negativity. Clin. Neurophysiol. 118, 645–668.
Tsujimoto, T., Shimazu, H., and Isomura, Y. (2006). Direct recording of theta oscillations in primate prefrontal and anterior cingulate cortices. J. Neurophysiol. 95, 2987–3000.
Valentini, E., Torta, D. M., Mouraux, A., and Iannetti, G. D. (2011). Dishabituation of laser-evoked EEG responses: dissecting the effect of certain and uncertain changes in stimulus modality. J. Cogn. Neurosci. [Epub ahead of print].
Vuilleumier, P., Schwartz, S., Duhoux, S., Dolan, R. J., and Driver, J. (2005). Selective attention modulates neural substrates of repetition priming and “implicit” visual memory: suppressions and enhancements revealed by FMRI. J. Cogn. Neurosci. 17, 1245–1260.
Watanabe, S., Miki, K., and Kakigi, R. (2005). Mechanisms of face perception in humans: a magneto- and electro-encephalographic study. Neuropathology 25, 8–20.
Wiggs, C. L., and Martin, A. (1998). Properties and mechanisms of perceptual priming. Curr. Opin. Neurobiol. 8, 227–233.
Womelsdorf, T., Johnston, K., Vinck, M., and Everling, S. (2010a). Theta-activity in anterior cingulate cortex predicts task rules and their adjustments following errors. Proc. Natl. Acad. Sci. U.S.A. 107, 5248–5253.
Womelsdorf, T., Vinck, M., Leung, L. S., and Everling, S. (2010b). Selective theta-synchronization of choice-relevant information subserves goal-directed behavior. Front. Hum. Neurosci. 4:210.
Yi, D. J., and Chun, M. M. (2005). Attentional modulation of learning-related repetition attenuation effects in human parahippocampal cortex. J. Neurosci. 25, 3593–3600.
Keywords: repetition suppression, expectation, electroencephalography, event-related potentials, Bayesian modeling, theta-band activity
Citation: Summerfield C, Wyart V, Johnen VM and de Gardelle V (2011) Human scalp electroencephalography reveals that repetition suppression varies with expectation. Front. Hum. Neurosci. 5:67. doi: 10.3389/fnhum.2011.00067
Received: 11 March 2011; Accepted: 14 July 2011;
Published online: 28 July 2011.
Edited by:
Francisco Barcelo, University of Illes Balears, SpainReviewed by:
Juliana Yordanova, Bulgarian Academy of Sciences, BulgariaRik Henson, University of Cambridge, UK
Copyright: © 2011 Summerfield, Wyart, Johnen and de Gardelle. This is an open-access article subject to a non-exclusive license between the authors and Frontiers Media SA, which permits use, distribution and reproduction in other forums, provided the original authors and source are credited and other Frontiers conditions are complied with.
*Correspondence: Christopher Summerfield, Department of Experimental Psychology, University of Oxford, South Parks Road, Oxford, UK. e-mail: christopher.summerfield@psy.ox.ac.uk