A data-driven investigation of gray matter–function correlations in schizophrenia during a working memory task
- 1 The Mind Research Network, Albuquerque, NM, USA
- 2 Department of Psychiatry, Massachusetts General Hospital, Harvard Medical School, Boston, MA, USA
- 3 Department of Child and Adolescent Psychiatry, University Hospital Carl Gustav Carus, Dresden University of Technology, Dresden, Germany
- 4 Departments of Psychiatry and Neurobiology, Yale School of Medicine, New Haven, CT, USA
- 5 Olin Center, Institute of Living, Hartford, CT, USA
- 6 Department of Child and Adolescent Psychiatry, Erasmus Medical Center, Rotterdam, Netherlands
- 7 Department of Psychiatry, University of Minnesota, Minneapolis, MN, USA
- 8 Department of Psychiatry, University of Iowa, Iowa City, IA, USA
- 9 Center for Vital Longevity, University of Texas at Dallas, Dallas, TX, USA
- 10 Department of Electrical and Computer Engineering, University of New Mexico, Albuquerque, NM, USA
The brain is a vastly interconnected organ and methods are needed to investigate its long range structure(S)–function(F) associations to better understand disorders such as schizophrenia that are hypothesized to be due to distributed disconnected brain regions. In previous work we introduced a methodology to reduce the whole brain S–F correlations to a histogram and here we reduce the correlations to brain clusters. The application of our approach to sMRI [gray matter (GM) concentration maps] and functional magnetic resonance imaging data (general linear model activation maps during Encode and Probe epochs of a working memory task) from patients with schizophrenia (SZ, n = 100) and healthy controls (HC, n = 100) presented the following results. In HC the whole brain correlation histograms for GM–Encode and GM–Probe overlap for Low and Medium loads and at High the histograms separate, but in SZ the histograms do not overlap for any of the load levels and Medium load shows the maximum difference. We computed GM–F differential correlation clusters using activation for Probe Medium, and they included regions in the left and right superior temporal gyri, anterior cingulate, cuneus, middle temporal gyrus, and the cerebellum. Inter-cluster GM–Probe correlations for Medium load were positive in HC but negative in SZ. Within group inter-cluster GM–Encode and GM–Probe correlation comparisons show no differences in HC but in SZ differences are evident in the same clusters where HC vs. SZ differences occurred for Probe Medium, indicating that the S–F integrity during Probe is aberrant in SZ. Through a data-driven whole brain analysis approach we find novel brain clusters and show how the S–F differential correlation changes during Probe and Encode at three memory load levels. Structural and functional anomalies have been extensively reported in schizophrenia and here we provide evidences to suggest that evaluating S–F associations can provide important additional information.
Introduction
Patients with schizophrenia (SZ) often experience positive, negative, and disorganized symptoms, as well as a broad range of cognitive impairments (Heinrichs and Zakzanis, 1998). Working memory (WMem) is one of the cognitive domains that is severely affected in schizophrenia and has been of considerable interest as it serves as a building block for higher order cognitive function (Park and Holzman, 1992; Goldman-Rakic, 1994; Perlstein et al., 2001). It is characterized as the process of temporarily storing information to execute information processing tasks (Baddeley, 1992; Manoach, 2003). The core processes of WMem include encoding, retrieval, and rehearsal represent primary cognitive operations of the human brain (Menon et al., 2001) and are essential to goal-directed behavior and other cognitive functions (Silver et al., 2003). SZ have difficulties in retrieving, processing information, and rehearsing in memory a concept or idea to guide their behavior (Goldman-Rakic and Selemon, 1997). Understanding the underlying neurobiology of WMem and its abnormalities in schizophrenia may help understand the symptoms of schizophrenia such as disorganized thinking and speaking (Perlstein et al., 2001). Medicated, unmedicated, and medication-naive SZ (Barch et al., 2001) and unaffected relatives (Meda et al., 2008a) of SZ have all shown insufficiency in WMem.
Neuroimaging studies of WMem, particularly functional magnetic resonance imaging (fMRI), report abnormalities in schizophrenia. It has been established that WMem deficits in schizophrenia are associated with dysfunction of a neural circuit that includes the dorsolateral prefrontal cortex (DLPFC) and other domains (Manoach et al., 1999; Schlösser et al., 2003; Meda et al., 2009). In addition to functional changes, structural abnormalities also play a significant role in the pathology of schizophrenia (Shenton et al., 2001). Structural and gray matter (GM) abnormalities that have been reported include enlarged ventricles, reduced volume of the temporal lobe (in particular the superior temporal gyrus), and frontal lobe, evidence for cavum septi pellucidi and abnormalities in basal ganglia, corpus callosum, thalamus, and cerebellum (Wright et al., 2000; Shenton et al., 2001; Honea et al., 2005). In a meta-analysis it was demonstrated that patients had reduced GM density relative to control subjects in a distributed network of regions, including bilateral insular cortex, anterior cingulate, left parahippocampal gyrus, left middle frontal gyrus, postcentral gyrus, and thalamus (Glahn et al., 2008).
With such strong evidence of GM deficits and fMRI abnormalities in schizophrenia, it is important to investigate if differential structure–function relationships exist between healthy controls (HC) and SZ. Given the wealth of data on both structural and functional abnormalities in schizophrenia, it is surprising that there is little work connecting these two imaging modalities. Several studies evaluated spatially specific areas of GM deficiency and related it to neuropsychological performance. Studies have demonstrated that correlation between GM and cognitive performance, including verbal, spatial, and WMem varied in SZ (Gur et al., 1999; Molina et al., 2009). Surface-wide methods were used to demonstrate abnormal associations between cognitive impairment and reduced cortical thickness in SZ patients of the same cohort as used in this study (Ehrlich et al., 2011). We investigated whole brain structure–function relationships for a sensory motor task and found that the overall correlations were weaker in SZ than HC (Michael et al., 2010).
The brain is vastly interconnected, and local brain morphology may influence functional activity at distant regions. In addition, no single brain region has been found to be responsible for the symptoms of schizophrenia. The disconnection hypothesis (Friston, 1998) and cognitive dysmetria theory (Andreasen et al., 1996) of schizophrenia state that neural mechanisms in schizophrenia are not localized to any one area alone, but rather it is the integrity of the interconnections between brain regions that is compromised. In this study we first compute whole brain correlations between a measure of brain structure (GM concentration) and functional activity [general linear model (GLM) activation measured for a WMem task]. We then reduce the whole brain correlations to structure/function clusters through a simple, yet effective, data-driven method, and then evaluate changes of inter–cluster structure–function correlations during Probe and Encode at different load levels and compare the correlations between HC and SZ.
Materials and Methods
Participants
Subjects for this study were recruited and scanned at four different sites: the University of Iowa (UI), Harvard’s Massachusetts General Hospital (MGH), the University of Minnesota (UMN), and the University of New Mexico (UNM). These subjects were scanned as part of the carefully planned and calibrated MCIC (Mind Clinical Image Consortium) multisite study. Patients were recruited from inpatient and outpatient psychiatric clinics, group homes, referrals from physicians, advertisements, and by word-of-mouth. Controls were recruited from advertisements, fliers, and word-of-mouth. All participants provided written, informed, IRB approved consent at their respective sites and received a small compensation for participation. Study subjects had normal hearing (by self-report) and were able to carry out the WMem fMRI task. HC were screened to ensure they were free from any axis I or axis II psychiatric disorders based upon the diagnostic and statistical manual of mental disorders (DSM-IV–TR; First et al., 1997). Diagnoses were assessed using either the structured clinical interview for the DSM-IV (SCID) or the comprehension assessment of symptoms and history (CASH; Andreasen et al., 1992). Controls were excluded if any of their first degree relatives had a history of psychosis.
A total of 100 SZ and 100 matched HC are analyzed and the site distribution of these subjects is as follows (SZ/HC): UI = 20/39; MGH = 22/11; UMN = 25/18; UNM = 33/32. These SZ and HC were selected from a total of 131 SZ and 138 HC. Thirty-one SZ and 19 HC were excluded after comparing their fMRI activation maps with the mean activation map of all subjects (subjects with a correlation of less than 0.3 were excluded). Upon visual inspection, fMRI activation maps of the excluded subjects had pronounced activation around the outer edge of the brain. We further excluded 19 HC for two reasons. First, to keep the number of subjects in each group the same so that the strength of within group structure–function correlation can be compared between the two groups. The second reason was to reduce demographic differences between the two groups. In the final cohort of SZ and HC age, handedness, and parental socioeconomic status were matched between the two groups. Gender and education were not matched because a large number of subjects need to be removed to match these two demographics. In the results section we regress out the demographics and site differences, to show that our results are independent of them. Subject demographics and clinical characteristics of the final cohort of subjects are presented in Table 1. During the period of data collection the patients received the following antipsychotic medications (number of subjects in parentheses, some patients were receiving more than one medication): clozapine (14), quetiapine (14), olanzapine (12), ziprasidone (4), risperidone (26), aripiprazole (12), perphenazine (1), haloperidol (3), thiothixene (1), fluphenazine (3), chlorpromazine (1), trifluoperazine (1), haloperidol decanoate (2), fluphenazine enanthate (1), and risperidone consta (5). Three patients had unknown drug information and 13 patients were not on antipsychotics.
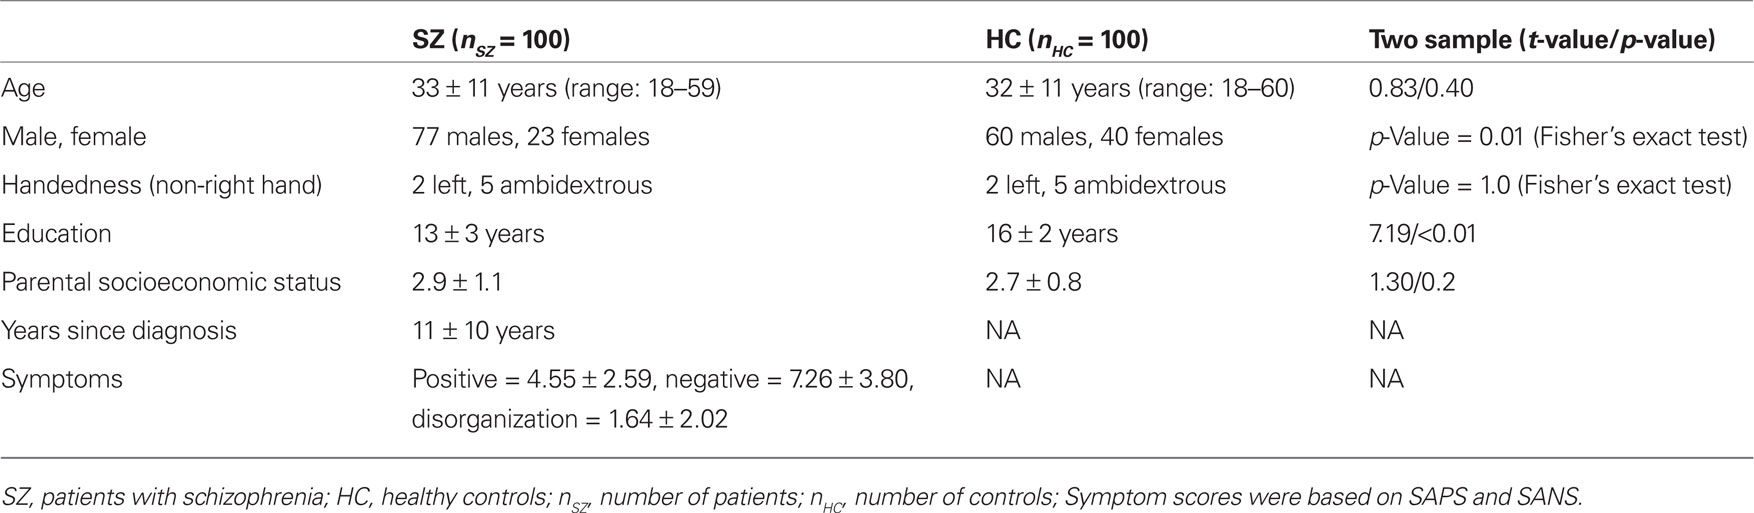
Table 1. Demographics of SZ and HC with symptom scores for SZ.
fMRI Task
Functional magnetic resonance imaging data were collected while subjects performed the Sternberg item recognition paradigm (SIRP) WMem task. SIRP is a continuous performance, choice reaction time task that requires WMem and reliably activates the DLPFC in normal subjects (Manoach et al., 1997, 1999, 2000; Rypma and D’Esposito, 1999; Johnson et al., 2006). In SIRP (Figure 1) a subject is required to maintain a set of digit/s for a brief period of time in WMem. SIRP consists of two epochs: Encode and Probe. During the Encode one of three WMem loads were presented in blocks: Low load (a single digit); Medium load (a set of three digits); and High load (a set of five digits). After a brief delay, during Probe a series of digits were sequentially presented and subjects were asked to respond with a right thumb trigger press if the Probe digit was a target or with a left trigger press if the Probe digit was a foil. The blocks of targets were presented during three separate runs and each run contained two blocks of the three loads (see Appendix for more details on the SIRP).
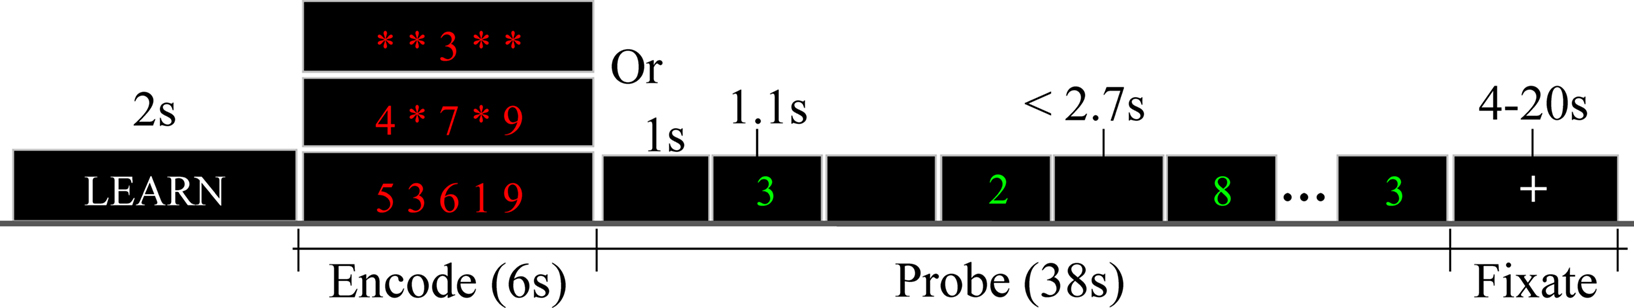
Figure 1. The Sternberg item recognition paradigm (SIRP) fMRI task. A working memory fMRI task: During “Encode” a set of 1, 3, or 5 digits are presented and during “Probe” a series of single digits are presented. Subjects are asked to remember the “Encode” digits and identify them during “Probe.”
Imaging Parameters
Structural MRI
A T1-weighted sMRI was acquired at each site using the following scanners: MGH and UNM = 1.5 Tesla (T) Siemens Sonata, UI = 1.5 T GE Signa, UMN = 3 T Siemens Trio. The T1-weighted whole brain scans were acquired with an oblique axial gradient echo sequence. Imaging parameters for the T1 scans were: TR = 2530 ms for 3 T, TR = 12 ms for 1.5 T; TE = 3.79 for 3 T, TE = 4.76 ms for 1.5 T; FA = 7° for 3 T, FA = 20° for 1.5 T; Bandwidth = ±181 kHz for 3 T, Bandwidth = ± 110 kHz for 1.5 T; 0.625 × 0.625 voxel size; slice thickness 1.5 mm; FOV, 256 × 256 × 128 cm matrix; FOV = 16 cm. T1-weighted scans took approximately 13 min each and 2–3 volumes were acquired. All sMRI data were collected using an eight channel head coil, UNM used a CP head coil.
Functional MRI
Functional data were acquired at all four sites with Siemens 3T scanners, except at the UNM site where a 1.5-T Siemens Sonata scanner was used. Data were collected from each participant while performing the SIRP task. The parameters for the functional scan were: TR/TE = 2 s/30 ms (TE = 39 ms for UNM), bandwidth = ±100 kHz = 3126 Hz/pixel, FA = 90°, slice thickness = 4 mm, gap between slices = 1 mm, voxel size = 3.4 mm × 3.4 mm × 4 mm, FOV = 22 cm, pulse sequence = PACE-enabled, single shot, single-echo echo planar imaging (EPI), scan plane = oblique axial, AC-PC; acquisition matrix = 64 × 64, number of slices = 27, ascending sequential acquisition.
Data Analysis
Preprocessing sMRI
For MGH and UNM, three T1’s were coregistered to each other and an average T1 was computed for segmentation and smoothing. UI and UMN acquired only a single T1 image. Tissue classification, bias correction, image registration and spatial normalization were performed using voxel based morphometry (VBM; Ashburner and Friston, 2005) in SPM5 (http://www.fil.ion.ucl.ac.uk/spm/software/spm5). We applied optimized VBM where tissue classification, bias correction, and image registration are integrated within a unified model. Where the above steps are optimized in one model. Unmodulated normalized parameters were used for segmentation as previously applied in two large VBM studies (Meda et al., 2008b; Segall et al., 2009) to segment the brain into white matter, GM, and cerebral spinal fluid (CSF) probabilistic maps. At any given voxel the GM map indicates the percentage of GM content at that voxel. After segmentation, GM images were smoothed with a Gaussian kernel of full-width half maximum (FWHM) 10 mm × 10 mm × 10 mm. Voxel size of all images was re-sliced to 3 mm × 3 mm × 3 mm to match the resolution of the up-sampled fMRI data.
Preprocessing fMRI
The SPM5 software package was employed to perform fMRI preprocessing. Slice timing was performed with the middle slice in time (at TR/2) as the reference frame. Images were realigned using INRIalign, a motion correction algorithm that is unbiased by local signal changes (Freire and Mangin, 2001; Freire et al., 2002). Data were then spatially normalized into the standard Montreal Neurological Institute (MNI) space (Friston et al., 1995) with affine transformation followed by a non-linear approach with 4 × 5 × 4 basis functions. Images (originally collected at 3.4 mm × 3.4 mm × 4 mm) were then up-sampled to 3 mm × 3 mm × 3 mm, resulting in a data cube of 53 × 63 × 46 voxels. Finally data were spatially smoothed with a Gaussian kernel of FWHM of 9 mm × 9 mm × 9 mm (White et al., 2001).
Activation maps for the SIRP task were created using the GLM using SPM5. Regressors for the GLM were modeled as on–off blocks of rectangle functions convolved with the default SPM5 canonical hemodynamic response function (HRF) for each of the three loads (Low, Medium, and High) and each of the two epochs (Probe and Encode). Drift was modeled by a high pass filter with cutoff at 128 s. The final activation maps were constructed by averaging the three runs. Six average activation maps (for Probe and Encode, each with three loads) were used for further analysis.
Structure–Function Correlation
Whole brain structure–function correlation analysis was introduced in Michael et al. (2010) and here we briefly present the methodology and extend our work to reduce the correlations to structural and functional clusters. After the exclusion of non-brain and masked out voxels by SPM, the three dimensional brain images were reshaped to two dimensional matrices with brain voxels (N ≈ 45 k) along different columns and subjects along the rows of a matrix (Figure 2). Structural matrix (S) is constructed with GM concentration map obtained from VBM and functional matrix (F) is constructed with the activation map obtained from GLM. S and F are constructed for HC and SZ separately. Let s i and f j be column vectors across all subjects for the ith voxel of S and the jth voxel from F respectively. Our interest is in finding correlations, using Eq. 1, between s i and f j for all combinations of i and j.
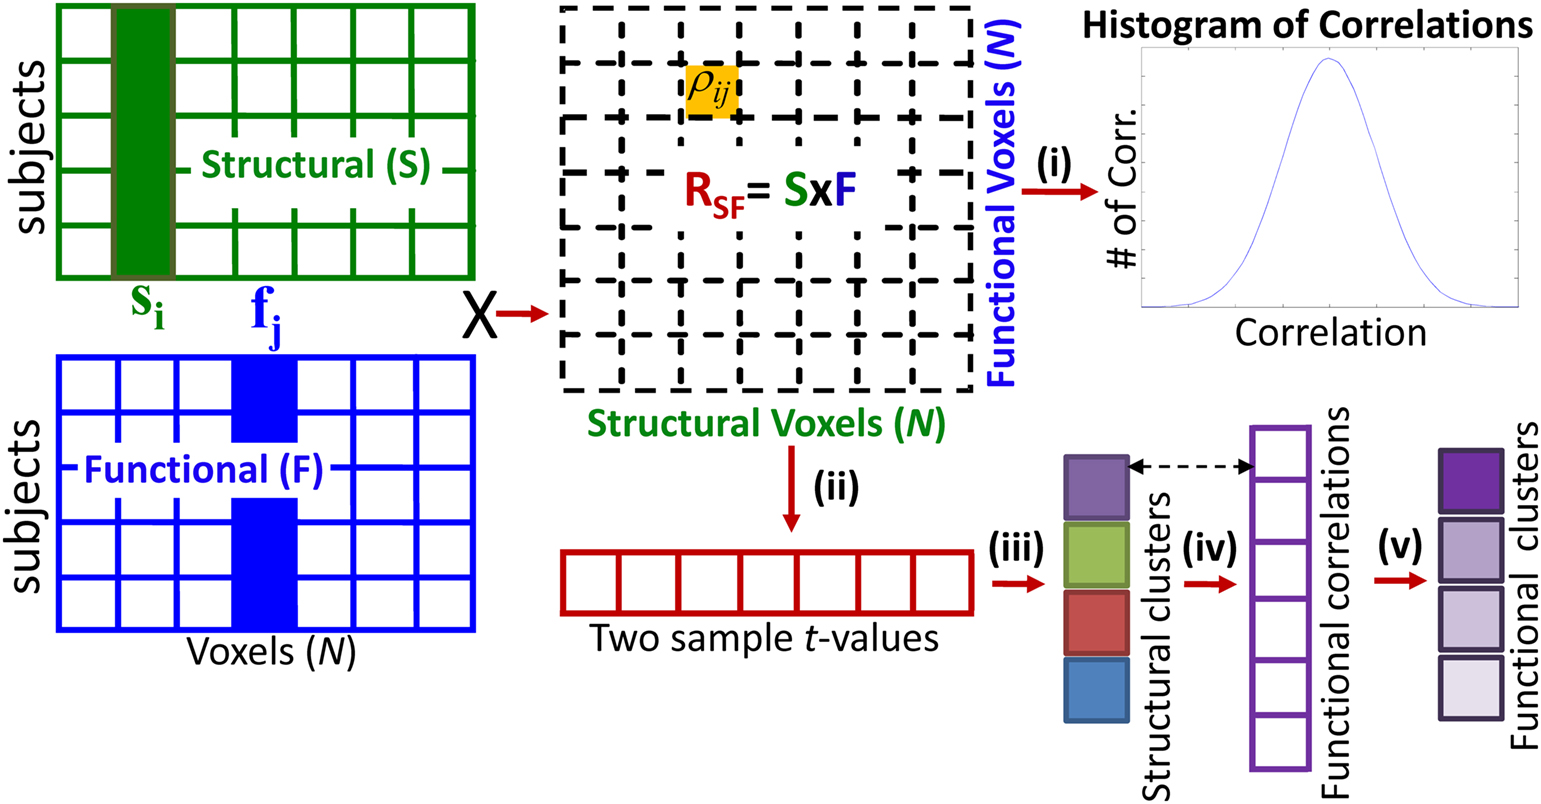
Figure 2. Computing the structure–function cross correlation (RSF) matrix and step-wise reducing into structural and functional clusters. Gray matter concentration voxels are vectorized and placed along the columns and subjects along the rows to construct the structural matrix (S). Similarly activation maps from the fMRI task are used to make the functional matrix (F). The cross correlation matrix (RSF) is reduced (i) to a histogram. (ii) Compute a t-map to find how each structural voxel’s mean correlation with all functional voxels is different between HC and SZ. (iii) Contiguous regions of this t-map are grouped to construct structural clusters (iv) For each structural cluster, compute the correlation between its mean and all functional voxels (shown for only one structural cluster). (v) Contiguous regions are grouped to construct functional clusters (shown for only one structural cluster).
A large cross correlation matrix (RSF) of size N × N is required to store all structure–function correlations. In the steps below we present how RSF can be reduced to useful metrics.
Step i: Reduce RSF to a histogram to identify if HC vs. SZ differences exist in the distribution of the correlations. The histograms are computed by iteratively computing and summing the histogram of each row of RSF (Michael et al., 2010). Histograms are useful in data reduction and in our application demonstrate the distribution and between group differences of correlations. However, they over-reduce large numbers of correlations to too few occurrences; furthermore they do not retain the spatial location of the correlations. The task of finding, reducing, and representing all functional correlations with all structural voxels is not easy due to the high number of voxels. Here we show how RSF can be segmented based on a feature of interest, in this case the significance of structure–function correlation difference between HC and SZ.
Step ii: Iteratively compute the mean and SD of each structural voxel’s correlation with all functional voxels. Perform a two sample t-test (Eq. 2) on each structural voxel using the computed mean and SD of HC and SZ. The t-test checks how a structural voxel’s mean correlation with all functional voxels in SZ is different from HC. In other words, the null hypothesis is that a particular structural voxel’s mean correlation with all functional voxels is same between HC and SZ. This test is performed N number of times, where N is the number of structural voxels and hence the two sample t-values are corrected for multiple comparisons. At this stage we have a map of corrected t-values that indicates how a structural voxel’s mean correlation with all functional voxels is different between HC and SZ.
Step iii: Find contiguous structural clusters from significant t-valued voxels and compute the mean GM concentration value within each structural cluster.
Step iv: At this stage we have structural clusters whose mean functional correlations are different between HC and SZ, but the specific functional locations are not available. To obtain this information re-compute functional correlations between the mean of each structural cluster and all functional voxels to compute significantly (after correction for multiple comparisons) different functional correlation maps.
Step v: Cluster the functional correlation maps of Step iv into contiguous functional clusters. To test the significance of correlations between the structural–functional clusters we apply Fisher transformation (Eqs 3 and 4) and compute p-value from the z-score (Eq. 5).
Results
Behavioral Results
The number of correct responses for the Probe digits and the response time (RT) are presented in Table 2. Both HC and SZ have very high mean percentage of correct response (>93%, for all load levels) with a low SD, indicating that subjects in both groups actively participated in the task. In both groups, as expected, the percentage of correct responses decreased and RT increased when the memory load increased from Low to High. Percentage of correct responses was lower in SZ than in HC and this difference increased with the increase of memory load. Mean RT was significantly less in HC than SZ across all load levels.
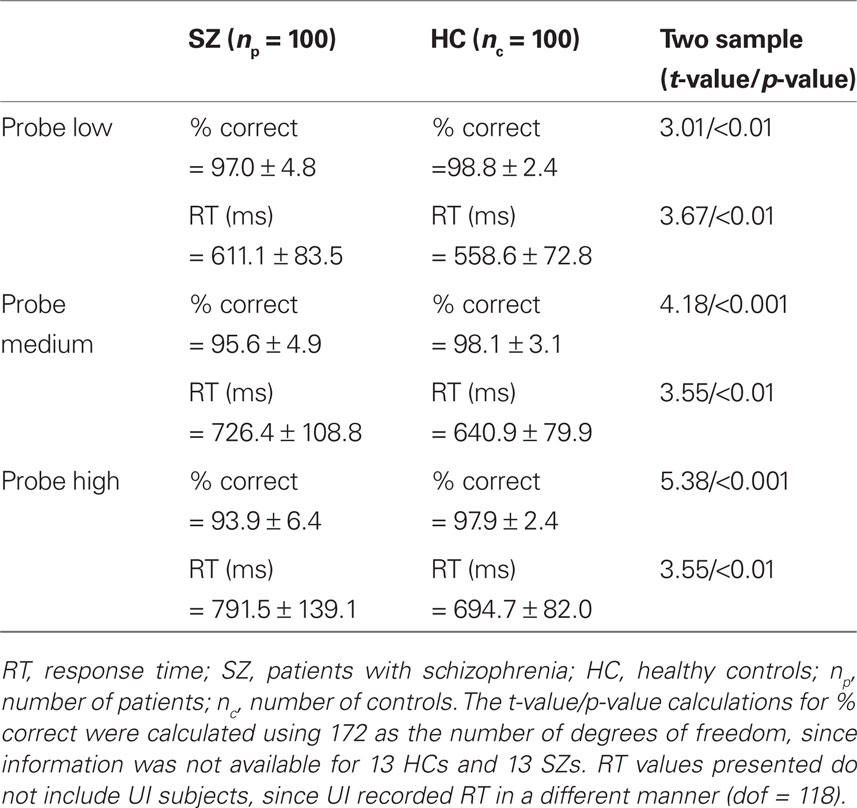
Table 2. Behavioral results from the Probe epoch of the working memory task.
Structure–Function Correlation Histogram
In Figure 3 we present the structure–function correlation histograms computed across the whole brain. In Figure 3 the y-axis represents the number of occurrence of different correlation values given along the x-axis. In Figure 3 HC (in blue) and SZ (in red) are presented in the columns and the loads in rows, with Encode and Probe in solid and dash lines respectively. The peak point of each histogram is marked by a green line (dashed for Encode and solid for Probe) and corresponds to the mean correlation due to symmetry. The mean correlation value for Encode in HC is negative for Low load  and shifts in the positive direction when the load is increased
  In SZ the mean correlation is negative for Low memory load
  becomes positive for Medium
 but changes direction and becomes negative for High load
 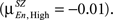 In both HC and SZ the mean correlation values for Probe across all loads are negative, but mean correlations in SZ are more negative than HC
 From the height of the histograms, it can be observed that in SZ the variance of Probe is higher than in HC across all load levels.
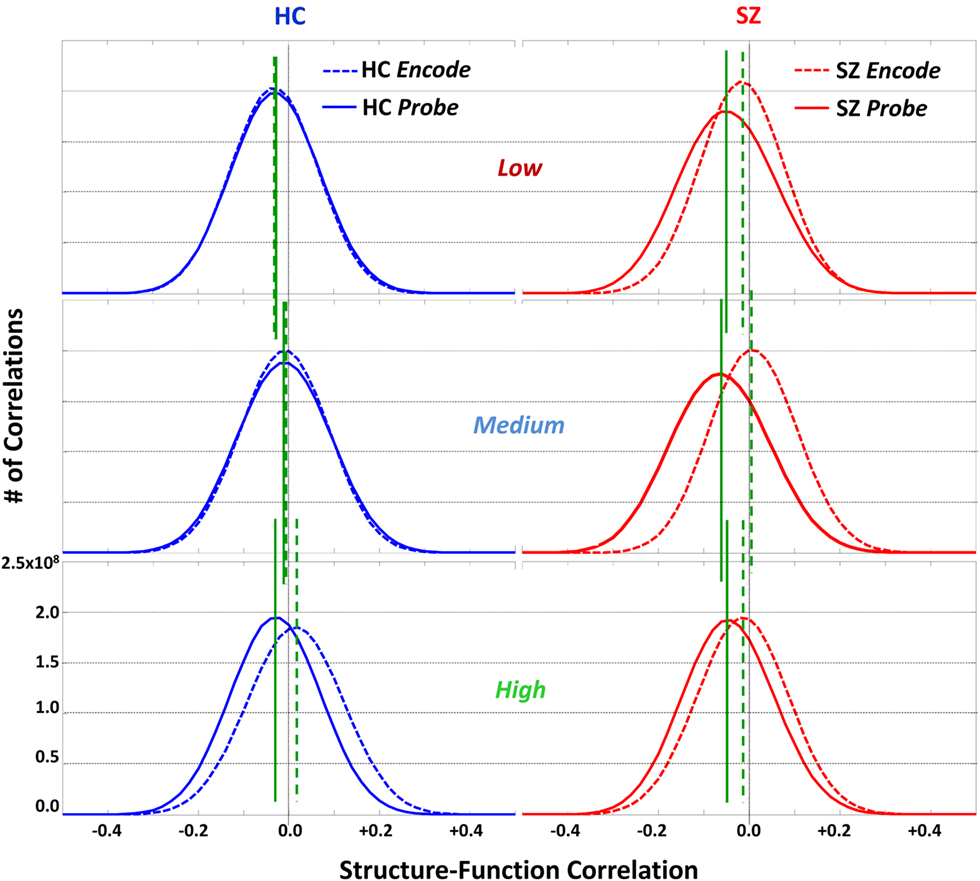
Figure 3. Structure–function whole brain correlation histogram. Histogram of whole brain correlations computed between gray matter concentrations (structural) and activation coefficients (functional) for the SIRP working memory task are presented for patients with schizophrenia (SZ, in red) and healthy controls (HC, in blue). The histograms for Encode and Probe are presented with dotted and solid curves respectively. The y-axis represents the number of occurrences of correlation values given along the x-axis. In HC the histograms for Encode and Probe overlap for Low and Medium loads but separate at high load. In SZ the Encode and Probe histograms are separated at all load levels.
The histograms also present interesting within group differences between Encode and Probe. In HC, for both Low and Medium memory loads, the Encode and Probe histograms overlap with each other. In other words the mean correlation value for Encode and Probe, indicated by the green lines, are approximately equal  However, for High memory loads the Encode histogram shifts in the positive direction
  In SZ, Encode and Probe histograms do not overlap for any load level and the mean value for Encode and Probe are significantly different
 This difference is mainly as a result of Probe having more negative structure–function correlations than Encode. This difference between Encode and Probe in SZ is highest at the Medium load level. In summary, SZ are showing structure–function correlation differences between Encode and Probe for all loads but HC are showing this difference only at High load.
Structural and Functional Spatial Clusters Based on Probe Medium
The histograms presented in Section “Structural and Functional Spatial Clusters Based on Probe Medium,” do not reveal specific anatomical regions where the correlations are located. In this section, as explained in Section “Structure–Function Correlation,” we find structural and functional contiguous clusters based on significant between group structure–function correlation differences. As Probe Medium structure–function correlation histogram showed the maximum difference between HC and SZ (Figure 3), Probe Medium data was used to compute the structural and functional clusters. The two sample t-values between HC and SZ was calculated at each structural voxel using the mean and SD of its correlation with all Probe Medium functional voxels. Three dimensional contiguous clusters were found using the thresholded map (t = 10, p < 10−11, Bonferroni corrected, dof = number of subjects) after applying the “spm_bwlabel” function in SPM5. The five largest contiguous regions were retained for further analyses, and these will be referred to as structural clusters henceforward. Following the steps presented in Section “Structure–Function Correlation” and using the mean values within the structural clusters, we computed functional correlations for each of the structural clusters and thresholded voxels that were significantly differentially correlated (p < 0.05, FDR corrected) between HC and SZ. We observed that there was substantial overlap between the functional clusters found for each of the five structural clusters. To reduce the number of tests we redefined the functional clusters by computing the union of the functional clusters, and then selected the five largest contiguous regions, and these will be referred to as functional clusters henceforward. The structural and functional clusters are presented in Figure 4 and the anatomical labels along with volumes are presented in Table 3.
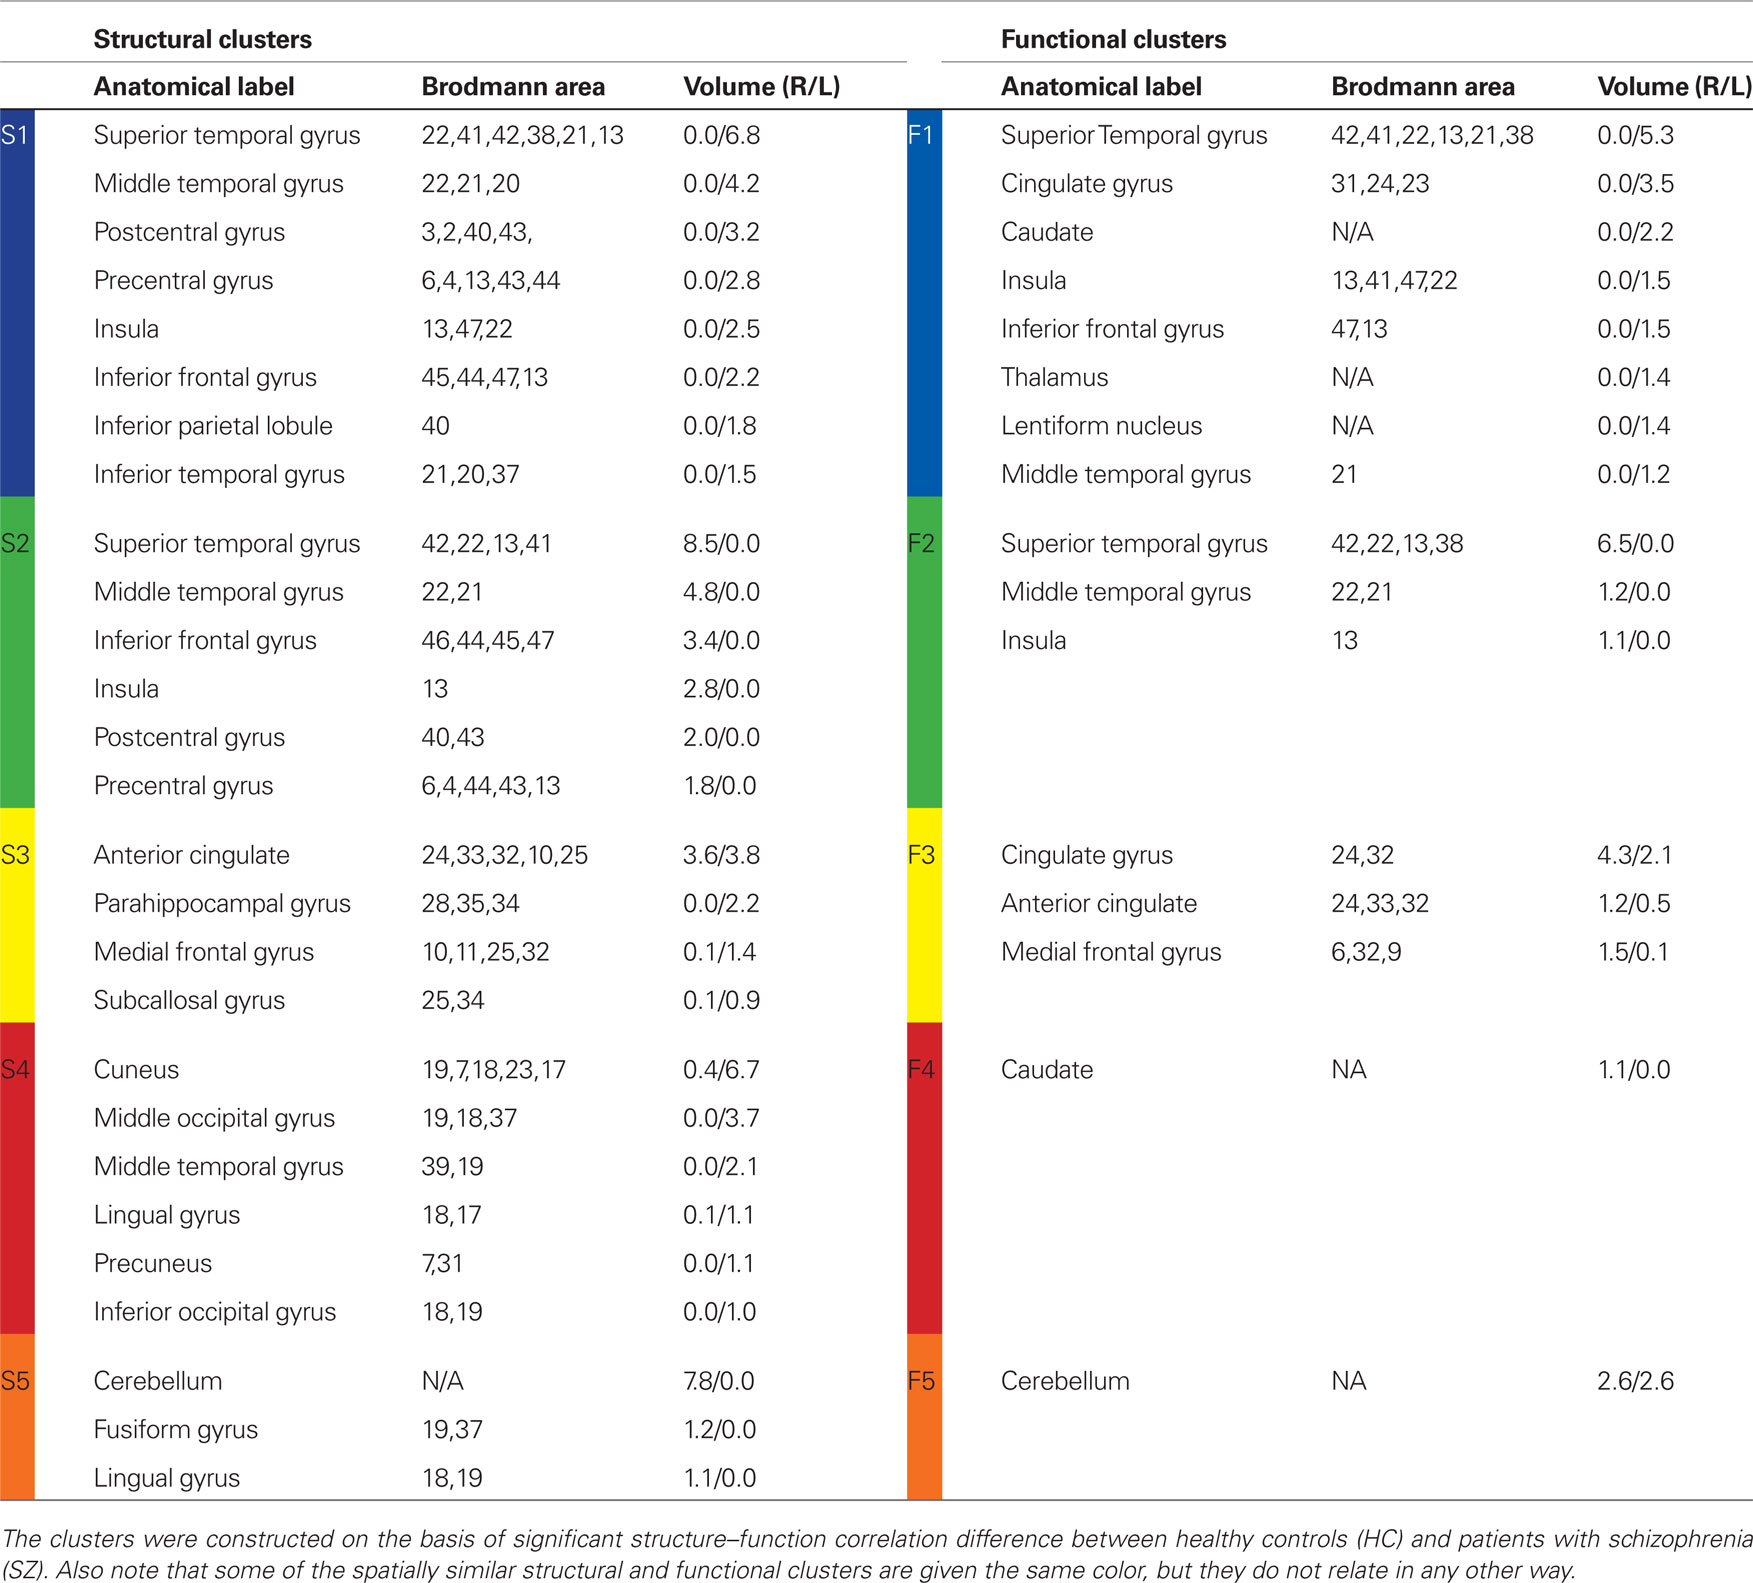
Table 3. Anatomical labels of structural and functional clusters.
Figure 4. Structural and functional clusters based on significant structure–function correlation difference between healthy controls (HC) and patients with schizophrenia (SZ). The clusters were computed applying the method presented in Section “Structure–Function Correlation” and were based on functional activation for Probe Medium load. Note that some of the spatially similar structural and functional clusters are given the same color, but they do not relate in any other way. In Section “Structure–Function Inter-Cluster Correlations for Probe Medium” we present that correlation between these structural and functional clusters is positive in HC and negative in SZ.
Structure–Function Inter-Cluster Correlations for Probe Medium
In this section we present the correlation results between the clusters computed in Section “Structural and Functional Spatial Clusters Based on Probe Medium.” Cross correlations were computed between the mean values of each cluster across subjects, for HC and SZ separately and the significance of the difference in correlation was computed using Eqs 3–5. The correlation values are presented as images in Figures 5A,B for HC and SZ respectively and the strength of the correlation is indicated by the color bar below. A significant result is that, HC show positive correlations between GM concentration and functional activation for Probe Medium load for all pairs of structural (S1–S5) and functional (F1–F5) clusters, except S2–F2. Correlation for HC was in the range of +0.11 to +0.33. In contrast, all correlation pairs were negative in SZ and ranged from −0.5 to −0.26. In Figure 5C the significance of the differential correlation is presented as an image. The significances are indicated as − log10 (p-value), the p-values are Bonferroni corrected, dof = 25 (number of inter-cluster correlation tests). The functional cluster F1 (Left Superior Temporal gyrus + Cingulate Gyrus + etc., see Table 3) was highly significant (p < 10−5) with all structural clusters. The next least p-value row is observed at F3 (Cingulate Gyrus + Anterior Cingulate + Medial Frontal Gyrus), and this cluster shows the lowest p-value (p < 10−5) with structural cluster S3 (Anterior Cingulate + Parahippocampal Gyrus + Medial Frontal Gyrus + etc.). Regions of structural cluster S3 and functional cluster F3 contain anatomical regions previously implicated with WMem. For this reason and to show a sample trend of the relationship between GM concentration and activation coefficient across subjects, the scatter plots corresponding to S3–F3 are presented in Figures 5D,E for HC and SZ respectively. Subjects from the four different sites are presented in different colors to show that site differences do not contribute toward the trend to the relationship. In HC, increase in GM concentration in the clusters constructed corresponds to an increase in the functional activation coefficient (positive slope = +4.2). In SZ, on the contrary, an increase in GM concentration decreases functional activation (negative slope = −6.1). In Figures 5D,E we indicate the mean across subjects and SD of S3 GM concentration and F3 functional activation. SZ had a significantly lower mean GM concentration than HC in S3, but higher mean functional activity in F3.
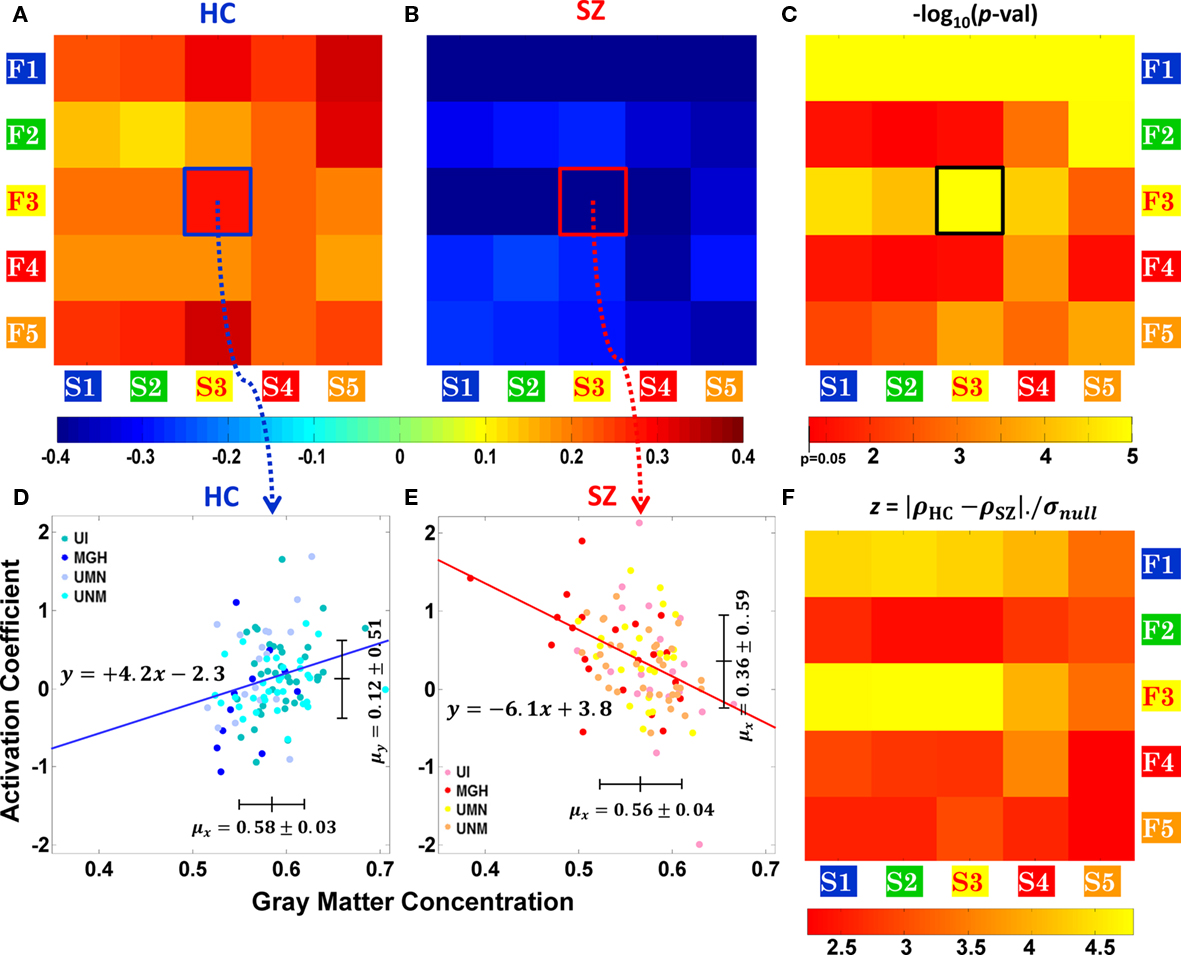
Figure 5. Structure–function correlation for healthy controls (HC) and patients with schizophrenia (SZ) based on functional activation for Probe Medium. Correlation values between structural and functional clusters of Figure 4, (A) for HC and (B) for SZ. Note that correlations are positive for HC and negative for SZ as indicated by the color bar below the plots. In (C) the significance of correlation differences are presented. Scatter plots of Structural cluster S3 and functional cluster F3 are presented for HC and SZ in (D) and (E). Data points are presented in different colors corresponding to the site where the scan was performed. In (F) we compare the significance of the correlation difference result with the variance of the null distribution as z-scores.
The final subplot (Figure 5F) is presented to demonstrate the robustness of our finding. The structural and functional clusters were computed based on the correlation difference between the two groups. To reconfirm the significance of our result we computed the variance of the null distribution and compared it with the correlation difference observed between HC and SZ. The null distributions were generated by randomly mixing 50 HC and 50 SZ to form a pseudo HC group and by mixing the remaining subjects to form a pseudo SZ group. We then proceeded to compute inter–cluster structure–function correlation differences for the pseudo groups for clusters S1–S5 and F1–F5. These steps were repeated 10,000 times using different but unique pseudo groups of HC and SZ, and the SD of the correlation difference of these pseudo groups was calculated. We divided the absolute difference in correlation between the true HC and SZ by the SD of the difference correlation of the pseudo groups which is the null distribution. This value is essentially a z-score and ranged between 2.24 and 4.86 (corresponding to two tailed p-values of 0.02 to 1.2 × 10⁻⁶) respectively for the different pairs of clusters. In this analysis the lowest p-values were observed between F3 and S1, S2, S3, and S4 and the next lowest p-values were between F1 and S1, S2, S3, and S4.
We further examined our results to test if our result changed due to subject demographics, site differences and performance. In Table 1 we presented that subject age, handedness, and parental socioeconomic status were matched between the two groups but gender and education were not. Although age was matched between the two groups, since studies (Ge et al., 2002) have associated GM loss with age we checked if our result changed with age. We individually regressed out the variance due to age, education, parental socioeconomic status, gender, site, and percentage of correct response from the structural and functional cluster values and then repeated the correlation analysis with the error term of the model. Gender was regressed out using a dummy variable of “ones” and “zeros” and site with three variables of “ones” and “zeros” each taking a value of “one” only at the appropriate site. Clusters that previously showed significant differential correlation remained unchanged for all variables except for age and percentage of correct response. After age was regressed out, all pairs of structure–function differential correlations remained significant (p < 0.05, after Bonferroni correction) except S3–F2, S1–F4, S2–F4, S3–F4, and S5–F4. The removal of variance due to percentage of correct response made all structural clusters’ differential correlations with F4 insignificant but other pairs remained significant. Even after the removal of the variance due to these variables functional clusters F1 and F3 remained most highly significant.
Other Comparisons of Structure–Function Inter-Cluster Correlations
The results presented in Sections “Structure–Function Inter-Cluster Correlations for Probe Medium” are based on Probe Medium functional data. Our next interest is to investigate how the HC vs. SZ inter-cluster correlation difference altered for the other loads of Probe and all loads of Encode. In addition we are also interested in making within group comparisons between Probe and Encode. As in Section “Structure–Function Inter-Cluster Correlations for Probe Medium,” we calculated the significance of inter–cluster correlation difference using the same structural (S1–S5) and functional (F1–F5) clusters. The p-values corresponding to the significance of correlation difference are presented as binary images in Figure 6. The significant p-values (p < 0.05, after Bonferroni correction, dof = 25), are shown in yellow and the rest in red. The columns of Figure 6 correspond to different comparison conditions and the rows to the three load levels.
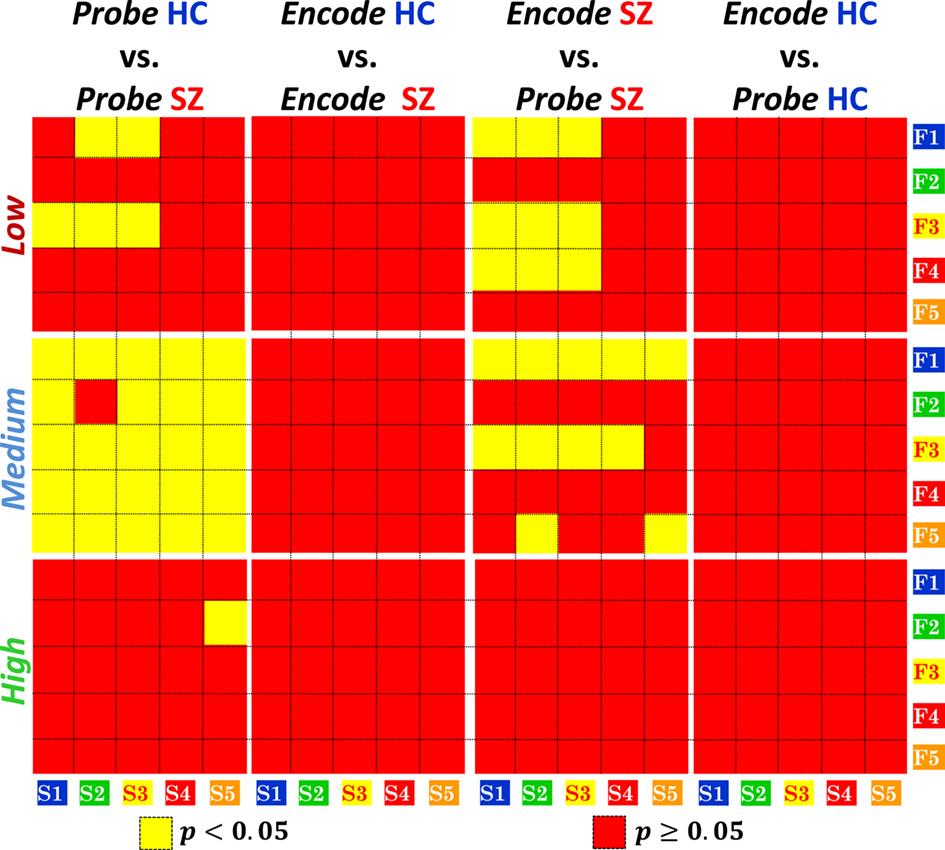
Figure 6. Healthy control (HC) vs. patients with schizophrenia (SZ) and within group inter-cluster structure–function correlation differences for Encode and Probe across memory load levels. Correlations between structure/function clusters of Figure 4 are computed across all load levels and significant (p < 0.05, after Bonferroni correction, dof = 25) differential correlations are indicated in yellow. Significant HC vs. SZ differences are present in Probe, but no significant differences exist in Encode for any cluster or load level. Within group comparison shows differences between Encode and Probe in SZ but not in HC.
In the first two columns of Figure 6 we make between group comparisons for structure–function correlation difference for Probe and Encode. For Probe Low significant HC vs. SZ correlation differences are found between functional cluster F1 and structural clusters S2 and S3 and functional cluster F3 and structural clusters S1, S2, and S3. For Probe Medium, as previously stated, all pairs of clusters except F2 and S2 show significant difference in correlation. For Probe High the only significant correlation difference is seen between F2 and S5. For Encode, none of structure–function correlation clusters show significant HC vs. SZ difference.
In the last two columns of Figure 6 we make within group structure–function correlation comparisons for HC and SZ separately. The correlation comparisons were made between functional activation for Encode for a certain load level and Probe of the same load level. In SZ, Encode vs. Probe structure–function correlation differences are seen between F1, F3, and F4 and S1, S2, and S3 for Low load level. For Medium load F1 shows correlation difference across all five structural clusters, F3 shows differences in S1 to S4 and F5 between S2 and S5. In HC no significant Encode vs. Probe structure–function correlation differences were found for any of the load levels.
Discussion
In this paper we present a methodology to segment or cluster the brain based on structure–function correlation differences between two groups and it is an extension of our previously presented methods to investigate whole brain correlations (Michael et al., 2010). The application of our data-driven approach to structure and functional data from patients with schizophrenia (SZ) and HC presents several novel structure–function whole brain and inter-cluster correlation differences.
The Correlation and Clustering Methodology
Advantages of the methodology
A research design to examine whole brain correlations is challenging due to computational and statistical issues such as the multiple comparisons of millions of pairwise correlations. One solution to overcome this issue is to segment the brain using an anatomical atlas prior to performing the correlation analysis, but anatomical atlases may not be suitable to segment the functional brain. Another solution is to reduce the number of voxels by sub-sampling the brain images, but this may lose the benefits of high resolution imaging, such as important morphological boundaries. In our approach we reduced, in a step-wise manner, the very large number of correlations to structure/function clusters to identify differential correlation between two groups. We first found structural clusters that were correlating differently across the whole functional brain and then specific functional locations were found through functional clusters.
The structural/functional clusters were identified after an evaluation of not only within corresponding brain regions but also distant regions and an analysis of this nature may help to better understand disorders such as schizophrenia that is hypothesized as a disorder of distributed disconnections. Results obtained after a comprehensive whole brain correlation analysis indicates between-group structure–function correlation differences in both previously strongly implicated regions (frontal lobe and temporal lobe) and less strongly implicated regions (cerebellum, thalamus). Frontal and temporal lobe abnormalities is schizophrenia have been extensively reported in previous studies both in structure (Turetsky et al., 1995; Meda et al., 2008b; Segall et al., 2009) and function (Carter et al., 2001; Manoach, 2003; Calhoun et al., 2008; Karlsgodt et al., 2010) and in this study we provide evidence that the structure–function association in these regions is aberrant as well. While regions outside the DLPFC have received relatively less attention in studies of WMem and schizophrenia, it can be shown that the brain activations in the regions we located (Table 3) are modulated by the task and can show group differences. In our study aberrant correlations are found in DLPFC and non-DLPFC regions such as the Middle Temporal Gyrus, Caudate, Insula, Cerebellum, Thalamus, Inferior Parietal Lobule, etc. (see Table 3). Dysfunction in schizophrenia in the cortico-cerebellar–thalamic circuit has been previously reported in a PET study (Andreasen, 1997). The fact that our approach finds previously implicated and task related regions as well as other regions demonstrates both the validity of the approach as well as elucidates the advantages of hypothesis free data-driven methods to investigate the brain.
Anatomical labels or segmentations of the brain already exist, have been extensively applied in brain imaging and have produced very useful results. It is not clear if anatomical labels are appropriate to segment the functional brain due to high inter-subject functional variability ascribable to different strategies used to perform the task and variable cognitive factors influencing the task (White et al., 2001). In our approach we segment the brain driven by a feature of interest, HC vs. SZ structure–function correlation difference. Our method also shows that there may be differences between patients and controls in the boundaries of structural and functional clusters and augments the need for separate structural/functional regions of interest (Figure 4). Our results indicate that brain connectivity may be differentially influencing brain activity and speculate that the extent of connectivity may be aberrant in schizophrenia. An example of this is where the clusters S3 and F3 show strong correlation difference between the two groups. Both clusters have overlapping regions in the anterior cingulate, medial frontal gyrus and cingulate gyrus, but F3 is located superior to S3.
We used Probe Medium to construct the clusters and then show high correlation difference between the clusters for Probe Medium. This can lead to questions pertaining to circular analyses (Kriegeskorte et al., 2009). Note that during the reduction of the Probe Medium data, at each between group comparison step we applied corrections for multiple comparisons to validate our results. To further confirm our result we performed an additional test by comparing our result with a null distribution and this test provided consistent results (compare Figure 5E and Figure 5C). In addition between groups and within group differences are found when the clusters computed with the Probe Medium data were applied to data obtained from other Probe and Encode data. To check the variability of the spatial location of the structural and functional clusters we selected 5 subsets of 50 subjects from each group. With lower number of subjects, as expected, the t-values and the significance of differential correlations dropped and the boundaries of the clusters were smaller, but there was no considerable change in the locations of the most significant voxels of the clusters. All these results and tests confirm that our findings are both significant and robust.
The data-driven approach presented is simple, easy to implement and efficient. There are several other advantages, such as combining images with different resolution sizes, issues related to normalization of data and spatial registration. Additional information about these advantages and other advantages can be found at Michael et al., 2010.
Limitations of the methodology
Reducing a large number of correlations to a few summary parameters that attempt to best capture available information is not straightforward. There are limitations to the approach presented here although steps were taken to minimize them. For example it is reasonable to question if it is appropriate to reduce a large number of correlations to a mean value without accounting for variations. We accounted for variations while selecting structural clusters based on two sample t-test scores between the two groups. Unfortunately, this does not capture other differences, such as high positive and negative structure–function correlations. We initiate the clustering mechanism based on a structural voxel’s correlation with all functional voxels. The sequence of structure to function and not function to structure was followed since we hypothesize that brain structure influences brain function. We acknowledge that several improvements can be made to whole brain structure–function correlation analysis. What we present here is an approach to reduce the whole brain correlations to features, in our case clusters, that show group differences.
Examination of Structure–Function Correlations
Whole brain correlation histograms
It is clear from the histograms (Figure 3) that the distribution of the correlations between structure and function are different between HC and SZ. In HC the histograms overlap for Encode and Probe at Low and Medium load levels but separate at High load. In SZ the histograms are separated across all load levels, with maximum separation at Medium load. This result does not necessarily indicate that the process of Encode and Probe are similar in HC at low loads but shows that it is definitely dissimilar in SZ for all load levels. It also indicates that SZ may be employing circuits at Low and Medium load levels that are required in HC only at High load. In HC the mean value of the histogram (green dotted line in Figure 3) for Encode increases toward positive correlation when the load is incremented, suggesting that structure–function associations become stronger at higher loads. In SZ, the mean increases toward positive from Low to Medium, but becomes negative at High. This result suggests that the encoding circuitry may be different or that SZ may be less actively involved at High load level. The mean correlation for Probe (solid green line in Figure 3) in HC moves in the positive direction for Medium but becomes more negative for High. In SZ Probe Medium has the most negative correlation value and creates the maximum between group difference in histograms, but this difference diminishes at High level. This result may suggest that at the Medium load level it is HC are still relatively able to perform the task, whereas SZ are struggling at this load level. At High both groups may be struggling to handle the load, hence the difference between the groups is not as large as the difference at Medium.
Inter-cluster correlations for probe medium
The Probe Medium data was used to spatially localize significantly different correlation regions in the brain because it showed the maximum between group correlation differences in the histograms. It is important to note that it cannot be deduced that brain correlations between brain regions are the same because the histograms overlap, but the chances are higher for correlations to be different when the histograms do not overlap. When correlations were computed between the clusters we present in Section “Data Analysis,” we observe a fundamental difference between the two groups: GM concentration and functional activity are positively correlated in HC and negatively correlated in SZ. This difference was observed across most pairs of structure–function correlation clusters (Figures 5A,B). SZ with lower GM concentration are trying harder or activating stronger than HC, but SZ with higher GM concentration are activating at the level of HC. While comparing correlation between S3 and F3, note that SZ have a significantly higher overall activation and significantly lower GM concentration, but this difference in mean values of GM concentration and activation is not the cause of the difference in correlation, since correlation is not sensitive to the amplitude and does not explain the trend. A possible explanation to this observation is that SZ with higher GM may not be trying as hard as HC with similar GM concentration. Further interpretation of this result is required and we plan to pursue them in follow up studies.
While investigating the strength of the correlation difference we observe that the most significant difference are from functional clusters F1 (Left Superior Temporal gyrus + Cingulate Gyrus + etc.) and F3 (Cingulate Gyrus + Anterior Cingulate + Medial Frontal Gyrus + etc.) across multiple structural clusters. These two functional clusters remained highly significant even after the removal of variance due to subject demographics, site, and performance. It is interesting to note that F2, the contralateral region of F1, does not show significance as high as F1. GM differences in left superior temporal gyrus are among the most robust structural abnormalities in schizophrenia and are clearly linked to severity of auditory hallucinations and of formal thought disorder. Differences have been previously found in structural studies of schizophrenia (Barta et al., 1990; Shenton et al., 1992, 2001; McCarley et al., 1993) and here we show that structure–function correlation differences are also higher in the left temporal lobe when compared to the right temporal lobe. Structural differences in regions of F3 have also been previously shown (Meda et al., 2008b; Segall et al., 2009). F3 and F1 also show the highest z-scores for the null hypothesis test and after the removal of variance due to subject demographics and other variables. Both clusters, F1 and F3, have nodes involving the Anterior Cingulate, a brain region which shows consistent differences between SZ and HC in studies of WMem (Glahn et al., 2005).
Inter-cluster correlations change across epochs and loads
In Figure 6 we compare inter-cluster correlations for Probe and Encode for all load levels using the same clusters computed with Probe Medium data. With this examination we ask if the SZ vs. HC correlation differences we observed for Probe Medium is also true at other load levels and during Encode. Between group correlation differences are not evident for Encode in any of the clusters or load levels. This result suggests that the structure–function integrity during Encode is similar in SZ and HC. In HC within group comparison of Encode vs. Probe shows no significant correlation difference and indicates that structure–function integrity during Encode and Probe in HC is similar. When within group Encode vs. Probe comparison for SZ were made, an interesting result was that structure–function differences are found in the same clusters that HC vs. SZ Probe differences were found. F1 (Left Superior Temporal gyrus + Cingulate Gyrus + etc.) and F3 (Cingulate Gyrus + Anterior Cingulate + Medial Frontal Gyrus + etc.) show significant correlation differences for Low and Medium loads with multiple structural clusters (Figure 6). In these clusters functional activity increases in SZ with higher GM concentration during Encode but activity decreases during Probe. This result suggests that the Probe process is what is aberrant in SZ. For Probe High, F2 (Right Superior Temporal Gyrus + Middle Temporal Gyrus + Insula etc.) shows significant HC vs. SZ correlation difference in S5 (Cerebellum + Fusiform Gyrus + Lingual Gyrus). This pair of correlations does not show correlation differences in any other scenario and, at this load level, F1 and F3 do not show significant correlation differences. This result provides additional evidence that at Probe High, as previously stated, the processes may be different from that of lower load levels.
Within group correlation difference exhibited by SZ is a valuable result because it removes potential confounds due to inter-group differences. Our results were rechecked by removing the variance of subject demographics, site, and performance and were found to be consistent. Further other structural differences in SZ such as, smaller brain size and enlarged ventricles have been established (Shenton et al., 2001). It is reasonable to consider that these differences and other differences such as exposure to medication may impact the structure–function correlation. The fact that structure–Encode vs. structure–Probe correlation differences exist within SZ in the same clusters (F1 and F3) that HC vs. SZ differences were observed, eliminates the possibility that our results were influenced by group related variables other than the diagnosis.
Future Work
Further work is needed to establish and improve the observed structure–function within group and between group correlation differences presented in this paper. One important area to further investigate is how patients’ symptom profiles, illness severity, duration, and antipsychotic exposure; effects of these variables on WMem related neural activity and GM concentration need to be analyzed. It is important to note that our structure–function correlations were based on GM concentration and activation coefficients and the results indicate the presence of a feature or pattern present in the data. Studies that include diffusion tensor images (DTI) will offer additional information to assess the white matter connectivity between brain regions and offer a measure of effective connectivity. In our analysis we used functional data after it was reduced to activation coefficients using GLM, a model based approach where the HRF is assumed to be identical for all subjects at all-time points for all brain regions. With this reduction subtle group differences in the time domain may have been lost. Algorithm improvements or application of algorithms such as the independent component analysis (Kim et al., 2009) to detect changes in the function–structure relationships in both the time and space domains could further enhance the ability of our approach to identify these important differences.
Conclusion
In this study we investigated whole brain correlations between GM concentration, a measure of structure and functional activation by reducing the large cross–correlation matrix to useful parameters such as the histogram and structural and functional clusters. We applied our techniques to data from patients with schizophrenia (SZ) and HC during the Encode and Probe epochs of a WMem task with three different memory loads. In HC the histograms for Probe and Encode overlapped for Low and Medium loads but separated at High load. In SZ histograms did not coincide at any load level suggesting that the Encode and Probe processes were dissimilar in SZ. The inter-cluster correlations between the structural and functional clusters manifested fundamental differences between HC and SZ. HC subjects with higher GM concentration had higher functional activation but in SZ the activation decreased with the increase of GM concentration. Two functional clusters that included regions in the Left Superior Temporal gyrus, Cingulate Gyrus, Anterior Cingulate, Caudate, Insula, and Thalamus showed significant between group correlation differences across multiple structural clusters. Within group inter-cluster correlation analysis showed no difference between structure–Encode and structure–Probe in HC, however in SZ similar correlation differences are evident, suggesting that the Probe process in SZ is aberrant. In this study, through a data-driven technique, we present several interesting and novel findings that indicate that distributed and aberrant structure–function correlations exist in SZ.
Conflict of Interest Statement
The authors declare that the research was conducted in the absence of any commercial or financial relationships that could be construed as a potential conflict of interest.
Acknowledgments
The data collection was funded by the Department of Energy, grant DE–FG02-99ER62764. The authors would like to thank the University of Iowa Hospital, Massachusetts General Hospital, the University of Minnesota, and the Mind Research Network staff for their efforts during data collection, preprocessing, and analysis. This work was supported by the National Institutes of Health under grants R01EB006841 and R01EB005846.
References
Andreasen, N., Flaum, M., and Arndt, S. (1992). The comprehensive assessment of symptoms and history (CASH). an instrument for assessing diagnosis and psychopathology. Arch. Gen. Psychiatry 49, 615–623.
Andreasen, N. C. (1997). Linking mind and brain in the study of mental illnesses: a project for a scientific psychopathology. Science 275, 1586.
Andreasen, N. C., O’Leary, D. S., Cizadlo, T., Arndt, S., Rezai, K., Ponto, L., Watkins, G. L., and Hichwa, R. D. (1996). Schizophrenia and cognitive dysmetria: a positron-emission tomography study of dysfunctional prefrontal-thalamic-cerebellar circuitry. Proc. Natl. Acad. Sci. U.S.A. 93, 9985.
Barch, D. M., Carter, C. S., Braver, T. S., Sabb, F. W., Macdonald, A. III, Noll, D. C., and Cohen, J. D. (2001). Selective deficits in prefrontal cortex function in medication-naive patients with schizophrenia. Arch. Gen. Psychiatry 58, 280–288.
Barta, P. E., Pearlson, G. D., Powers, R. E., Richards, S. S., and Tune, L. (1990). Auditory hallucinations and smaller superior temporal gyral volume in schizophrenia. Am. J. Psychiatry 147, 1457.
Calhoun, V. D., Maciejewski, P. K., Pearlson, G. D., and Kiehl, K. A. (2008). Temporal lobe and “default” hemodynamic brain modes discriminate between schizophrenia and bipolar disorder. Hum. Brain Mapp. 29, 1265–1275.
Carter, C., Macdonald, A., Ross, L., and Stenger, V. (2001). Anterior cingulate cortex activity and impaired self-monitoring of performance in patients with schizophrenia: an event-related fMRI study. Am. J. Psychiatry 158, 1423–1428.
Ehrlich, S., Brauns, S., Yendiki, A., Ho, B.-C., Calhoun, V., Schulz, S. C., Gollub, R. L., and Sponheim, S. R. (2011). Associations of cortical thickness and cognition in patients with schizophrenia and healthy controls. Schizophr. Bull. doi: 10.1093/schbul/sbr018. [Epub ahead of print].
First, M. S. R., Gibbon, M., and Williams, J. B. (1997). Structured Clinical Interview for DSM-IV-TR Axis I Disorders. Washington, DC: American Psychiatric Press.
Freire, L., and Mangin, J. F. (2001). Motion correction algorithms may create spurious brain activations in the absence of subject motion. Neuroimage 14, 709–722.
Freire, L., Roche, A., and Mangin, J. F. (2002). What is the best similarity measure for motion correction in fMRI time series? IEEE Trans. Med. Imaging 21, 470–484.
Friston, K., Ashburner, J., Frith, C., Poline, J., Heather, J., and Frackowiak, R. (1995). Spatial registration and normalization of images. Hum. Brain Mapp. 2, 165–189.
Ge, Y., Grossman, R. I., Babb, J. S., Rabin, M. L., Mannon, L. J., and Kolson, D. L. (2002). Age-related total gray matter and white matter changes in normal adult brain. Part I: volumetric MR imaging analysis. AJNR Am. J. Neuroradiol. 23, 1327.
Glahn, D. C., Laird, A. R., Ellison-Wright, I., Thelen, S. M., Robinson, J. L., Lancaster, J. L., Bullmore, E., and Fox, P. T. (2008). Meta-analysis of gray matter anomalies in schizophrenia: application of anatomic likelihood estimation and network analysis. Biol. Psychiatry 64, 774–781.
Glahn, D. C., Ragland, J. D., Abramoff, A., Barrett, J., Laird, A. R., Bearden, C. E., and Velligan, D. I. (2005). Beyond hypofrontality: a quantitative meta analysis of functional neuroimaging studies of working memory in schizophrenia. Hum. Brain Mapp. 25, 60–69.
Goldman-Rakic, P. S. (1994). Working memory dysfunction in schizophrenia. J. Neuropsychiatry Clin. Neurosci. 6, 348–357.
Goldman-Rakic, P. S., and Selemon, L. D. (1997). Functional and anatomical aspects of prefrontal pathology in schizophrenia. Schizophr. Bull. 23, 437–458.
Gur, R. E., Turetsky, B. I., Bilker, W. B., and Gur, R. C. (1999). Reduced gray matter volume in schizophrenia. Arch. Gen. Psychiatry 56, 905–911.
Heinrichs, R. W., and Zakzanis, K. K. (1998). Neurocognitive deficit in schizophrenia: a quantitative review of the evidence. Neuropsychology 12, 426–445.
Honea, R., Crow, T. J., Passingham, D., and Mackay, C. E. (2005). Regional deficits in brain volume in schizophrenia: a meta-analysis of voxel-based morphometry studies. Am. J. Psychiatry 162, 2233.
Johnson, M. R., Morris, N. A., Astur, R. S., Calhoun, V. D., Mathalon, D. H., Kiehl, K. A., and Pearlson, G. D. (2006). A functional magnetic resonance imaging study of working memory abnormalities in schizophrenia. Biol. Psychiatry 60, 11–21.
Karlsgodt, K., Sun, D., and Cannon, T. (2010). Structural and functional brain abnormalities in schizophrenia. Curr. Dir. Psychol. Sci. 19, 226.
Kim, D. I., Manoach, D. S., Mathalon, D. H., Turner, J. A., Mannell, M., Brown, G. G., Ford, J. M., Gollub, R. L., White, T., and Wible, C. (2009). Dysregulation of working memory and default mode networks in schizophrenia using independent component analysis, an fBIRN and MCIC study. Hum. Brain Mapp. 30, 3795–3811.
Kriegeskorte, N., Simmons, W., Bellgowan, P., and Baker, C. (2009). Circular analysis in systems neuroscience: the dangers of double dipping. Nat. Neurosci. 12, 535–540.
Manoach, D. (2003). Prefrontal cortex dysfunction during working memory performance in schizophrenia: reconciling discrepant findings. Schizophr. Res. 60, 285–298.
Manoach, D., Press, D., Thangaraj, V., Searl, M., Goff, D., Halpern, E., Saper, C., and Warach, S. (1999). Schizophrenic subjects activate dorsolateral prefrontal cortex during a working memory task, as measured by fMRI. Biol. Psychiatry 45, 1128–1137.
Manoach, D. S., Gollub, R. L., Benson, E. S., Searl, M. M., Goff, D. C., Halpern, E., Saper, C. B., and Rauch, S. L. (2000). Schizophrenic subjects show aberrant fMRI activation of dorsolateral prefrontal cortex and basal ganglia during working memory performance. Biol. Psychiatry 48, 99–109.
Manoach, D. S., Schlaug, G., Siewert, B., Darby, D. G., Bly, B. M., Benfield, A., Edelman, R. R., and Warach, S. (1997). Prefrontal cortex fMRI signal changes are correlated with working memory load. Neuroreport 8, 545–549.
McCarley, R. W., Shenton, M. E., O’Donnell, B. F., and Nestor, P. G. (1993). Uniting Kraepelin and Bleuler: the psychology of schizophrenia and the biology of temporal lobe abnormalities. Harv. Rev. Psychiatry 1, 36–56.
Meda, S. A., Bhattarai, M., Morris, N. A., Astur, R. S., Calhoun, V. D., Mathalon, D. H., Kiehl, K. A., and Pearlson, G. D. (2008a). An fMRI study of working memory in first-degree unaffected relatives of schizophrenia patients. Schizophr. Res. 104, 85–95.
Meda, S. A., Giuliani, N. R., Calhoun, V. D., Jagannathan, K., Schretlen, D. J., Pulver, A., Cascella, N., Keshavan, M., Kates, W., Buchanan, R., Sharma, T., and Pearlson, G. D. (2008b). A large scale (N = 400) investigation of gray matter differences in schizophrenia using optimized voxel-based morphometry. Schizophr. Res. 101, 95–105.
Meda, S. A., Stevens, M. C., Folley, B. S., Calhoun, V. D., Pearlson, G. D., and Herzog, M. H. (2009). Evidence for anomalous network connectivity during working memory encoding in schizophrenia: an ICA based analysis. PLoS ONE 4, e7911. doi: 10.1371/journal.pone.0007911
Menon, V., Anagnoson, R. T., Mathalon, D. H., Glover, G. H., and Pfefferbaum, A. (2001). Functional neuroanatomy of auditory working memory in schizophrenia: relation to positive and negative symptoms. Neuroimage 13, 433–446.
Michael, A. M., Baum, S. A., White, T., Demirci, O., Andreasen, N. C., Segall, J. M., Jung, R. E., Pearlson, G., Clark, V. P., Gollub, R. L., Schulz, S. C., Roffman, J. L., Lim, K. O., Ho, B.-C., Bockholt, H. J., and Calhoun, V. D. (2010). Does function follow form?: methods to fuse structural and functional brain images show decreased linkage in schizophrenia. Neuroimage 49, 2626–2637.
Molina, V., Solera, S., Sanz, J., Sarramea, F., Luque, R., Rodríguez, R., Jiménez-Arriero, M. A., and Palomo, T. (2009). Association between cerebral metabolic and structural abnormalities and cognitive performance in schizophrenia. Psychiatry Res. 173, 88–93.
Park, S., and Holzman, P. (1992). Schizophrenics show spatial working memory deficits. Arch. Gen. Psychiatry 49, 975–982.
Perlstein, W. M., Carter, C. S., Noll, D. C., and Cohen, J. D. (2001). Relation of prefrontal cortex dysfunction to working memory and symptoms in schizophrenia. Am. J. Psychiatry 158, 1105.
Rypma, B., and D’Esposito, M. (1999). The roles of prefrontal brain regions in components of working memory: effects of memory load and individual differences. Proc. Natl. Acad. Sci. U.S.A. 96, 6558.
Schlösser, R., Gesierich, T., Kaufmann, B., Vucurevic, G., Hunsche, S., Gawehn, J., and Stoeter, P. (2003). Altered effective connectivity during working memory performance in schizophrenia: a study with fMRI and structural equation modeling. Neuroimage 19, 751–763.
Segall, J. M., Turner, J. A., Van Erp, T. G. M., White, T., Bockholt, H. J., Gollub, R. L., Ho, B. C., Magnotta, V., Jung, R. E., and Mccarley, R. W. (2009). Voxel-based morphometric multisite collaborative study on schizophrenia. Schizophr. Bull. 35, 82.
Shenton, M. E., Dickey, C. C., Frumin, M., and Mccarley, R. W. (2001). A review of MRI findings in schizophrenia. Schizophr. Res. 49, 1–52.
Shenton, M. E., Kikinis, R., Jolesz, F. A., Pollak, S. D., Lemay, M., Wible, C. G., Hokama, H., Martin, J., Metcalf, D., and Coleman, M. (1992). Abnormalities of the left temporal lobe and thought disorder in schizophrenia. A quantitative magnetic resonance imaging study. N. Engl. J. Med. 327, 604–612.
Silver, H., Feldman, P., Bilker, W., and Gur, R. (2003). Working memory deficit as a core neuropsychological dysfunction in schizophrenia. Am. J. Psychiatry 160, 1809.
Turetsky, B., Cowell, P. E., Gur, R. C., Grossman, R. I., Shtasel, D. L., and Gur, R. E. (1995). Frontal and temporal lobe brain volumes in schizophrenia. Arch. Gen. Psychiatry 52, 1061–1070.
White, T., O’Leary, D., Magnotta, V., Arndt, S., Flaum, M., and Andreasen, N. C. (2001). Anatomic and functional variability: the effects of filter size in group fMRI data analysis. Neuroimage 13, 577–588.
Keywords: schizophrenia, structural MRI, functional MRI, correlation, gray matter, working memory
Citation: Michael AM, King MD, Ehrlich S, Pearlson G, White T, Holt DJ, Andreasen NC, Sakoglu U, Ho B-C, Schulz SC and Calhoun VD (2011) A data-driven investigation of gray matter–function correlations in schizophrenia during a working memory task. Front. Hum. Neurosci. 5:71. doi: 10.3389/fnhum.2011.00071
Received: 20 June 2011; Accepted: 16 July 2011;
Published online: 05 August 2011.
Edited by:
Hauke R. Heekeren, Max Planck Institute for Human Development, GermanyReviewed by:
Shozo Tobimatsu, Kyushu University, JapanBurkhard Pleger, Max Planck Institute for Human Cognitive and Brain Sciences, Germany
Copyright: © 2011 Michael, King, Ehrlich, Pearlson, White, Holt, Andreasen, Sakoglu, Ho, Schulz and Calhoun. This is an open-access article subject to a non-exclusive license between the authors and Frontiers Media SA, which permits use, distribution and reproduction in other forums, provided the original authors and source are credited and other Frontiers conditions are complied with.
*Correspondence: Andrew M. Michael, The Mind Research Network, 1101 Yale Boulevard NE, Albuquerque, NM 87106, USA. e-mail: andru4u@gmail.com