Neural substrates of visual spatial coding and visual feedback control for hand movements in allocentric and target-directed tasks
- Department of Psychology, The University of Western Ontario, London, ON, Canada
Neuropsychological evidence suggests that different brain areas may be involved in movements that are directed at visual targets (e.g., pointing or reaching), and movements that are based on allocentric visual information (e.g., drawing or copying). Here we used fMRI to investigate the neural correlates of these two types of movements in healthy volunteers. Subjects (n = 14) performed right hand movements in either a target-directed task (moving a cursor to a target dot) or an allocentric task (moving a cursor to reproduce the distance and direction between two distal target dots) with or without visual feedback about their hand movement. Movements were monitored with an MR compatible touch panel. A whole brain analysis revealed that movements in allocentric conditions led to an increase in activity in the fundus of the left intra-parietal sulcus (IPS), in posterior IPS, in bilateral dorsal premotor cortex (PMd), and in the lateral occipital complex (LOC). Visual feedback in both target-directed and allocentric conditions led to an increase in activity in area MT+, superior parietal–occipital cortex (SPOC), and posterior IPS (all bilateral). In addition, we found that visual feedback affected brain activity differently in target-directed as compared to allocentric conditions, particularly in the pre-supplementary motor area, PMd, IPS, and parieto-occipital cortex. Our results, in combination with previous findings, suggest that the LOC is essential for allocentric visual coding and that SPOC is involved in visual feedback control. The differences in brain activity between target-directed and allocentric visual feedback conditions may be related to behavioral differences in visual feedback control. Our results advance the understanding of the visual coordinate frame used by the LOC. In addition, because of the nature of the allocentric task, our results have relevance for the understanding of neural substrates of magnitude estimation and vector coding of movements.
Introduction
Many movements that people perform every day are directed at visual targets. Examples of target-directed movements are pointing and reaching. In the context of visually guided pointing and reaching movements, it is generally assumed that the movement is programmed based on the position of the target with respect to the viewer in egocentric coordinates, even though the exact nature of the egocentric coordinate system is a matter of scientific debate (e.g., Thaler and Goodale, 2010; Crawford et al., 2011). Importantly, however, many movements that people make are not directed at targets, but they have to be programmed based on visual information in allocentric coordinates, i.e., visual information that is coded in an object-centered frame of reference. Examples of movements that are based on allocentric visual coordinates are making sketches of real-world objects or copying a diagram. In these situations the movement is programmed based on visual spatial relationships between the objects in the scene (i.e., the distance between two corners to be copied), not based on visual spatial relationships between the objects and the viewer. Figure 1 illustrates a laboratory version of target-directed and allocentric movement tasks.
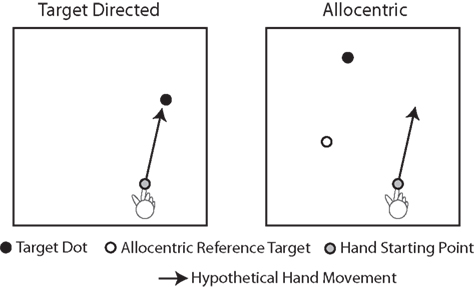
Figure 1. Illustration of target-directed and allocentric movement tasks. In the target-directed task, the subject is instructed to move the finger toward the black target dot. Thus, the movement can be programmed based on the egocentric position of the target with respect to the viewer. In the allocentric task, the subject is instructed to move the finger to a location in space, the position of which with respect to the starting point of the finger matches the position of the black target dot with respect to the white reference dot (the allocentric reference target). Thus, the movement in the allocentric task cannot be programmed based on the egocentric position of the target, but instead, it has to be programmed based on the allocentric position of the target, i.e., the position of the target with respect to the allocentric reference target.
In recent years advancements have been made in understanding the neural and computational basis of pointing and reaching movements that are directed at visual targets (for reviews see for example Desmurget et al., 1998; Lacquaniti and Caminiti, 1998; Kawato, 1999; Desmurget and Grafton, 2000; Todorov, 2004; Buneo and Andersen, 2006; Culham and Valyear, 2006; Culham et al., 2006; Diedrichsen et al., 2010; Filimon, 2010). Yet, despite a growing body of behavioral evidence that suggests that different cognitive and computational processes may be involved in movements performed in allocentric as compared to target-directed conditions as illustrated in Figure 1 (Thaler and Todd, 2009a,b, 2010; Thaler and Goodale, 2010, 2011a,b), we know little about the potential neural basis of these differences.
In fact, there is only one study that directly compared movements between allocentric and target-directed conditions (Schenk, 2006). This study is a neuropsychological study with a patient (patient DF), who has substantial lesions in the ventral visual stream, in particular the lateral occipital complex (LOC), as well as a small lesion in left posterior parietal cortex (James et al., 2003). DF shows impaired performance in the allocentric, but not the target-directed movement task illustrated in Figure 1 (Schenk, 2006) and based on this result, the hypothesis has been put forth that the ventral visual stream, and in particular the LOC, might be involved in spatial visual coding for movements in allocentric but not target-directed conditions (Schenk, 2006; Milner and Goodale, 2008). The current experiments tested this hypothesis in neurologically intact people.
Because there is evidence from behavioral work that movements in target-directed conditions rely more on visual feedback control than biomechanically equivalent movements in allocentric conditions (Thaler and Goodale, 2011a), the current experiments also investigated the neural correlates of visual feedback control for movements in allocentric and target-directed tasks. Brain areas that have been repeatedly implicated in the visual control of target-directed movements comprise area MT+, the superior parieto-occipital cortex (SPOC), and parts of the posterior parietal cortex (Pisella et al., 2000; Whitney et al., 2007; Filimon et al., 2009; Cavina-Pratesi et al., 2010). But given the differences in visual feedback control on the behavioral level between movements in target-directed and allocentric tasks (Thaler and Goodale, 2011a), the question arises as to whether the visual control of these two kinds of movement engage the same neural network.
The current experiments required subjects to perform movements in target-directed and allocentric conditions that were matched for both the visual and biomechanical components of the task. This way we were able to ensure that any differences we observed were entirely due to any differences in visual spatial coding and/or control. In addition, we used an experimental set-up that permitted the acquisition and analysis of hand movement data in the magnet. Thus, we were able to detect any differences in the kinematics of movements made in the two tasks.
We found reliable increases in brain activation in the LOC, intra-parietal sulcus (IPS), and premotor cortex (PMd) in the allocentric as compared to the target-directed task. Importantly, movement kinematics and the visual component of the task were matched. Thus, the differences in brain activation were due to differences in visual spatial coding. The activation in LOC is consistent with earlier work suggesting that the ventral visual stream plays a critical role in tasks such as copying and drawing. We also found that SPOC, MT+, and the posterior IPS were engaged more when visual feedback was available than when it was not, for movements in both allocentric and target-directed tasks. This finding is consistent with the idea that the dorsal visual stream plays a critical role in the visual control of the arm and hand.
Materials and Methods
Subjects
Fourteen right handed volunteers participated in the fMRI experiment and a ∼45-min behavioral practice session. All subjects read and signed the informed consent form and were paid 60 CAD as compensation. All procedures were approved by the Ethics Board of the University of Western Ontario.
Apparatus and Set-Up
Figure 2 illustrates the experimental set-up. A laptop PC was used to run the experiment (Dell Inspiron 6000, 1.7 GHz, 1 GB RAM; ATI Mobility Radeon X300 Video Adapter). A USB controlled touch panel (KTT-120LAM-USB, 4-wire technology; Keytec, Garland, TX, USA) was used to measure hand movements and an LCD projector (AVOTEC Silent Vision Model 6011, Avotec, FL, USA) was used to show the visual scene. The PC, touch panel, and LCD projector were connected as follows: A cable ran from the touch panel located in the scanner room through a filter plate into the USB controller located in the control room. The cable was passed through the filter plate via sub-D 9 pin connection. The USB controller was connected via USB port to the PC. VGA video output ran from the PC through the filter plate into the projector located in the scanner room.
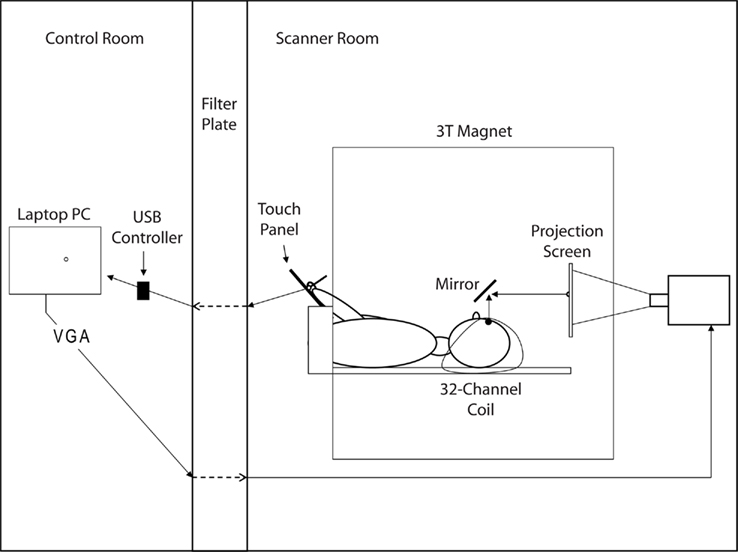
Figure 2. Illustration of the experimental set-up. For details see text.
Stimuli were viewed through a front-surface mirror mounted on top of the head-coil and were projected with the LCD projector on a rear-projection screen located behind the head-coil in the bore. The viewing distance was 290 mm, and the size of the projected image in mm was 200 (h) × 150 (v). The spatial and temporal resolution of the display was 1024 (h) × 768 (v) pixel and 60 Hz, respectively.
Hand movements were recorded with a hand-held stylus on the touch panel. The touch panel consisted of a glass panel laminated with a touch sensitive “plastic” film (resistive technology). A touch of the panel is registered as a change in base voltage (base voltage = 3 V). Base Voltage and voltage registration were handled through the USB controller. The panel was free of metal parts except for thin wiring running between the glass and the film around the rim of the panel. The size of the work area on the panel was 249 (h) × 187 (v) mm. The panel was calibrated to the display via 25-point calibration and custom software, so that a 1-mm movement of the hand on the panel corresponded to a 2.3-mm movement of the cursor on the visual display.
The touch panel was placed above the subject’s abdomen on a wooden platform, which was affixed to the scanner bed via notches in the side of the scanner bed. The platform’s height, tilt, and distance to the subject were adjusted on an individual basis. Subsequent to this “hardware” adjustment, we also performed a software adjustment, during which the origin of the panel coordinate system could be shifted. The goal of these adjustments was to create a set-up in which subjects could comfortably control the screen cursor by moving their hand on the touch panel without moving their head, shoulder, or upper arm. As additional precautions against movements of the head and shoulder, the subject’s head was stabilized inside the coil with foam padding and the subject’s arms and shoulder were stabilized with padding and with a strap running across the chest and shoulders from one side of the scanner bed to the other.
Panel coordinates were sampled at 120 Hz and the video display was updated at 60 Hz. Coordinate sampling and display updating were synchronized so that only every other sample from the panel was used for display purposes. However, all samples were saved to disk for off-line analysis of movement kinematics. Software was written in C/C++ using OpenGL and Windows API.
Experimental Conditions and Behavioral Tasks
Figure 3 (top panel) illustrates the eight experimental conditions that stem from the combination of the three experimental variables task (target-directed vs. allocentric), visual feedback (visual feedback vs. no-visual feedback), and visual field (left vs. right). In all conditions, the background of the visual scene was colored gray, the fixation target was a 0.4° diameter black circle with 0.2° diameter gray center and there were always four separate target dots, each of which was a 1° diameter circle of a different color (white, black, green, or pink) with a 0.2° diameter gray center. The white–black pair of target dots was always in one hemifield (right or left) while the pink–green pair was in the other. Which pair was in which hemifield varied from block to block.
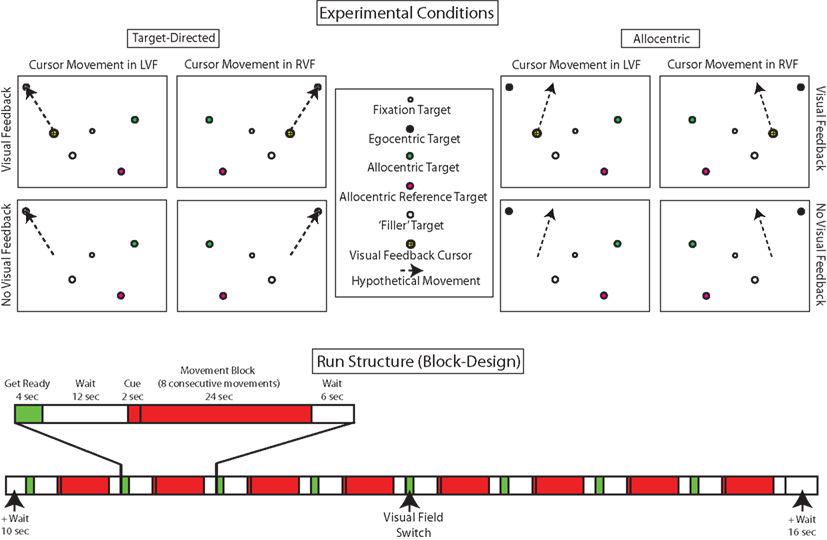
Figure 3. Top panel: illustration of the eight experimental conditions that stem from the combination of the three experimental variables task (target-directed vs. allocentric), visual feedback (visual feedback vs. no-visual feedback), and visual field (left vs. right). For ease of visualization, only one trial is illustrated for each condition, but movements were performed in sequences of eight. As described in the text, the color, and position of the dots was systematically varied across conditions. Bottom panel: illustration of the temporal structure of a run. In keeping with the behavioral paradigm, we used an fMRI block design. In addition to the eight experimental conditions, subjects also performed “wait” and “get ready” conditions. Each subject performed eight runs.
The general task during a block was to perform a sequence of eight movements, one movement after the other, while keeping the gaze directed at the fixation target. At the beginning of each trial, four target dots would appear and remained visible for 1 s. Subjects were required to initiate the instructed movement as soon as the targets appeared. After the target-dots disappeared, the subjects had an additional 2 s to complete their movement before the next configuration of target-dots appeared. Thus, the total duration of a block was 24 s.
Before the start of a block, a visual instruction was shown for 2 s below the fixation target. The instruction told subjects what task that had to perform and what the visual feedback conditions were going to be. With respect to the task, subjects were told which of the target dots were going to be relevant for programming the hand movements in the upcoming block. For example, the target-directed instruction “black” (or “green”) in the beginning of a block instructed subjects, that their task on each trial in a block was to move the cursor (visible or invisible) from one black (or green) target dot to the next (Figure 3, top left panel, illustrates the instruction “black”). In contrast, the allocentric instruction “pink to green” (or “white to black”) instructed subjects that their task on each trial in a block was to move the cursor so that its new position with respect to its original location replicated the relative position of the green (or black) dot with respect to the pink (or white) one on that trial (Figure 3, top right panel, illustrates the instruction “pink to green”).
The instruction also informed subjects if visual feedback about their moving hand would be available or not in the upcoming block (“vision” or “no vision”). When available, visual feedback was provided via a screen cursor that was a 1° diameter black cross on a yellow 1° diameter circle with a black rim.
The position of the relevant target dots and the starting point of the cursor varied with respect to the hemifields in which they were presented. The labeling of the conditions followed the hemifield in which the cursor moved. Thus, in both target-directed and allocentric right or left visual field conditions, the cursor was always located in the right or left field, respectively. As described in the beginning of this section, and illustrated in Figure 3, the black–white and pink–green pairs of target dots always occupied opposite sides of the visual field during any given block. Importantly, in the target-directed task, the target-dots relevant for movement programming (i.e., black or green) were always located in hemifield as the cursor, whereas in the allocentric task the target-dots relevant for movement programming (i.e., white–black or pink–green) were always located in the hemifield opposite the cursor (see Figure 3). The fact that in the allocentric task the dots relevant for moving were in the hemifield opposite to that in which the cursor moved was solely due to the fact that if we had placed the target dots in the same hemifield as the cursor, then the allocentric task would have been quite similar to the target-directed task, because the visual work space in the scanner is so small.
Across all runs, the different experimental instructions (i.e., “black,” “green,” “pink to green,” “white to black”) occurred equally often within and across the right and left visual fields. This ensured that the visual display was completely counterbalanced across all the conditions (except of course for the visual vs. no-visual feedback conditions, where a cursor was present or not).
The exact positions of the target dots within each hemifield were varied from trial to trial in a pseudo-random schedule, based on the following criteria: (1) the eccentricity of the targets dots was between 9° and 17° visual angle, (2) the intended displacement of the cursor for the task was between 13° and 18° visual angle, (3) the specified movement was unique, i.e., the target had to be selected so that subjects had to perform the task they were instructed to do, because otherwise they would generate an incorrect response, and (4) on average, movement biomechanics, and visual displays were the same in allocentric and target-directed tasks.
In addition to the eight experimental conditions, subjects also performed “wait” and “get ready” conditions. During “wait” conditions, subjects were instructed to leave their hand where it was, i.e., to not move it. The displays during the “wait” conditions contained the black fixation target on a gray background and the word “wait” right below the fixation target. During “get ready” conditions subjects were instructed to get ready for the next movement block, i.e., to move the visual feedback cursor to the indicated starting position in the right or left visual field. Displays during get ready conditions contained the fixation target on gray background, the visual feedback cursor, the cursor starting point for the next block, and the words “get ready” right below the fixation target.
Functional Paradigm
Each participant performed eight runs. In keeping with the behavioral paradigm, our functional paradigm was a block design. We used a block design for the following reasons: (1) in general, block designs are statistically efficient to detect differences in activation between conditions (e.g., Friston et al., 1999) (2) beta weights in randomized trial designs are more sensitive to the fit between model HRF and actual HRF than beta weights in block designs. Importantly, HRFs differ considerably between various brain regions, i.e., cerebellum, M1, LOC, etc. (e.g., Miezin et al., 2000). Thus, to avoid any potential bias in our analysis due to differences in HRF shape between brain areas, we chose a block design. (3) Behavioral pilot experiences showed that subjects felt more comfortable, and did better as measured in terms of accuracy and reliability, when they performed the tasks in mini-blocks as compared to randomized trial sequences.
The general temporal structure of a run is depicted in Figure 3, lower panel. Each run started with a 10-s “wait” period and ended with a 16-s “wait” period. In between these two wait periods, each of the eight types of experimental blocks occurred once (24 s per block, with eight movements per block). Each experimental block was preceded by a “get ready” period (4 s), a “wait” period (12 s), and a visual instruction cue (2 s), in that order. Each experimental block was followed by a “wait” period (6 s). The total wait time at the end of a run was thus 22 s (6 + 16 s). Therefore, the total duration of a run was 410 s (6 min 50 s). Altogether, each subject performed a total of 512 movements in the experiment (8 runs, 8 blocks per run, 8 movements per block).
During the “get ready” period that occurred halfway through a run, the visual field was switched from left-to-right or vice versa, depending on which visual field had been used during the first half of the run. The type of visual field switches (i.e., left-to-right or right-to-left) changed across runs and was counterbalanced across subjects (7 Ss had left-to-right as a first switch, 7 Ss had right-to-left as a first switch). The order of the four movement tasks (allocentric–visual feedback, allocentric–no-visual feedback, target-directed–visual feedback, target-directed–no-visual feedback) and the two visual fields was counterbalanced in a way that ensured that each of the eight unique experimental conditions occurred once in every position during the experiment and that every condition was preceded by every other condition. Table A1 in Appendix provides example protocols that illustrate the schematic order of conditions.
fMRI Scanning Parameters
All imaging was performed at the Robarts Research Institute (London, ON, Canada) on a 3-Tesla, whole-body MRI system (Magnetom Tim Trio; Siemens, Erlangen, Germany) using a 32-channel head-coil. Repetition Time [TR] was 2 s. We used a FOV of 211 mm and 64 × 64 matrix size, which led to in-slice resolution of 3.3 mm × 3.3 mm. Slice thickness was 3.5 mm and we acquired 38 contiguous axial slices covering the whole brain (including cerebellum) in ascending interleaved order. Echo time [TE] was 30 ms and Flip-Angle [FA] was 78°. Anatomical Images of the whole brain were acquired at a resolution of 1 mm × 1 mm × 1 mm using an optimized sequence (MPRAGE). Prior to the start of functional scanning for each run, a shimming procedure was employed to reach magnetic field homogeneity. Then, 205 functional volumes were acquired for each run.
Procedure
Prior to fMRI, each subject participated in a ∼45-min behavioral practice session, during which the subject performed at least four practice runs to get acquainted with the paradigm, and during which the experimenter confirmed that the subjects followed the instructions regarding eye-movements. The practice session took place on a different day than fMRI scanning. Runs during the behavioral practice session simulated runs during fMRI, with the only difference being that the subject was seated in front of a computer screen and the touch panel was positioned on top of a table in front of the computer screen.
Setting up the fMRI experiment took approximately 30 min. After set-up, subjects could practice the task inside the scanner for as long as they wished (typically one to two runs). Data from that period was not saved to disk. Once the subject felt comfortable with the set-up and task, the fMRI paradigm started. Each subject performed eight functional runs. Anatomical images were acquired either halfway through the experiment (i.e., after the fourth run), or at the end.
Analysis of Hand Movement Data
Movement data were analyzed using Matlab R14 (The MathWorks, Natick, MA, USA). The movement trace for each block within a run was first filtered with a 4-Hz cut off filter. Then, movement velocities were determined by numerical differentiation of movement traces and filtered once more. The severe filtering was necessary to remove jitter introduced by physical vibrations of the scanner bed that were caused by the EPI sequences. Subsequently, we used movement velocities to determine the start and endpoints of the eight successive movements that subjects had made during a block. To do this, we first selected groups of successive coordinates where movement velocity fell below 10 mm/s for a minimum duration of 333 ms. Due to the nature of the paradigm, which required subjects to make eight movements during each block, we identified nine of these minimal velocity periods (including the beginning of the movement). Start and end points were then computed as the median of the x and y coordinates within each of these minimal velocity periods. For example, the start and endpoints of the first movement in a block were computed as the medians of the first and second minimal velocity periods, and the start and endpoints of the second movement in a block were computed as the medians of the second and third minimal velocity periods, and so on. This way we measured 512 movements for each subject across all conditions and runs, representing 64 movements for each of the eight experimental conditions across runs.
To measure each subject’s performance on each movement, we calculated the distance and orientation of the movement vector as the length and direction of the straight line joining the start and endpoint of each movement. That is, we computed the cursor-to-cursor vector. In the target-directed task, we evaluated the accuracy of this vector with respect to two kinds of ideal vectors: the first of these was the cursor-to-target vector, which represented the vector between the start point of the movement (where the cursor was at the end of the last movement) and the new target position. The second of these was the target-to-target vector, which represented the vector between the position of the previous target and the position of the new target. If a subject were 100% accurate and always acquired the specified targets, then the two vectors would always be identical. In the allocentric task, there was only one ideal vector. Specifically, in the allocentric task subjects were asked to copy the target-to-target vector on every trial. Thus, the start point of the cursor always represented the position of the reference target in the opposite hemifield. It follows then, that if the target-to-target vector were “superimposed” on the start point of the cursor to create some sort of a virtual target, the cursor-to-target-vector computed based on this “virtual” target would be the same as the target-to-target vector. Figure 4 illustrates how the various vectors were computed in the target-directed and allocentric tasks.
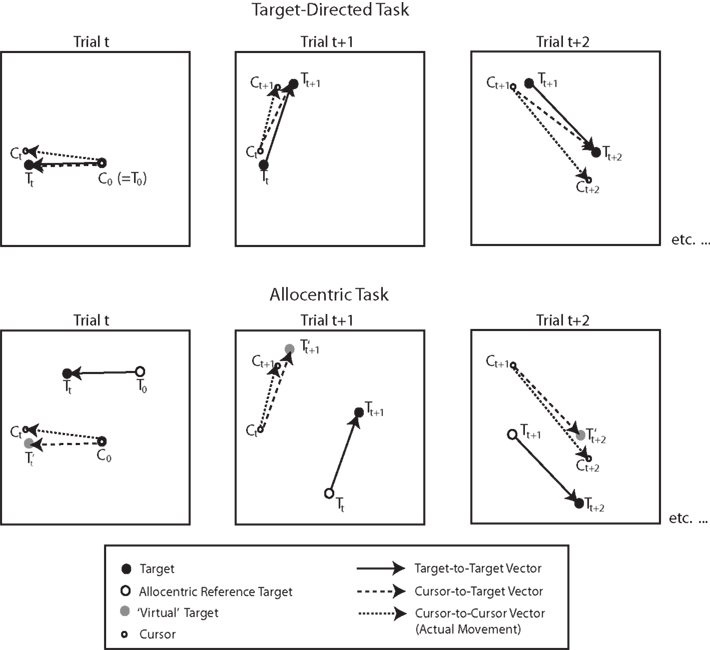
Figure 4. Illustration of the vectors computed in the context of behavioral data analyses for target-directed and allocentric tasks. Capital C and T refer to the position of the cursor and target, respectively. Subscripts refer to trial numbers. C0 denotes the starting point of the cursor in the beginning of a block. T0 denotes the starting target, or starting reference target, respectively, in the beginning of a block. T′ denotes the “virtual” target in the allocentric task, which is the position that would correspond to the display target if the target-to-target vector were “superimposed” on the start point of the cursor. Thus, in the allocentric task the cursor-to-target vector is the same as the target-to-target vector. For more details, see text.
To compare movement and ideal vectors, we computed distance and orientation errors. Distance error was the difference between the actual distance and indicated movement distance (in millimeter) using the x and y coordinates of the touch panel. Orientation error was the angular difference between the actual and intended movement direction. We then used these variables to compute both constant and variable errors, i.e., mean and SD.
Analysis of fMRI Data
fMRI data were analyzed using Brain Voyager QX version 1.10.4 (Brain Innovation, Maastricht, The Netherlands).
Preprocessing
For all runs, the first five volumes were discarded from functional data analysis, but the first volume was used for functional-to-anatomical co-registration. Each run was subjected to slice scan-time correction (Tri-linear sinc), linear trend removal, and 3-D motion correction (Tri-linear sinc). 3-D motion correction was performed such that each volume within a run was aligned to the functional volume closest to the anatomical scan. We then co-registered the functional volume closest to the anatomical scan to the anatomical image for each participant. Then, functional data for each subject were mapped into standard stereotactic space (Talairach and Tournoux, 1988) using the transformation parameters, obtained from that subject’s anatomical image. Subsequently, time courses were spatially smoothed (FWHM 6 mm Gaussian).
Functional analysis
To obtain activity related to the eight different experimental conditions, we applied a GLM to the z-transformed time courses. The GLM included one predictor of no interest for the “get ready” condition and one predictor for each of the eight experimental conditions. The experimental predictors included the visual cue. We treated the “wait” conditions as baseline. Predictors were obtained by convolving a boxcar function that spanned the duration of the event (i.e., either an experimental block or the get ready phase) with the standard 2-gamma HRF with default settings (time to response peak = 5 s; time to undershoot peak = 15 s; response undershoot ratio = 6). The GLM was run as a fixed-effects model for each subject and as a random-effects model across subjects. Statistical significance was assessed on the individual voxel level for the whole brain (including the cerebellum) using conjunction analyses based on the minimum p-value (Nichols et al., 2005). In the context of this analysis the same statistical threshold is applied to each component contrast. It follows, that to be considered significant for the conjunction as a whole a voxel had to be significant for each individual statistical test within the conjunction. To control the rate of type-I errors in the statistical map obtained from the conjunction analysis, we applied a cluster size threshold (Forman et al., 1995). Cluster threshold values were estimated in volume space using the BrainVoyager Cluster Threshold Estimator Plugin (Goebel et al., 2006). The particular set of conjunctions we used was motivated by our research hypotheses. Table 1 summarizes the conjunctions that we used, their minimum p-values and their cluster size thresholds. More details with regard to the analyses and their interpretation are given in the Section “Results.”

Table 1. Names, p-values, and syntax of conjunctions used for statistical analysis of functional fMRI data.
Where statistically suitable, we validated the results obtained with our conjunction analyses using a 2 × 2 × 2 ANOVA, with “task,” “visual field,” and “visual feedback” as within subjects factors. The results of the ANOVA were first evaluated using Bonferroni corrected significance thresholds (p < 0.1). If this analysis did not reveal a significant result in an area that had been identified using the conjunction analyses, we subsequently evaluated the result using cluster size thresholds (p < 0.0001). This way, we were able to determine if the “lack of activity” in the ANOVA as compared to our conjunction analysis was due to the more conservative statistical criterion as introduced by Bonferroni correction, or due to a qualitatively different result.
Results and Discussion
Behavioral
Table 2 summarizes the results of the analysis of movement data collected during fMRI collapsed across the right and left visual fields. We collapsed across visual fields, because an initial statistical analysis in which we had subjected each of the behavioral measures to a repeated measures ANOVA with task, visual feedback, and visual field as within subjects factors, had revealed no significant effects of field. The results of repeated measures ANOVA with task and visual feedback as within subject factors are shown in the rightmost column of Table 2. As mentioned in the Section “Materials and Methods,” for the allocentric task, accuracy measures using the cursor-to-target vector are same as those using the “target-to-target” vector (i.e., these two reference vectors are identical).
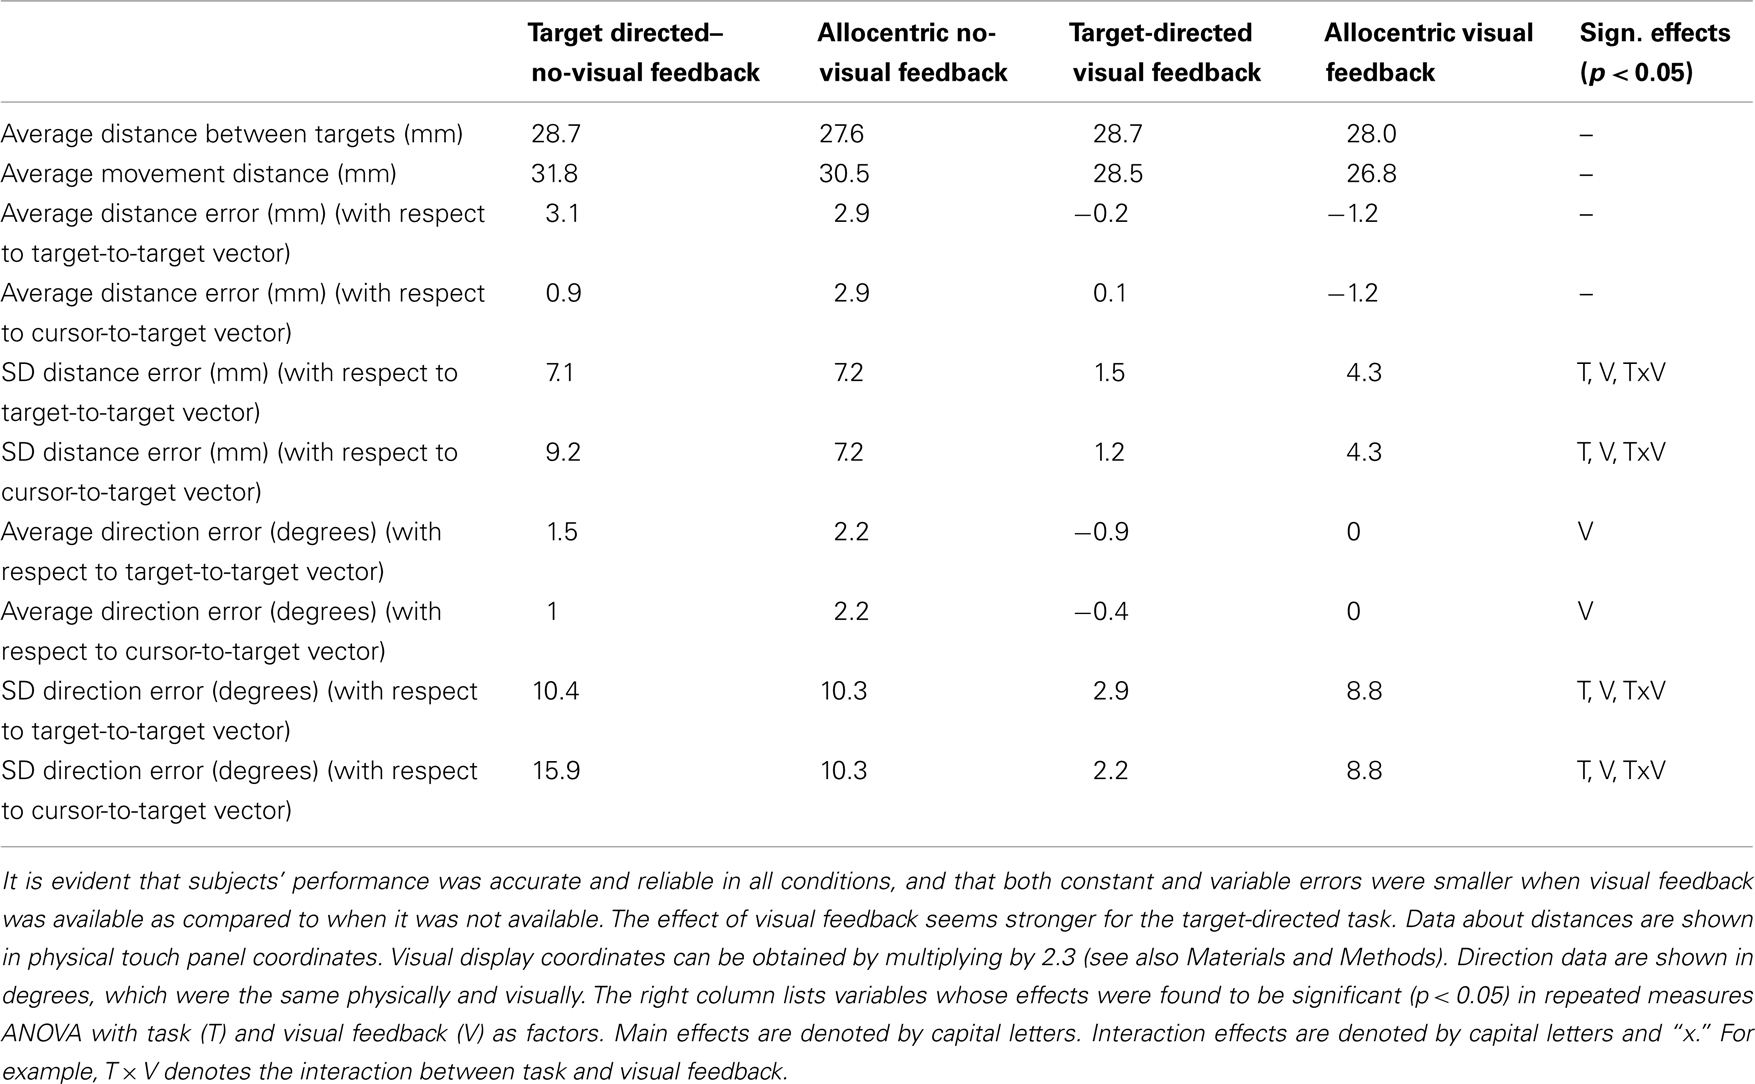
Table 2. Summary of analysis of hand movement data collected during fMRI.
It is evident from Table 2, subjects’ performance was accurate and reliable in all conditions, regardless of whether we used cursor-to-target or target-to-target vector as the reference vector, even in the target-directed task, where these two measures might differ from trial to trial. This shows that subjects were able to do the tasks. In addition, it is evident that in both target-directed and allocentric conditions both constant and variable errors were smaller when visual feedback was available as compared to when it was not available. This means that subjects used visual feedback to control their movements in both target-directed and allocentric tasks. Interestingly, the effect of visual feedback seems stronger for the target-directed task, which is also reflected in the significant interaction effects between task and vision for direction and distance SD. This result is consistent with previous data from our lab – and suggests that visual feedback control is stronger for target-directed as compared with allocentric movements (Thaler and Goodale, 2011a). Finally, we want to point out that physical movement distances were small (∼30 mm) and similar across all conditions. This was expected from our experimental set-up.
fMRI
Shared activation
To determine which parts of the brain were active during all eight experimental conditions, we used a conjunction analysis that identified those voxels that were more active during each of the eight experimental conditions than during baseline (conjunction “Experimental Task > Baseline” in Table 1). The voxels that were identified this way signify a “shared sensory–motor network,” which comprises activity due the planning and execution of hand movements in all conditions. The results of this analysis are shown in Figure 5, which also provides gridlines which can be used to determine the location of activation foci in stereotactic coordinates (Talairach and Tournoux, 1988). It is evident from Figure 5 that the activation comprises known sensory–motor areas in occipital, parietal, and frontal cortices, as well as the cerebellum, basal ganglia, and thalamus. In particular, we found lateralized activation in the left motor strip, in anterior portions of the left IPS, and in right cerebellar lobules V and VIII. This pattern of activity makes sense considering that subjects performed movements with their right hand, and considering that these areas are typically activated by movements performed with the contra (cortex) or ipsilateral (cerebellum) upper limb. Activity in the basal ganglia comprises mostly the putamen. In both the basal ganglia and thalamus activity appears to be stronger on the left side, with most of the left-lateralized activity in the thalamus evident in the pulvinar nucleus and ventral posterior and ventral lateral nuclei. This pattern of activity also makes sense considering that the basal ganglia are involved in contralateral limb movements, that M1 and cerebellar lobules V and VIII form a motor loop via ventral nuclei in the thalamus (Strick et al., 2009), and that the pulvinar relays information between cortical areas (Sherman and Guillery, 2006). In addition, we found bilateral activity in the middle temporal lobe near the occipito-temporal border, as well as in superior occipital cortex and the posterior and superior portions of parietal cortex. We did not see activity in calcarine cortex. This suggests that the presence of the four small target dots in the movement blocks did not significantly increase activity in calcarine cortex over baseline, during which subjects were presented with the same gray screen and fixation target as during movement blocks. In short, our initial conjunction analysis identified a “shared sensory–motor network” that maps onto what is currently known about areas of the human brain involved in the production of spatially directed movements of the upper limbs (for reviews see Culham and Valyear, 2006; Culham et al., 2006; Strick et al., 2009; Filimon, 2010). Please note that the 2 × 2 × 2 ANOVA does not provide a main or interaction effect that would be statistically equivalent to the conjunction “Experimental Task > Baseline.”
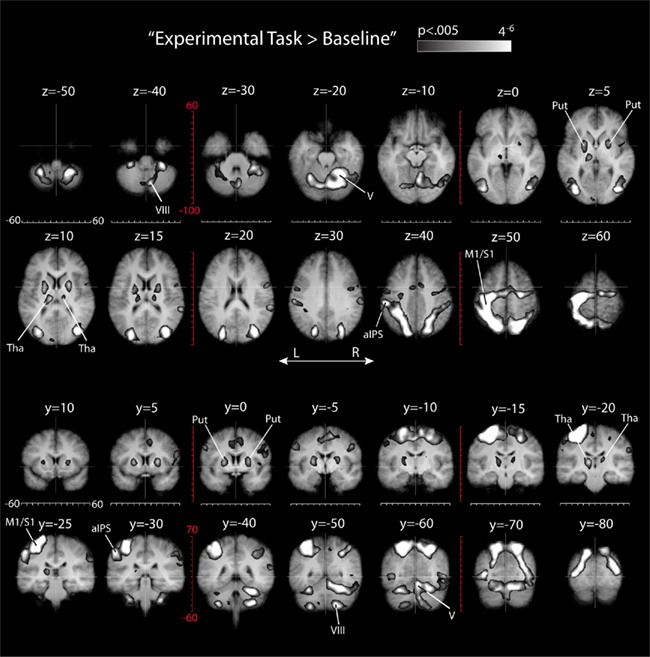
Figure 5. Results of the conjunction analysis “Experimental Task > Baseline” (Table 1) overlaid on subjects’ average Talairach-brain (n = 14). Statistical thresholds were those applied to each of the component contrasts in the conjunction. Probability of type-I errors in the resulting activation map was controlled using cluster size thresholds. Significant activity (clusters colored gray) a “shared sensory–motor network.” It is evident that the activation comprises known sensory–motor areas in occipital, parietal, and frontal cortices, as well as the cerebellum, basal ganglia, and thalamus. Top panels: transverse slice views of activation foci and stereotactic coordinates (Talairach and Tournoux, 1988). The numerical values above each panel denote the z-dimension, white gridlines denote the x-dimension, and red gridlines denote the y-dimension in Talairach-space. Bottom panels: coronal slice views. The numerical values above each panel denote the y-dimension, white gridlines denote the x-dimension, and red gridlines denote the z-dimension in Talairach-space.
Visual feedback vs. no-visual feedback
To determine which parts of the brain were active during the presence of visual feedback for hand movements in both target-directed and allocentric conditions and for both right and left visual field conditions, we used a conjunction analysis. That is, we identified those voxels that were more active during each of the four visual feedback conditions than they were during baseline conditions as well as during the biomechanically and spatially matched no-visual feedback counterparts (conjunction “Visual Feedback > No-Visual Feedback” in Table 1). The voxels that were identified this way revealed a “visual feedback network” (the brain areas colored yellow in Figure 6), which comprises activity related to the presence – and presumably the use of - the visible cursor. Stereotactic coordinates of activation foci are provided in Table 3.
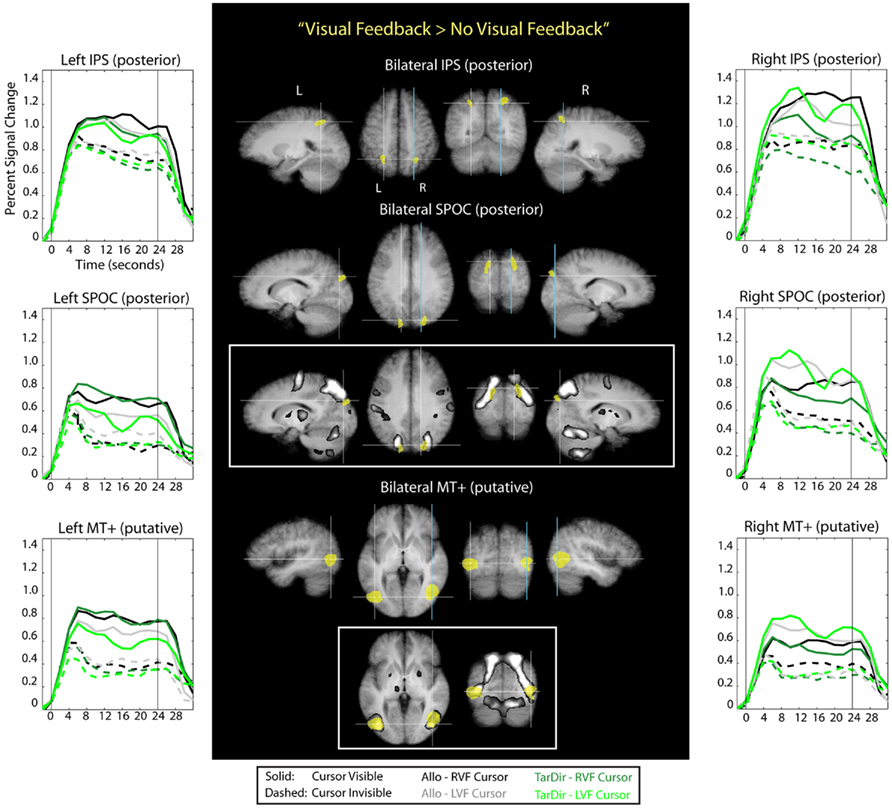
Figure 6. Results of the conjunction analysis “Visual Feedback > No-Visual Feedback” (Table 1) overlaid on subjects’ average Talairach-brain (n = 14). Statistical thresholds (p < 0.005) were those applied to each of the component contrasts in the conjunction. Probability of type-I errors in the resulting activation map was controlled using cluster size thresholds. Brain areas that are activated by visual feedback are shown in yellow. It is evident that visual feedback leads to an increase in BOLD activation in middle temporal regions, superior parietal–occipital cortex (SPOC), and in posterior portions of the intra-parietal sulcus (IPS). Stereotactic coordinates of activation foci are provided in Table 3. Insets illustrate the degree of overlap between “visual feedback areas” and the “shared sensory–motor network” (gray). No insets are provided for areas overlapped entirely by the “shared sensorimotor network.” Event related averages of regions depicted in yellow are shown as well.
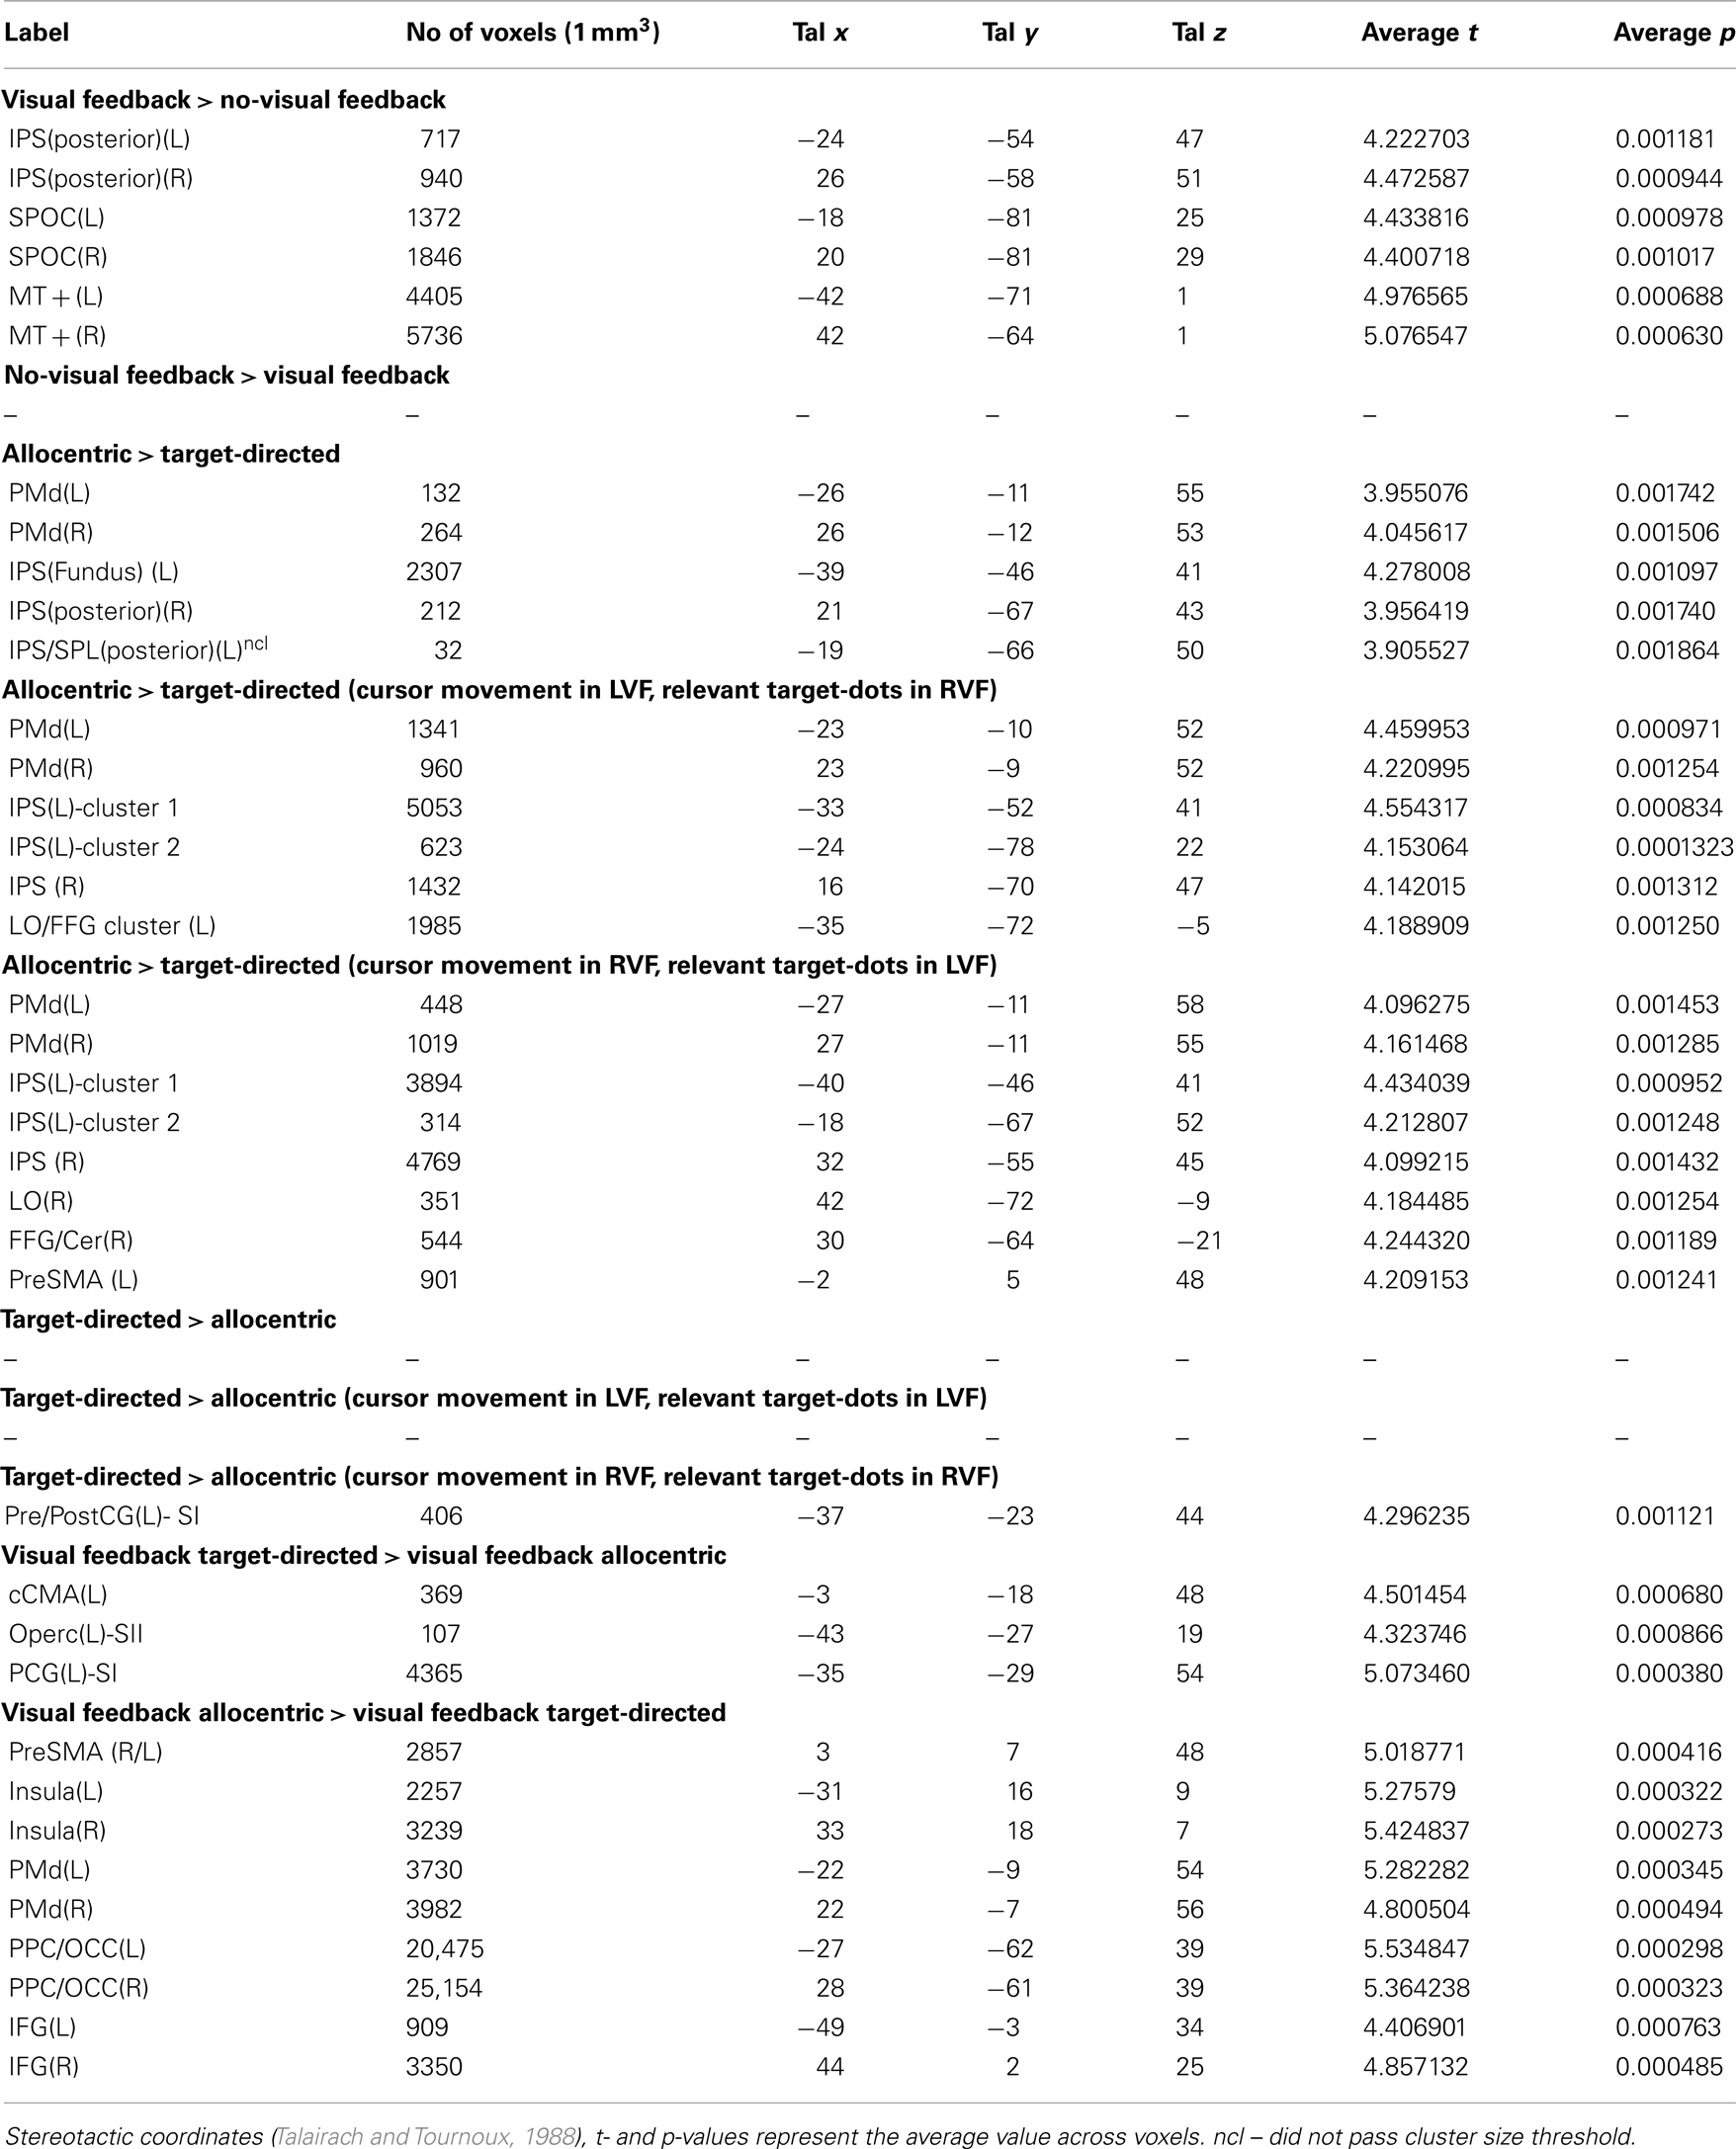
Table 3. Results of conjunction analyses defined in Table 1.
It is evident from Figure 6 and Table 3 that visual feedback leads to an increase in BOLD activation in middle temporal regions, SPOC, and in posterior portions of the IPS. Visual feedback in our experiment was a moving cursor. It seems likely, therefore, that the activation in the middle temporal cortex reflects activity in visual motion area MT+. This conclusion is supported by the fact that the stereotactic coordinates of the activation correspond to those that have previously been reported for area MT+ (e.g., Watson et al., 1993; Tootell et al., 1995). Moreover, the time course data show stronger activation to visual cursor motion in the contralateral visual field, which is characteristic of area MT+. Interestingly, the central portions of the putative area MT+ that are active during visual feedback conditions overlap with the “shared sensory–motor network” (see inset). This implies that parts of this region are also active during no-visual feedback conditions, in which only the small, static target dots, as well as tactile and proprioceptive sensory information are available. This activation might therefore indicate that are MT+ is driven by tactile and/or proprioceptive input in our experiments, which would be consistent with previous reports that suggest that area MT+ in neurologically intact volunteers also responds to tactile motion, even though it remains to be determined to what degree this effect may be due to visual imagery (Hagen et al., 2002; Blake et al., 2004; Beauchamp et al., 2007). However, area MT+ also exhibits a strongly non-linear response to visual contrast. Therefore, the activity that we see in putative area MT+ during no-visual feedback conditions in our experiments may also be due to the presence of the small static target dots, even though no response was evident in V1.
The BOLD activation in SPOC extends from the posterior border of the superior end of the parietal–occipital sulcus (POS) into the occipital lobe. The time course data suggest that this region shows a preference for contralateral visual cursor motion, but the effect is less pronounced than for the activation seen in the middle temporal cortex. Interestingly, the more lateral-inferior portions of the SPOC activation, which are located more distally from the posterior border of the POS, overlap with the shared sensory–motor network, whereas the more medial-superior portions, which are located more proximally to the posterior border of the POS, do not overlap this network (see inset). Previous reports have termed the latter portion of SPOC “pSPOC” and it has also been suggested that this region might be homologous to area V6 in the monkey (Cavina-Pratesi et al., 2010). Overall, the activation we observed in SPOC in response to visual feedback appears to be consistent with that reported in previous reports linking activity in this part of the brain to the visual control of pointing movements (Filimon et al., 2009).
With regard to the visual feedback related activity in the posterior IPS, it is interesting to note that this activity, in contrast to activity in SPOC and (putative) MT+, overlaps entirely with the shared sensory–motor network. In addition, the time course data show that activity in the posterior IPS does not have contralateral visual bias. Thus, there is the possibility that the increase in activity in the posterior IPS during visual feedback is not specific to vision per se, but reflects instead the participation of this region in sensory–motor control based on sensory information that could arise from any modality. This interpretation is consistent with reports that link activity in posterior IPS to the performance of pointing and reaching movements, whether or not visual feedback is available (for reviews see for example Buneo and Andersen, 2006; Culham and Valyear, 2006; Culham et al., 2006; Filimon, 2010).
Finally, we want to highlight that we did not find brain areas that were more active during no-visual feedback than during visual feedback conditions, i.e., the conjunction “No-Visual Feedback > Visual Feedback” (Table 1) did not reveal any significant results.
In summary, the pattern of results that we see in our comparison between visual feedback and no-visual feedback conditions is consistent with the idea that area MT+ and SPOC are involved in visual feedback control for both allocentric and target-directed movements.
Validating our results from the conjunction, the main effect of “visual feedback” in the 2 × 2 × 2 ANOVA revealed significant activity in the same areas as the conjunction “Visual Feedback > No-Visual Feedback” (stereotactic coordinates of activation foci are reported in Table A2 in Appendix).
Allocentric vs. target-directed visual spatial coding
Across visual fields. To determine which parts of the brain were more active during movements in allocentric as compared to target-directed conditions both in the presence and absence of visual feedback and in both the right and left visual fields, we used another conjunction analysis. That is, we identified those voxels that were more active during each of the four allocentric conditions than they were during baseline condition as well as during the visually and biomechanically matched target-directed counterparts (conjunction “Allocentric > Target-Directed” in Table 1). Since the visual and biomechanical components of movements in allocentric and target-directed conditions were matched for this comparison, the activity that was identified this way comprises activity due to allocentric visual coding.
Figure 7 shows the results of this analysis. Stereotactic coordinates of activation foci are provided in Table 3.
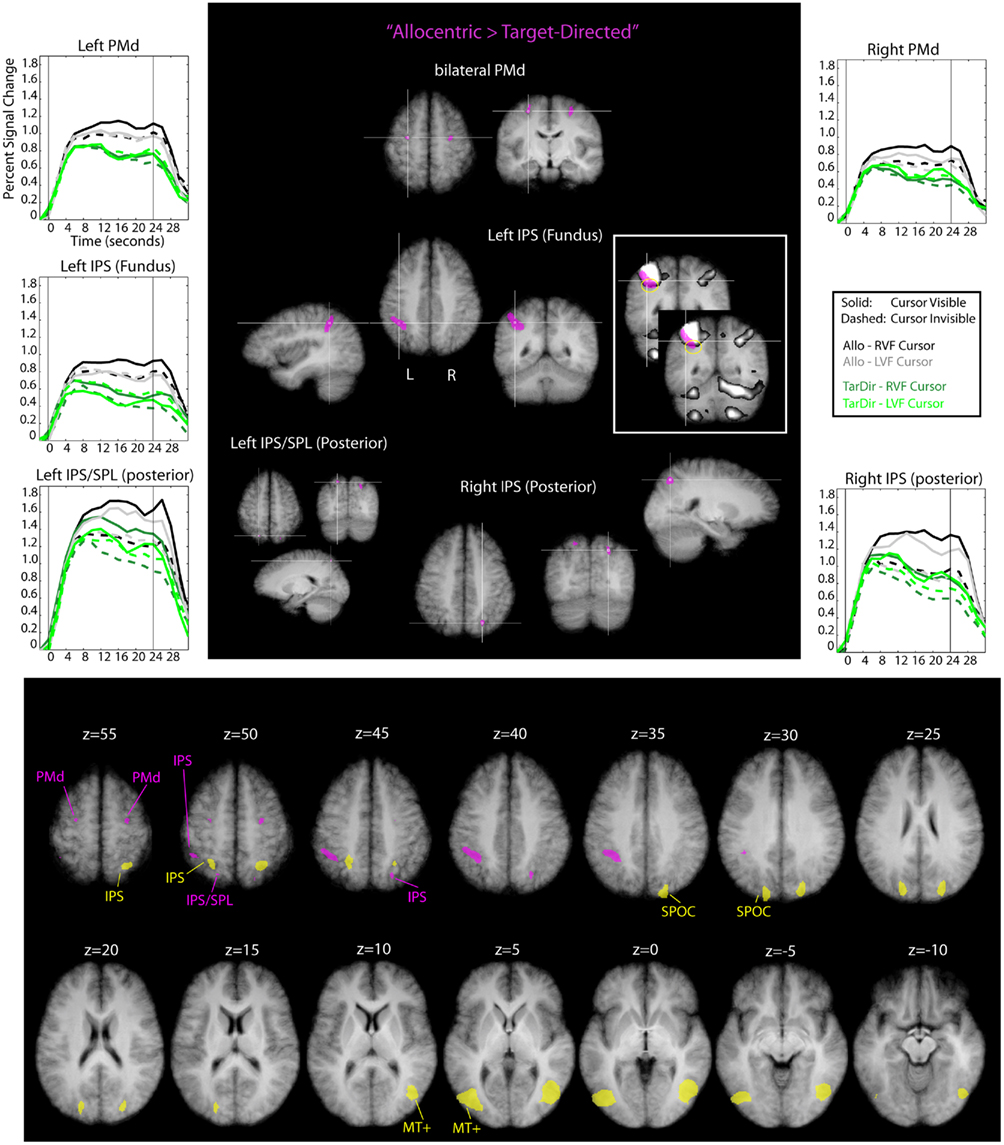
Figure 7. Results of the conjunction analysis “Allocentric > Target-Directed” (Table 1) overlaid on subjects’ average Talairach-brain (n = 14). Statistical thresholds (p < 0.005) were those applied to each of the component contrasts in the conjunction. Probability of type-I errors in the resulting activation map was controlled using cluster size thresholds. Upper panel: areas involved in allocentric spatial coding are shown in magenta. It is evident that allocentric coding led to an increase in activity in bilateral dorsal premotor cortex (PMd), the fundus of the left IPS and right posterior IPS. In addition, there was a cluster of activity in left posterior superior parietal cortex (SPL). Stereotactic coordinates of activation foci are provided in Table 3. Insets illustrate the degree of overlap between “allocentric areas” and the “shared sensory–motor network” (gray). No insets are provided for areas overlapped entirely by the “shared sensorimotor network.” Event related averages of regions depicted in magenta are shown as well. Lower panel: slice views to illustrate relative arrangement of “visual feedback” (yellow) and “allocentric” (magenta) brain areas. It is evident that “visual feedback” and “allocentric” areas do not overlap.
It is evident from Figure 7 and Table 3 that allocentric coding led to an increase in activity in bilateral dorsal PMd, the fundus of the left IPS and right posterior IPS. In addition, there was a cluster of activity in left posterior superior parietal cortex; this cluster, however, did not pass the cluster size threshold. We show this cluster because its position was rather similar to the position of the cluster in the right posterior IPS and because its time courses resembled the time courses of the cluster in the right posterior IPS. Importantly, “allocentric” brain areas did not overlap with “visual feedback” areas (see lower panel of Figure 7) and activity in the depth of the left IPS (fundus) extended beyond the shared sensory–motor network (also highlighted with yellow circles in Figure 7).
Activity in the fundus of the IPS has been implicated in the computation of numerical magnitude and the estimation of length of line segments (Hubbard et al., 2005; Tudusciuc and Nieder, 2007, 2009; Nieder and Dehaene, 2009). It has also been suggested that the left IPS might be particularly relevant for the computation of fine-grained magnitude estimates (Nieder and Dehaene, 2009). The allocentric task required subjects to determine the distance (and direction) between two dots and use this information to perform a hand movement. In a way, the allocentric task is therefore akin to a task that requires the exact estimation of a line segment’s length or visual magnitude. This could explain why performance of the allocentric task resulted in increased activity in the fundus of the IPS. The left-lateralized nature of the activity we observed might potentially be due to the fact that subjects performed movements with their right hand, or due to true lateralization for the sort of allocentric movements that were performed in our experiment. More research is needed to address this.
With regard to the activity in posterior parietal cortex and the PMd it is important to note that this activity overlapped entirely with the shared sensory–motor network. Previous work has linked activity in PMd to the selection of movement parameters (e.g., Cisek and Kalaska, 2005; Beurze et al., 2007; for review see for example Chouinard and Paus, 2006; Medendorp et al., 2008) and activity in the IPS (and SPL) to processes involved in visuo-motor transformations and movement planning (e.g., Beurze et al., 2007; for reviews see for example Buneo and Andersen, 2006; Medendorp et al., 2008). Therefore, the increase in activity in these areas might suggest that movements for which the visual spatial coding is allocentric places a higher load on processes involved in movement selection and visuo-motor transformations compared to movements for which the visual spatial coding is target-directed. There is also the possibility that the activity increase in PMd and IPS is driven by purely visual transformations, independent of movement planning. For example, it has been shown that the SPL is involved in mental rotation paradigms and general coordinate transforms and that these tasks also drive responses in PMd (e.g., Lamm et al., 2007). It is possible that the allocentric task is composed of the target-directed task plus a visual component. This visual component could consist of a mental transformation of the allocentrically defined response vector into another visual reference frame, which would, perhaps, drive a similar network as the one involved in mental rotation.
Finally, we want to highlight that we did not find brain areas that were more active during target-directed than during allocentric conditions, i.e., the conjunction “Target-Directed > Allocentric” (Table 1) did not reveal any significant activations.
Validating our results from the conjunction, the main effect of “task” in the 2 × 2 × 2 ANOVA revealed significant activity in the same areas as the conjunction “Allocentric > Target-Directed” (stereotactic coordinates of activation foci are reported in Table A2 in Appendix).
Separately for right and left visual fields. To determine which parts of the brain were more active during allocentric as compared to target-directed conditions both with and without visual feedback, but separately for the left and right visual fields, we used a conjunction analysis. That is, we identified voxels in each visual field separately that were more active during both allocentric feedback conditions than during baseline and during their visually and biomechanically matched target-directed counterparts [conjunction “Allocentric > Target-Directed (Cursor movement in LVF, relevant target-dots in RVF)” and “Allocentric > Target-Directed (Cursor movement in RVF, relevant target-dots in LVF)” in Table 1]. Again, since the visual and biomechanical components of movements in allocentric and target-directed conditions were matched for this comparison, the activity that is identified this way comprised activity due to visual spatial coding. Figure 8 and Table 3 show the results of this analysis. The analysis revealed significant activations in PMd, posterior parietal cortex as well as in lateral and inferior occipital cortex. Table 3 contains stereotactic coordinates of the activations. As expected from the way the conjunction analysis was constructed, the activations in PMd and parietal cortex include those activations that we identified when we evaluated allocentric activity for both the right and left visual fields combined (Table 3). Thus, for conciseness, Figure 8 illustrates results for only the occipital lobe.
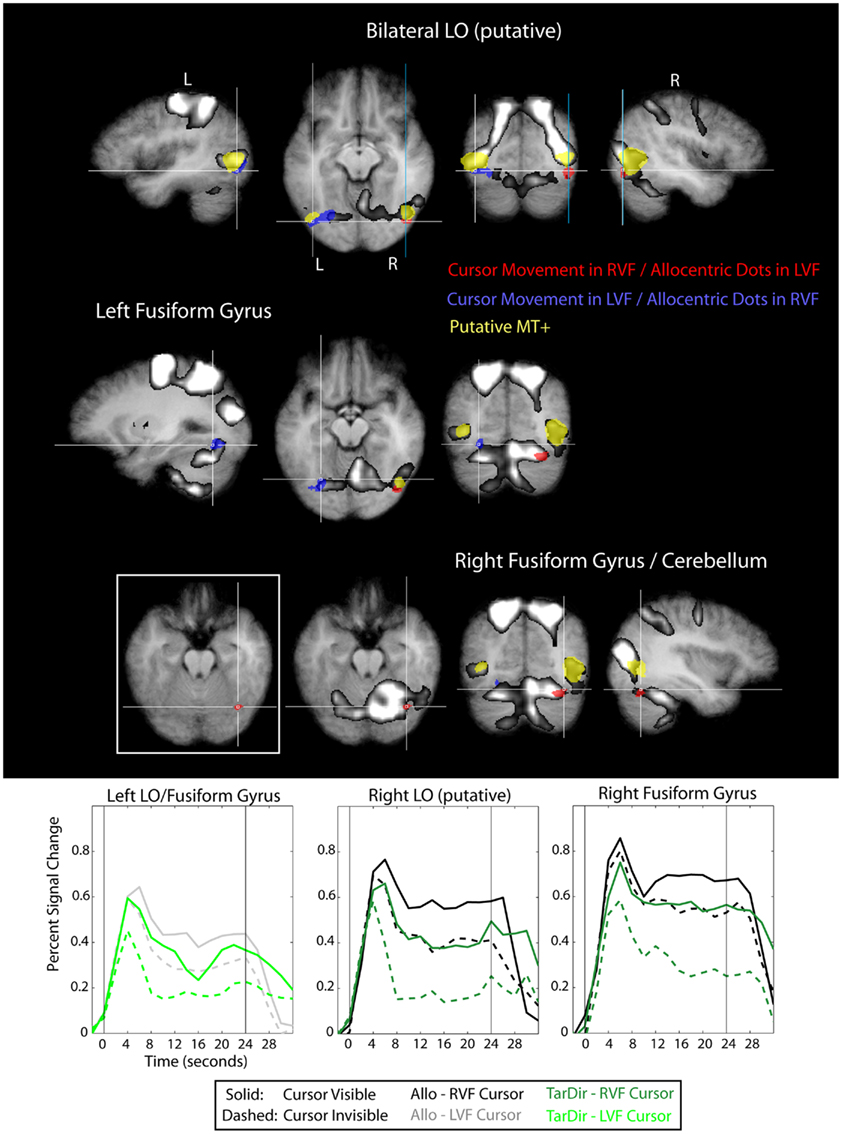
Figure 8. Results of the conjunction “Allocentric > Target-Directed (Cursor movement in LVF, relevant target-dots in RVF)” and “Allocentric > Target-Directed (Cursor movement in RVF, relevant target-dots in LVF)” (Table 1) with regard to the occipital lobe, overlaid on subjects’ average Talairach-brain (n = 14). Statistical thresholds (p < 0.005) were those applied to each of the component contrasts in the conjunction. Probability of type-I errors in the resulting activation map was controlled using cluster size thresholds. It is evident that activity in the occipital lobe related to allocentric spatial coding included posterior portions of the fusiform gyrus (FFG) and portions of lateral occipital cortex adjacent and posterior to putative visual motion area MT+ (putative area LO). For stereotactic coordinates of activation foci see Table 3. Brain areas in the occipital lobe that are more active during allocentric movements performed in the right or left visual field are denoted in red and blue, respectively. Also shown are “visual feedback areas” (yellow) and the “shared sensory–motor network” (gray). The inset in Figure 8 shows activity without the “shared sensory–motor network” to illustrate the border between cerebellum and activity in inferior occipital cortex. Event related averages of regions depicted in red and blue are shown as well.
It is evident from Figure 8 that activity in the occipital lobe related to allocentric spatial coding included posterior portions of the fusiform gyrus (FFG) close to cortico-cerebellar boundary, as well as portions of lateral occipital cortex immediately adjacent to and posterior and inferior to putative visual motion area MT+. The increase in activity in the occipital lobe was contralateral to the side of the visual field in which the relevant targets were located, i.e., when the participants based their response on dots located in the right visual field, we observed an increase in activity in left lateral and inferior occipital cortex, and vice versa. This contralateral visual bias was also evident in the time course data. With regard to the activation that we observed in lateral (but not inferior) occipital cortex we want to point out that the location of this activation with respect to (putative) area MT+ and its contralateral bias are consistent with it being visual area LO (e.g., Malach et al., 1995; Niemeier et al., 2005). Furthermore, we want to highlight that the locations of allocentric-related activations that we observed in both lateral and inferior occipital cortex correspond well to the locations of the lesion sites in occipital cortex of patient DF (compare to Figure 3 in James et al., 2003).
Validating our results from the two conjunction analyses that investigated activity related to allocentric visual coding separately for the left and right visual fields, the interaction effect between task and visual field in the 2 × 2 × 2 ANOVA revealed significant activity in areas in occipital cortex that coincide with those activations in occipital cortex revealed by the conjunctions “Allocentric > Target-Directed (Cursor movement in LVF, relevant target-dots in RVF)” and “Allocentric > Target-Directed (Cursor movement in RVF, relevant target-dots in LVF)” (stereotactic coordinates of activation foci are reported in Table A2 in Appendix).
Finally, we want to mention that the only brain area that was more active during target-directed than during allocentric conditions (analyzed separately for the right and left visual field) was a small patch in primary somatosensory cortex for movements in the right visual field [conjunction “Target-Directed > Allocentric (Movement in RVF, relevant target-dots in RVF)” in Table 1]. This activity was entirely within the shared sensory–motor network.
In summary, the data suggest that all brain areas active during the target-directed task were also active during the allocentric task. In addition, the allocentric task resulted in an increase in activity in areas that were within the “shared sensory–motor network” (posterior IPS and PMd) as well as outside (the fundus of the left IPS and the LOC).
Visual feedback allocentric vs. visual feedback target-directed
To determine if there was a difference in brain activity between target-directed and allocentric visual feedback conditions, we used yet another conjunction analysis. That is, we identified which voxels were more active during target-directed (or allocentric) visual feedback conditions than during baseline and during their visually and biomechanically matched allocentric (or target-directed) counterparts (conjunction “Visual Feedback Target-Directed > Visual Feedback Allocentric” and “Visual Feedback Allocentric > Visual Feedback Target-Directed” in Table 1). To increase the power of this analysis we averaged across the two visual fields for each individual test of the conjunction. To compensate for the associated increase in type-I error probability, we increased our significance threshold from 0.005 to 0.0025. Figure 9 and Table 3 show the results of this analysis.
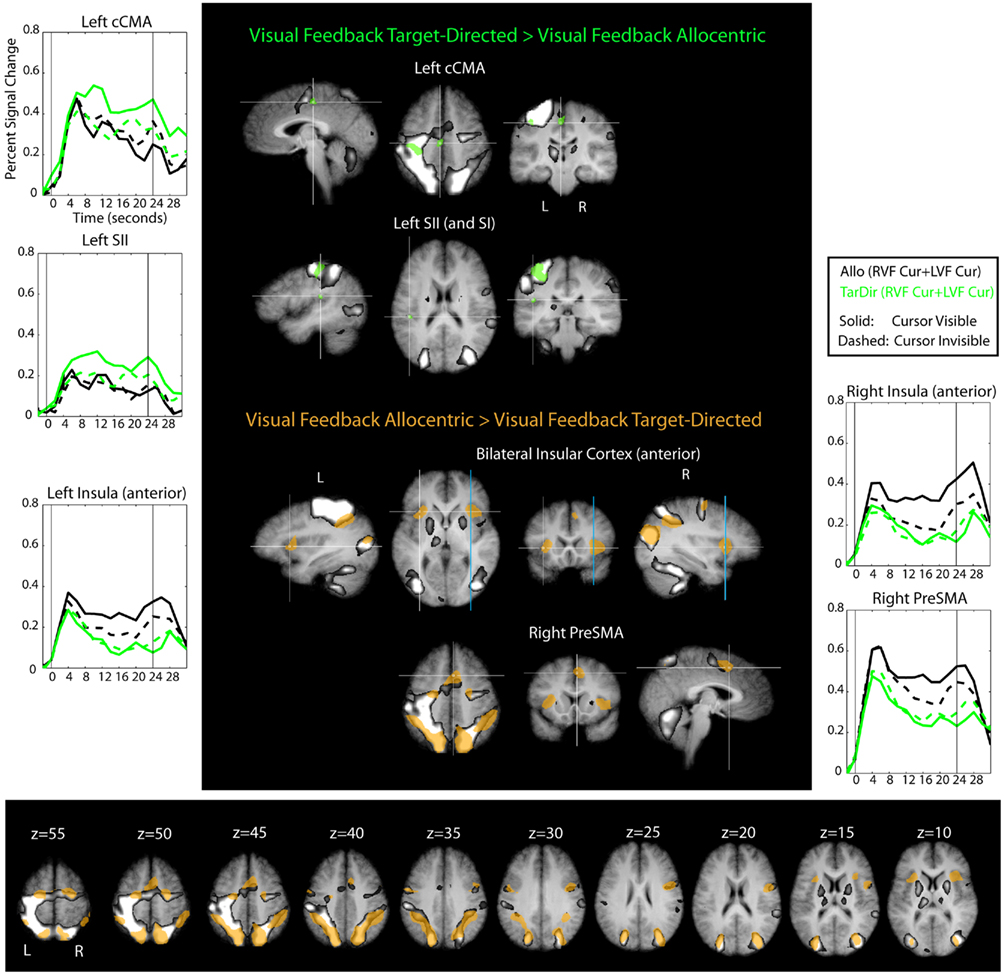
Figure 9. Results of the conjunction “Visual Feedback Target-Directed > Visual Feedback Allocentric” and “Visual Feedback Allocentric > Visual Feedback Target-Directed” (Table 1) overlaid on subject’s average Talairach-brain (n = 14). It is evident that visual feedback leads to different patterns of activation in target-directed and allocentric movement tasks. Statistical thresholds (p < 0.0025) were those applied to each of the component contrasts in the conjunction. Probability of type-I errors in the resulting activation map was controlled using cluster size thresholds. Upper panel: brain areas that are more active during target-directed or allocentric visual feedback conditions are denoted in green and brown, respectively. Also shown is the “shared sensory–motor network” (gray) and time courses of areas denoted in green and brown that do not overlap with the “shared sensory–motor network.” For stereotactic coordinates of activation foci see Table 3. Lower panel: slice views to illustrate extent of “allocentric visual feedback areas” (brown) and relative arrangement with respect to the “hared sensory–motor network” (gray).
In our initial analysis of visual feedback related activity (conjunction “Visual Feedback > No-Visual Feedback,” Table 1) we found that there was considerable overlap in visual feedback related activity across allocentric and target-directed conditions (MT+, SPOC, IPS). The current analysis, however, revealed that there were differences as well. In particular, visual feedback in the target-directed task as compared to the visual feedback in the allocentric task led to localized increases of activity in primary and secondary somatosensory cortex (SI, SII) as well as in the caudal cingulate motor area (cCMA). Only SI was included within the “shared sensory–motor network.” In contrast, visual feedback in the allocentric as compared to the target-directed task, led to widespread increases in activity in frontal and parietal cortical areas that also overlapped the shared “sensory–motor network,” as well as in bilateral anterior insular cortex and the right pre-supplementary motor area (preSMA). Frontal and parietal areas overlapped areas that were identified for the conjunction “Allocentric > Target-Directed” analysis (Table 1). This was expected from the way the comparison was constructed.
The brain areas that are more active during target-directed as compared to allocentric visual feedback conditions and that do not overlap with the shared sensory–motor network (i.e., SII, cCMA) are likely to be involved in the visual feedback control of movements of the right hand. SII has been implicated in cross-modal visual–proprioceptive processing (Keysers et al., 2004; Bolognini et al., 2011). In addition, the stereotactic coordinates of the activity we observed are similar to those previously reported for right hand area in SII (Ruben et al., 2001). Thus, the increase of activity in SII related to visual feedback might reflect the visual–proprioceptive co-registration of the right hand, which in many computational models is a pre-requisite for visual feedback control of that hand (e.g., Smeets et al., 2006; Diedrichsen et al., 2010). With regard to cCMA, it is interesting to note that a recent functional connectivity study shows that it is connected to various motor and sensory areas (Habas, 2010), and it has previously been linked to sensory control of movement, even though it cannot be conclusively inferred from the literature at this point if the sensory control signal is more visual or proprioceptive, or both (Ogawa et al., 2006; Grafton et al., 2008). In summary, we think that the increase in activity that we observe in SII and cCMA during target-directed as compared to allocentric visual feedback conditions is potentially related to the increased reliance on visual feedback for the control of target-directed movements (Thaler and Goodale, 2011a; behavioral data in Table 2).
The brain areas that are more active during allocentric as compared to target-directed visual feedback conditions, and that do not overlap with the shared sensory–motor network, included the anterior insular cortex bilaterally and right preSMA. As yet, we do not have a clear account of what this activation might signify. However, with respect to the anterior insular cortex, there are many possibilities such as for example error-monitoring (Ullsperger et al., 2010), awareness of one’s limb (Karnath et al., 2005), or awareness of one’s general state (Craig, 2009). Unraveling the contributions of all these areas to the sensory control of movement will require additional experiments. The brain areas that are more active during allocentric as compared to target-directed visual feedback conditions and that overlap with the shared sensory–motor network were widespread and included frontal and parietal cortical areas. We have no clear explanation for why visual feedback in allocentric conditions was associated with a widespread increase in activity in these areas, but one possible explanation is that this activity reflects compensatory mechanisms. In other words, there is the possibility that the availability of visual feedback in the allocentric task prompts the system to work harder than in the target-directed task, possibly in order to compensate for reduced visuo-proprioceptive sensory integration
Due to the way our conjunction analyses “Visual Feedback Target-Directed > Visual Feedback Allocentric” and “Visual Feedback Allocentric > Visual Feedback Target-Directed” were constructed, their results could not only be due to the task-specific effect of visual feedback, but their results could also be due to the effect of task itself. In other words, the results of the conjunction are difficult to interpret, because they are confounded by the effects of task. One analysis that controls for the main effect of task is the interaction effect between visual feedback and task in the 2 × 2 × 2 ANOVA. Importantly, in contrast to our conjunction analyses, the interaction effect between task and visual feedback was only significant in preSMA, PMd, IPS, and parietal–occipital cortex, but not in SI, SII, cCMA, IFG, and insular cortex (stereotactic coordinates of activation foci are reported in Table A2 in Appendix). Thus, the results of the 2 × 2 × 2 ANOVA corroborate the finding of the conjunction analyses only for some areas (preSMA, PMd, IPS, and parietal–occipital cortex). It remains, however, that the conjunction analyses suggest a role for SI, SII, cCMA, IFG, and insular cortex as well, even though this cannot be fully confirmed.
Discussion
In the present study, we used a set of tasks and an experimental set-up that enabled us to determine which neural structures are involved in visual spatial coding and visual feedback control of hand movements in allocentric as compared to target-directed conditions.
With respect to spatial coding, the data suggest that all areas that are involved in the target-directed task are also involved in the allocentric task, but that the allocentric task additionally recruits the fundus of the left IPS in the posterior parietal cortex and the LOC in the ventral stream. The allocentric task also leads to an increase of activity in the posterior IPS and dorsal PMd, but these regions of activity overlapped entirely with the shared sensory–motor network.
With respect to the activity increase in the LOC during allocentric as compared to target-directed task, it is interesting to note that the locations of the bilateral occipital lesions in patient DF are quite similar to the locations of the LOC activity in our healthy volunteers (compare to Figure 3 in James et al., 2003). As mentioned in the introduction, patient DF cannot perform the allocentric task illustrated in Figure 1 (Schenk, 2006), which is essentially the same as the one used in our current experiments. Furthermore, neuroimaging studies of perceptual spatial judgments that were made with a button press (Honda et al., 1998; Galati et al., 2000; Committeri et al., 2004; Neggers et al., 2006; Zaehle et al., 2007) or by tilting a joystick (Honda et al., 1998) also found more activity in the LOC during allocentric as compared to egocentric spatial judgments. In addition, a study that compared manual drawing to tracing also reported an increase in activity in the region of the LOC, remarkably close to the area we report here (Table 6, bottom rows, in Gowen and Miall, 2007; MNI-to-Talairach coordinate conversion based on Lacadie et al., 2008). In a way, tracing could be considered a movement in target-directed conditions, because the tip of the pen is directed at the line to be traced. In contrast, drawing, as we indicated in the Introduction, is an allocentric task. Thus, the results of the Gowen and Miall (2007) study as well as our own suggest the LOC is recruited not only during spatial judgments but also hand movements in allocentric conditions. Another study, however, failed to find differential activity in the LOC during the performance of tracing and drawing (Ogawa and Inui, 2009). This apparent contradiction can be explained by the fact that Ogawa and Inui (2009) collapsed across memory-guided and visually guided conditions when comparing drawing and tracing. It is entirely possible that memory-guided “tracing,” where the subjects had to refer to a visual memory of a complex shape, was unlike a real-time target-directed movement. In conclusion, the evidence from all these studies, including ours, would appear to converge on the idea that the LOC plays a more critical role in the performance of movements in allocentric as compared to target-directed conditions – as well as in spatial judgments that depend on allocentric rather than egocentric comparisons. It is important to emphasize, however, that the nature of the computations underlying target-directed movements and various kinds of egocentric perceptual judgments can be different (Thaler and Todd, 2009a; Thaler and Goodale, 2010).
Our study is the first to show a contralateral preference for LOC activation in an allocentric task. Importantly, our visual displays always covered both hemifields, such that the effect is related to the instruction, and most likely to the associated attentional modulation, not the visual sensory input. This interpretation is consistent with previous results that show instruction related activity in LOC (Niemeier et al., 2005). Earlier studies about allocentric coding (Honda et al., 1998; Galati et al., 2000; Committeri et al., 2004; Neggers et al., 2006; Zaehle et al., 2007) did not systematically manipulate the side of the visual field – and thus were unlikely to have noted the contralateral nature of any LOC activations. Future research is needed to determine the degree of spatiotopic selectivity of the LOC in the context of allocentric tasks.
Traditionally, the LOC is thought of as a brain area involved in the processing (e.g., Malach et al., 1995) and recognition of visual objects (e.g., Grill-Spector et al., 2001). The visual processing and recognition of objects is different from the allocentric movement task we used here. Yet, perhaps because the LOC is involved in processing of visual objects it would make intuitive sense that it would also show a preference for the processing of visual information in an allocentric visual coordinate frame. The reason is that an allocentric coordinate frame provides stability in the presence of eye or body-movements, which is necessary to achieve reliable object recognition. In keeping with the idea of coordinate stability in the LOC, previous data suggest that the processing of visual information in the LOC involves an extra-retinal reference frame (McKyton and Zohary, 2007). However, the design used by McKyton and Zohary (2007) did not dissociate between head-centered as compared to allocentric coordinate frames. In this way, our results add to those previous findings by highlighting the sensitivity of the LOC to allocentric visual coordinate frames.
But what about the activation we observed in the fundus of the IPS during the performance of the allocentric tasks? Interestingly, this area has been implicated in the estimation of numerical magnitude and lengths of line segments (Hubbard et al., 2005; Tudusciuc and Nieder, 2007, 2009; Nieder and Dehaene, 2009), and the left IPS, in particular, seems to be involved in more fine-grained computations (Nieder and Dehaene, 2009). As mentioned earlier, the allocentric task in our experiments might have placed a higher load on the estimation of magnitude than the target-directed task because subjects had to determine the distance (and direction) between two target dots. This could explain the increased activity in the fundus of the IPS. More work is clearly needed to determine the relationship between those brain areas involved in the estimation of visual and numerical magnitude and those involved in the performance of allocentric movement tasks. In addition, even though the left-lateralized activity we observed could indeed reflect a true left-lateralization of the computations required by our allocentric task, it is possible that it simply reflected the fact that subjects were using their right hand. Future work is needed to address this question.
Finally, the allocentric task also resulted in increased activity in the posterior IPS and in PMd, which overlapped entirely with the shared sensory–motor network. Previous work has linked activity in PMd to the selection of movement parameters (e.g., Cisek and Kalaska, 2005; Beurze et al., 2007; for reviews see for example Chouinard and Paus, 2006; Medendorp et al., 2008) and activity in the IPS (and SPL) to processes involved in visuo-motor transformations and movement planning (e.g., Beurze et al., 2007; for reviews see for example Buneo and Andersen, 2006; Medendorp et al., 2008). We suggest, therefore, that the allocentric increase in activity in those areas reflects a general increase in the load on processes involved in visuo-motor transformations and movement parameter selection in the allocentric as compared to the target-directed task. Previous studies that compared drawing to tracing also found drawing related increases in activity in PPC (Table 6 in Gowen and Miall, 2007; Ogawa and Inui, 2009) and PMd (Table 6 in Gowen and Miall, 2007), and the authors of those studies suggested that this reflects the fact that drawing places a higher load on visuo-motor transformation and selection processes than tracing. Since drawing is allocentric, whereas tracing can be considered more target-directed, these results and interpretations are consistent with our own. As mentioned earlier in the Section “Results,” there is also the possibility that the activity increase in PMd and IPS is driven by purely visual transformations, independent of movement planning. For example, it has been shown that the SPL is involved in mental rotation paradigms and general coordinate transforms and that these tasks also drive responses in PMd (e.g., Lamm et al., 2007). It is possible that the allocentric task is composed of the target-directed task plus a visual component, which would, perhaps, drive a similar network as the one involved in mental rotation.
With respect to visual feedback control, the data suggest that even though the same network in the dorsal visual stream is recruited during the presence of visual feedback in both target-directed and allocentric conditions (i.e., MT+, SPOC, IPS), our conjunction analyses also suggest that visually guided movements in target-directed conditions recruit additional brain regions not recruited during visually guided movements in allocentric conditions (and vice versa). Specifically, whereas the conjunction analyses revealed a localized increase in activity in SI, SII, and cCMA during visually guided movements in the target-directed task, they revealed a rather widespread increase in activity throughout the shared sensory–motor network and in anterior insular cortex and preSMA for visually guided movements in the allocentric task. Interestingly, on the behavioral level, visual feedback led to an improvement in performance in both tasks, but the effect was stronger for the target-directed task (see behavioral data about movement variance in Table 2), which in itself could account for some of the observed differences in activation. As discussed earlier in the Section “Results,” even though the 2 × 2 × 2 ANOVA interaction effect between task and visual feedback confirmed the results of the conjunction analyses for preSMA, PMd, IPS, and parietal–occipital cortices, they did not confirm the results for SI, SII, cCMA, IFG, and insular cortex. Thus, even though our conjunction analyses suggest a different role for the latter regions in visual feedback control in target-directed as compared to allocentric conditions, this cannot be fully confirmed.
Again, as discussed earlier in the Results, the interaction effects between task and visual feedback may be due to a variety of things such as differences in visuo-proprioceptive integration, error awareness, or compensatory mechanisms. Importantly, however, eye-movements are an unlikely explanation for the interaction effects for the following reasons. First, subjects were instructed to not move their eyes, and they reported to have followed the instructions. Secondly, a practice session that preceded fMRI and during which the experimenter could observe the subject ensured that subjects were able to follow the instructions (see Materials and Methods). Third, we have shown in previous behavioral work that hand movements in both target-directed and allocentric conditions, both with and without visual feedback can be performed under both free viewing and fixation conditions (Thaler and Goodale, 2011a,b). Whatever the exact interpretation of the interaction between task and visual feedback on the neural level is, however, it is quite clear that visual feedback leads to different patterns of activation in the two tasks.
One of the questions that has been studied extensively over the years concerns the issue of whether the human motor system codes movements in terms of the displacement vector of the hand or in terms of the final position of the hand (for reviews, see Desmurget et al., 1998; de Grave et al., 2004). Several researchers have proposed that the human motor system may employ not just one, but two mechanisms for issuing motor commands: one dealing with the vector displacement, and the other with the final position of the hand (Hirayama et al., 1993; Lackner and DiZio, 1994, 1998; DiZio and Lackner, 1995; Gottlieb, 1996; Sainburg et al., 1999; Sainburg and Wang, 2002; Brown et al., 2003; de Grave et al., 2004; Ghez et al., 2007; Scheidt and Ghez, 2007). In our opinion, the distinction between movements in allocentric and target-directed tasks that we are proposing might be related to the distinction between vector and endpoint coding. For example, the allocentric task could be considered a task in which subjects use predominantly vector coding because the visual instruction given to them specifies the visual movement vector, that is, movement distance and direction, whereas the target-directed task could be considered a task in which subjects rely less on vector, and perhaps more on endpoint coding (see also Thaler and Todd, 2009b). The “vectorial” interpretation of the allocentric task also fits well with the idea that the allocentric task might be related to processes involved in the computation of numerical magnitude. Importantly, then, if we assume that subjects rely more on vector coding in the allocentric as compared to the target-directed task, then the activation that we observe in the allocentric task might also be interpreted as the neural correlates of vector coding of movements. Clearly, future research is needed to address these ideas.
Conclusion
Using a set of target-directed and allocentric movement tasks that were visually and biomechanically matched, but differed in their instruction, we found large and reliable differences in brain activation. In recent years, considerable advancements have been made regarding the neural and computational correlates of movements that are directed at targets. But as our data make clear, a full understanding of how humans control their movements will require that we pay as much attention to the neural substrates (and computational mechanisms) underlying movements in allocentric tasks as we do to those underlying movements in target-directed tasks. In fact, a full understanding of both kinds of movements is necessary if we are to develop brain–machine interfaces and other applied devices that capture the full range of human movement.
Conflict of Interest Statement
The authors declare that the research was conducted in the absence of any commercial or financial relationships that could be construed as a potential conflict of interest.
Acknowledgments
We thank Adam McLean for his help with fMRI data collection. We thank Ken Valyear and Jody Culham for discussions with respect to the experimental design and results. We thank Tutis Vilis, Stepanie Rossit, and Fraser Smith for comments on a previous version of this manuscript. This work was supported by the Natural Sciences and Engineering Research Council of Canada (Melvyn A. Goodale) and a Postdoctoral Fellowship of the Ontario Ministry of Research and Innovation (Lore Thaler).
References
Beauchamp, M. S., Yasar, N. E., Kishan, N., and Ro, T. (2007). Human MST but not MT responds to tactile stimulation. J. Neurosci. 27, 8261–8267.
Beurze, S. M., De Lange, F. P., Toni, I., and Medendorp, W. P. (2007). Integration of target and effector information in the human brain during reach planning. J. Neurophysiol. 97, 188–199.
Blake, R., Sobel, K. V., and James, T. W. (2004). Neural synergy between kinetic vision and touch. Psychol. Sci. 15, 397–402.
Bolognini, N., Rossetti, A., Maravita, A., and Miniussi, C. (2011). Seeing touch in the somatosensory cortex: a TMS study of the visual perception of touch. Hum. Brain Mapp. doi: 10.1002/hbm.21172. [Epub ahead of print].
Brown, L. E., Rosenbaum, D. A., and Sainburg, R. L. (2003). Limb position drift: implications for control of posture and movement. J. Neurophysiol. 90, 3105–3118.
Buneo, C. A., and Andersen, R. A. (2006). The posterior parietal cortex: sensorimotor interface for the planning and online control of visually guided movements. Neuropsychologia 44, 2594–2606.
Cavina-Pratesi, C., Monaco, S., Fattori, P., Galletti, C., McAdam, T. D., Quinlan, D. J., Goodale, M. A., and Culham, J. C. (2010). fMRI reveals the neural substrates of arm transport and grip formation in reach-to-grasp actions in humans. J. Neurosci. 30, 10306–10323.
Chouinard, P. A., and Paus, T. (2006). The primary motor and premotor areas of the human cerebral cortex. Neuroscientist 12, 143–152.
Cisek, P., and Kalaska, J. F. (2005). Neural correlates of reaching decisions in dorsal premotor cortex: specification of multiple direction choices and final selection of action. Neuron 45, 801–814.
Committeri, G., Galati, G., Paradis, A. L., Pizzamiglio, L., Berthoz, A., and LeBihan, D. (2004). Reference frames for spatial cognition: different brain areas are involved in viewer-, object-, and landmark-centered judgments about object location. J. Cogn. Neurosci. 16, 1517–1535.
Craig, A. D. (2009). How do you feel – now? The anterior insula and human awareness. Nat. Rev. Neurosci. 10, 59–70.
Crawford, J. D., Henriques, D. Y. P., and Medendorp, P. (2011). Three-dimensional transformations for goal-directed action. Annu. Rev. Neurosci. 34, 309–331.
Culham, J. C., Cavina-Pratesi, C., and Singhal, A. (2006). The role of parietal cortex in visuomotor control: what have we learned from neuroimaging? Neuropsychologia 44, 2668–2684.
Culham, J. C., and Valyear, K. F. (2006). Human parietal cortex in action. Curr. Opin. Neurobiol. 6, 205–212.
de Grave, D. D. J., Brenner, E., and Smeets, J. B. J. (2004). Illusions as a tool to study the coding of pointing movements. Exp. Brain Res. 155, 56–62.
Desmurget, M., and Grafton, S. (2000). Forward modeling allows feedback control for fast reaching movements. Trends Cogn. Sci. (Regul. Ed.) 4, 423–431.
Desmurget, M., Pelisson, D., Rossetti, Y., and Prablanc, C. (1998). From eye to hand: planning goal-directed movements. Neurosci. Biobehav. Rev. 22, 761–788.
Diedrichsen, J., Shadmehr, R., and Ivry, R. B. (2010). The coordination of movement: optimal feedback control and beyond. Trends Cogn. Sci. (Regul. Ed.) 14, 31–39.
DiZio, P., and Lackner, J. R. (1995). Motor adaptation to coriolis force perturbations of reaching movements: endpoint but not trajectory adaptation transfers to the nonexposed arm. J. Neurophysiol. 74, 1787–1792.
Filimon, F. (2010). Human cortical control of hand movement: parietofrontal networks for reaching, grasping, and pointing. Neuroscientist 16, 338–407.
Filimon, F., Nelson, J. D., Huang, R. S., and Sereno, M. I. (2009). Multiple parietal reach regions in humans: cortical representations for visual and proprioceptive feedback during on-line reaching. J. Neurosci. 29, 2961–2971.
Forman, S. D., Cohen, J. D., Fitzgerald, M., Eddy, W. F., Mintun, M. A., and Noll, D. C. (1995). Improved assessment of significant activation in functional magnetic resonance imaging (fMRI): use of a cluster-size threshold. Magn. Reson. Med. 33, 636–647.
Friston, K. J., Zarahn, E., Josephs, O., Henson, R. N. A., and Dale, A. M. (1999). Stochastic designs in event-related fMRI. Neuroimage 10, 607–619.
Galati, G., Lobel, E., Vallar, G., Berthoz, A., Pizzamiglio, L., and Le Bihan, D. (2000). The neural basis of egocentric and allocentric coding of space in humans: a functional magnetic resonance study. Exp. Brain Res. 133, 156–164.
Ghez, C., Scheidt, R., and Heijink, H. (2007). Different learned coordinate frames for planning trajectories and final positions in reaching. J. Neurophysiol. 98, 3614–3626.
Goebel, R., Esposito, F., and Formisano, E. (2006). Analysis of functional image analysis contest (FIAC) data with brainvoyager QX: from single-subject to cortically aligned group general linear model analysis and self-organizing group independent component analysis. Hum. Brain Mapp. 27, 392–401.
Gottlieb, G. L. (1996). On the voluntary movement of compliant (inertial viscoelastic) loads by parcellated control mechanisms. J. Neurophysiol. 76, 3207–3229.
Gowen, E., and Miall, R. C. (2007). Differentiation between external and internal cuing: an fMRI study comparing tracing with drawing. Neuroimage 36, 396–410.
Grafton, S. T., Schmitt, P., Van Horn, J., and Diedrichsen, J. (2008). Neural substrates of visuomotor learning based on improved feedback control and prediction. Neuroimage 39, 1383–1395.
Grill-Spector, K., Kourtzi, Z., and Kanwisher, N. (2001). The lateral occipital complex and its role in object recognition. Vision Res. 41, 1409–1422.
Habas, C. (2010). Functional connectivity of the human rostral and caudal cingulate motor areas in the brain resting state at 3T. Neuroradiology 52, 47–59.
Hagen, M. C., Franzen, O., McGlone, F., Essick, G., Dancer, C., and Pardo, J. V. (2002). Tactile motion activates the human middle temporal/V5 (MT/V5) complex. Eur. J. Neurosci. 16, 957–964.
Hirayama, M., Kawato, M., and Jordan, M. I. (1993). The cascade neural network model and a speed-accuracy trade-off of arm movement. J. Mot. Behav. 25, 162–174.
Honda, M., Wise, S. P., Weeks, R. A., Deiber, M.-P., and Hallett, M. (1998). Cortical areas with enhanced activation during object-centred spatial information processing. Brain 121, 2145–2158.
Hubbard, E. M., Piazza, M., Pinel, P., and Dehaene, S. (2005). Interactions between number and space in parietal cortex. Nat. Rev. Neurosci. 6, 435–448.
James, T. W., Culham, J. C., Humphrey, G. K., Milner, A. D., and Goodale, M. A. (2003). Ventral occipital lesions impair object recognition but not object-directed grasping: a fMRI study. Brain 126, 2463–2475.
Karnath, H. O., Baier, B., and Naegele, T. (2005). Awareness of the functioning of one’s own limbs mediated by the insular cortex? J. Neurosci. 25, 7134–7138.
Kawato, M. (1999). Internal models for motor control and trajectory planning. Curr. Opin. Neurobiol. 9, 718–727.
Keysers, C., Wicker, B., Gazzola, V., Anton, J. L., Fogassi, L., and Gallese, V. (2004). A touching sight: SII/PV activation during the observation and experience of touch. Neuron 42, 335–346.
Lacadie, C. M., Fulbright, R. K., Rajeevan, N., Constable, R. T., and Papademetris, X. (2008). More accurate Talairach coordinates for neuroimaging using non-linear registration. Neuroimage 42, 717–725.
Lackner, J. R., and DiZio, P. (1994). Rapid adaptation to coriolis force perturbations of arm trajectory. J. Neurophysiol. 72, 299–313.
Lackner, J. R., and DiZio, P. (1998). Gravito inertial force background level affects adaptation to coriolis force perturbations of reaching movements. J. Neurophysiol. 80, 546–553.
Lacquaniti, F., and Caminiti, R. (1998). Visuo-motor transformations for arm reaching. Eur. J. Neurosci. 10, 195–203.
Lamm, C., Windischberger, C., Moser, E., and Bauer, H. (2007). The functional role of dorso-lateral premotor cortex during mental rotation: an event-related fMRI study separating cognitive processing steps using a novel task paradigm. Neuroimage 36, 1374–1386.
Malach, R., Reppas, J. B., Benson, R. R., Kwong, K. K., Jiang, H., Kennedy, W. A., Ledden, P. J., Brady, T. J., Rosen, B. R., and Tootell, R. B. (1995). Object-related activity revealed by functional magnetic resonance imaging in human occipital cortex. Proc. Natl. Acad. Sci. U.S.A. 92, 8135–8139.
McKyton, A., and Zohary, E. (2007). Beyond retinotopic mapping: the spatial representation of objects in the human lateral occipital complex. Cereb. Cortex 17, 1164–1172.
Medendorp, W. P., Van Pelt, S., Beurze, S. M., and Van Der Werf, J. (2008). Behavioral and cortical mechanisms for spatial coding and action planning. Cortex 44, 587–597.
Miezin, F. M., Maccotta, L., Ollinger, J. M., Petersen, S. E., and Buckner, R. L. (2000). Characterizing the hemodynamic response: effects of presentation rate, sampling procedure, and the possibility of ordering brain activity based on relative timing. Neuroimage 11, 735–759.
Milner, A. D., and Goodale, M. A. (2008). Two visual systems re-viewed. Neuropsychologia 46, 774–785.
Neggers, S. F. W., Van der Lubbe, R. H. J., Ramsey, N. F., and Postma, A. (2006). Interactions between ego- and allocentric neuronal representations of space. Neuroimage 31, 320–331.
Nichols, T. E., Brett, M., Andersson, J., Wager, T., and Poline, J. B. (2005). Valid conjunction inference with the minimum statistic. Neuroimage 25, 653–660.
Nieder, A., and Dehaene, S. (2009). Representation of number in the brain. Annu. Rev. Neurosci. 32, 185–208.
Niemeier, M., Goltz, H. C., Kuchinad, A., Tweed, D. B., and Vilis, T. (2005). A contralateral preference in the lateral occipital area: sensory and attentional mechanisms. Cereb. Cortex 15, 325–331.
Ogawa, K., and Inui, T. (2009). The role of the posterior parietal cortex in drawing by copying. Neuropsychologia 47, 1013–1022.
Ogawa, K., Inui, T., and Sugio, T. (2006). Separating brain regions involved in internally guided and visual feedback control of moving effectors: an event-related fMRI study. Neuroimage 32, 1760–1770.
Pisella, L., Gréa, H., Tilikete, C., Vighetto, A., Desmurget, M., Rode, G., Boisson, D., and Rossetti, Y. (2000). An “automatic pilot” for the hand in human posterior parietal cortex: toward reinterpreting optic ataxia. Nat. Neurosci. 3, 729–736.
Ruben, J., Schwiemann, J., Deuchert, M., Meyer, R., Krause, T., Curio, G., Villringer, K., Kurth, R., and Villringer, A. (2001). Somatotopic organization of human secondary somatosensory cortex. Cereb. Cortex 11, 463–473.
Sainburg, R. L., Ghez, C., and Kalakanis, D. (1999). Intersegmental dynamics are controlled by sequential anticipatory, error correction, and postural mechanisms. J. Neurophysiol. 81, 1040–1056.
Sainburg, R. L., and Wang, J. (2002). Interlimb transfer of visuomotor rotations: independence of direction and final position information. Exp. Brain Res. 145, 437–447.
Scheidt, R. A., and Ghez, C. (2007). Separate adaptive mechanisms for controlling trajectory and final position in reaching. J. Neurophysiol. 98, 3600–3613.
Schenk, T. (2006). An allocentric rather than perceptual deficit in patient D.F. Nat. Neurosci. 9, 1369–1370.
Sherman, S. M., and Guillery, R. W. (2006). Exploring the Thalamus and its Role in Cortical Function. Cambridge, MA: MIT Press.
Smeets, J. B. J., van den Dobbelsteen, J. J., de Grave, D. D. J., van Beers, R. J., and Brenner, E. (2006). Sensory integration does not lead to sensory calibration. Proc. Natl. Acad. Sci. U.S.A. 103, 18781–18786.
Strick, P. L., Dum, R. P., and Fiez, J. A. (2009). Cerebellum and nonmotor function. Annu. Rev. Neurosci. 32, 413–434.
Talairach, J., and Tournoux, P. (1988). Co-Planar Stereotaxic Atlas of the Human Brain. New York: Thieme.
Thaler, L., and Goodale, M. A. (2010). Beyond distance and direction: the CNS represents target location in a non-metric format. J. Vis. 10, 1–27.
Thaler, L., and Goodale, M. A. (2011a). The role of online visual feedback for the control of target-directed and allocentric hand movements. J. Neurophysiol. 105, 846–859.
Thaler, L., and Goodale, M. A. (2011b). Reaction times in allocentric movements are 35 ms slower than in target-directed movements. Exp. Brain Res. 211, 313–328.
Thaler, L., and Todd, J. T. (2009a). The use of head/eye-centered, hand-centered and allocentric representations for visually guided hand movements and perceptual judgments. Neuropsychologia 47, 1227–1244.
Thaler, L., and Todd, J. T. (2009b). The control parameters used by the CNS to guide the hand depend on the visuo-motor task: evidence from visually guided pointing. Neuroscience 159, 578–598.
Thaler, L., and Todd, J. T. (2010). Evidence from visuomotor adaptation for two partially independent visuomotor systems. J. Exp. Psychol. Hum. Percept. Perform. 36, 924–935.
Tootell, R. B., Reppas, J. B., Kwong, K. K., Malach, R., Born, R. T., Brady, T. J., Rosen, B. R., and Belliveau, J. W. (1995). Functional analysis of human MT and related visual cortical areas using magnetic resonance imaging. J. Neurosci. 15, 3215–3230.
Tudusciuc, O., and Nieder, A. (2007). Neuronal population coding of continuous and discrete quantity in the primate posterior parietal cortex. Proc. Natl. Acad. Sci. U.S.A. 104, 14513–14518.
Tudusciuc, O., and Nieder, A. (2009). Representation of primate prefrontal and posterior parietal cortices to length and numerosity contributions. J. Neurophysiol. 101, 2984–2994.
Ullsperger, M., Harsay, H. A., Wessel, J. R., and Ridderinkhof, K. R. (2010). Conscious perception of errors and its relation to the anterior insula. Brain Struct. Funct. 214, 629–643.
Watson, J. D., Myers, R., Frackowiak, R. S., Hajnal, J. V., Woods, R. P., Mazziotta, J. C., Shipp, S., and Zeki, S. (1993). Area V5 of the human brain: evidence from a combined study using positron emission tomography and magnetic resonance imaging. Cereb. Cortex 3, 79–94.
Whitney, D., Ellison, A., Rice, N. J., Arnold, D., Goodale, M. A., Walsh, V., and Milner, D. (2007). Visually guided reaching depends on motion Area MT+. Cereb. Cortex 17, 2644–2649.
Keywords: fMRI, lateral occipital cortex, egocentric, sensory–motor control, vector coding, magnitude, numerosity, number
Citation: Thaler L and Goodale MA (2011) Neural substrates of visual spatial coding and visual feedback control for hand movements in allocentric and target-directed tasks. Front. Hum. Neurosci. 5:92. doi: 10.3389/fnhum.2011.00092
Received: 30 March 2011; Accepted: 13 August 2011;
Published online: 31 August 2011.
Edited by:
Leon Y. Deouell, The Hebrew University of Jerusalem, IsraelReviewed by:
Alex R. Wade, Smith Kettlewell Eye Research Institute, USAGaspare Galati, Sapienza Università di Roma, Italy
Copyright: © 2011 Thaler and Goodale. This is an open-access article subject to a non-exclusive license between the authors and Frontiers Media SA, which permits use, distribution and reproduction in other forums, provided the original authors and source are credited and other Frontiers conditions are complied with.
*Correspondence: Lore Thaler, Department of Psychology, Durham University, South Road, Durham, DH1 3LE, UK. e-mail: lore.thaler@durham.ac.uk