Preliminary evidence of pre-attentive distinctions of frequency-modulated tones that convey affect
- 1 Neuropsychiatry Section, Department of Psychiatry, University of Pennsylvania School of Medicine, Philadelphia, PA, USA
- 2 Program in Cognitive Neuroscience and Schizophrenia, Nathan S. Kline Institute for Psychiatric Research, Orangeburg, NY, USA
- 3 Program in Cognitive Neuroscience, The City College of the City University of New York, New York, NY, USA
- 4 Department of Psychiatry, NYU School of Medicine, New York, NY, USA
Recognizing emotion is an evolutionary imperative. An early stage of auditory scene analysis involves the perceptual grouping of acoustic features, which can be based on both temporal coincidence and spectral features such as perceived pitch. Perceived pitch, or fundamental frequency (F0), is an especially salient cue for differentiating affective intent through speech intonation (prosody). We hypothesized that: (1) simple frequency-modulated tone abstractions, based on the parameters of actual prosodic stimuli, would be reliably classified as representing differing emotional categories; and (2) that such differences would yield significant mismatch negativities (MMNs) – an index of pre-attentive deviance detection within the auditory environment. We constructed a set of FM tones that approximated the F0 mean and variation of reliably recognized happy and neutral prosodic stimuli. These stimuli were presented to 13 subjects using a passive listening oddball paradigm. We additionally included stimuli with no frequency modulation (FM) and FM tones with identical carrier frequencies but differing modulation depths as control conditions. Following electrophysiological recording, subjects were asked to identify the sounds they heard as happy, sad, angry, or neutral. We observed that FM tones abstracted from happy and no-expression speech stimuli elicited MMNs. Post hoc behavioral testing revealed that subjects reliably identified the FM tones in a consistent manner. Finally, we also observed that FM tones and no-FM tones elicited equivalent MMNs. MMNs to FM tones that differentiate affect suggests that these abstractions may be sufficient to characterize prosodic distinctions, and that these distinctions can be represented in pre-attentive auditory sensory memory.
Introduction
Frequency modulation (FM) is characteristic of speech and its parameters may aid us in communicating social intent (Goydke et al., 2004). Vocally, while we express emotion through words (semantics) we also modulate our tone through pitch change (prosody). Numerous studies have indicated that the perception of pitch and pitch change as reflected in fundamental frequency (F0) and F0 variability (F0SD), respectively, are crucial in identifying the internal emotional states of one’s interlocutor (Ladd et al., 1985). For example, we and others have found that high pitch mean and variability characterize excitement and happiness while low pitch mean and low pitch variability is often perceived as fear or sadness (Juslin and Scherer, 2005), or no emotion. The prominence of pitch as a cue for prosodic perception is highlighted by studies that have shown that emotion (Lakshminarayanan et al., 2003) as well as interrogative intent (Majewski and Blasdell, 1969) can be detected based on F0 alone. Furthermore, in the domain of emotional prosody, the temporal structure of pitch change does not seem to be a prerequisite for affective decoding, a claim supported by Knowner (1941) who observed that individuals could reliably (nearly twice-chance) identify affective intent in prosodic sentences played backward. Together these findings suggest that overall pitch mean and variability may be sufficient to communicate emotional intent, regardless of temporal structure. We therefore hypothesized that simple FM tones, the carrier frequency and modulation depth of which approximates the F0 mean and SD of well-identified prosodic tokens, might be sufficient to differentiate affective intent.
Rapid emotion identification is also an evolutionary imperative. Electrophysiological studies indicate responses to emotion occurring as early as 80–150 ms (Kawasaki et al., 2001; Sauter and Eimer, 2010). Similar to our classification of color perception, which enables us to tell food from poison and predator from prey, our identification of emotions conveyed facially or vocally through prosody is performed categorically (Etcoff and Magee, 1992; Beale and Keil, 1995; Young et al., 1997; Laukka, 2005). In this way, affective cues are much like phonemes whose distinctions do not vary along a sensory or acoustical continuum but instead are “Balkanized” – that is, perceived as having a common identity within a category and a sharp change in perception at the position in which this category boundary ends. Such categorization may provide the building block for higher order cognition while minimizing processing demands that lead to increased perceptual speed (Harnad, 1987). Electrophysiologically, evoking mismatch negativities (MMNs) reveals that categorical distinctions of affective prosody signals and phonemes appear early in auditory processing (Näätänen, 2000).
The MMN is an evoked response that is thought to index pre-attentive detection of deviance within the auditory environment [(Näätänen, 2000) however see Näätänen (1991) and Woldorff et al. (1991) for a discussion of the potential effects of attention on MMN amplitude under special conditions]. Typically, MMNs are measured by comparing the responses to a deviant or “A” tone that has been presented within a stream of standard “B” tones. To date, few prosody studies have employed MMNs to examine emotional prosody using actual speech (Kujala et al., 2005; Schirmer et al., 2005) or single or multiple pseudo syllables (Korpilahti et al., 2007; Schirmer et al., 2008; Thonnessen et al., 2010). The drawback to using actual speech, is that the complexity of the acoustic signal can generate MMNs that are difficult to discern and interpret compared to those generated by more basic acoustic stimuli. With pitch intensity and spectral features changing across emotions in actual prosodic stimuli, MNN differences even when measured do not reveal which feature or combination of features is generating the MMN (Leitman et al., 2009). From this perspective, simple FM tones – should they reliably abstract affective prosodic distinctions – are clearly advantageous. More importantly, the successful identification of emotion within simple FM tones could indicate the minimal amount of information needed to convey emotion.
In our case, the base (carrier) frequency, modulation frequency, and modulation depth of our constructed FM tones approximate those present in highly recognizable affective prosodic stimuli from a standardized affective prosody battery. We hypothesized that these FM tone abstractions of vocal affect would generate MMN differences and reliable affective categorizations in a post-study identification task. Such a finding would suggest that automatic recognition of vocal emotional prosodic distinctions could result from processing of fundamental FM alone. While the importance of pitch as a prosodic has been demonstrated both behaviorally cue (Ladd et al., 1985; Goydke et al., 2004) as well as electrophysiologically and MMN studies (Leitman et al., 2009), this study using stationary FM tones would suggest that pitch cues alone devoid of their temporal progression are sufficient for automatic prosodic detection.
Our FM abstractions of “happy” and “neutral” prosodic stimuli, varied along two parameters: carrier frequency and modulation depth (Figure 1). In order characterize the specific impact of each of manipulated FM parameters on MMN generation in isolation, we created two control stimuli: one with no-FM, and a second stimulus in which the carrier frequency is held constant that of our “happy” FM abstraction but the modulation depth is varied.
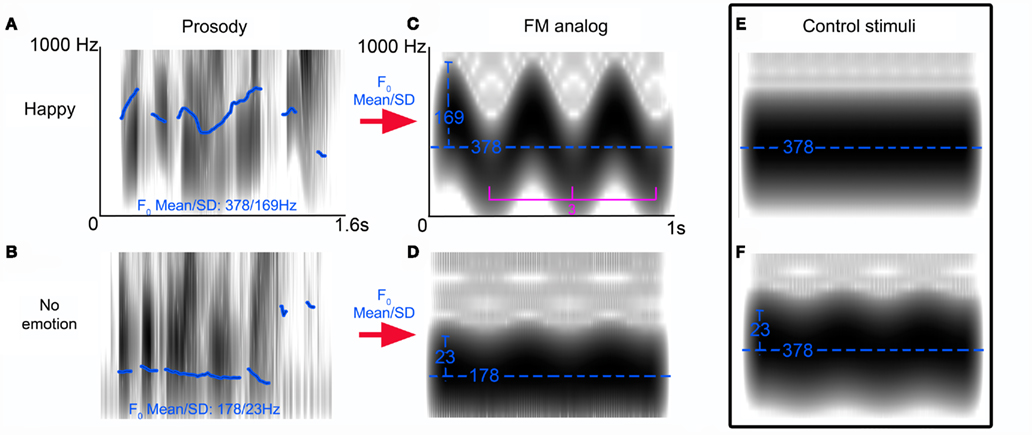
Figure 1. Frequency-modulated (FM) tone stimuli profile. Spectrograms of reliably recognized prosodic sentences (“is it eleven o’clock?”) spoken with a happy (A) or no emotional (B) intonation. Pitch differences between stimuli are indicated by fundamental frequency (F0) contour (blue trace) as calculated by TDPSOLA algorithm in PRAAT. Using the F0 mean and SD of these stimuli we created FM analogs of these stimuli [(C,D) blue traces reflect the carrier frequencies (Hz) and modulation depths respectively] whose modulation frequency was held constant at 3 Hz. Control stimulus (E) illustrates the no-FM stimulus and (F) illustrates the second control stimulus: a hybrid of the FM tones (C,D).
In summary, our primary aim was to examine whether FM abstraction of prosodic stimuli pitch parameters reliably discriminate emotion, and whether such abstractions generate MMN’s. An auxiliary aim was to examine the effect of various changes in the parameters of FM within the auditory scene have on MMN generation. One prior study (Bishop et al., 2005), had suggested that MMN’s to FM tones among no-FM standard tones elicited a larger MMN’s than the reverse condition of no-FM tones deviants within FM tone standards. We endeavored to replicate this potential asymmetry (FM vs. no-FM), and further examined whether variation within carrier frequency and modulation depths (CMD+ vs. CMD−) or modulation depths alone (MD+ vs. MD−) elicited asymmetries as well.
Materials and Methods
Subjects
Informed consent was obtained from 13 (6 females) healthy control subjects with a mean age of 26 ± 1, a mean education level of 15.9 years, and no reported history of psychopathology. All subjects reported that they were right handed, had normal hearing, and were medication free at the time of testing. Three subjects were excluded from analysis due to technical recording issues resulting in high levels of noise within their data. All procedures were conducted under the supervision of the local internal review board.
Stimuli and Procedure
The stimuli consisted of two types: FM tones and no-FM tones. We decided to use FM tones with carrier frequencies and modulation depths that approximate the F0 mean and SD of well-identified prosodic tokens from the Juslin and Laukka (2001) Vocal affect battery. This translated into two standard FM tones. The first had a base frequency of 378 Hz and a modulation depth of 169 Hz (CMD+), approximating a happy stimulus whose identification rate in prior testing was greater than 80% (Leitman et al., 2010), and the second had a base frequency of 178 Hz and a modulation depth of 23 Hz (CMD−), approximating a neutral prosodic utterance. All stimuli were given a fixed length of 1000 ms that corresponded to the approximate length of the original speech stimuli, and a modulation rate of 3 Hz roughly corresponding to the average speech rate. In order to examine MMN differences to the presence or absence of FM as well as the effect of differing modulation depths on MMN amplitude and latency, additional control FM tone conditions were constructed. These conditions are outlined in Table 1.
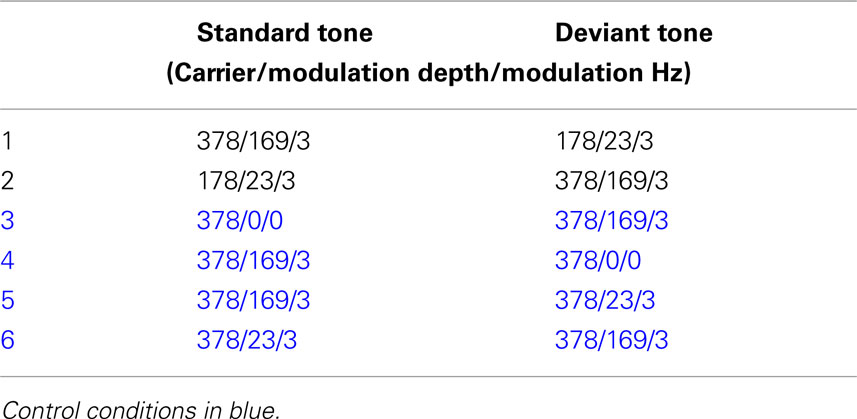
Table 1. Experimental trial blocks.
Subjects were presented with six conditions each of which consisted of two types of stimuli of 1000 ms tones, in which FM was either present or absent (see Table 1). Tones were presented using an inter-stimulus interval (ISI) of 700 ms, and the six conditions were presented in a randomized order. In each block, the ratio of standard to deviant tones was 4:1 such that each block contained 240 standard tones and 80 deviant tones. All tonal contours were presented binaurally at 75 db (SPL) through Sennheiser HD 600 headphones. Subjects were instructed that the experiment was designed to test their passive auditory responses to tonal sequences to which they need not attend. Subjects watched a silent movie during the course of stimulus presentation and were instructed not to pay attention to the aural stimuli. Importantly, subjects were never told that a focus of the experiment was testing affective perception. After electrophysiological testing, subjects were asked to affectively categorize all the tones presented during electrophysiological testing as happy, sad, angry, or no-expression.
Data Collection
High-density event-related potentials (ERP) were recorded continuously from 64 scalp electrodes (following the standard 10–20 placement) with a bandwidth of 0.5–100 Hz and digitized at a sampling rate of 512 Hz. Epochs (–200 to 800 ms relative to stimulus onset) were constructed off-line. Trials with blinks and large eye movements were rejected off-line on the basis of horizontal electro-oculogram (HEOG) and vertical electro-oculogram (VEOG). No systematic differences in HEOG or VEOG were seen across conditions (artifact rejection window of ±100 μV). An artifact criterion of ±100 μV was used at all other electrode sites to reject trials with excessive EMG or other noise transients from −100 ms pre-stimulus to 450 ms post-stimulus. For average files, baselines were corrected to zero over the −100 to 0 ms latency range. Average waveform files were filtered “off-line” using a 0.5- to 45-Hz zero-phase-shift band-pass digital filter with roll-off of 96 dB/octave.
All stimuli were collected using BIOSEMI (Amsterdam, Netherlands) 64-channel electrode array (band-pass filter setting 0.01–100 Hz) and presented using Presentation software (www.neurobs.com). The BIOSEMI system uses active electrodes an common mode sense (CMS) active and driven right leg (DRL) passive electrodes. Post-collection processing was performed using SCAN (neuroscan) and Besa software. Statistical analysis was conducted off-line using SPSS software.
Statistical Analysis
In order to maximize the net amplitude of all subtraction waveforms over fronto-central site (FZ) for statistical analysis, all 64-channel data was re-referenced to an average of both left and right mastoids (Kujala et al., 2007). Given that the standard and deviant tones often differed in overall energy for many of the conditions, MMN subtraction waveforms were derived by comparing ERP responses to deviant stimuli in one run to ERP responses to the same stimulus type in an alternate run. As we illustrate in Table 2, these “like from like” subtractions were arraigned so as to address our hypothetical questions as to whether MMN differences would be observed when contrasting (1) FM tones and no-FM tones, (2) FM stimuli with similar carrier and modulation frequencies but differing modulation depths, and (3) tones with similar modulation frequencies but differing carrier frequencies and modulation depths.
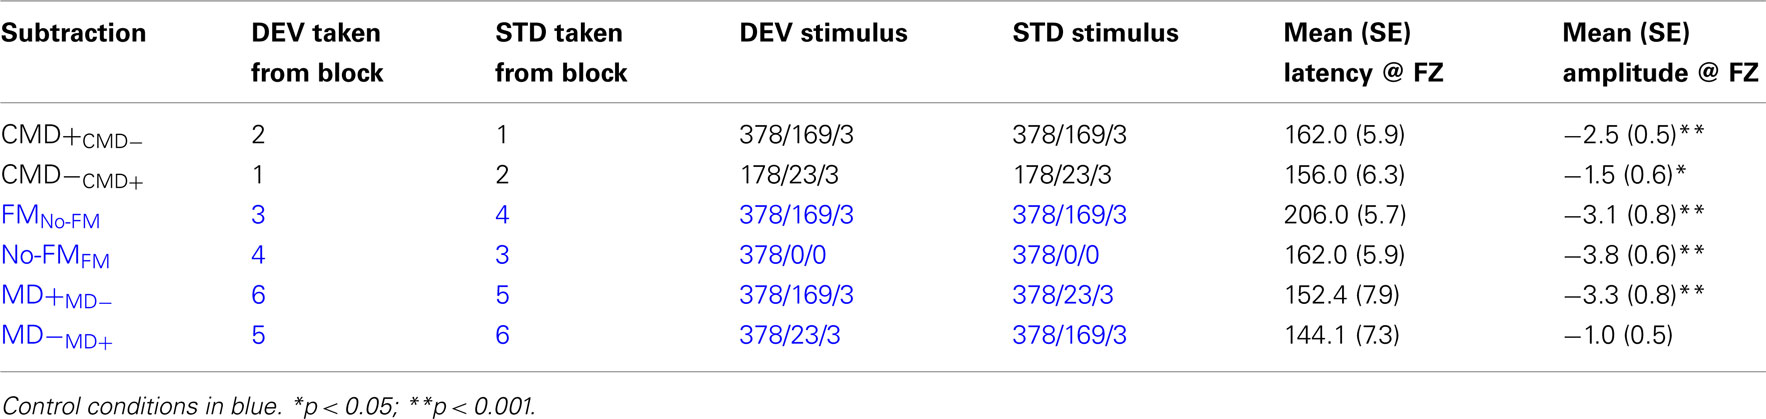
Table 2. Contrasts of interest (MMN subtractions).
For each subtraction waveform, the maximum negative peak within a latency range of 110–185 ms at electrode FZ was entered and tested “off-line” for significance via one way t-test separate pairwise t-tests for each of the aforementioned contrasts (see Table 2). This latency window for peak detection was employed for all contrasts except for the contrast examining FM tone deviance within a no-FM context. In this condition, we hypothesized that the MMN might be significantly delayed given that deviance onset occurs somewhat later so that modulation can be detected. Therefore, we shifted the peak detection window by 40 to 150–225 ms post-stimulus onset.
Statistical assessment of post-experiment affective classification of FM tones was conducted using a Chi square test in SPSS. All statistical testing used an alpha criterion of p < 0.05.
Results
FM Tones Abstracted from Happy and No-Expression Stimuli [Differing Carrier Frequencies and Modulation Depths (CMD+MD−, CMD−MD+)]
Frequency modulation abstractions of Happy and No-emotion prosodic stimuli elicited significant MMN subtraction waveforms [CMD+CMD− (t1,12, −4.7, p < 0.001); CMD−CMD+ (t1,12, −2.7, p = 0.021)] with no latency differences observed between subtraction waveforms (p = 0.46; Figure 2, Table 2). A contrast of these subtraction waveforms indicated no difference between increasing modulation depth and carrier frequency (CMD+CMD−) and decreasing them (CMD−CMD+; t1,12, −1.4, p = 0.20).
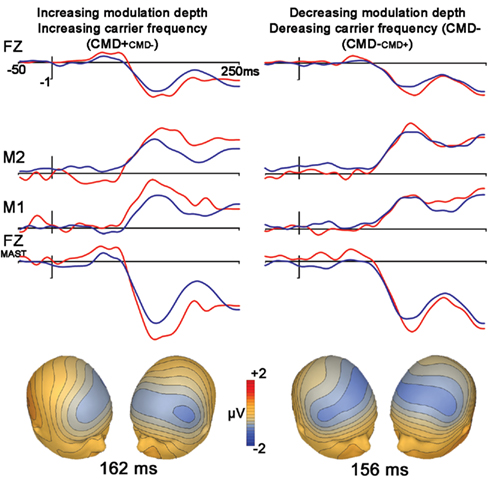
Figure 2. Stimuli extracted from Happy (left) and No-expression (right) prosodic stimuli. Top panel represents grand average waveforms at electrodes FZ, right (M1) and left (M2) mastoid for both standard (blue) and deviant (red) waveforms for FM tones Bottom row represents grand average waveforms that were re-referenced to average mastoids for statistical comparisons of net amplitude differences between conditions. Bottom panel represents voltage topographies of subtraction waveforms (Note: isotemporal lines extending beyond electrode placement areas is an artifact of topography generation platform).
Control Condition: Frequency Modulation (FMno-fm) vs. No Frequency Modulation (no-FMFM)
We observed significant mismatches for both FM deviants within no-FM standards [FMno-FM (t1,12, 3.6, p = 0.003)] as well as the reverse condition [no-FMFM (t1,12, 6.0, p < 0.0001)], with the FMno-FM mismatch peak occurring significantly later than no-FMFM (t1,12, 5.6, p < 0.0001; Figure 3, Table 2). A comparison of subtraction waveforms for FM tones in the deviant and standard position within a no-FM context (FMno-FM) and no-FM tones in deviant and standard positions within an FM context (no-FMFM) revealed no significant amplitude difference (t1,12,1.2, p = 0.26).
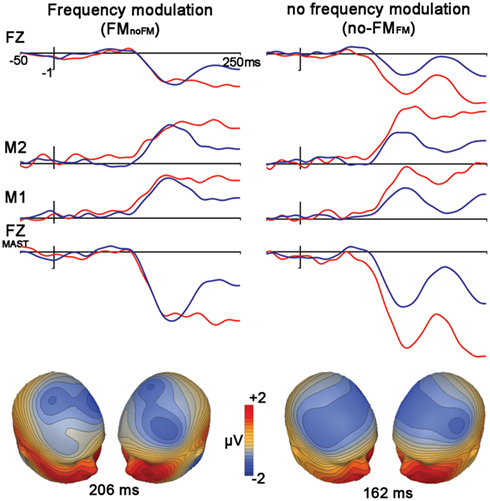
Figure 3. Control condition. FM vs. no-FM. Figure legend follows that of Figure 2.
Control Condition 2: Frequency Modulation: Differences in Modulation Depths (MD+MD−, MD−MD+)
The subtraction waveform generated by increasing modulation depth was significant [MD+MD− (t1,12, −4.2, p < 0.001)], while the subtraction deviant to decreasing modulation depth was not significant [MD−MD+ (t1,12, −2.0, p = 0.072)]. No latency differences were observed between subtraction waveforms (p = 0.49; Figure 4, Table 2).
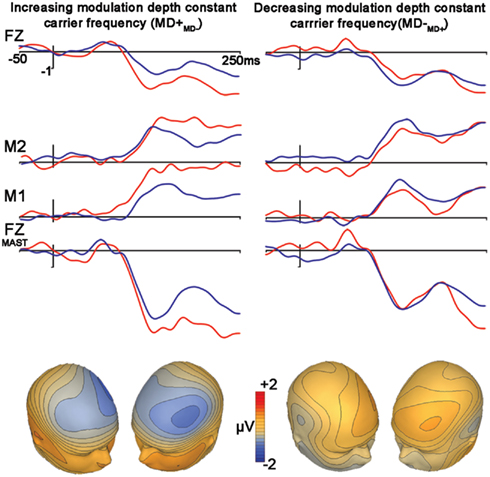
Figure 4. Control condition. Differences in modulation depths. Figure legend follows that of Figure 2.
A comparison between these mismatch subtraction waveforms revealed that subtraction waveforms generated by a modulation depth increase (MD+MD−) was larger than that observed by a modulation depth decrease (MD−MD+) This effect was statistically significant at trend levels (t1,12, −2.1, p = 0.057).
Post Recording Affective Judgments
After completing the EEG recordings, subjects were presented the four tones they heard in a randomized order and asked to affectively label the sounds as angry, sad, happy, or no-expression.
A chi square test of the emotional attribution pattern of subject ratings for the four FM tones indicated a response pattern that deviated significantly from chance  As Figure 5 indicates, subjects endorsed each tone differently. High carrier frequency and high modulation depth (378, 169 Hz) was identified as happy by 84.6% of subjects. The no-FM tone (378 no-FM) was identified as neutral by 92.3% of subjects. Finally, the majority of subjects recognized tones with high (378 Hz) and low (178 Hz) carrier frequencies but equivalent and low modulation depths (23 Hz) as sad and angry, respectively.
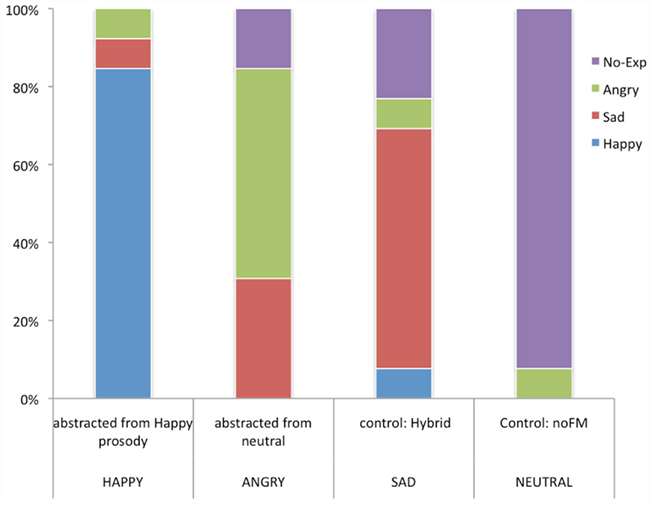
Figure 5. Post recording affective judgments. YY-axis reflects the percentage of 13 subjects that endorsed a particular emotion. X-axis reflects the four stimuli presented. The top label represents the stimulus, below it is what the emotion as endorsed by the majority of subjects.
Discussion
Our primary goal was to examine whether FM tones extracted from the fundamental frequency parameters can reliably reflect the emotional intent presented in the actual prosodic stimuli and whether these stimuli elicit significant MMNs that can be used to evaluate underlying processes. In order not to compromise MMN generation, subjects were only asked to characterize the emotion of the FM tones after EEG recording.
Behaviorally, post hoc affective judgments revealed a significant overall pattern for affective judgments for our stimuli. Eighty-four percent of our subjects correctly identified the FM tone based on prosodic happiness. Contrary to our expectations, however, the FM tone based on neutral (no-expression) prosody was judged by the majority of subjects to sound angry. This may be due to the presence of our additional control stimuli – notably the no-FM tone (378/0/0) – in our post hoc affective judgment task. Nevertheless, retrospectively this is consistent with the concept of “cold” vs. “hot” anger, with cold anger being conveyed by stimuli with low mean pitch but moderate pitch variability (Leitman et al., 2010). Ninety-two percent of subjects rated the no-FM as sounding neutral. The second control stimulus (378/23/3) was a hybrid, comprised of the carrier frequency abstracted from the happy speech stimuli and the small modulation depth of the neutral/angry speech stimulus. The majority of subjects judged this stimulus as sounding sad. These results suggest that it may be possible to reliably abstract basic emotions using simple FM tones and to use such stimuli for research into basic brain mechanisms underlying prosodic evaluation. We are currently attempting to map the emotionality of FM space in a more systemic manner, to permit more systematic evaluation deficits in disorders associated with prosodic impairments (Kantrowitz et al., 2011; Leitman and Janata, unpublished data).
In ERP studies, MMN-like responses were observed even when “like from like” analyses were used to compare responses to the same stimulus elicited in different contexts. A comparison of the MMNs elicited by the FM tones based on prosodic happiness (378/169/3) with those elicited by no-emotion (178/23/3) stimuli indicated that these stimuli both elicited equivalent MMNs. By contrasting across stimuli blocks using “like from like” subtractions we were able to conclude that the auditory deviance detection indexed in the MMN is not attributable to acoustical differences in standard and deviant tones, but rather to the automatic comparison between standard and deviant tones in a sequence.
In contrasting our FM stimuli with our control no-FM stimulus, we found that both FM and no-FM deviants elicited MMNs. These MMNs did not differ in amplitude, but the FM deviant peak (FMno-FM) occurred later. This latency shift likely reflects the fact that modulation of the FM tone develops progressively after stimulus onset, thereby delaying the point of deviance detection.
Our findings diverge from those of the one published paper to date on the topic by Bishop et al. (2005), which found that FM deviants among no-FM standards elicit MMNs while the converse does not. Methodological differences between our experiments and those of Bishop et al. may explain our conflicting results. First, our modulation and carrier frequencies differed somewhat from those of Bishop et al., as did our modulation depth. Bishop et al. used 200 ms tones with 500 Hz carrier waves, different modulation rates (5, 20, or 240 Hz), and a fixed modulation depth of 20 Hz. Our FM stimulus was a 1000-ms long 378 Hz carrier with a modulation depth of 169 Hz containing three complete cycles. Second, unlike Bishop et al., who directly subtracted FM tones from no-FM tones, we – in order to avoid indexing physical differences in the FM and no-FM tones – compared each deviant stimuli with its identical standard analog from another run. At first glance, it would seem that Bishop’s approach would be more likely to elicit a false no-FM MMN given the physical differences in the stimuli. However, it may be that distinct cortical regions are more finely tuned to FM sounds (Rauschecker, 1998). Conceivably, then, a within-run comparison of no-FM deviants and FM standards reflects a deviant waveform representing neuronal populations that respond to no-FM tones and a standard waveform representing these neurons as well as additional neurons that are tuned to FM, thereby obscuring any deviance-related negativity.
A final comparison of FM deviance in which carrier and modulation frequencies are held constant and only modulation depth changes indicated MMN asymmetry, with increasing modulation deviance (MD+) but not decreasing MD− eliciting a significant MMN. This tendency for larger MMN’s to deviants that increase rather than decrease in modulation features was also observed in the CMD+ vs. CMD− contrast. Yet, there the difference was not significant. The reason for this suggested asymmetry is unclear but perhaps MMN deviance detection is more sensitive to relational changes to the auditory environment that increase or add rather than decrease.
This study was a preliminary attempt to examine whether emotional intent could be reflected in a simple, stationary signal that incorporates two pitch parameters. Significant MMNs indicate that these distinctions can be processed pre-attentively. This study had a number of limitations: examination of voltage topographies to the FM happy and the MD+ topography suggests stronger right hemisphere (RH) FM MMN generation. This would be consistent with literature suggesting a RH preference for slow modulation signals (Zatorre et al., 2002) and a RH dominance in emotional prosody (Ross, 1981; Schirmer and Kotz, 2006). Future investigations using source localization and comparative study with MEG or fMRI will be necessary to confirm such hemispheric asymmetry. Such a study is indeed under way. In terms of our goal in abstracting emotion using simple FM tones, our results, while encouraging, are still preliminary. More systematic multidimensional mapping of emotion FM space in terms of carrier frequency, modulation depth, and modulation frequency is clearly needed before any firm conclusions can be drawn. Further investigations should also determine the number of categorically perceived emotions that can be represented. Unpublished data (Kantrowitz et al., 2011; Leitman and Janata, unpublished data) in our lab suggests that emotions distinctly cluster along differing portions of FM multidimensional space.
The major utility of such systematic mapping of affective judgments would provide a flexible and sensitive tool to examine the relationship between auditory pitch perception and emotional judgment, potentially benefiting clinical investigations of dysprosodia in illnesses such as parkinsonism, schizophrenia, and autism.
An additional utility of such tasks would be as behavioral electrophysiological probes for developmental learning disabilities that involve abnormal phonological processing like some forms of dyslexia. It has recently been suggested that such disabilities arise from improper temporal sampling of speech signals (Goswami, 2011; Goswami et al., 2011), and the inability to perceive changes of amplitude (rise time) within the speech amplitude envelope. These deficits are particularly pronounced for slow modulations of <4 Hz− roughly the syllabic rate or period of conversational speech. Such slow temporal processing [delta (1.5 Hz+) and theta (3–10 Hz)] is preferentially processed by right superior temporal gyrus (rSTG) with lSTG favoring higher beta and gamma frequencies (15+ and 30+ Hz respectively; Zatorre et al., 2002; Poeppel et al., 2008; Goswami, 2011). Mapping FM tones three-dimensionally in terms of high and low modulation frequencies, modulation depths and carrier frequencies could thus provide a useful tool to characterize abnormal rise time perception and temporal sampling nature, providing a quantitative neuropsychological index for phonological processing abnormalities in developmental learning disabilities.
Conclusion
Previously we (Leitman et al., 2009) and others (Kujala et al., 2005; Schirmer et al., 2005) have demonstrated that prosodic perception begin quite early in auditory processing and can be indexed by the MMN. These findings however have used either real speech or tonal contours for real speech. A central question to understanding auditory processing of prosody is what the minimal amount of information to convey affective distinctions and pertinently whether the temporal sequence or progression of the prosodic signal is necessary for rapid classification of emotions. Here we observe that stationary FM tones discriminate emotions as well as elicit significant MMN’s, demonstrating preliminary evidence that a simple representation of mean fundamental frequency and its variation over time are sufficient to characterize emotional distinctions and process them automatically.
Conflict of Interest Statement
The authors declare that the research was conducted in the absence of any commercial or financial relationships that could be construed as a potential conflict of interest.
Acknowledgments
This work was supported in part by NIMH grants NRSA F1-MH067339 (David I. Leitman), K02 MH01439, and R01 MH49334 (Daniel C. Javitt). NARSAD Young Investigator Award for David I. Leitman.
References
Beale, J. M., and Keil, F. C. (1995). Categorical effects in the perception of faces. Cognition 57, 217–239.
Bishop, D. V., O’Reilly, J., and McArthur, G. M. (2005). Electrophysiological evidence implicates automatic low-level feature detectors in perceptual asymmetry. Brain Res. Cogn. Brain Res. 24, 177–179.
Etcoff, N. L., and Magee, J. J. (1992). Categorical perception of facial expressions. Cognition 44, 227–240.
Goswami, U. (2011). A temporal sampling framework for developmental dyslexia. Trends Cogn. Sci. (Regul. Ed.) 15, 3–10.
Goswami, U., Fosker, T., Huss, M., Mead, N., and Szucs, D. (2011). Rise time and formant transition duration in the discrimination of speech sounds: the Ba-Wa distinction in developmental dyslexia. Dev. Sci. 14, 34–43.
Goydke, K. N., Altenmuller, E., Moller, J., and Munte, T. F. (2004). Changes in emotional tone and instrumental timbre are reflected by the mismatch negativity. Brain Res. Cogn. Brain Res. 21, 351–359.
Harnad, S. (1987). “Psychophysical and cognitive aspects of categorical perception: a critical overview,” in Categorical Perception: The Groundwork of Cognition, Chapt. 1, ed. S. Harnad (New York: Cambridge University Press), 1–29.
Juslin, P., and Scherer, K. (2005). “Vocal expression of affect,” in The New Handbook of Methods in Nonverbal Behavior Research, eds J. Harrigan, R. Rosenthal, and K. R. Scherer (New York: Oxford University Press), 65–135.
Juslin, P. N., and Laukka, P. (2001). Impact of intended emotion intensity on cue utilization and decoding accuracy in vocal expression of emotion. Emotion 1, 381–412.
Kantrowitz, J. T., Leitman, D. I., Lehrfeld, J. M., Laukka, P., Juslin, P. N., Butler, P. D., Silipo, G., and Javitt, D. C. (2011). Reduction in tonal discriminations predicts receptive emotion processing deficits in schizophrenia and schizoaffective disorder. Schizophr. Bull.
Kawasaki, H., Kaufman, O., Damasio, H., Damasio, A. R., Granner, M., Bakken, H., Hori, T., Howard, M. A. III, and Adolphs, R. (2001). Single-neuron responses to emotional visual stimuli recorded in human ventral prefrontal cortex. Nat. Neurosci. 4, 15–16.
Knowner, F. (1941). Analysis of some experimental variations of simulated vocal expressions and actions. J. Soc. Psychol. 14, 369–372.
Korpilahti, P., Jansson-Verkasalo, E., Mattila, M. L., Kuusikko, S., Suominen, K., Rytky, S., Pauls, D. L., and Moilanen, I. (2007). Processing of affective speech prosody is impaired in Asperger syndrome. J. Autism Dev. Disord. 37, 1539–1549.
Kujala, T., Lepisto, T., Nieminen-von Wendt, T., Naatanen, P., and Naatanen, R. (2005). Neurophysiological evidence for cortical discrimination impairment of prosody in Asperger syndrome. Neurosci. Lett. 383, 260–265.
Kujala, T., Tervaniemi, M., and Schroger, E. (2007). The mismatch negativity in cognitive and clinical neuroscience: theoretical and methodological considerations. Biol. Psychol. 74, 1–19.
Ladd, D., Silverman, K., Tolkmitt, F., Bergmann, G., and Scherer, K. (1985). Evidence for the independent function of intonation, contour type, voice quality, and F0 range in signalling speaker affect. J. Acoust. Soc. Am. 78, 435–444.
Lakshminarayanan, K., Ben Shalom, D., van Wassenhove, V., Orbelo, D., Houde, J., and Poeppel, D. (2003). The effect of spectral manipulations on the identification of affective and linguistic prosody. Brain Lang. 84, 250–263.
Leitman, D. I., Laukka, P., Juslin, P. N., Saccente, E., Butler, P., and Javitt, D. C. (2010). Getting the cue: sensory contributions to auditory emotion recognition impairments in schizophrenia. Schizophr. Bull. 36, 545–556.
Leitman, D. I., Sehatpour, P., Shpaner, M., Foxe, J. J., and Javitt, D. C. (2009). Mismatch negativity to tonal contours suggests preattentive perception of prosodic content. Behav. Brain Imaging 3, 284–291.
Majewski, W., and Blasdell, R. (1969). Influence of fundamental frequency cues on the perception of some synthetic intonation contours. J. Acoust. Soc. Am. 45, 450–457.
Näätänen, R. (1991). Mismatch negativity outside strong attentional focus: a commentary on Woldorff et al. (1991). Psychophysiology 28, 478–484.
Näätänen, R. (2000). Mismatch negativity (MMN): perspectives for application. Int. J. Psychophysiol. 37, 3–10.
Poeppel, D., Idsardi, W. J., and van Wassenhove, V. (2008). Speech perception at the interface of neurobiology and linguistics. Philos. Trans. R. Soc. Lond. B Biol. Sci. 363, 1071–1086.
Rauschecker, J. P. (1998). Parallel processing in the auditory cortex of primates. Audiol. Neurootol. 3, 86–103.
Ross, E. D. (1981). The aprosodias. Functional-anatomic organization of the affective components of language in the right hemisphere. Arch. Neurol. 38, 561–569.
Sauter, D. A., and Eimer, M. (2010). Rapid detection of emotion from human vocalizations. J. Cogn. Neurosci. 22, 474–481.
Schirmer, A., Escoffier, N., Li, Q. Y., Li, H., Strafford-Wilson, J., and Li, W. I. (2008). What grabs his attention but not hers? Estrogen correlates with neurophysiological measures of vocal change detection. Psychoneuroendocrinology 33, 718–727.
Schirmer, A., and Kotz, S. A. (2006). Beyond the right hemisphere: brain mechanisms mediating vocal emotional processing. Trends Cogn. Sci. (Regul. Ed.) 10, 24–30.
Schirmer, A., Striano, T., and Friederici, A. D. (2005). Sex differences in the preattentive processing of vocal emotional expressions. Neuroreport 16, 635–639.
Thonnessen, H., Boers, F., Dammers, J., Chen, Y. H., Norra, C., and Mathiak, K. (2010). Early sensory encoding of affective prosody: neuromagnetic tomography of emotional category changes. Neuroimage 50, 250–259.
Woldorff, M. G., Hackley, S. A., and Hillyard, S. A. (1991). The effects of channel-selective attention on the mismatch negativity wave elicited by deviant tones. Psychophysiology 28, 30–42.
Young, A. W., Rowland, D., Calder, A. J., Etcoff, N. L., Seth, A., and Perrett, D. I. (1997). Facial expression megamix: tests of dimensional and category accounts of emotion recognition. Cognition 63, 271–313.
Keywords: mismatch negativity, MMN, frequency modulation, auditory, cortex, emotion, speech
Citation: Leitman DI, Sehatpour P, Garidis C, Gomez-Ramirez M and Javitt DC (2011) Preliminary evidence of pre-attentive distinctions of frequency-modulated tones that convey affect. Front. Hum. Neurosci. 5:96. doi: 10.3389/fnhum.2011.00096
Received: 25 March 2011;
Accepted: 19 August 2011;
Published online: 03 October 2011.
Edited by:
Hans-Jochen Heinze, University of Magdeburg, GermanyReviewed by:
Micah M. Murray, Université de Lausanne, SwitzerlandClaude Alain, Rotman Research Institute, Canada
Copyright: © 2011 Leitman, Sehatpour, Garidis, Gomez-Ramirez and Javitt. This is an open-access article subject to a non-exclusive license between the authors and Frontiers Media SA, which permits use, distribution and reproduction in other forums, provided the original authors and source are credited and other Frontiers conditions are complied with.
*Correspondence: David I. Leitman, Neuropsychiatry Program, Brain Behavior Laboratory, Department of Psychiatry, University of Pennsylvania, Gates Pavilion 10th floor, 3400 Spruce Street, Philadelphia, PA 19104-4283, USA. e-mail: leitman@mail.med.upenn.edu