External measures of cognition
- Department of Computer Science, Instituto Tecnolόgico Autόnomo de México, México DF, México
The human brain is undoubtedly the most impressive, complex, and intricate organ that has evolved over time. It is also probably the least understood, and for that reason, the one that is currently attracting the most attention. In fact, the number of comparative analyses that focus on the evolution of brain size in Homo sapiens and other species has increased dramatically in recent years. In neuroscience, no other issue has generated so much interest and been the topic of so many heated debates as the difference in brain size between socially defined population groups, both its connotations and implications. For over a century, external measures of cognition have been related to intelligence. However, it is still unclear whether these measures actually correspond to cognitive abilities. In summary, this paper must be reviewed with this premise in mind.
Introduction
The relationship between brain size and intelligence has been sustained and documented since the nineteenth and early twentieth centuries (Morton, 1839; Broca, 1861; Galton, 1889; Terman, 1926; Sorokin, 1927; Hooton, 1939). Broca (1861), the famous French neurologist, concluded that brain size is directly related to intellectual achievement. In his research, he observed that skilled workers and individuals prominent in their fields had larger brains than those who had not achieved such distinction. Galton (1889), however, was the first to quantify the relationship between brain size and mental abilities. In a study involving 1,000 male college students, Galton showed that cranial capacity (cc) continues to grow after the age of 19, and those individuals who graduated with honors at the University of Cambridge had a brain size between 2 and 5% larger than those who did not obtain such distinction. Terman (1926) further demonstrated that, on an average, individuals with special talents had larger brains than those who were not.
Research on brain size and intelligence almost stopped after World War II, mainly because craniometry became associated with both Hitler’s racial policies and was considered a form of racial prejudice (Rushton and Ankney, 2009). A vast amount of literature negating the existence of such a link was published at the time and continues to be published to this day (Kamin, 1974; Gould, 1981; Sternberg et al., 2005; Healy and Rowe, 2007; Rose, 2009).
Nevertheless, as discussed below, recent studies involving imaging techniques, such as functional magnetic resonance imaging (fMRI) or positron emission tomography (PET) scans, which can be used on living humans, confirm much of the early evidence. Currently, the relationship between brain size and the size of brain compartments and cognitive abilities is supported and documented by several researchers in dozens of studies (Willerman et al., 1991; Brand, 1996; Herrnstein and Murray, 1996; Jensen, 1998; Gibson, 2002; Ivanovic et al., 2004a; Barton, 2006; Flynn, 2007; Ceci and Williams, 2009; Nisbett, 2009). The correlation between intelligence quotient (IQ) and brain size is greater than 0.40. These results can be summarized in the following way: the larger the brain, the higher the IQ. In principle, this assumption is substantiated by two facts: (a) much of the brain is occupied by cortical associations, and (b) the cerebral cortex, the layer of the brain often referred to as gray matter, encompasses more than two-thirds of the brain mass. The cerebral cortex is responsible for thinking, perceiving, producing, and understanding language (More evolved animals tend to have greater cerebral cortex than less evolved animals). Therefore, if the brain is larger, then the cerebral cortex must be bigger, although it is known that not all parts of the brain grow at the same rate. Moreover, the brain may have more cortical associations (although one study failed to reveal this: Van Valen, 1974). An increase in brain size could also result in an increase in the complexity of its functions. In addition, Haug (1987) showed that larger brains have more neurons, and Gibson (2002) noted that an increase in brain size implies an increase in conceptual or semantic complexity, although it should be noted that there are individuals with large brains, and low intelligence levels. For example, individuals with hydrocephalus (water on the brain) with an abnormal accumulation of cerebrospinal fluid in the ventricles, or cavities, of the brain may experience a progressive enlargement of the head. Moreover, the hominids evolved from having a small brain of around 400 cm3 in size to an average of 1,400 cm3 today. If size were not important, this finding raises questions about why the brain size has evolved significantly over the past million years (Modern man was characterized by a decrease in body size and, at the same time, an increase in brain size). The consensus view is that the brain and some of its compartments evolved to process information of ecological relevance. Jerison also notes that brain size is proportional to its capacity for processing information. Therefore, the evolution of encephalization essentially involves an increase in the brain’s capacity to process information (Jerison, 1985).
Finally, if we recognize that natural selection has influenced the behavior of species, as evolutionary biologists say, why not also recognize its impact on the neural architecture and the size of the brain? Barton (2006) presented results showing evidence that natural selection has influenced brain structure.
The relationship between brain size and intelligence is obviously quite controversial. Many papers support one point of view, while many others deny it. Both sides substantiate their position with arguments and disqualify the opposing view, claiming it contains misleading conclusions that are based upon faulty collection and analysis of data. Both sides are basically saying the same thing. Clearly, an ancient and fierce fight continues between those who believe the origins of intelligence are determined by genetics and those who say they are environmentally influenced (Kirp, 2006). While environmental advocates revive the war on poverty, supporters of genetic determination embrace the Darwinian perspective.
Rather than support either position, which leads you nowhere, research on the issue should reinforce a third view that has gained acceptance and credibility in recent years: genes and environment cannot be assessed separately. All our development is carried out with this premise in mind.
Brain Size, Intelligence, and Ethnic Groups
The connotations and implications of differences in brain size among ethnic groups or socially defined population groups have attracted interest and generated much controversy in different disciplines. An ethnic group refers to the categorization of humans in groups or populations according to a common culture and a set of inheritable factors, such as facial features, skin pigmentation, skull morphology, and hair texture. Although many consider an ethnic group to be composed of individuals with similar genotypes and phenotypes – race as clade – other researchers point out that ethnicity must be understood as a social category, delineated according to the culture that finally establishes the ethnic distinctions. The definitions of socially defined population groups are noticeably imprecise, arbitrary, and have many exceptions. Taking these background considerations into account, it might seem surprising if we consciously omit any of them: the results of genetic research, the environmental components, or the gene-environment interplay. Doing so might simply close the door to new knowledge.
Genotypes and Phenotypes
In general, everyone agrees that Asians, Europeans, and black Africans are easily recognizable and distinguishable from each other by their phenotypes, meaning the expression of genotypes in a given environment. While the genotype of an individual is recognized by observing DNA, the phenotype is recognized by observing the physical appearance, such as morphology, development, biochemical, and physiological properties, and/or individual behavior. The fundamental dispute can be summarized as follows: (a) whether individuals with similar phenotypes have similar genotypes, and (b) if the genotypes, which are the main basis for defining phenotypes, are also responsible for defining the intellect of individuals.
In reference to the first point, there is a consensus that similar phenotypes involve similar genotypes, although certain exceptions are recognized, such as epigenetic factors and variability or phenotypic plasticity. For example, a queen ant and a worker ant have different phenotypes, but their genotypes are identical. The difference is produced by dietary factors and embryonic incubation. The selection of a female queen remains a matter of speculation.
In reference to the second point, evidence obtained by studies conducted in recent years suggests that genetic variation has a decisive influence on IQ. It is estimated that approximately 70% of intelligence, chiefly among adults, is derived from genes (Bouchard, 2004). Deary (2001) also notes that members of one family generally tend to achieve similar results in tests of mental skills, while individuals who are not genetically related do not. Bouchard (2004) also mentions that the discussion between researchers is not based on whether there is a genetic influence on the psychological traits of individuals, but what is the extent of that influence, and how do genes work to shape the mind. Reinforcing the above conclusion, Rutter (2002) indicates that there is still another that is impossible to ignore: genetic factors play a substantial role in the origins of individual differences with respect to all psychological traits, whether they are normal or abnormal. The genetic influence on the intellect seems to occur mainly as a result of interaction among multiple genes; however, both the mechanisms of interaction between them and the dynamics of brain structure remain unknown at present.
The fundamental study of key scientific findings seems to show that genotypes are responsible for defining the theoretical limits of intelligence, but the experience (environment) is largely responsible for determining whether those limits will be reached or surpassed. The gene-environment interplay is what we define as the IQ of an individual.
It is obvious that environment cannot alter gene sequences, but genetic effects, as Rutter notes, are dependent on the expressions of genes, and this process has been shown to be influenced by both environmental factors and chance variations (Rutter, 2010).
There is also a conclusion that has been the subject of debate regarding heritability models that we cannot ignore: it is inappropriate to apply conclusions concerning heritability drawn from within-group studies (such as twin studies) to cross-group comparisons (such as ethnic groups).
Cranial Capacity and the Differences among Ethnic Groups
We begin by explaining that no racist or ideological assumptions about racial supremacy that have caused so much damage in society exist in this section or in subsequent ones. If some connections are made between socially defined groups and intelligence, they are not intended to promote the idea of superior and inferior groups. Throughout this paper you will find the basis for this clarification. Therefore, it is important that you read this section with this premise in mind.
Rushton (2000) points out that the descendants of black Africans have an average cc of 1,267 cm3 and 13,185 million cortical neurons (nc); the descendants of white Europeans have a cc of 1,347 cm3 and 13,665 million nc; and the descendants of East Asians have a cc of 1,364 cm3 and 13,767 million nc. Ho et al. (1980) and his team, who measured 1,261 brains while performing autopsies, previously made other similar claims. These differences in brain size involve millions of neurons and hundreds of millions of synapses that most likely will determine an inequality in mental skills tests. On average, black Africans have an IQ of 85, Caucasians an IQ of 100, and East Asians an IQ of 106. The lowest average IQ of 70 corresponds to the sub-Saharan Africans (Jensen, 1998; Lynn and Vanhanen, 2002).
Beals et al. (1984), who developed the largest study on racial differences in intracranial volume with measures of 20,000 skulls from around the world, show that on average cc is 1,415 cm3 for Asians, 1,362 cm3 for Europeans, and 1,268 cm3 for black Africans. Moreover, on a worldwide basis, a meta-analysis conducted by Lynn and Vanhanen (2002) shows that on average individuals with a higher IQ are East Asians with 105 points, followed by Europeans with 99, Inuit or Eskimo with 91, Amerindians and people of Southeast Asia with 87, the inhabitants of Pacific islands with 85, North African residents with 84, sub-Saharan Africans with 67, Australian aborigines with 62, and the bushmen with 54.
The distribution of IQ scores among socially defined population groups has also been the subject of research in the United States. Studies show that Hispanics and Native Americans, including natives of the Arctic (MacArthur, 1968), tend to have a lower average IQ than the white population, but a higher average than African–Americans (Roth et al., 2001). In a review of the results of IQ tests in more than 6 million people, Roth found a black–white gap of 1.1 SD. The population of East Asia, however, has a higher average IQ score than Caucasians (Hunt and Carlson, 2007).
Nevertheless, a study by Dickens and Flynn (2006) suggests that there is a narrowing of the black–white gap and today the difference is only 5 or 6 IQ points. In a study that same year, Murray (2006) confirmed the results of Dickens and Flynn.
The Co-Action between Environment and Brain Size
The expansion of the brain after birth is caused by the growth of synapses and cortical interconnections that are dependent on nutritional conditions and the environment (Rao and Jacobson, 2005). The inhabitants of sub-Saharan Africa have a low intellectual coefficient and a small cc, but it is important to emphasize that this region has the greatest poverty and the lowest Human Development Index worldwide. The most artificially impoverished countries around the planet, suffering serious legacies of colonialism, neocolonialism, ethnic conflict, and political instability, are found in the Sub-Saharan region, commonly known as Black Africa. The nutritional conditions of most individuals in this area are very poor, which undoubtedly affect normal brain growth. Significantly, diet appears to be one of the main factors that explain the variation in brain size in non-human primates (Healy and Rowe, 2007). A diet rich in meat, for example, coincides with increased brain size in mammals (Foley et al., 1991) and human evolution (Mann, 2000).
Coon (1955) notes that cranial morphology is also a reflection of thermoregulation. It is much easier to keep a small head cooler than a large one. From this perspective, in hot regions, like Africa, a small head is an advantage. However, in geographic areas with cold climates, like Europe and Asia, a large head is an advantage. Beals et al. (1984) also reported a correlation of 0.62 between cc and distance from the equator. Jensen (1998) reasoned that natural selection would favor a smaller head with a less spherical shape because of better heat dissipation in hot climates. Templer and Arikawa (2006) provided strong support for the observation that persons in colder climates tend to have higher IQs. U.S. historian Horace Bond, grandson of slaves and the first African American president of Lincoln University, showed that blacks from the north were more intelligent than whites from the south (Jackson, 2004). Rindermann (2007) also notes the IQ estimates from countries around the world correlates with those country’s test scores in mathematics and academic achievement.
On the other hand, evidence based on research has now shown that the structure of the human brain as well as its functional organization changes when a new cognitive or motor skill is learned (Draganski et al., 2004; Driemeyer et al., 2008). While functional changes can be observed and studied with non-invasive techniques, such as fMRI, PET, multichannel electroencephalography (EEG), or magnetoencephalography (MEG), structural changes require the use of invasive histological methods. However, fluid intelligence, which refers to the ability to adapt our thinking to a new cognitive problem or situation, is considered one of the most important factors in learning (Jaeggi et al., 2008). With more training, our fluid intelligence improves. An increase in fluid intelligence is directly related to the changes in the structure of the human brain and its functional organization. Jaeggi points out that the gain in fluid intelligence is strictly related to training, not to pre-existing individual differences in intelligence or working memory.
In particular, when a new cognitive or motor skill is learned, an increase in gray matter volume has been observed, which is known as structural neuroplasticity or cortical re-mapping. Gaser and Schlaug (2003) found more gray matter in some motor, auditory, visual–spatial brain regions when comparing professional musicians to amateurs and to non-musicians (Neubauer and Fink, 2009). Different experiments (Maguire et al., 2000; May et al., 2006; Vestergaard-Poulsen et al., 2009) show that brain plasticity on a structural level in human beings has been detected even after a week of training, although changes over a longer period of time – days, months, or years – are still a subject for debate. While there is a belief that all areas of the brain are plastic, the results show that brain areas, such as hippocampus, dentate gyrus, and cerebellum, are highly plastic (new neurons can be produced even in adulthood). Rutter (2010) summarizes well the different forms of co-action between gene and environment.
Brain Size: An Important Metric?
There is disagreement about whether or not the variables determining absolute brain size, relative brain size, or certain regions of the brain provide the greatest biological mediators of intelligence. In addition, Ivanovic pointed out that head circumference is the most relevant physical index associated with scholastic achievement and intellectual ability in Chilean school-age children (Ivanovic et al., 2004b). It is also evident that with the advent of brain imaging, the issue of the relationship between brain size (or brain compartments) and intelligence has been revived.
While many studies show that size effects are manifest throughout the brain and are not specific to any particular region (Andreasen et al., 1993; Wickett et al., 1994; Bigler et al., 1995; Reiss et al., 1996; Haier et al., 2004), others believe that it is time to focus on other measures that may be of greater interest (Bracke-Tolkmitt et al., 1989; Rogers, 2004; Colom et al., 2006; Healy and Rowe, 2007; Jung and Haier, 2007) – for instance, relative brain size, large multi-functional parts of the brain, such as motor control, cognition, and sensory processing, or brain regions like the cerebral cortex, cortical thickness (Krugger et al., 2003), neocortex, frontal, and parietal brain regions (Jung and Haier, 2007; Langer et al., 2011), cerebellum, midbrain, and so on. Neubauer and Fink (2009) also add that the cognitive performance is a function of the brain structure as well as of the functional interplay of different neural networks.
It is noteworthy that the cerebral cortex occupies 77% of the volume of the human brain, the midbrain 4%, the cerebellum 10%, the spinal cord 2%, the hindbrain 2%, and the diencephalons 4% (Swanson, 1995). The cerebellum, with only 10% of the total brain volume, contains more than half the 100 billion neurons in the brain (Kandel et al., 2000). The cerebellum undoubtedly plays an important role in the intellect of individuals (Does the number of neurons correlate with intelligence? Does the gray matter volume in the cerebellum correlate with cognitive abilities?; Bracke-Tolkmitt et al., 1989; Hogan et al., 2001).
Rushton and Ankney (2009) suggest that although the questions “Is IQ correlated with absolute brain size?,” “Is IQ correlated with relative brain size?,” or “Is IQ correlated with different regions of the brain?” are completely different, the research evidence shows that the answer to all of them is yes. However, it also became clear that finding these kinds of measures and correlations did not help the understanding of how brain structure mapped on behavior and intelligence.
Different Techniques: Factor of Imprecision?
Another variable that increased the controversy that exists between brain size and functioning – particularly intelligence – is the technique used to measure the overall brain size, the external head size, and the size of substructures in the brain, and the correlation between these measures and cognitive skills. Brain size is sometimes measured by weight and other times by volume. In some cases studies are performed on live humans and in others they are conducted on dead bodies. At times the meninges and cerebrospinal (brain weight) are included and at others they are not (brain tissue weight).
When observing an object or phenomenon, it is important to be clear that the results of the observation depend on the method that is used, particularly the scale and the means employed that give us an idea of the relativity of all observations. While in some studies Bigler et al. (1995), Egan et al. (1994), and Andreasen et al. (1993) use nuclear magnetic resonance (NMR), Harvey et al. (1994) uses MRI, Madden (2001) applies X-rays to the skull, and Beals et al. (1984) uses endocranial volume from an empty skull. Wickett et al. (2000) and Ivanovic et al. (2004a) utilize the skull circumference, Iwaniuk and Nelson (2001) calculate the size by filling the skull with lead shot, and Marino uses computed tomography (CT) scans of fossilized cetacean specimens (Marino et al., 2006). Although the techniques are widely used on the skulls of different species, it is worth noting that these different methods for calculating skull size can lead to unreliable measurements and interpretations.
A recent study presented by Rushton and Ankney (2009) shows, e.g., that in the 55 instances that IQ was correlated with external head measurements, the average r was 0.20. In 27 instances in which brain imaging techniques were used, the average was 0.40, and in five examples in which the method was applied to correlate vectors to extract g, the average was 0.57. Jensen (1994) found a correlation of 0.19 between g and the circumference of the head in a cognitive test among 286 adolescents, but when he used the method to map vectors, he obtained a correlation of 0.64. Schoenemann et al. (2000) obtained a correlation of 0.45 between brain volume and g.
On the other hand, Haug (1987) reported a correlation of 0.48 between the number of nc and brain size, and Pakkenberg and Gundersen (1997) showed a correlation of 0.56 between brain size and number of neurons.
Again, although the methods are completely different and are used to obtain correlations that are also different, they all seem to show that there is a significant relationship between brain size, or the size of substructures, and intelligence.
Ratio between Brain Size and Body Size
Homo sapiens, the smartest of all animals, have the largest absolute brain size within the primate order. It is surpassed by elephants and some cetaceans (sperm whales) whose brain size can exceed 8 kg. As might be expected, brain size tends to vary according to body size (brain size usually increases with body size in animals), although the relationship is not always proportional. There are good reasons, therefore, for expecting a power law such as the brain-to-body weight ratio (or brain-to-body height), which is hypothesized to be a rough estimate of the intelligence of an animal, and a useful tool for comparing encephalization within species. This somehow suggests that relative rather than absolute brain size coincides much better with observed cognitive abilities in animals.
It is interesting to compare these ratios for humans, dolphins, African gray parrots, and chimpanzees, supposedly the most intelligent animals of the sea, sky, and earth.
• Human male. Brain: 1.4 kg. Weight: 75 kg. Ratio: 1.86%
• Bottle-nosed dolphin. Brain: 1.5 kg. Weight: 120 kg. Ratio: 1.25%
• Chimpanzee. Brain: 0.4 kg. Weight: 45 kg. Ratio: 0.88%
• African gray parrot. Brain: 0.0057 kg. Weight: 0.33 kg. Ratio: 1.72%
The results tend to substantiate to some degree the perception that the intelligence of humans is superior to that of other living beings. While the formula seems logical, it has some inconsistencies. For instance, a shrew’s brain weighs 3 g and its total weight is 30 g, making its ratio 10%. The tiny shrew has the highest brain-to-body mass ratio of any known animal. The result suggests that a shrew should be five times more intelligent than a human being.
On the other hand, an obese individual weighing 160 kg would have a ratio of 0.84%, which would suggest an intelligence level similar to that of a chimpanzee. The fat undoubtedly distorts the formula.
Passingham (1979) and Jerison (1979) also recommend that the formula be applied to a more precise age group to avoid distortions or results that are not very reliable. Human bodies tends to get smaller with age – the size of their brains and their height decrease over time (Ho et al., 1980; Raz et al., 1997), although not in the same proportion. Body weight, on the other hand, may remain constant or may increase. Passingham advocates using people between the ages of 18 and 45, while Jerison prefers a more conservative range, between 28 and 41. The argument lies in the fact that the brain continues to grow until it reaches 30 years of age and the loss of brain tissue begins after 40.
Peters et al. (1998) also points out that it is difficult to control the body size of different social groups (and gender) because bodies do not only differ in weight and height. The Inuit, for example, are short and robust, while the Masai are tall, thin, and agile. It is obvious that the Inuit are not a smaller version of the Masai, and that height and weight (and the relationship between them) should not be the only parameter considered. In the study, there is a strong correlation between height and brain size in individuals of socially diverse groups (collection of ethnically heterogenous data, Jurgens et al., 1990), but a weak correlation between members of the same social group (collection of ethnically homogenous data, Pakkenberg and Voigt, 1964).
Skullerud (1985), on the other hand, mentions that it is more useful to use body weight in relation to height (the body mass index that divides the weight in kilogram by the squared height in meters), than to utilize either of them in an independent manner. When using the ratio formula, as is suggested, you have a strong correlation between weight and height and brain size for a collection of ethnically homogenous data, and a weak correlation for a collection of ethnically heterogenous data (Peters et al., 1998).
In summary, the relationship between brain-to-body size ratio and complexity of behavior is obviously not perfect since it does not consider certain aspects that distort the formula, such as fat, and it takes into consideration others, like body size, which we still do not fully understand. As Peters well points out, we will have to wait until the quality of the collection of data improves to obtain more reliable results about the relationship between brain and body size. On the one hand, it should define how the parameters of the body should operate among different social and gender groups and, on the other, how to incorporate the demographic, nutritional, and environmental factors that reflect the characteristics of each social group and the environment in which it live.
Encephalization Quotient
A more complex and approximate alternative to external measures of cognition is the encephalization quotient that takes into account allometric effects of widely divergent body sizes. This measure, used mainly by paleoneurologists, appears in zoological studies and occasionally in human literature.
The basic assumption in this theory is that most of the brain in vertebrates is constructed as a series of mappings repeated at various levels. Encephalization is seen as a composite of an amplification factor for the repeated mappings and a factor associated with added tissue, meaning tissue that is associated with new functions (Jerison, 2000). For a larger organism, more brain capacity is needed to perform basic survival tasks, such as thermoregulation, breathing, and motor skills. As the brain gets larger in relation to body size, it will have greater available capacity for performing cognitive tasks.
The EQ represents the deviation of the regression of the brain-to-body weight ratio and is calculated as:

The constants 0.12 and (2/3) were derived empirically. Jerison (1973) estimated that the constant used in the power is 0.666, or 2/3, for mammals. The constant indicates an important geometric relationship between volume and surface area. Martin (1981), on the other hand, estimated the same constant, which describes a metabolic relationship, to be 0.76 using a larger set of cases. The explanation for an exponent of 0.76 is not obvious. Nevertheless, it is also noteworthy that several physiological variables appear to be related to body size by approximately the same exponent (Savage et al., 2004). These differences also serve as an indication of the appreciable differences that exist today with the parameters and values that appear in formulas.
The average EQ is defined as 1. The shrew reaches an EQ of 2.54; the dolphin, an encephalization quotient above 5; and a human being an EQ of 6.54. Russell (1983) found that the EQ of a mammal that lived 65 million years ago was 0.30, compared to the average of 1.0 today. The following Table 1 presents the encephalization quotients of man and animals. It should be noted that data on the weight and cc of animals is relative because it changes considerably depending on who conducts the research.
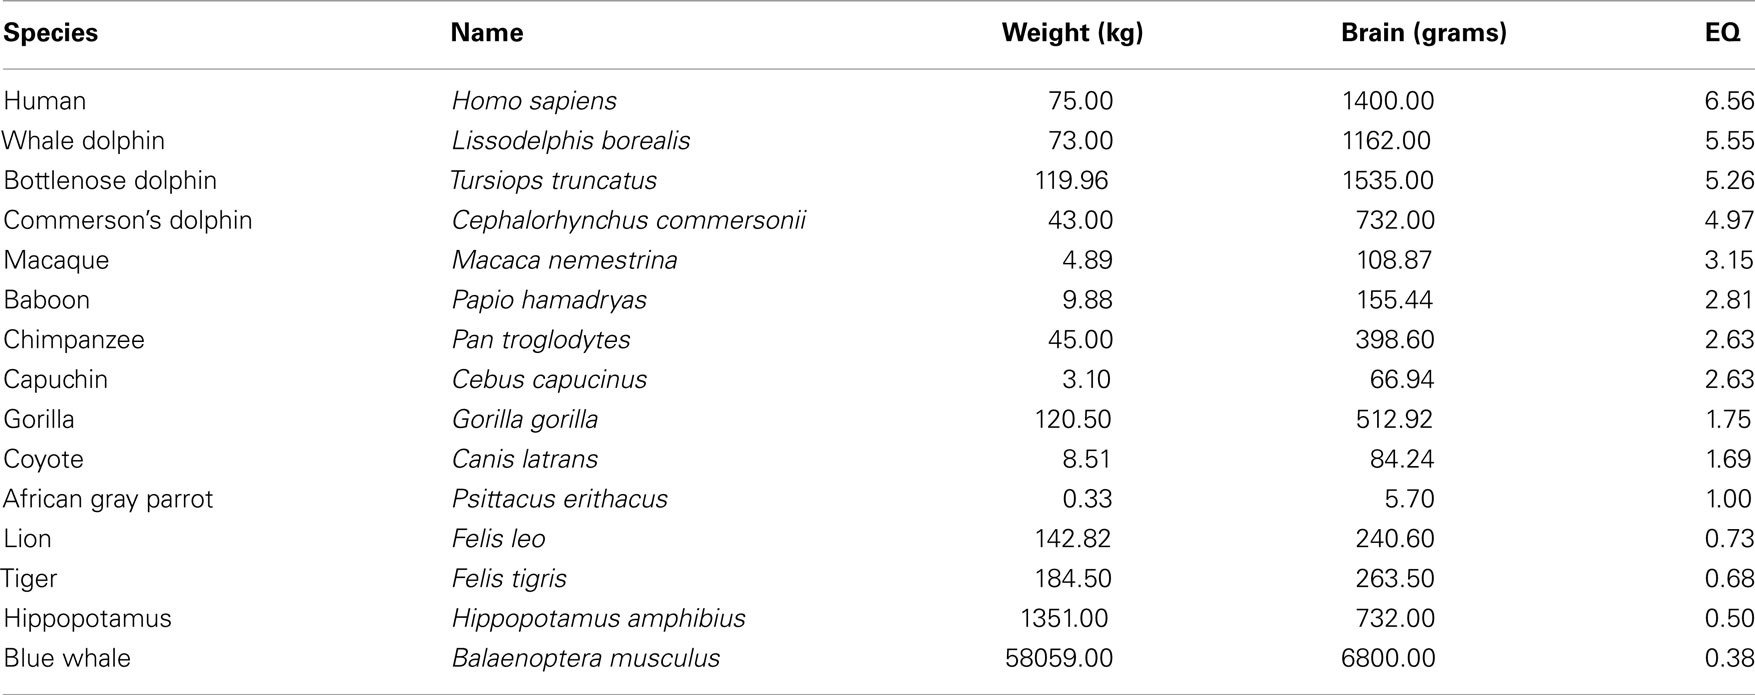
Table 1. Encephalization quotient of man and some animals.
The EQ formula can reasonably be seen as a good predictor of intelligence in animals, mainly mammals (For instance, it puts humans at the top of the list – evolved animals tend to have more cerebral cortex than less evolved animals. The EQ of predator species is generally higher than that of the animals they prey on. The EQ of prey species that use active predator avoidance strategies is higher than that of prey species that do not use avoidance strategies. The EQ of species that live socially is higher than that of species that do not have social interaction), but it has some weaknesses. For instance, the EQ formula cannot distinguish between a thin and obese human. While an individual who weighs 75 kg with a cc of 1,400 cm3 would have an EQ of 6.56, an individual who weighs 150 kg with the same cc would have an EQ of 4.14. The extra weight unequivocally distorts the EQ formula.
On the other hand, the female human brain is certainly smaller than that of the male. The size of the male human brain begins to decrease from 40 to 90 years of age or so, but the female human brain remains stable throughout its life once it reaches its maximum size. The controlling factors (genetic, hormonal, environmental, etc.) operating in women are currently unknown. Allen et al. (2002) found in a study of 46 adult Caucasians that the average cc of men was 1,273.6 cm3 and that of women was 1,131.1 cm3. Likewise, Ivanovic found in a study conducted in Chile with 96 students who were 18 years old that the average cc of men was 1,470 cm3 after appropriate adjustments, while the capacity of women was on average 1,404 cm3 (Ivanovic et al., 2004b). Studies using MRI have also observed these differences (Gur et al., 1999). In summary, the male human brain is bigger than a woman’s, and consequently the EQ of a man would also be greater. The rate of decline of the male human brain is currently unknown (a large-sample study, n = 1261, reported a difference of 12% from the ages of 25 to 80; Ho et al., 1980). On the other hand, it is also noteworthy that a woman’s body fat percentage is greater than that of a man. Fat distorts the formula again. A way to avoid this distortion is to consider the lean body mass. While a man’s body fat percentage ranges between 18 and 25%, a woman’s ranges between 25 and 31%. The deviation of the regression brain-to-lean-body-mass weight ratio allows for balancing the EQ of men and women. Thus, a man with a brain size of 1,273.6 cm3 and a lean body mass of 67.58 kg (86.09 kg × 0.785) would have an EQ of 6.40, while a woman with a cc of 1,131.1 cm3 and a fat-free mass of 53.20 kg (73.89 kg × 0.72) would have an EQ of 6.66.
In addition, the cc of the great physicist Albert Einstein was 1,230 cm3, considerably less than the average size for an adult (Anderson and Harvey, 1996). The Einstein ratio was 1.64 (1.23/75) and the EQ was 5.76, lower than those for the average adult male. Anderson and Harvey point out that Einstein’s cortex was thinner than normal, but the density of neurons was larger. Thus, more neurons were located in a smaller space.
Besides, Simmons (1942) presented results showing two skulls with the same external measurement but with different cranial capacities. He also presented the opposite results: two skulls with different external measurements with identical cranial capacities.
In summary, the encephalization quotient formula – while allowing comparisons between the level of intelligence of animals, especially mammals – is not the most appropriate for comparison among humans since it does not consider factors that distort the formula, as presented above, and others, such as density of neurons, cortical thickness, number of nc, brain folding, and the evolution of cerebral cortex, that are very important and may correlate better with human intelligence.
Intelligence and Environment
Environmental factors, including geographic area (iodine deficiency, lead exposure, climate, logographic writing systems), nutrition (insufficient iron, insufficient meat), socioeconomic status (poverty), physical and psychological disorder (violence, extreme aggression, societal disruption), education (lack of motivation, lack of confidence that learning certain skills will bring about a change in one’s life), culture, insufficient intellectual stimulation (children living in orphanages), and the combination of any of the above mentioned factors can significantly affect cognitive development and functioning, and be the principal reason for the difference of IQ among ethnic groups. In some cases, the effects may be irreversible and in others they may be only temporary. Eppig et al. (2010) argue that from an energetics standpoint, a developing human will have difficulty building a brain and fighting off infectious diseases at the same time, as both are very metabolically costly tasks.
An interesting study on early intellectual stimulation, which demonstrates the dramatic effect of the environment on intelligence when individuals belong to low socioeconomic levels, was led by Harold Skeels on 25 children who lived in an orphanage in the United States (Skeels et al., 1938). The orphanage was crowded and understaffed, so 13 little girls, whose average age was 19 months, were transferred to the Glenwood State School for retarded adult woman. The average IQ of these girls was 64, while the average IQ of the children who remained in the orphanage was 87. After 18 months, the girls were transferred to a special school that provided the finest care, love, and attention from their teachers. They were tested again and the average IQ jumped to 93 points. In just 18 months, the girls’ IQ had increased 29 points. Of the 13 girls, 11 were given up for adoption. Two years later, these 11 girls were evaluated again – this time their IQ increased to an average of 101 points. Meanwhile, the children who remained in the orphanage were tested again and their average IQ was 66 points (an average decrease of 21 points). The fundamental difference between these two groups was the quality of life, the experience. While one group was properly stimulated and motivated, the other was treated as if its members were mentally retarded.
Another study conducted in France revealed that a group of children who were adopted when they were between 4 and 6 years of age had an average IQ of 77 – very close to mental retardation. Nine years later, these same children were retested. Contrary to popular belief that IQ is stable, their IQ increased. Those children who grew up in working class families or on the farm obtained an IQ of 85.5, children who were placed in middle class families had an IQ of 92, and those in more affluent families climbed 20 points to reach an IQ of 98 (Kirp, 2006). Again, the main difference between these three groups was the experience, the quality of life.
These examples show that genetics and environment cannot be evaluated as two separated spheres. Turkheimer et al. (2003) points out that if a person lives in a chaotic environment, his or her genetic potential may not be reached. On the other hand, properly stimulated and motivated children (when a new cognitive or motor skill is learned) may be able to change the brain structure and its functional organization and surpass the genetic potential. Research shows that the structure of the adult human brain changes when a new cognitive or motor skill, including vocabulary, is learned (Draganski et al., 2004; Driemeyer et al., 2008). Particularly, an increase of gray matter is observed, what is known as neuroplasticity or cortical re-mapping.
Conclusion
The preponderance of evidence shows that absolute brain size, relative brain size, or the different regions of the brain, such as cerebral cortex, cortical thickness, frontal and parietal regions, or cerebellum, are all positively correlated with intelligence. Research also clearly notes that experience plays an indisputable role on the intellect of individuals.
The fundamental study of key scientific findings seems to show that genotypes are responsible for defining the theoretical limits of intelligence, but experience (environmental influence) is largely responsible for determining whether those limits will be reached or exceeded. The brain changes with practice. Everything indicates that experience makes the great difference, and therefore, we contend that the gene-environment interplay is what defines the IQ of an individual.
The relationship between brain size (or brain compartment size) and intelligence is controversial. It is clear, as Detterman (2006) points out, without a forum for the resolution of controversy, controversy will not be resolved and science will not advance. There are many positive correlations between brain size and intelligence, but we all know that correlation does not demonstrate causation. How are brain structure and genes mapped on behavior and intelligence? Many questions are yet to be answered, and numerous issues obviously require much further research.
Conflict of Interest Statement
The author declares that the research was conducted in the absence of any commercial or financial relationships that could be construed as a potential conflict of interest.
Acknowledgments
This work was founded by Asociaciόn Mexicana de Cultura A. C.
References
Allen, J., Damasio, H., and Grabowski, T. (2002). Normal neuroanatomical variation in the human brain: an MRI-volumetric study. Am. J. Phys. Anthropol. 118, 341–358.
Anderson, B., and Harvey, T. (1996). Alterations in cortical thickness and neural density in the frontal cortex of Albert Einstein. Neurosci. Lett. 210, 161–164.
Andreasen, N., Flaum, M., Swayze, V., O’Leary, D., Alliger, A., Cohen, G., Ehrhardt, J., and Yuh, W. (1993). Intelligence and brain structure in normal individuals. Am. J. Psychiatry 150, 130–134.
Barton, R. (2006). Olfactory evolution and behavioral ecology in primates. Am. J. Primatol. 68, 545–558.
Beals, K., Smith, C., and Dodd, S. (1984). Brain size, cranial morphology, climate, and time machines. Curr. Anthropol. 25, 301–330.
Bigler, E., Johnason, S., Jackson, C., and Blatter, D. (1995). Aging, brain size, and IQ. Intelligence 21, 109–119.
Bouchard, T. (2004). Genetic influence on human psychological traits. Curr. Dir. Psychol. Sci. 13, 148–151.
Bracke-Tolkmitt, R., Linden, A., Canavan, A., Rockstroh, B., Scholz, E., Wessel, K., and Diener, H. (1989). The cerebellum contributes to mental skills. Behav. Neurosci. 103, 442–446.
Brand, C. (1996). The G Factor: General Intelligence and Its Implications. Hoboken, NJ: John Wiley and Sons Inc.
Broca, P. (1861). Sur le volume et la forme du cerveau suivant les individus et suivant les races. Bull. Soc. d’Anthropol. Paris 2, 139–207, 301–321, 441–446.
Ceci, S., and Williams, W. (2009). Darwin 200: should scientists study race and IQ? YES: the scientific truth must be pursued. Nature 457, 788–789.
Colom, R., Jung, R., and Haier, R. (2006). Distributed brain sities for the g-factorof intelligence. Neuroimage 31, 1359–1365.
Coon, C. (1955). Some problems of human variability and natural selection in climate and culture. Am. Nat. 89, 257–279.
Dickens, W., and Flynn, J. (2006). Black Americans reduce the racial IQ gap: evidence from standardization samples. Psychol. Sci. 16, 913–920.
Draganski, B., Gaser, C., Busch, V., Schuierer, G., Bogdahn, U., and May, A. (2004). Neuroplasticity: changes in grey matter induced by training. Nature 427, 311–312.
Driemeyer, J., Boyke, J., Gaser, C., and May, A. (2008). Changes in gray matter induced by learning-revisited. PLos ONE 3, e2669. doi: 10.1371/journal.pone.0002669
Egan, V., Chiswick, A., Santosh, C., Naidu, K., Rimmington, J., and Best, J. (1994). Size isn’t everything: a study of brain volume, intelligence and auditory evoked potentials. Pers. Individ. Dif. 17, 357–367.
Eppig, C., Fincher, C., and Thornhill, R. (2010). Parasite prevalence and the worldwide distribution of cognitive ability. Proc. Boil. Sci. 277, 3801–3808.
Flynn, J. (2007). What is Intelligence?: Beyond the Flynn Effect. Cambridge: Cambridge University Press.
Foley, R., Lee, P., Widdowson, E., Knight, C., and Jonxis, J. (1991). Ecology and energetics of encephalization in hominid evolution. Philos. Trans. R. Soc. Lond. B Biol. Sci. 334, 223–232.
Galton, F. (1889). On head growth in students at the University of Cambridge. J. Anthropol. Inst. 18, 155–156.
Gaser, C., and Schlaug, G. (2003). Brain structures differ between musicians and non-musicians. J. Neurosci. 23, 9240–9245.
Gibson, K. (2002). Evolution of human intelligence: the roles of brain size and mental construction. Brain Behav. Evol. 59, 10–20.
Gur, R. C., Turetsky, B., Matsui, M., Yan, M., Bilker, W., Hughett, P., and Gur, R. E. (1999). Sex differences in brain gray and white matter in healthy young adults: correlations with cognitive performance. J. Neurosci. 19, 4065–4072.
Haier, R., Jung, R., Yeo, R., Head, K., and Alkire, M. (2004). Structural brain variations and general intelligence. Neuroimage 23, 425–433.
Harvey, I., Persaud, R., Ron, M., Baker, G., and Murray, R. (1994). Volumetric MRI measurements in bipolar compared with schizophrenics and healthy controls. Psychol. Med. 24, 689–699.
Haug, H. (1987). Brain sizes, surfaces, and neuronal sizes of the cortex cerebri: a stereological investigation of man and his variability and a comparison with some mammals. Am. J. Anat. 180, 126–142.
Healy, S., and Rowe, C. (2007). A critique of comparative studies of brain size. Proc. R. Soc. B 274, 453–464.
Herrnstein, R., and Murray, C. (1996). The Bell Curve: Intelligence and Class Structure in American Life. New York, NY: Free Press.
Ho, K., Roessmann, U., Straumfjord, J., and Monroe, G. (1980). Analysis of brain weight. II. Adult brain weight in relation to body height, weight, and surface area. Arch. Pathol. Lab. Med. 104, 640–645.
Hogan, M., Staff, R., Bunting, B., Murray, A., Ahearn, T., Deary, I., and Whalley, L. (2001). Cerebellar brain volume accounts for variance in cognitive performance in older adults. Cortex 47 441–450.
Hunt, E., and Carlson, J. (2007). Considerations relating to the study of group differences in intelligence. Perspect. Psychol. Sci. 2, 194–213.
Ivanovic, D., Leiva, B., Pérez, H., Olivares, M., Díaz, N., Urrutia, M., Almagia, A., Toro, T., Miller, P., Bosch, E., and Larrain, C. (2004a). Head size and intelligence, learning, nutritional status and brain development. Head, IQ, learning, nutrition and brain. Neuropsychologia 42, 1118–1131.
Ivanovic, D., Leiva, B., Castro, C., Olivares, M., Jansana, J., Castro, V., Almagia, A., Toro, T., Urrutia, M., Miller, P., Bosch, E., Larrain, C., and Pérez, H. (2004b). Brain development parameters and intelligence in chilean high school graduates. Intelligence 32, 461–479.
Iwaniuk, A., and Nelson, J. (2001). A comparative analysis of relative brain size in waterfowl (Anseriformes). Brain Behav. Evol. 57, 87–97.
Jackson, J. (2004). Racially stuffed shirts and other Enemies of Mankind’: Horace Mann Bond’s Parody of Segregationist Psychology in the 1950s,” in A Measure of Difference: Historical Perspectives on Psychology, Race, and Racism, ed. S. Andrew and Winston (Washington, DC: American Psychological Association), 261–283.
Jaeggi, A., Buschkuehl, M., Jonides, J., and Perrig, W. (2008). Improving fluid intelligence with training on working memory. Proc. Natl. Acad. Sci. U.S.A. 105, 6829–6833.
Jensen, A. (1994). Psychometric g related to differences in head size. Pers. Individ. Dif. 17, 597–606.
Jerison, H. (1979). “The evolution of diversity in brain size,” in Development and Evolution in Brain Size, eds M. Han, C. Jensen, and B. Dudek (New York: Academic Press), 29–57.
Jerison, H. (1985). Animal intelligence as encephalization. Philos. Trans. R. Soc. Lond. B Biol. Sci. 308, 21–34.
Jerison, H. (2000). “The evolution of intelligence,” in Handbook of Intelligence, ed. R. Sternberg (Cambridge: Cambridge University Press), 216–244.
Jung, R., and Haier, R. (2007). The parieto-frontal integration theory (P-FIT) of intelligence: converging neuroimaging evidence. Behav. Brain Sci. 30, 135–154.
Jurgens, H., Aune, I., and Pieper, U. (1990). International Data on Anthropometry. Geneva: International Labour Office.
Kandel, E., Schwartz, J., and Jessell, T. (2000). Principles of Neural Science, 4th Edn. New York: McGraw-Hill Medical.
Kirp, D. (2006). After the Bell Curve. New York Times Magazine. Available at: http://www.nytimes.com/2006/07/23/magazine/23wwln_idealab.html
Krugger, F., Brückner, M., Arendt, Th., Wiggins, C., and von Cramon, D. (2003). Analyzing the neocortical fine-structure. Med. Image Anal. 7, 251–264.
Langer, N., Pedroni, A., Gianotti, L., Hänggi, J., Knoch, D., and Jäncke, L. (2011). Functional brain network efficiency predicts intelligence. Hum. Brain Mapp.. doi: 10.1002/hbm.21297. [Epub ahead of print].
MacArthur, R. (1968). Some differential abilities of Northern Canadian native youth. Int. J. Psychol. 3, 43–51.
Maguire, E., Gadian, D., Johnsrude, I., Good, C., Ashburner, J., Frackowiak, R., and Frith, C. (2000). Navigation-related structural change in the hippocampi of taxi drivers. Proc. Natl. Acad. Sci. U.S.A. 97, 4398–4403.
Marino, L., Sol, D., Toren, K., and Lefebvre, L. (2006). Does diving limit brain size in cetaceans? Mar. Mamm. Sci. 22, 413–425.
Martin, R. (1981). Relative brain size and basal metabolic rate in terrestrial vertebrates. Nature 293, 57–60.
May, A., Hajak, G., Gänß bauer, S., Steffens, T., Langguth, B., Kleinjung, T., and Eichhammer, P. (2006). Structural brain alterations following 5 days of intervention: dynamic aspects of neuroplasticity. Cereb. Cortex 17, 205–210.
Morton, S. (1839). Crania Americana. Comparative View of the Skulls of Various Aboriginal Nations of North and South America: To which is Prefixed an Essay on the Varieties of the Human Species. Filadelfia: J. Dobson.
Murray, C. (2006). Changes over time in the black–white difference on mental tests: evidence from the children of the 1979 cohort of the National Longitudinal Survey of Youth. Intelligence 34, 527–540.
Neubauer, A., and Fink, A. (2009). Intelligence and neural efficiency. Neurosci. Biobehav. Rev. 33, 1004–1023.
Nisbett, R. (2009). Intelligence and How to Get It: Why Schools and Culture Count. New York, NY: W. W. Norton and Co.
Pakkenberg, B., and Gundersen, H. (1997). Neocortical neuron number in humans: effects of sex and age. J. Comp. Neurol. 384, 312–320.
Pakkenberg, B., and Voigt, J. (1964). Brain weight of the Danes: forensic material. Acta Anat. (Basel) 56, 297–307.
Peters, M., Jäncke, L., Staiger, J., Schlaug, G., Huang, Y., and Steinmetz, H. (1998). Unsolved problems in comparing brain sizes in Homo sapiens. Brain Cogn. 37, 254–285.
Raz, N., Gunning, F., Head, D., Dupuis, J., McQuain, J., Briggs, S., Loken, W., Thornton, A., and Acker, J. (1997). Selective aging of the human cerebral cortex observed in vivo: differential vulnerability of the prefrontal gray matter. Cereb. Cortex 7, 268–282.
Reiss, A., Abrams, M., Singer, H., Ross, J., and Denckla, M. (1996). Brain development, gender and IQ in children: a volumetric imaging study. Brain 119, 1763–1774.
Rindermann, H. (2007). The g-factor of international cognitive ability comparisons: the homogeneity of results in PISA, TIMSS, PIRLS and IQ-tests across nations. Eur. J. Pers. 21, 667–706.
Rogers, L. (2004). “Increasing the brain’s capacity: neocortex, new neurons, and hemispheric specialization,” in Comparative Vertevrate Cognition. Are Primates Superior to Non-Primates?, eds L. Rogers and G. Kapla (New York: Kluwer Academic/Plenum Publishers), 289–299.
Rose, S. (2009). Darwin 200: should scientists study race, and IQ? NO: science, and society do not benefit. Nature 457, 786–788.
Roth, P., Bevier, C., Bobko, P., Switzer, F. III, and Tyler, P. (2001). Ethnic group differences in cognitive ability in employment and educational settings: a meta-analysis. Person. Psychol. 54, 297–330.
Rushton, J. (2000). Race, Evolution, and Behavior: A Life History Perspective, 3rd Edn. Port Huron, MI: The Charles Darwin Research Institute.
Rushton, J., and Ankney, C. (2009). Whole brain size and general mental ability: a review. Int. J. Neurosci. 119, 692–732.
Russell, D. (1983). Exponential evolution: implications for intelligence extraterrestrial life. Adv. Space Res. 3, 95–103.
Rutter, M. (2002). Nature, nurture, and development: from evangelism through science toward policy and practices. Child Dev. 73, 1–21.
Savage, M., Gillooly, J., Woodruff, W., West, G., Allen, A., Enquist, B., and Brown, J. (2004). The predominance of quarter-power scaling in biology. Funct. Ecol. 18, 257–282.
Schoenemann, P., Budinger, T., Sarich, V., and Wang, W. (2000). Brain size does not predict general cognitive ability within families. Proc. Natl. Acad. Sci. 97, 4932–4937.
Simmons, K. (1942). Capacities by both plastic and water techniques with linear measurements of the reserve collection; white and negro. Hum. Biol. 14, 473–498.
Skeels, H., Updegraff, R., Wellman, B., and Williams, H. (1938). A Study of Environmental Stimulation: An Orphanage Preschool Project, Vol. 15. (Iowa: University of Iowa Studies in Child Welfare), 1–191.
Skullerud, K. (1985). Variations in the size of the human brain. Influence of age, sex, body length, body mass index, alcoholism, Alzheimer changes, and cerebral atherosclerosis. Acta Neurol. Scand. Suppl. 102, 1–94.
Sternberg, R., Grigorenko, E., and Kidd, K. (2005). Intelligence, race and genetics. Am. Psychol. 60, 46–59.
Swanson, L. (1995). Mapping the human brain: past, present and future. Trends Neurosci. 18, 471–474.
Templer, D., and Arikawa, H. (2006). Temperature, skin color, per capita income, and IQ: an international perspective. Intelligence 34, 121–139.
Terman, L. (1926). Mental and Physical Traits of a Thousand Gifted Children. Genetic Studies of Genius, Vol. 1. Stanford, CA: Stanford University Press.
Turkheimer, E., Haley, A., Waldron, M., D’Onofrio, B., and Gottesman, I. (2003). Socioeconomic status modifies heritability of IQ in young children. Psychol. Sci. 14, 623–628.
Vestergaard-Poulsen, P., van Beek, M., Skewes, J., Bjarkam, C., Stubberup, M., Bertelsen, J., and Roepstorff, A. (2009). Long-term meditation is associated with increased gray matter density in the brain stem. Neuroreport 20, 170–174.
Wickett, J., Vernon, P., and Lee, D. (1994). In vivo brain size, head perimeter, and intelligence in a sample of healthy adult females. Pers. Indiv. Differ. 16, 831–838.
Wickett, J., Vernon, P., and Lee, D. (2000). Relationships between factors of intelligence and brain volume. Pers. Indiv. Differ. 29, 1095–1122.
Keywords: intelligence, brain size, cognitive ability, intelligence quotient, encephalization quotient
Citation: Cairό O (2011) External measures of cognition. Front. Hum. Neurosci. 5:108. doi: 10.3389/fnhum.2011.00108
Received: 18 May 2011;
Accepted: 12 September 2011;
Published online: 04 October 2011.
Edited by:
Hans-Jochen Heinze, University of Magdeburg, GermanyReviewed by:
Lutz Jäncke, University of Zurich, SwitzerlandShozo Tobimatsu, Kyushu University, Japan
Copyright: © 2011 Cairό. This is an open-access article subject to a non-exclusive license between the authors and Frontiers Media SA, which permits use, distribution and reproduction in other forums, provided the original authors and source are credited and other Frontiers conditions are complied with.
*Correspondence: Osvaldo Cairό, Department of Computer Science, Instituto Tecnolόgico Autόnomo de México, Río Hondo 1, 01080 Mexico DF, Mexico. e-mail: cairo@itam.mx