Micro and macro pattern analyses of fMRI data support both early and late interaction of numerical and spatial information
- 1 Section Neuropsychology, Neurological Clinic, University Hospital Aachen, Aachen, Germany
- 2 Interdisciplinary Center for Clinical Research Aachen, University Hospital Aachen, Aachen, Germany
- 3 Department of Educational Psychology, Institute for Psychology, Johann Wolfgang Goethe University, Frankfurt, Germany
- 4 Center for Individual Development and Adaptive Education of Children at Risk, Frankfurt, Germany
Numbers and space are two semantic primitives that interact with each other. Both recruit brain regions along the dorsal pathway, notably parietal cortex. This makes parietal cortex a candidate for the origin of numerical–spatial interaction. The underlying cognitive architecture of the interaction is still under scrutiny. Two classes of explanations can be distinguished. The early interaction approach assumes that numerical and spatial information are integrated into a single representation at a semantic level. A second approach postulates independent semantic representations. Only at the stage of response selection and preparation these two streams interact. In this study we used a numerical landmark task to identify the locus of the interaction between numbers and space. While lying in an MR scanner participants decided on the smaller of two numerical intervals in a visually presented number triplet. The spatial position of the middle number was varied; hence spatial intervals were congruent or incongruent with the numerical intervals. Responses in incongruent trials were slower and less accurate than in congruent trials. By combining across-vertex correlations (micro pattern) with a cluster analysis (macro pattern) we identified large-scale networks that were devoted to number processing, eye movements, and sensory–motor functions. Using support vector classification in different regions of interest along the intraparietal sulcus, the frontal eye fields, and supplementary motor area we were able to distinguish between congruent and incongruent trials in each of the networks. We suggest that the identified networks participate in the integration of numerical and spatial information and that the exclusive assumption of either an early or a late interaction between numerical and spatial information does not do justice to the complex interaction between both dimensions.
Introduction
Large parts of the human brain are dedicated to the analysis of visual information and the guidance of motor behavior. The extraction of spatial and metric characteristics of the objects in a visual scene is crucial for successful motor actions. Depth cues and retinal size information, for example, are integrated to inform about the actual physical size as well as the position of a given target object, and allow us to successfully grasp it. Beyond the spatial information of a visual scene, recent studies suggest that number is another primary feature of vision (Burr and Ross, 2008; Ross and Burr, 2010). A number of studies suggest that numerical and spatial representations are not independent of each other but do interact in various ways (Hubbard et al., 2005). Few neuroimaging studies directly investigated this consensual notion, focusing mostly on the overlap between physical and numerical size (Pinel et al., 2004; Hubbard et al., 2005; Kaufmann et al., 2005, 2006, 2008; Cohen Kadosh et al., 2007). The current study aimed at investigating the interaction between numbers and space and tried to identify the locus of the interaction between both domains. Locus here refers to both the stage in the stream of information processing (sensory, central, response) as well as the brain region where both dimensions exhibit representational overlap.
The Spatial–Numerical Association of Response Codes (SNARC) effect is often taken as an indicator for an association of numerical magnitude with external space (Dehaene et al., 1993): left side responses are faster for small numbers while right side responses are faster for larger numbers. This has been interpreted by many authors as evidence for a left-to-right oriented “mental number line” with smaller numbers placed to the left of larger numbers (at least in left-to-right reading cultures; Shaki and Fischer, 2008; Shaki et al., 2009). While some authors argued that the observed link between numbers and space relies on the congruence of the response codes with an intermediate categorical polarity representation (Proctor and Cho, 2006; Santens and Gevers, 2008), it has been demonstrated that this link prevails in paradigms where response and stimulus representation are orthogonal to each other (Nicholls et al., 2008) and in paradigms that did not use spatially encoded manual responses (Stoianov et al., 2008). The concept of the mental number line also proved useful in explaining the impact of numerical information on spatial attention. When asked to indicate the appearance of a stimulus that appeared to the left or right of a centrally presented number, participants responded faster to right-sided stimuli that followed a large number as compared to right-sided stimuli that followed small numbers (Fischer et al., 2003). An equivalent advantage for left-sided stimuli following small numbers was observed. Fischer et al. (2003) attributed this finding to the automatic activation of a number’s position on the spatially oriented mental number line which in turn caused a shift of the focus of attention on the mental representation accompanied by a shift of attention in the visual field. Together this points to a mental representation of numbers that entails spatial characteristics and affects perception and behavior. Song and Nakayama (2008) measured the trajectories of pointing movements to a lateralized target in response to a numerical comparison task (smaller or larger than five) with a centrally presented number. They observed that with decreasing numerical distance the initial trajectory approached the central location and was corrected in direction of the target during later periods of the movement. It seems that the spatial position of the number on a mental representation (i.e., the mental number line) has a significant and dynamic impact on the movement trajectory. This demonstrates the automatic (i.e., non-voluntary) influence of mental representations on information processing up to the execution of motor responses. The idea that numerical and spatial representations overlap and interact is supported by the finding that numerical magnitude primes various aspects of motor responses such as grip aperture (Andres et al., 2004; Lindemann et al., 2007) and grip force (Vierck and Kiesel, 2010). In general, these results imply that both physical size of an object and numerical magnitude are automatically processed and influence each other.
The presence of two basic cognitive effects, i.e., the distance and the size effect in both dimensions (number and space) supports the idea of overlapping representations. The distance effect describes the fact that – either in spatial or in numerical terms – the closer two objects are in size the more difficult it is to indicate the larger one. The size effect describes the phenomenon that a constant level of accuracy in size comparison tasks is achieved only when the distance between both objects increases proportionally with increasing absolute size. The universality of these effects, which can also be found in the temporal domain, has lead to the assumption of common cortical metrics for space, numbers, and time (Walsh, 2003).
At the neuro-functional level, spatial overlap between systems that are activated when either numerical or spatial information is processed has been interpreted as evidence for overlapping mental representations. Using positron emission tomography, Fias et al. (2003) observed overlapping activity along the intraparietal sulcus (IPS) for symbolic and non-symbolic numbers as well as for line lengths and angles. In a similar vein, Cohen Kadosh et al. (2007) reported functional brain activations using functional magnetic resonance imaging (fMRI) in posterior parietal cortex when participants compared two digits in terms of numerical size, physical size, or luminance. One might argue, however, that the mere co-activation of a given region by different dimensions does not necessarily imply the recourse of both dimensions on identical neural circuits. The coarse spatial resolution of fMRI does not allow for identification of overlapping but separate neural circuits in a single voxel. That is, any observed co-activation can equally well be explained by either identical neural circuits that are activated by several contrasts or by independent circuits that occur in the same voxel. More fine-grained multivariate analysis approaches might prove useful in this context.
The size-congruity effect (SCE) has often been used to explore the interaction between numbers and space. When asked to decide on the physically larger of two visually presented numbers, participants’ responses are significantly slower for incongruent stimulus pairs such as 2 and 9 as compared to congruent stimulus pairs like 2 and 9. While nine is the numerically larger number in both cases, the comparison of the physical sizes points to the two in the first and to the nine in the second pair, giving rise to a response conflict for the former stimulus pair (Foltz et al., 1984). In this type of paradigm one distinguishes between two stimulus dimensions (e.g., numerical and physical size) which interact with each other. An interesting question concerns the locus of this interaction. Broadly speaking, two scenarios have been proposed. The early interaction approach assumes that numerical and physical size are integrated into a single representation at a semantic level (Schwarz and Heinze, 1998). The late interaction approach assumes that the two dimensions are processed in parallel and an interaction (or integration) occurs only at the response level (e.g., Ridderinkhof, 2002).
Evidence for a joint neural circuit processing both numerical and other extensive dimensions comes from fMRI studies that show that the SCE itself modulates activity in the IPS (Pinel et al., 2004; Kaufmann et al., 2005). Again, the authors mainly report overlapping activity in support of this notion. In an event-related potential study (ERP), Schwarz and Heinze (1998) found that congruity between numerical and spatial size of the presented digits affected the latency of the P300 component over centro-parietal electrodes. Since the amplitude of the P300 component is thought to vary with numerical distance in the context of numerical cognition experiments (Grune et al., 1993), this result supports the idea of an early interaction between numerical and size information. Conversely, Schwarz and Heinze (1998) did not observe any response preparation due to the irrelevant dimension in the lateralized readiness potentials, again speaking against the late interaction hypothesis. It should be noted that the absence of response preparation for a response activated by the irrelevant dimension in the ERPs does not necessarily mean that earlier response stages remained unaffected by the congruence between numerical and physical size. The particular orientation of a putative dipole in supplementary motor areas (SMAs), for example, might prevent any observable amplitude difference on the scalp.
On the other hand, a number of studies support the idea of late interaction of two conflicting sources of information from a single stimulus. By adopting thorough analyzes of the distribution of reaction times and error rates, Ridderinkhof (2002) reported results that strongly implied a late interaction between relevant (e.g., stimulus color) and irrelevant (e.g., stimulus location) stimulus parameters. In particular, this approach postulates that the conflicting information is integrated and the conflict resolved only at a very late, response-related stage of information processing. Additionally, Ridderinkhof (2002) proposed an active suppression mechanism that selectively operates on the irrelevant stimulus dimension and helps to suppress conflicting (i.e., erroneous) response tendencies, a view that is supported by results from Notebaert and Soetens (2006). They observed a reduced impact of the irrelevant stimulus dimension in trials that followed the response in incongruent trials with a very short temporal interval only (50 ms). This is thought to reflect the consequences of the lingering inhibition of the irrelevant dimension. Recently, Forstmann et al. (2008) used MRI to demonstrate that structural and functional brain parameters characterizing the right inferior frontal cortex were systematically related to the individual model parameters that quantified the inhibition of irrelevant information in a Simon task. In a combined fMRI and ERP study using a size-congruity paradigm, Cohen Kadosh et al. (2007) found an interaction of numerical and physical size in parietal regions as well as in motor regions, implying late interaction at the response stage. This effect was modulated by cognitive load, however, with the late interaction hypothesis being supported only with low cognitive load. Knops et al. (submitted) employed a paradigm in which participants had to decide on the larger of two intervals in a number triplet. The triplet was presented visually and the horizontal position of the middle number was varied. Hence the physical intervals between the middle number and the outer numbers could be congruent or incongruent with the corresponding numerical intervals (see Figure 1). When asked for the numerical intervals, incongruent trials were responded to slower and more error prone, implying that the irrelevant physical information had an impact on the numerical decision. No such influence was observed when participants had to decide on the physical intervals. Participants were significantly faster in deciding on the physical intervals than in deciding on the numerical intervals, which might explain the observed asymmetry. In sum, the results from this experiment suggest a dual route mechanism with late interaction between numerical and spatial information.
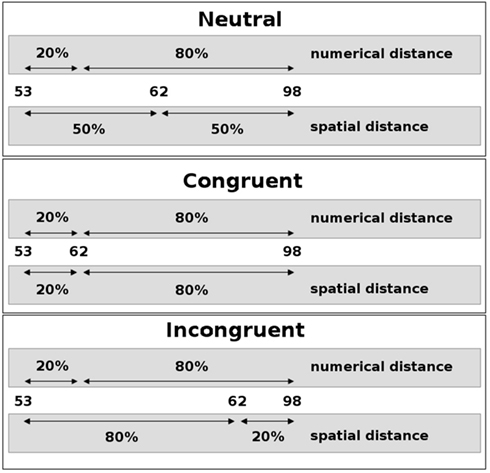
Figure 1. Schematic depiction of the numerical landmark paradigm. The spatial position of the middle number of a number triplet (here: 62) was varied such that the spatial intervals to the outer numbers (here: 53 and 98) could be neutral (top), congruent (middle), or incongruent (bottom) with the respective numerical intervals. Percentages relate the respective intervals to the size of the interval between the outer numbers. Participants were asked to decide which side the smaller numerical interval is on.
Beyond the opposing views of an early or late interaction between different (and sometimes conflicting) stimulus dimensions, a recent review article (Cohen Kadosh et al., 2008) concluded that both shared and distinct magnitude mechanisms may co-exist. On a neurobiological level this view received support from recent single-unit recordings in monkeys. Tudusciuc and Nieder(2007, 2009) reported neurons in parietal and frontal cortex that coded for numerosity, for line length or for both types of information at the same time.
In the current fMRI study we want to shed light on the functional architecture subserving the interaction between numbers and space. To this end we propose a new multivariate analysis approach that might prove useful in the identification and analysis of functional networks. We used a so-called numerical landmark task, revealing robust behavioral interactions between the processing of numerical and spatial distances (Lonnemann et al., 2008). No study so far has shown the neural correlates of the putative association between numerical distances and spatial distances. Since parietal cortex seems to play a central role in the processing of numbers and space, we employed a scanning protocol with a relatively small voxel size (2 mm × 2 mm × 2 mm) that allows for a more fine-grained functional parcellation of different areas in parietal cortex as compared to previous studies. In combination with cortex-based alignment and the analysis of unsmoothed data, such a protocol offers the opportunity to delineate in more detail sub-divisions of parietal cortex and their particular role in the context of numerical–spatial interactions. The chosen voxel size also allowed for the adoption of multivariate analysis approaches, offering a more comprehensive data analysis than the standard voxel-wise univariate general linear model (GLM) approach. Previous fMRI studies mainly reported overlapping activations from GLM analyses in parietal cortex and interpreted this as evidence for shared representations. Overlapping activations, however, can have multiple origins and do not necessarily imply shared neural circuits. A multivariate analysis of the spatial pattern of activations appears to be better suited to detect shared functional circuits. Temporal resolution of fMRI is poor and by itself does not allow for an analysis of the temporal dynamics of the brain. By combining across-voxel correlations and cluster analysis we may be able to identify large-scale functional networks in the brain that can be associated with either stimulus integration or response-related processes. That is, by thoroughly analyzing brain activation in response-related and stimulus-related structures we aimed at investigating the locus of the numerical–spatial interaction.
Materials and Methods
Participants
After having given their written informed consent eighteen (nine female) right-handed participants [mean age 26.1 (19–32) years] participated in this study, which was approved by the local Ethics Committee of the Medical Faculty, RWTH Aachen University. Three participants (one female, two male) were excluded from all subsequent analyses due to head movement artifacts. All participants had normal or corrected to normal vision and no neurological or psychiatric history.
Experimental Design
Cerebral activations were studied for three different tasks, two localizer tasks (subtraction, saccades), and a numerical landmark test. Participants were introduced to all of the tasks before fMRI scanning. The numerical landmark test was conducted in an event-related design and divided in two identical blocks of 120 trials each. The two localizer tasks were administered in a block design. Each of the localizer tasks was compared to a control task matched for stimulus characteristics. During an fMRI scanning sequence, eight blocks (12 trials each) were presented with an alternation of primary task and control task blocks (four blocks each). Breaks of 20 s separated the different blocks. Each participant started with the numerical landmark test, while the sequence of the remaining tasks was counterbalanced across participants. Stimuli were presented via a head-mounted video display designed to meet MR requirements. The whole experimental procedure lasted approximately 90 min and was controlled by Presentation ® software (Neurobehavioral Systems, Inc.).
Numerical landmark task
In the numerical landmark task participants had to decide which one of the two numerical distances in a number triplet was numerically smaller. The stimulus set consisted of 16 two-digit number triplets spatially arranged in a horizontal fashion on the screen at two varying spatial intervals between the middle number and the outer two numerals (see Figure 1). The constituting numerals of a triplet were always arranged in numerically ascending order from left-to-right. Numerical and spatial distances were manipulated independently. As a result, numerical and spatial intervals could be congruent or incongruent. In neutral triplets, spatial intervals were identical. The stimulus set was identical to the one used in a previous study (Lonnemann et al., 2008) but presented twice. The participants had to indicate the side where the numerical distance was smaller by pressing a response button with the left index finger when it was smaller on the left side and by using the right index finger when it was smaller on the right side. Instruction stressed both speed and accuracy. Digits were presented in white color against an otherwise black background and had a visual angle of 0.7° in height and of 0.5° in width. The two blocks of 120 trials each were separated by a break of 1 min. Each block included 24 null-events, in which a black screen was presented. A trial started with the presentation of a fixation cross for 500 ms. After the fixation cross had vanished, the target appeared until the response, but only for a maximum duration of 3000 ms, followed by a black screen for a varying time interval [500, 1000, 1500, 2500, 3500, or 6000 ms (mean = 2500 ms)].
Subtraction task
In the subtraction task, stimuli were white Arabic digits from 2 to 9 with a visual angle of 0.7° in height and of 0.5° in width presented at fixation and against a black background. Each trial started with the presentation of a digit appearing for 150 ms, which was then replaced by a fixation cross. Participants were instructed to subtract the respective number from 11 and to name the result mentally within 3000 ms. In the control naming task, stimuli were uppercase letters between B and J, excluding I. Participants were asked to name each letter mentally.
Saccades task
In the saccades task participants were shown eight boxes (each with a visual angle of 1.2° in width and height) arranged in a circle at 6° eccentricity from a similar box positioned at the center of the screen. Each trial started with the presentation of a white square appearing within a randomly chosen box for 150 ms, which was replaced by a fixation cross centered in the box. The participants were asked to move their eyes toward this box and fixate it for 2000 ms until the next trial appeared. In the control fixation task, participants had to fixate the center position while white squares appeared in the peripheral positions following the same order as in the primary task.
Imaging Protocol
Functional images were acquired on a 3-T Philips Gyroscan NT with a SENSE head coil. Transversal multi-slice T2*-weighted images were obtained with a gradient echo planar imaging sequence (TE = 30 ms; TR = 2 s; 80 × 80 matrix; flip angle = 90°; 24 slices, 2 mm × 2 mm in-plane resolution; slice thickness 2 mm) covering most of the frontal, of the parietal, and of the occipital lobe. During the numerical landmark task 780 volumes were acquired, while in each of the other two tasks 250 volumes were recorded. Each part of a session started with five dummy scans to allow tissue to reach steady state magnetization. These scans were not recorded for data analysis. A high-resolution T1-weighted three-dimensional anatomical image was also acquired (TE = 4.59 ms; 256 × 256 matrix; voxel dimensions = 1 mm × 1 mm × 1 mm).
Data Analysis
Behavioral data
Analyses of variance (ANOVAs) and post hoc tests for further investigations were conducted separately for reaction time (henceforth RT) and error rate (henceforth ER). ER was arcsine-transformed (2arcsin√error rate). The Huynh–Feldt epsilon (ε) was computed to correct the degrees of freedom of the F-statistics in case of significant violation of the sphericity assumption. To minimize the risk of alpha error inflation due to multiple post hoc testing we applied the sequentially rejective Bonferroni method by Holm (1979) to all reported post hoc tests. We report only significant results. Only correct responses were used for calculating mean RT. Trials in which no response occurred were classified as errors. Responses below 200 ms were excluded from further analysis, as well as responses outside an interval of ±3 SDs around the individual mean. A total of 0.7% of the response was excluded.
Neuro-functional data
BrainVoyager QX 1.9 software (Brain Innovation, Maastricht, The Netherlands) was used to analyze neuroimaging data (Goebel et al., 2006). Preprocessing was done separately for each of the three parts of a session and included slice scan time correction (using cubic spline interpolation), temporal high-pass filtering, and three-dimensional-motion correction. Estimated translation and rotation parameters never exceeded 2 mm. Functional datasets were co-registered to the Talairach-transformed anatomical image. All individual brains were segmented at the gray/white matter boundary using a semiautomatic procedure based on intensity values (ITK-SNAP; Yushkevich et al., 2006). The cortical surfaces were reconstructed, inflated, and flattened with BrainVoyager QX 1.9 software. A high-resolution cortical alignment (CBA) method using curvature information reflecting the gyral/sulcal folding pattern was used to improve correspondence across brains beyond Talairach space matching. Using unsmoothed data, this kind of cortex-based analysis has been shown to reveal spatially more confined group clusters of activation (Goebel et al., 2006). Using CBA offers has major advantages over standard Talairach normalization. First, by respecting the anatomical folding pattern of the individual brain anatomy the spatial relations of any given pair of vertices on the resulting two-dimensional structure reflect their spatial relations as observed in the cortex. For example, two points on opposite walls of a given sulcus may unwarrantedly be interpreted as being spatially close to each other when using standard Talairach normalization since the gyral/sulcal folding pattern is not taken into account. Using CBA, however, the two points will not appear next to each other but the true distance between them – that roughly corresponds to twice the depth of the sulcus – will be respected. Second, Talairach normalization results in poor anatomical precision (Fischl et al., 1999). The large mismatch of spatial correspondence between important anatomical landmarks after Talairach transformation is usually compensated by applying spatial smoothing of functional data. However, spatial smoothing affects the spatial resolution of data which is of disadvantage when smaller voxels are used as is the case in the present study. The use of spatially unsmoothed data with high spatial resolution is recommended when classifiers are used. CBA can create a high amount of anatomical correspondence between individuals without spatial smoothing and is therefore ideally suited for the use of decoding methods such as multi-voxel pattern analysis (MVPA, see below). It should be noted that we used vertices rather than voxels as features for classification. Hence, MVPA will be used throughout the article as acronym for multi vertex pattern analysis but it refers to the same family of decoding techniques (e.g., support vector classification) as multi-voxel pattern analysis.
Activation data were submitted to a classical GLM approach and projected on the mean cortex-based aligned brain anatomy of the 15 participants. To visualize the functional network activated by the numerical landmark task we report the results of the conjunction between the contrasts congruent > baseline and incongruent > baseline. The calculation network was visualized by the contrast calculation > control. The saccades network was visualized by the contrast saccades > control. We applied a surface-based version of the cluster size exclusion method used for multiple comparisons correction as introduced by Hagler et al. (2006) to all random effects contrasts with voxel-wise p = 0.005. This method estimates the cluster size limit at a desired statistical threshold and validates it by means of Monte Carlo simulation (500 iterations).
The GLM approach is a powerful tool to analyze the differences between two conditions in terms of activation amplitude. It lacks, however, the capacity to integrate the numerous relations between vertices in a given region of interest (ROI) that form specific spatial or temporal patterns of activations which in turn characterize a cognitive task. Recent approaches to the analysis of multivariate brain imaging data emphasize that different tasks, conditions, and even stimuli give rise to distinct and recognizable patterns of activations even in situations when the GLM approach is not sensitive enough to reveal amplitude differences (Peelen et al., 2006; O’Toole et al., 2007). Especially with cognitively close conditions it is not plausible to assume large differences in the distribution of distinct networks of neurons which would cause differences in amplitude between two regions or huge differences in the BOLD responses to specific conditions. It is very likely that closely intermingled cortical circuits elicit very similar activations for two conditions when looking only at the amplitude of the BOLD response. By taking into account the specific spatial pattern of activity across a larger set of vertices in a ROI one might therefore increase the sensitivity to detect fine-grained differences between two conditions. We defined six ROIs in both hemispheres. The parietal cortex along the IPS was subdivided into four distinct, non-overlapping ROIs (see Figure 2B). Two ROIs cover horizontal aspects of parietal cortex [horizontal aspect of the IPS (HIPS), aHIPS], that is thought to play a major role in the representation of numerical magnitude (Hubbard et al., 2005). Two ROIs were chosen that are frequently linked to response selection, response preparation, and motor planning, i.e., SMA and the anterior aspect of the IPS, area AIP/BA 2. Finally, two ROIs were defined that cover (1) the parietal saccades system that appears to be play a role also in the attribution of spatial attention along the mental magnitude representation, the posterior superior parietal lobule (PSPL) of the IPS, as well as (2) the frontal saccades system, i.e., the frontal eye fields (FEF). In detail, the vertices for the different ROIs were chosen as follows. Active vertices from the calculation localizer in the HIPS were attributed to the ROI HIPS. Vertices that were active in the calculation localizer (calculation > control) and located anterior to those attributed to the HIPS ROI were defined as aHIPS. The number of vertices that were included in the latter two ROIs were taken as guideline for the size of the subsequent ROIs, when possible [mean = 165.9 vertices (SD = 7.0)]. Based on converging evidence from both human and monkey imaging studies (Culham et al., 2006) the area AIP/BA2 was defined as those vertices that were active in the neutral condition of the landmark task and covered the descending part of the IPS extending to the posterior bank of the postcentral sulcus. This region was chosen since it might correspond to an area in the monkey that was found to contain neurons that code for the number of movements (Sawamura et al., 2002). We chose vertices that were active in the neutral condition to protect us against the circularity fallacy as described by Kriegeskorte et al. (2009). The neutral condition is independent in the sense that those trials did not enter the decoding analyses (see below) but were used only for the selection of the vertices. Active vertices from the saccades localizer that were situated on the medial bank of the posterior, superior aspects of the IPS were used to define the PSPL, a putative human homolog of the lateral intraparietal cortex (LIP) region in the monkey (Sereno et al., 2001). For SMA we chose vertices in medial frontal cortex, in close vicinity to the precentral sulcus which were active in the neutral trials of the numerical landmark task. For the FEF we chose vertices that were active in the saccades localizer (saccades > control) and located in precentral sulcus. The ROIs are shown in Figure 2B. From these ROIs we extracted the beta weights of the incongruent (I) and congruent (C) conditions of the landmark task, as well as the beta weights from the calculation localizer (A for arithmetic) and the saccades localizer (S). We used the beta weights from the contrasts as described in the GLM analysis (see above). Those beta weights were then correlated across vertices in each of the 12 ROIs as suggested by Peelen et al. (2006). The resulting across-vertex correlation (AVC) matrices reflect the micro-organization of the vertices within each of the 12 ROIs in the course of the four cognitive tasks.
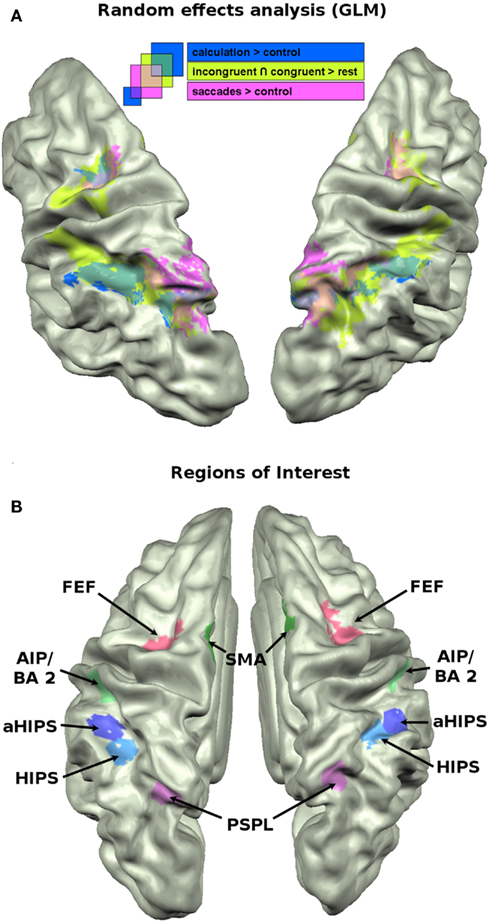
Figure 2. (A) Brain activation data of the GLM analysis (p = 0.005) projected on the cortex based aligned average anatomy of the sample. Mapped contrasts: conjunction of incongruent and congruent vs. baseline (green); subtraction vs. control (blue); saccades vs. control (pink). (B) The 12 ROIs that were used for across voxel correlations, MVPA, and cluster analyses.
To fully explore the differential relations between different micro-organizations across vertices in the 12 ROIs we subjected the AVC matrices to a cluster analysis (complete linkage with Euclidean distances as dissimilarity measure) in SPSS software. This cluster analysis reveals the macro-organization of brain activity since it subsumes different ROIs according to their functional similarity in the AVCs at hand.
To investigate the role of each of the above ROIs to the context of numerical–spatial interaction we used MVPA to distinguish between congruent and incongruent number triplets. Unlike other multivariate analysis approaches (e.g., independent component analysis, ICA) that fail to provide quantifiable links to experimental design variables (O’Toole et al., 2007), MVPA is based on the beta weights that are estimated on the basis of the underlying experimental design. Thus, MVPA links the multivariate data analysis to the experimental design and offers a more stringent analysis as compared to other multivariate analysis strategies. Since the rapid event-related design of the current study does not lend itself for the extraction of the raw time series per vertex as input for the MVPA we decided to use the parameter estimates (beta) of a new GLM. We computed the new GLM by defining a predictor for each trial of the landmark task. We focused on the incongruent and congruent trials to exploit the benefits of the bias-free measure from signal detection theory (i.e., d-prime) for the classifier performance. We extracted the betas of incongruent and congruent trials from all vertices in the 12 ROIs defined above, and analyzed them [after z-standardization (mean = 0, SD = 1) per participant and condition over vertices] with a support vector machine (SVM) classifier from the scikits.learn module1 running on python 2.62. We used a radial basis function kernel (default width = 1/number of features) with a regularization parameter C = 1. Data were cross-validated using a stratified K-fold procedure (K = 64). From each of the two categories (congruent and incongruent) one trial was left out and the classifier was trained on the remaining 126 [=2×(64 − 1)] trials. The left-out trials were then used to test the generalization of the classifier. Each trial was left out once in a single run, and performance was averaged over 100 runs.
Results
Behavioral Results
We first analyzed whether behavior (i.e., RT and ER) revealed a significant impact of the congruity between numerical and spatial information.
To this end we calculated a 4 × 5 repeated measures ANOVA with the factors numerical distance (20_80, 40_60, 60_40, and 80_20) and spatial distance (20_80, 40_60, 50_50, 60_40, and 80_20) for RT and ER. Beyond significant main effects of numerical [RT: F(3,42) = 59.54, p < 0.001; ER: F(3,42) = 71.41, p < 0.001, ε = 0.829] and spatial distance [only for RT: F(4,56) = 3.06, p < 0.05] a significant interaction between both factors was observed [RT: F(12,168) = 8.61, p < 0.001; ER: F(12,168) = 9.37, p < 0.001, ε = 0.796]. To investigate in more detail the origin of this interaction, we subsumed corresponding conditions under congruent, incongruent, and neutral trials according to the relation of numerical and spatial distances and submitted them to a one-way repeated measures ANOVA with the factor congruity. For RT a significant main effect congruity [F(2, 28) = 35.75, p < 0.001] was due to increasing mean RT from congruent [1457 ms (270 ms)] over neutral [1515 ms (254 ms)] to incongruent trials [1585 ms (288 ms)]. This order was confirmed by significant post hoc paired-sample t-tests [incongruent – congruent: t(14) = 10.38, p < 0.001; incongruent – neutral: t(14) = 4.33, p = 0.001; neutral – congruent: t(14) = 3.49, p < 0.01]. The increase in RT from congruent to incongruent trials was paralleled by a decreasing precision in terms of ER [congruent: 9.4% (5.8%), neutral: 12.9% (7.7%), incongruent: 19.8% (6.5), F(2, 28) = 28.3, p < 0.001]. Post hoc paired-sample t-tests revealed the following order of conditions congruent < neutral < incongruent [incongruent – congruent: t(14) = 6.81, p < 0.001; incongruent – neutral: t(14) = 6.46, p < 0.001; neutral – congruent: t(14) = 2.47, p < 0.05].
Brain Activation Data
GLM analysis
We begin by summarizing the activated networks of the three administered tasks in a classical GLM approach that are projected on the mean cortex-based aligned brain anatomy of the 15 participants.
The saccade localizer task reliably activated regions in the bilateral posterior parietal cortex, extending into the HIPS, and the FEF in both hemispheres. The results of the contrast saccades > control is shown in pink in Figure 2A.
Consistent with results from earlier studies (Pinel and Dehaene, 2010), the calculation localizer (calculation > control) activated bilateral regions along the IPS, extending into posterior parietal areas, partially overlapping with the saccades activations. It also activated portions of the FEF in both hemispheres. The activations are shown in dark blue in Figure 2A.
To visualize the cortical network that was activated in the landmark task, we calculated the conjunction of the incongruent and congruent condition against baseline. The numerical landmark task activated a network of areas along the IPS, partially overlapping with the calculation activations and extending into posterior parietal areas where it showed overlap with the saccades task. Unlike these latter two tasks, the landmark task significantly activated regions in more anterior parts of the IPS, i.e., the descending aspect of the IPS including the posterior bank of the postcentral sulcus. Beyond parietal activation it also elicited significant activations in bilateral medial frontal cortex, i.e., SMAs and the FEF overlapping with FEF activation of the previously described tasks. The activations of the landmark task are shown in light green in Figure 2A.
To visualize the regions in the brain that are particularly affected by the interaction between numerical and spatial information (see Behavioral Results) we computed the contrast incongruent > congruent trials. No significantly activated region emerged from this contrast, even at a very liberal threshold of p = 0.05.
ROI analysis using across-vertex correlations
The beta weights of the incongruent (I) and congruent (C) conditions of the landmark task, as well as the beta weights from the calculation localizer (A for arithmetic) and the saccades localizer (S) were correlated across vertices in each of the 12 ROIs. The resulting AVC matrices reflect the micro-organization of the vertices within each of the 12 ROIs in the course of the four cognitive tasks. We subjected the AVC matrices to a cluster analysis (complete linkage with Euclidean distances as dissimilarity measure) to reveal the macro-organization of brain activity.
Results are shown in Figure 3A. The height of the AVC in the 12 ROIs is shown as color-coded link between four nodes referring to the activation from the contrast congruent (C, upper left), incongruent (I, lower left), arithmetic (A, upper right), and saccades (S, lower right). Blue and green colors indicate low correlations, followed by yellow, orange for medium, and red for high correlations (see color-bar at the bottom of Figure 3A). To facilitate recognition of the different ROIs the colors of the nodes correspond to the colors of the ROIs in Figure 2B. Across all 12 ROIs, it becomes evident that congruent and incongruent trials elicit highly correlated patterns of activations ranging from 0.81 in ROI AIP/BA2 of the right hemisphere to 0.94 in ROI PSPL of the right hemisphere. Although the respective patterns of activation across vertices in the different ROIs should be highly correlated, because they are obtained from the same experiment the level of the correlations is remarkably high. Together with the non-significant difference in activation amplitude – as revealed by the contrast incongruent > congruent (see above) – this supports the notion that both types of trials rely on neural circuits that are overlapping in space and show a highly correlated pattern of activity across vertices. It should be noted that the correlation becomes lowest when we move out of parietal cortex and approach response-related motor systems, i.e., ROIs AIP/BA2 and SMA.
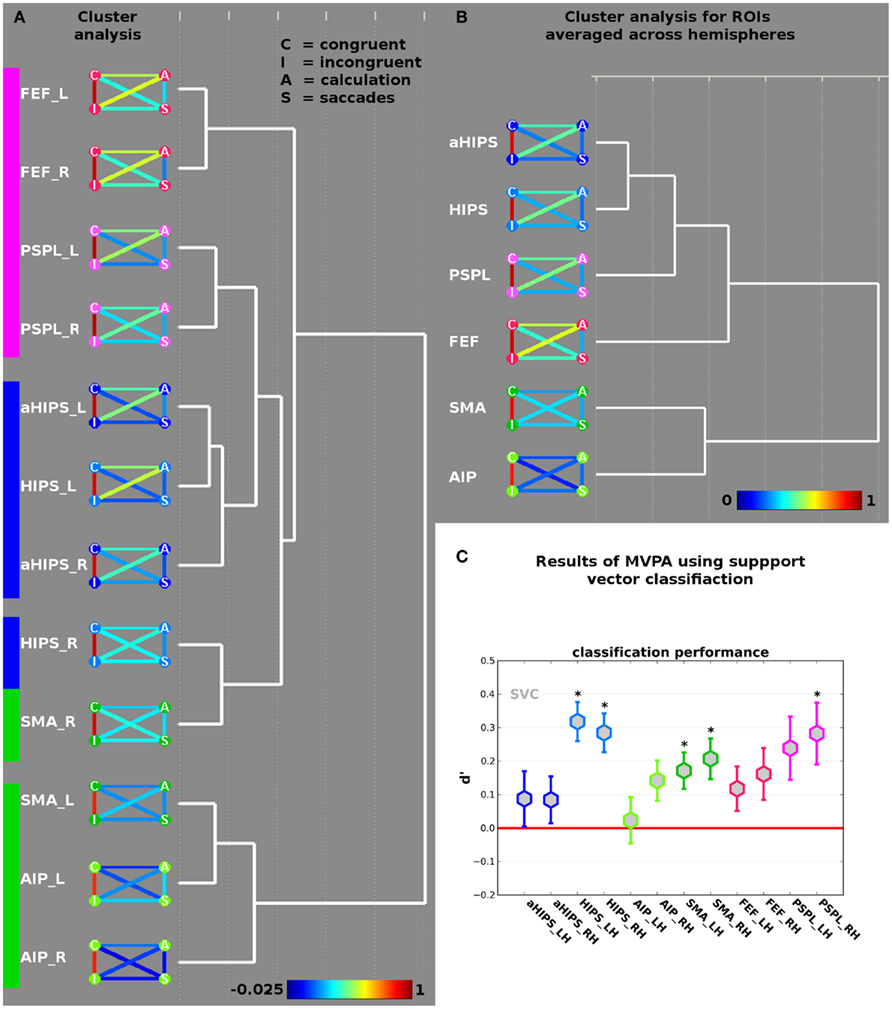
Figure 3. (A) Results of the cluster analysis of the across-voxel correlations between congruent and incongruent contrasts, and the two localizer tasks (saccades and calculation) in the 12 ROIs (see Figure 2B). The nodes of the AVC matrices represent congruent (“C”), incongruent (“I”), calculation (“A”) and saccades (“S”) contrasts. The color of the connecting lines between the disks indicates the height of the respective correlation in the ROI (see bottom for scale). (B) Results of the cluster analysis of the 12 ROIs collapsed across hemispheres. (C) Results of the decoding analysis differentiating incongruent from congruent trials in the different ROIs. Coefficient d-prime was computed by defining correct classification of congruent trials as congruent as “hit” (true positive) and classification of incongruent trials as incongruent as “correct rejection” (true negative). Stars indicate d-prime significantly larger than zero (red line) at p < 0.05 (corrected for multiple comparisons). Error bars represent SE of the mean.
The calculation task correlates to a higher degree with the landmark task (irrespective of congruency) than it does with saccades. This makes sense if one keeps in mind that the landmark task entails some calculation aspects in order to determine the larger of the two numerical intervals defined by the number triplet. This relation is even true for areas where calculation elicits only weaker activations and the spatial overlap is hence reduced between all three tasks such as PSPL. Put differently, the correlations across vertices reveal a functional recruitment of certain brain areas in the course of different tasks that would go undetected by the standard GLM approach.
The results of the cluster analysis using all 12 ROIs suggest two large-scale networks. Network one comprises the ROIs SMA_L (the suffixes “_L” and “_R” refer to left and right hemisphere, respectively) and the ROI AIP from both hemispheres and can thus be labeled motor-related network. The second network comprises the remaining nine ROIs and exhibits three sub-clusters. The first sub-cluster comprises ROIs FEF and PSPL from both hemispheres and can readily be related to eye movements. A second sub-cluster comprises aHIPS from both hemispheres as well as HIPS_L. This sub-cluster cluster can be related to number processing and calculation. A third sub-cluster contains only two ROIs from the right hemisphere, i.e., HIPS_R and SMA_R. This sub-cluster might represent ROIs that link motor-related regions with number processing and saccades.
We further analyzed the macro-organization by collapsing ROIs over hemispheres and submitting the averaged correlation matrices to the same cluster algorithm (complete linkage with Euclidean distances). The result is shown in Figure 3B. Again, we find a motor-cluster comprising the ROIs AIP and SMA, as well as a second cluster with a core sub-cluster comprising the number-related ROIs (HIPS and aHIPS). Only in subsequent iterations ROIs from the saccades system (i.e., FEF and PSPL) are assigned to the cluster, implying that, averaged across hemispheres, HIPS is more similar to aHIPS than to SMA.
The analysis of the micro and macro-organization of the different tasks in the different ROIs can be interpreted as first evidence for a subdivision of the areas along the HIPS and a differential involvement of the areas defined here in the resolution of the conflict occurring when spatial and numerical information do not converge on the same response. Broadly speaking, we find that the cluster analysis differentiates the motor system (SMA & AIP/BA 2) from the saccades & number system. On a more fine-grained level we see that the ROIs HIPS and SMA of the right hemisphere seem to be functionally located in between the two large-scale clusters. This implies that the HIPS of left and right hemisphere seem to serve slightly different purposes, with the HIPS_L being more closely related to the other areas from the HIPS, i.e., putatively number-related areas (aHIPS). Right hemisphere HIPS seems to be closely related to the motor system since it clusters with SMA of the right hemisphere. Inversely one might argue that the SMA of the right hemisphere seems to be linked with number-related processes as clusters with right hemisphere HIPS.
Multi vertex pattern analysis
To further investigate the implication of the different clusters (and the ROIs therein) in the context of the numerical landmark task we used a SVM classifier to differentiate congruent from incongruent trials. Similar to the correlations across vertices reported above, MVPA takes into account the spatial relations between vertices in a given ROI and goes beyond the vertex-wise analysis approach of the GLM that treats vertices as independent from each other.
Results are shown in Figure 3C. Stars indicate significant classification performance (p < 0.05) as tested by a one-sample t-test against zero, corrected for multiple comparisons (see Materials and Methods section). We observed a d-prime significantly larger than zero in the ROIs HIPS_L [d′ = 0.32, t(14) = 5.29, p = 0.0001], HIPS_R [d′ = 0.28, t(14) = 4.76, p = 0.0003], SMA_R [d′ = 0.21, t(14) = 3.31, p = 0.005], SMA_L [d′ = 0.17, t(14) = 3.05, p = 0.009], and PSPL_R [d′ = 0.28, t(14) = 2.95, p = 0.011]. It should be noted that classification performance in PSPL_L and right hemisphere AIP/BA 2 was good but did not pass the statistical correction for multiple testing [d′ = 0.24, t(14) = 2.44, p = 0.028 and d′ = 0.14, t(14) = 2.27, p = 0.039, respectively]. It becomes evident that in individual ROIs from each of the two large-scale networks, which were identified and described above, the spatial activation patterns allowed for a better-than-chance distinction between congruent and incongruent trials. Overall, classification performance was best in parietal areas with classification rates in terms of d′ up to 0.32 in left HIPS. To test for putatively different classification results between the different ROIs we computed a 2 × 6 repeated measures ANOVA with the factors hemisphere (2) and ROI (6) on the individual d-prime measures. We observed a significant effect of ROI [F(5,70) = 3.29, p = 0.017, ε = 0.8]. No other main effect or interaction was significant (all F < 1). We ran pair wise comparisons between the ROIs averaged across hemispheres and found that d-prime in HIPS was significantly higher than in aHIPS [t(14) = 4.04; p = 0.001]. No other pair wise comparisons were significant after correction for multiple comparisons. Since the ANOVA suggests that hemisphere does not have a significant impact on the data, we re-analyzed the individual d-primes from the six ROIs and found d-primes significantly larger than zero in HIPS [t(14) = 5.87 and p < 0.0001], SMA [t(14) = 4.07, p = 0.001], and PSPL [t(14) = 3.34 and p = 0.005].
To avoid possible confounds in the classification we checked if participants pressed as much left as right for both incongruent and congruent trials in the landmark task by computing a 2 × 2 repeated measures ANOVA with the factors “side” and “congruency” on the frequency of left and right button presses under the two conditions. We observed a significant main effect of congruency [F(1,14) = 6.472, p = 0.023, ε = 1]. No other main effect or interaction was significant (all p > 0.05). In none of the two congruency conditions (congruent or incongruent) we observed a significant difference in frequency of left vs. right button presses [congruent: t(14) = 0.4706, p = 0.645; incongruent: t(14) = 1.8522, p = 0.085].
Discussion
The present study was designed to investigate the interaction between numbers and space and its neural correlates with a focus on parietal cortex. By doing so we hoped to be able to separate early from late interaction of both dimensions. Behaviorally, we found that congruent number triplets were responded to faster and more accurately than neutral and incongruent number triplets. Together with an absence of the corresponding interaction when participants had to respond to the spatial intervals (Knops et al., submitted) this suggests that spatial and numerical information are extracted and processed in parallel and independent routes that interact at the level of response selection/response preparation only. The present study is the first to employ a comprehensive analysis of both the micro- and macro-patterns of brain activation in a task tapping numerical–spatial interaction and complementing standard massive univariate analysis techniques by model-related, multivariate analysis techniques (i.e., MVPA and AVC). For the numerical landmark task the standard GLM approach revealed activation in a network including regions along the IPS, areas in central and postcentral sulcus as well as supplementary motor cortex, and FEF. Activation overlapped with activation from the calculation localizer in HIPS, PSPL, and FEF (see Figure 2A). In PSPL and FEF we found an overlap between the saccades network and the numerical landmark task. By clustering the patterns of the correlations across vertices, we were able to identify two independent large-scale networks, each encompassing several ROIs. The networks can readily be described as a motor or response-related network comprising regions AIP/BA 2 and SMA as opposed to a saccades & number network, comprising the remaining ROIs. Within the latter cluster we observed three sub-clusters that can be labeled as a saccades network (FEF and PSPL), a number network (aHIPS and HIPS_L), as well as a right hemispheric network that links number and motor processes (HIPS_R and SMA_R). At first, the appearance of right hemisphere ROIs HIPS and SMA in a sub-cluster seemed somewhat surprising, given that SMA is frequently linked with response selection while the HIPS has repeatedly been shown to subserve number representation and mental arithmetic (Piazza et al., 2004, 2007; Hubbard et al., 2005). Apart from numerical functions the HIPS seems to serve manifold purposes, however. Most central to the present study, some authors argue that regions in the IPS that most likely corresponds to our ROI HIPS are implicated in response selection processes (Jiang and Kanwisher, 2003a,b) while more recent studies investigating the locus of response selection suggest more frontal areas such as posterior lateral prefrontal cortex (pLPFC) and SMA (Dux et al., 2006). Dux et al. (2006) argue that some aspects of the IPS activity profile support its implication in response selection processes, while other aspects make it appear a more general purpose area. Here the current approach might help to further specify the cognitive functions of a given area. Rather than focusing on the signal variation in a single spot, we also take into account the spatial variation of the signal and its relation with other regions in the brain. The results of the cluster analysis imply differential involvement of sub-regions along the IPS. While left hemisphere ROIs HIPS and aHIPS seem to be clearly distinct from the response-related system, the right HIPS appears to be functionally involved in both – numerical and response-related processes. Our study is thus one of the first to delineate in greater detail a putative candidate network in the right hemisphere that links numerical and response-related processes in the course of a task that shows a massive interaction between numerical and spatial information.
Although the temporal resolution of fMRI does not allow for a clear-cut distinction between input and output-related processes, the different networks can be attributed to stages of information processing in the course of the current task. One might then analyze activation data from these regions to investigate different stages of information processing.
In case of early interaction, numerical and spatial information should be integrated before further processing. Since both, numerical and spatial information, are processed in parietal cortex we hypothesized that parietal cortex would qualify as a candidate area for the integration of spatial and numerical information. This is in line with Walsh (2003) who assumed common metrics for numbers, space, and time that have their neural correlates in parietal cortex and with the finding of Tudusciuc and Nieder (2009), who observed neurons in parietal cortex that simultaneously coded for numerical and spatial features of a stimulus. We further reasoned that if the integration is accomplished in parietal cortex, we should observe differences between congruent and incongruent trials in exactly those regions. While the GLM analysis did not reveal any significant difference between incongruent and congruent trials, by adopting a MVPA analysis we were able to identify regions in the HIPS in which both types of trials evoked separable spatial patterns of activation. The fact that we were able to classify congruent from incongruent trials in ROIs that – as revealed by the cluster analysis – can be coined a number-related network speaks for an early interaction between both stimulus dimensions.
The late interaction notion posits that numerical and spatial information are extracted and processed in parallel and interact only at the level of response selection/response preparation. We hypothesized that in this case we should be able to classify congruent from incongruent trials in a response-related network in the brain. The cluster analysis revealed a response-related network consisting of SMA_L and AIP/BA2. According to the cluster analysis this network is functionally maximally different from the other ROIs since they are agglomerated only at the last linkage level (see Figures 3A,B). The MVPA analysis revealed a better-than-chance classification performance between congruent and incongruent trials in left and right SMA (see Figure 3C). This constellation can be interpreted in at least two ways. First, the differential activation pattern can be interpreted as a consequence of an inhibition process that operates in incongruent trials when irrelevant spatial response tendencies have to be suppressed but less so in congruent trials when no response tendency has to be inhibited. In this vein Forstmann et al. (2008) recently observed a strong link between both functional and structural fMRI parameters in right ventral premotor cortex and RT parameters that signal response inhibition in a Simon task. The ventral premotor cortex, in turn, is predominantly interconnected with the region AIP (Rushworth et al., 2006), a region that showed good albeit not significant classification performance in the right hemisphere. Second, these differential activation patterns could represent a direct consequence of the differential activation patterns in the number-related network, i.e., these regions receive their input from the close-by number-related network (aHIPS and HIPS_L) and covary with the latter. This is further corroborated by the finding that HIPS_R and SMA_R cluster form a sub-cluster that might link number and motor information in the course of information processing. On the basis of the present data we cannot decide between these two interpretations. Most crucially, both imply a significant contribution of the response-related network which in turn lends support to late interaction between numbers and space.
A major advantage of the adopted CBA in combination with unsmoothed imaging data of higher accuracy is that we can delineate in higher detail the neuro-cognitive architecture in tasks tapping number space interaction. In combination with the MVPA analyses we found that some parietal regions are differentially involved in congruent and incongruent trials (e.g., PSPL, HIPS) while others are not. In particular we could demonstrate that aHIPS is well activated by the numerical landmark task (and the calculation localizer) but its contribution appears unaffected by the congruency between numerical and spatial information. One might speculate that aHIPS is implicated in “purely” numerical processes of a task, i.e., it remains unaffected by its spatial aspects. In contrast, it has been argued that area hIP2 but not area hIP1, two anterior areas in the IPS where hIP2 may roughly correspond to our ROI aHIPS while hIP1 may overlap with our ROI HIPS (Choi et al., 2006), was implicated in “top-down modulated directionality-specific reorienting of motor attention during incongruent motor responses” (Cieslik et al., 2010). With the present study we cannot disentangle numeric processes from more general task components or top-down processes in manual response tasks, unfortunately. This demonstrates the importance of increased spatial resolution in future neuroimaging studies to further improve the mapping of numerical and spatial functions along the IPS.
The successful classification performance in the eye movement network (PSPL) may reflect differential scanning patterns in congruent and incongruent trials, respectively. This result cannot be explained in terms of a simple difference in amplitudes of the BOLD response, e.g., due to more eye movements in incongruent than in congruent trials for two reasons. First, as reported above, there was no region that showed a significant difference in terms of amplitude of the BOLD response. Second, before entering the beta weights from each of the two conditions into the classifier they were z-standardized, thus leveling out putative differences in amplitude.
Taken together, the results are in line with the literature that reports evidence for an integrated representation of several dimensions, amongst them numbers and space (Schwarz and Heinze, 1998; Walsh, 2003). The results are also in line with evidence for a late interaction of information in tasks that induce a conflict between irrelevant and relevant stimulus dimensions (Ridderinkhof, 2002; Cohen Kadosh et al., 2007, 2008; Forstmann et al., 2008).
By combining the AVC with a cluster analysis we identified two functional networks devoted to sensory–motor information on the one side and eye movements and number processing on the other with the latter containing three sub-cluster devoted to eye movements, number processing, and linking number to motor information, respectively. While the eye movement system is strictly organized according to ROIs (i.e., ROIs are clustered across hemispheres), this is not the case for the remaining clusters that combine ROIs from within one hemisphere on the first clustering level (e.g., aHIPS_L and HIPS_L for number system). Additionally, it should be noted that the cluster analyses do not merely reflect superficial task characteristics, such as whether mental manipulation of numbers is required or not. In this case, the eye movement system would be different from a second cluster containing all other ROIs. This is clearly not the case. This demonstrates that the results of this analysis are far from trivial and that the presented combination of AVC and cluster analysis might prove useful in identifying large-scale functional networks in many domains of cognitive neuroscience. It may serve the definition of functionally defined regions of interest that can then be subject to further analyses. By carefully adapting tasks and contrasts in a given study it might prove useful to investigate to what degree the large-scale organization of brain activity reflects participants’ different performance levels. Rotzer et al. (2009), for instance, suggested that a dysfunctional neural network of spatial working memory contributes to developmental dyscalculia. The combination of AVC and cluster analysis might be used to delineate the functional relation between these networks and other related functions such as different aspects of verbal working memory or memory retrieval in both dyscalculics and controls.
To sum up, by enriching standard GLM analysis with a combination of AVC and cluster analysis we identified large-scale networks that can be related to different stages of information processing. In each of these we were able to differentiate congruent from incongruent trials by using support vector classification. We provide evidence for both an early integration and a late interaction of conflicting stimulus dimensions, i.e., numerical and spatial distances.
Conflict of Interest Statement
The authors declare that the research was conducted in the absence of any commercial or financial relationships that could be construed as a potential conflict of interest.
Acknowledgments
This work was supported by a grant from the Deutsche Forschungsgemeinschaft (DFG KN-959/1, supporting André Knops), a grant for Klaus Willmes from the Federal Ministry for Education and Research (BMBF, supporting Jan Koten), a grant for Klaus Willmes from the IZKF (Interdisciplinary Centre for Clinical Research) Aachen within the faculty of Medicine at RWTH Aachen University, (project VV N69c, supporting Jan Lonnemann), and the Hessian initiative for the development of scientific and economic excellence (LOEWE; supporting Jan Lonnemann).
Footnotes
References
Andres, M., Davare, M., Pesenti, M., Olivier, E., and Seron, X. (2004). Number magnitude and grip aperture interaction. Neuroreport 15, 2773–2777.
Choi, H. J., Zilles, K., Mohlberg, H., Schleicher, A., Fink, G. R., Armstrong, E., and Amunts, K. (2006). Cytoarchitectonic identification and probabilistic mapping of two distinct areas within the anterior ventral bank of the human intraparietal sulcus. J. Comp. Neurol. 495, 53–69.
Cieslik, E. C., Zilles, K., Kurth, F., and Eickhoff, S. B. (2010). Dissociating bottom-up and top-down processes in a manual stimulus-response compatibility task. J. Neurophysiol. 104, 1472–1483.
Cohen Kadosh, R., Cohen Kadosh, K., Linden, D. E., Gevers, W., Berger, A., and Henik, A. (2007). The brain locus of interaction between number and size: a combined functional magnetic resonance imaging and event-related potential study. J. Cogn. Neurosci. 19, 957–970.
Cohen Kadosh, R., Lammertyn, J., and Izard, V. (2008). Are numbers special? An overview of chronometric, neuroimaging, developmental and comparative studies of magnitude representation. Prog. Neurobiol. 84, 132–147.
Culham, J. C., Cavina-Pratesi, C., and Singhal, A. (2006). The role of parietal cortex in visuomotor control: what have we learned from neuroimaging? Neuropsychologia 44, 2668–2684.
Dehaene, S., Bossini, S., and Giraux, P. (1993). The mental representation of parity and number magnitude. J. Exp. Psychol. Gen. 122, 371–396.
Dux, P. E., Ivanoff, J., Asplund, C. L., and Marois, R. (2006). Isolation of a central bottleneck of information processing with time-resolved FMRI. Neuron 52, 1109–1120.
Fias, W., Lammertyn, J., Reynvoet, B., Dupont, P., and Orban, G. A. (2003). Parietal representation of symbolic and nonsymbolic magnitude. J. Cogn. Neurosci. 15, 47–56.
Fischer, M. H., Castel, A. D., Dodd, M. D., and Pratt, J. (2003). Perceiving numbers causes spatial shifts of attention. Nat. Neurosci. 6, 555–556.
Fischl, B., Sereno, M. I., Tootell, R. B., and Dale, A. M. (1999). High-resolution intersubject averaging and a coordinate system for the cortical surface. Hum. Brain Mapp. 8, 272–284.
Foltz, G. S., Poltrock, S. E., and Potts, G. R. (1984). Mental comparison of size and magnitude: size congruity effects. J. Exp. Psychol. Learn. Mem. Cogn. 10, 442–453.
Forstmann, B. U., Jahfari, S., Scholte, H. S., Wolfensteller, U., van den Wildenberg, W. P., and Ridderinkhof, K. R. (2008). Function and structure of the right inferior frontal cortex predict individual differences in response inhibition: a model-based approach. J. Neurosci. 28, 9790–9796.
Goebel, R., Esposito, F., and Formisano, E. (2006). Analysis of functional image analysis contest (FIAC) data with brainvoyager QX: from single-subject to cortically aligned group general linear model analysis and self-organizing group independent component analysis. Hum. Brain Mapp. 27, 392–401.
Grune, K., Mecklinger, A., and Ullsperger, P. (1993). Mental comparison: P300 component of the ERP reflects the symbolic distance effect. Neuroreport 4, 1272–1274.
Hagler, D. J. Jr., Saygin, A. P., and Sereno, M. I. (2006). Smoothing and cluster thresholding for cortical surface-based group analysis of fMRI data. Neuroimage 33, 1093–1103.
Hubbard, E. M., Piazza, M., Pinel, P., and Dehaene, S. (2005). Interactions between number and space in parietal cortex. Nat. Rev. Neurosci. 6, 435–448.
Jiang, Y., and Kanwisher, N. (2003a). Common neural mechanisms for response selection and perceptual processing. J. Cogn. Neurosci. 15, 1095–1110.
Jiang, Y., and Kanwisher, N. (2003b). Common neural substrates for response selection across modalities and mapping paradigms. J. Cogn. Neurosci. 15, 1080–1094.
Kaufmann, L., Ischebeck, A., Weiss, E., Koppelstaetter, F., Siedentopf, C., Vogel, S. E., Gotwald, T., Marksteiner, J., and Wood, G. (2008). An fMRI study of the numerical Stroop task in individuals with and without minimal cognitive impairment. Cortex 44, 1248–1255.
Kaufmann, L., Koppelstaetter, F., Delazer, M., Siedentopf, C., Rhomberg, P., Golaszewski, S., Felber, S., and Ischebeck, A. (2005). Neural correlates of distance and congruity effects in a numerical Stroop task: an event-related fMRI study. Neuroimage 25, 888–898.
Kaufmann, L., Koppelstaetter, F., Siedentopf, C., Haala, I., Haberlandt, E., Zimmerhackl, L. B., Felber, S., and Ischebeck, A. (2006). Neural correlates of the number-size interference task in children. Neuroreport 17, 587–591.
Kriegeskorte, N., Simmons, W. K., Bellgowan, P. S., and Baker, C. I. (2009). Circular analysis in systems neuroscience: the dangers of double dipping. Nat. Neurosci. 12, 535–540.
Lindemann, O., Abolafia, J. M., Girardi, G., and Bekkering, H. (2007). Getting a grip on numbers: numerical magnitude priming in object grasping. J. Exp. Psychol. Hum. Percept. Perform. 33, 1400–1409.
Lonnemann, J., Krinzinger, H., Knops, A., and Willmes, K. (2008). Spatial representations of numbers in children and their connection with calculation abilities. Cortex 44, 420–428.
Nicholls, M. E., Loftus, A. M., and Gevers, W. (2008). Look, no hands: a perceptual task shows that number magnitude induces shifts of attention. Psychon. Bull. Rev. 15, 413–418.
Notebaert, W., and Soetens, E. (2006). Sustained suppression in congruency tasks. Q. J. Exp. Psychol. (Colchester.) 59, 178–189.
O’Toole, A. J., Jiang, F., Abdi, H., Penard, N., Dunlop, J. P., and Parent, M. A. (2007). Theoretical, statistical, and practical perspectives on pattern-based classification approaches to the analysis of functional neuroimaging data. J. Cogn. Neurosci. 19, 1735–1752.
Peelen, M. V., Wiggett, A. J., and Downing, P. E. (2006). Patterns of fMRI activity dissociate overlapping functional brain areas that respond to biological motion. Neuron 49, 815–822.
Piazza, M., Izard, V., Pinel, P., Le, B. D., and Dehaene, S. (2004). Tuning curves for approximate numerosity in the human intraparietal sulcus. Neuron 44, 547–555.
Piazza, M., Pinel, P., Le Bihan, D., and Dehaene, S. (2007). A magnitude code common to numerosities and number symbols in human intraparietal cortex. Neuron 53, 293–305.
Pinel, P., and Dehaene, S. (2010). Beyond hemispheric dominance: brain regions underlying the joint lateralization of language and arithmetic to the left hemisphere. J. Cogn. Neurosci. 22, 48–66.
Pinel, P., Piazza, M., Le, B. D., and Dehaene, S. (2004). Distributed and overlapping cerebral representations of number, size, and luminance during comparative judgments. Neuron 41, 983–993.
Proctor, R. W., and Cho, Y. S. (2006). Polarity correspondence: A general principle for performance of speeded binary classification tasks. Psychol. Bull. 132, 416–442.
Ridderinkhof, K. R. (2002). “Activation and suppression in conflict tasks. Empirical clarification through distributional analyses,” in Attention and Performance XIX: Common mechanisms in perception and action, eds W. Prinz and B. Hommel (Oxford: Oxford University Press), 495–519.
Rotzer, S., Loenneker, T., Kucian, K., Martin, E., Klaver, P., and von, A. M. (2009). Dysfunctional neural network of spatial working memory contributes to developmental dyscalculia. Neuropsychologia 47, 2859–2865.
Rushworth, M. F., Behrens, T. E., and Johansen-Berg, H. (2006). Connection patterns distinguish 3 regions of human parietal cortex. Cereb. Cortex 16, 1418–1430.
Santens, S., and Gevers, W. (2008). The SNARC effect does not imply a mental number line. Cognition 108, 263–270.
Sawamura, H., Shima, K., and Tanji, J. (2002). Numerical representation for action in the parietal cortex of the monkey. Nature 415, 918–922.
Schwarz, W., and Heinze, H. J. (1998). On the interaction of numerical and size information in digit comparison: a behavioral and event-related potential study. Neuropsychologia 36, 1167–1179.
Sereno, M. I., Pitzalis, S., and Martinez, A. (2001). Mapping of contralateral space in retinotopic coordinates by a parietal cortical area in humans. Science 294, 1350–1354.
Shaki, S., and Fischer, M. H. (2008). Reading space into numbers: a cross-linguistic comparison of the SNARC effect. Cognition 108, 590–599.
Shaki, S., Fischer, M. H., and Petrusic, W. M. (2009). Reading habits for both words and numbers contribute to the SNARC effect. Psychon. Bull. Rev. 16, 328–331.
Song, J. H., and Nakayama, K. (2008). Numeric comparison in a visually-guided manual reaching task. Cognition 106, 994–1003.
Stoianov, I., Kramer, P., Umilta, C., and Zorzi, M. (2008). Visuospatial priming of the mental number line. Cognition 106, 770–779.
Tudusciuc, O., and Nieder, A. (2007). Neuronal population coding of continuous and discrete quantity in the primate posterior parietal cortex. Proc. Natl. Acad. Sci. U.S.A. 104, 14513–14518.
Tudusciuc, O., and Nieder, A. (2009). Contributions of primate prefrontal and posterior parietal cortices to length and numerosity representation. J. Neurophysiol. 101, 2984–2994.
Vierck, E., and Kiesel, A. (2010). Congruency effects between number magnitude and response force. J. Exp. Psychol. Learn. Mem. Cogn. 36, 204–209.
Walsh, V. (2003). A theory of magnitude: common cortical metrics of time, space and quantity. Trends Cogn. Sci. 7, 483–488.
Keywords: cluster analysis, early interaction, interaction between number and space, late interaction, multi-voxel pattern analysis, numerical landmark task
Citation: Koten JW Jr., Lonnemann J, Willmes K and Knops A (2011) Micro and macro pattern analyses of fMRI data support both early and late interaction of numerical and spatial information. Front. Hum. Neurosci. 5:115. doi: 10.3389/fnhum.2011.00115
Received: 13 July 2011; Accepted: 27 September 2011;
Published online: 21 October 2011.
Edited by:
Filip Van Opstal, Ghent University, BelgiumReviewed by:
Ruth Seurinck, Ghent University, BelgiumMaria Grazia Di Bono, University of Padua, Italy
Copyright: © 2011 Koten Jr., Lonnemann, Willmes and Knops. This is an open-access article subject to a non-exclusive license between the authors and Frontiers Media SA, which permits use, distribution and reproduction in other forums, provided the original authors and source are credited and other Frontiers conditions are complied with.
*Correspondence: André Knops, Section Neuropsychology, Department of Neurology, Brain and Number Group, University Hospital, RWTH Aachen University, Aachen, Germany. e-mail: knops.andre@gmail.com
† Jan Willem Koten Jr. and André Knops have contributed equally to this work.