Neurocognitive development of risk aversion from early childhood to adulthood
- 1 Department of Psychology and Neuroscience, Duke University, Durham, NC, USA
- 2 Center for Cognitive Neuroscience, Duke University, Durham, NC, USA
- 3 Center for Interdisciplinary Decision Sciences, Duke University, Durham, NC, USA
- 4 Department of Neurobiology, Duke University, Durham, NC, USA
- 5 Brain Imaging and Analysis Center, Duke University, Durham, NC, USA
Human adults tend to avoid risk. In behavioral economic studies, risk aversion is manifest as a preference for sure gains over uncertain gains. However, children tend to be less averse to risk than adults. Given that many of the brain regions supporting decision-making under risk do not reach maturity until late adolescence or beyond it is possible that mature risk-averse behavior may emerge from the development of decision-making circuitry. To explore this hypothesis, we tested 5- to 8-year-old children, 14- to 16-year-old adolescents, and young adults in a risky-decision task during functional magnetic resonance imaging (fMRI) data acquisition. To our knowledge, this is the youngest sample of children in an fMRI decision-making task. We found a number of decision-related brain regions to increase in activation with age during decision-making, including areas associated with contextual memory retrieval and the incorporation of prior outcomes into the current decision-making strategy, e.g., insula, hippocampus, and amygdala. Further, children who were more risk-averse showed increased activation during decision-making in ventromedial prefrontal cortex and ventral striatum. Our findings indicate that the emergence of adult levels of risk aversion co-occurs with the recruitment of regions supporting decision-making under risk, including the integration of prior outcomes into current decision-making behavior. This pattern of results suggests that individual differences in the development of risk aversion may reflect differences in the maturation of these neural processes.
Introduction
Behavioral data suggest both commonalities and differences in decision-making between adults and children. Across the few studies that have directly compared young children and adults in decision-making under risk, children tend to be less risk-averse than adults (Harbaugh et al., 2002; Levin et al., 2007a; Rakow and Rahim, 2010; Paulsen et al., 2011). These developmental changes could reflect heightened focus on reward or reduced sensitivity to prospective loss, each of which may have distinct neurobiological underpinnings.
A series of recent studies have identified brain systems that contribute to decision-making under risk in adults (reviewed in Platt and Huettel, 2008; Rushworth and Behrens, 2008). We use the term decision-making to refer to value- or goal-based decisions, in contrast to perceptual decision-making. Core regions for processing the basic components of a risky decision –expected reward values, the probability of outcomes, reward variance, and affective consequences – include orbitofrontal cortex (OFC), posterior parietal cortex (PPC), ventral striatum (vSTR), anterior insula, and amygdala (Platt and Glimcher, 1999; Krawczyk, 2002; Hsu et al., 2005; Huettel et al., 2006; Wallis, 2007; Yang and Shadlen, 2007). The integration of this information into response plans appears to rely upon dorsolateral prefrontal cortex (dlPFC), PPC, and ventromedial prefrontal cortex (vmPFC; Krawczyk, 2002; Wallis, 2007). In risk contexts, this integration requires that sensory information be decomposed into the basic components of a risky decision (e.g., value, probability, variance) and brought to bear on the comparison of alternatives (vmPFC), followed by an action (dlPFC) that appropriates the selected alternative (see Rangel et al., 2008, for a discussion of the components of decision-making). Structures known to contribute to memory encoding and memory retrieval, like the hippocampus (Maratos et al., 2001), are also implicated in decision-making, as they provide organisms the ability to integrate their experiences with prior decision contexts, actions, and outcomes (Platt, 2002; Shohamy and Adcock, 2010), and are important in flexibly learning cue–outcome relationships (Shohamy et al., 2009).
Notably, regions of prefrontal cortex undergo marked structural changes from childhood to adulthood. For example, gray and white matter density in PFC do not reach adult levels until after adolescence (Giedd et al., 1999). Hippocampus (HC) and amygdala (Amy) volume also increase with age, achieving approximate adult size between 12 and 15 years of age (Østby et al., 2009). Thus, it is plausible that differences in decision-making between younger and older adults have roots in neural development.
Behavioral studies on the development of decision-making under risk have identified both linear and curvilinear trajectories in risk taking. Declines in risk taking between childhood and adulthood have often been found in tasks that present a choice between a sure bet and a gamble, in particular for gains (Harbaugh et al., 2002; Levin and Hart, 2003; Levin et al., 2007a; Weller et al., 2010; Paulsen et al., 2011). Adolescents show a relative increase in risk-taking compared to children and adults when tested in slightly more complicated gambling tasks with an emotional component (Figner et al., 2009; Burnett et al., 2010). Still, other studies have found age-related differences only under specific conditions. For example, van Leijenhorst et al. (2010a) did not find behavioral differences in choices between a gamble that had a 0.66 probability of returning 1 Euro and gambles that had a 0.33 probability of returning 4, 5, or 8 Euros across a large age span of 8–26 years (see also van Leijenhorst et al., 2008). In contrast, they found that young participants were more likely to choose a gamble with a 0.33 probability of winning only 2 Euros than a gamble with a 0.66 probability of winning 1 Euro. Although overall declines in risk-taking with age were found by Paulsen et al. (2011), there were no age-related differences in preference between sure bets and gambles with low coefficients of variation.
Two classes of hypothesis have been proffered to account for children’s increased risk-taking compared to adults. The first class speculates that young children may be less able to incorporate prior outcomes, in particular negative ones (Van Duijvenvoorde et al., 2008), into choice evaluation, which could also be viewed as a reduced sensitivity to prospective loss. For example, young children typically perform poorly on the Iowa Gambling Task (IGT; Bechara et al., 1994; Garon and Moore, 2004; Kerr and Zelazo, 2004), but do better on the IGT (Garon and Moore, 2007) and other gambling tasks (Brainerd, 1981) when the memory burden of the task is simplified or reminders of previous outcomes are provided. These observations suggest that in addition to general decision-making circuitry, the neural circuitry supporting the learning or integration of outcome history into current decision-making processes may mature with age.
A second class of hypotheses, drawn primarily from studies focusing on adolescents, centers on the idea that greater risk-taking may be driven by greater neural sensitivity to reward, coupled with an immature neural system supporting executive control “stop” processes (Galvan et al., 2006; Casey et al., 2008a). Although this idea is gaining increased acceptance for explaining adolescents’ tendency to exhibit greater real-world risky behaviors than younger children and adults, it may also be extended to the decline of risk-taking behavior in gambling tasks that occurs with age (Harbaugh et al., 2002; Levin et al., 2007a; Rakow and Rahim, 2010; Paulsen et al., 2011). Prior studies have indeed found curvilinear activations in the striatum that peaked in adolescents compared to children and adults during the anticipation and receipt of reward (Galvan et al., 2006; van Leijenhorst et al., 2010a), though other studies have found both greater (Ernst et al., 2005) and lesser (Bjork et al., 2004) striatal activation in adolescents than young adults during decision-making and reward anticipation. Results have also been mixed with respect to regions associated with cognitive control, finding decreases in OFC activation with age (Galvan et al., 2006), increases in OFC activation with age (Eshel et al., 2007), a peak in adolescence (van Leijenhorst et al., 2010a), or no significant change at all (van Leijenhorst et al., 2006). The apparent inconsistencies of these findings have been notably attributed to differences in the age groups studied and the variety of tasks implemented, most of which have focused on reward processing rather than on the process of decision-making (Galvan, 2010). Here we focus on the decision-making process.
To address how the neural bases of decision-making under risk might change over development and whether individual differences in patterns of brain activity would predict risk preferences during decision-making, we used event-related functional magnetic resonance imaging (fMRI) in a risky decision-making task with 5- to 8-year-old children, 14- to 15-year-old adolescents, and young adults. An important aspect of our task was that it avoided the highly symbolic components of most gambling tasks used with adults and instead allowed children to rely on their approximate number system, which does not depend on formal education (Barth et al., 2008). The age-appropriateness of this task was demonstrated in a previous study (Paulsen et al., 2011). With regard to the first class of hypotheses, we would predict a monotonic increase in the activation of decision-making regions (OFC, dlPFC, vSTR, HC, Amy, PPC) with age during the decision-making phase of our task. The second class of hypotheses focuses on a subset of regions involved in decision-making and similarly predicts a monotonic increase in OFC activation with age during decision-making. In contrast, the second class of hypotheses predicts an overall decline in reward-related vSTR activation with age, with a rise in vSTR activation during adolescence.
Our findings favor the first class of hypotheses, namely that age-related differences in risk-taking reflect the maturation of neural systems supporting decision-making and outcome evaluation. First, while some of the circuitry involved with risky decision-making was found to be online at an early age, several regions of prefrontal cortex were not fully engaged in children. Similarly, regions associated with contextual memory and the incorporation of aversive outcomes into the decision-making process showed less activation in children than in adults and adolescents. Second, we failed to find significant evidence of increased reward sensitivity in adolescents or children when compared to adults. In fact, children who showed adult-like risk aversion showed greater activation during the decision period for Risky Bets compared to Sure Bets in the vmPFC and striatum than children who were less risk-averse, consistent with the idea that the development of risk aversion co-occurs with the recruitment of regions supporting the integration of prior outcomes into current decision-making contexts.
Materials and Methods
Subjects and Task
Thirty-four children, 18 adolescents, and 17 adults, who were right-handed with normal or corrected to normal vision and no history of neurological disorders were recruited and scanned. Data from 17 child participants were excluded for one of three reasons: 10 for head motion exceeding a criterion of 2 mm in any direction (see Imaging Data Analysis); four due to poor accuracy (choosing the larger value on Sure Bet trials less than 65%) or lack of response variation; and three for failing to complete the scanning session. Data from one adolescent was excluded for excessive head motion, and data from one adult was excluded for lack of response variation. The remaining 17 children (8 Female) ranged in age from 5.9 to 8.0 years (M = 6.9 years), 17 adolescents (8 Female) ranged in age from 14.2 to 15.9 years (M = 14.8 years), and 16 adults (6 Female) ranged in age from 18.5 to 35.5 years (M = 23.7 years). Duke IRB-approved consent forms and confidentiality agreements were obtained from adult participants, parents, or legal guardians, and assent forms were collected from minor participants. Participants were given motion and task training in a mock scanner, after which children were allowed to investigate the selection of prizes they could choose from, prior to the actual task and scanning.
Participants were reminded that their goal was to collect as many coins as possible. Children were told that their coins could be traded for one of the toy prizes they had previously seen whereas adolescents and adults would exchange the coins earned for a gift card worth up to $25. On each trial, participants were presented with a choice between either two certain options (24 Sure Bet trials), or between a certain and a gamble option (48 Risk trials; Figure 1). Participants were first introduced to the certain option through Sure Bet trials during training, with the explanation that “whichever big box you choose is the one you’re going to get.” Risk trials were then introduced with the explanation that if they choose the two smaller boxes, “you never know which one you’re going to get; it could be the box with more coins or it could be the box with less coins.” The gamble options consisted of two possible outcomes with equal probability and an expected value (EV) equivalent to the certain alternative. Two levels of EV (two and four coins) and two levels of risk were used. Risk was defined by the coefficient of variation (CV) of the gamble options (0.71 and 1.41). We chose to use coefficient of variation because this measure of risk is dimensionless, allowing comparison to other studies that may use different units of value, and because it has been shown to be a good predictor of decision-making behavior under risk across species (Shafir, 2000; Weber et al., 2004). Thus, four types of gamble trials (12 each) were presented: small EV/low risk (1 or 3, vs 2), small EV/high risk (0 or 4 vs 2), large EV/low risk (2 or 6 vs 4), large EV/high risk (0 or 8 vs 4). The certain outcomes for the Sure Bet trials were drawn from the sets of values used in each of the four gamble trial types (e.g., 1 vs 2, 1 vs 3, 2 vs 3, etc.). Risky Bet and Sure Bet trials were presented within blue frames for 4 s before the frames changed color, at which time right and left arrows appeared beside the choice alternatives indicating the associated response hand, and a recording of a female voice saying “pick one” was played. Choices were made with a button press with the left or right hand, after which the frame of the selected alternative turned red and was displayed for 1 s followed by a variable 1–8 s blank-screen delay period. After the variable delay period the outcome was presented for 2-s accompanied by a playback of a female voice saying “you get” and, if coins were received, a short (0.15–1.2 s) playback of coin sounds. Intertrial intervals (ITI) ranged from 1 to 8 s. The 12 trial types were pseudorandomly distributed and presented in an even distribution across three runs of 24 trials each. Each run concluded with an image of the toy prizes and the cumulative coin winnings.
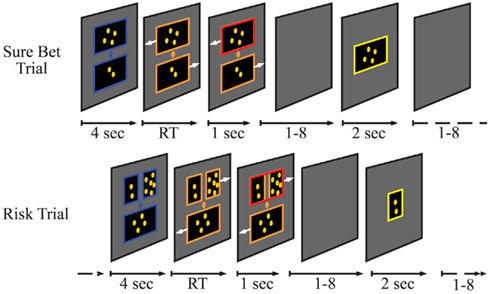
Figure 1. Experimental design. Each trial consisted of a decision (blue frame), choice (salmon frame), confirmation (red frame), delay (no frame), and outcome (yellow frame) period. Trial types were psuedorandomized and presented over three 8-min runs. Variable timing for the delay and intertrial intervals were implemented to dissociate the temporal contingency between adjacent events. RT, response time.
Imaging
Imaging data were collected with a GE Excite 3T scanner equipped with a 40 mT/m gradient system and an eight-channel head coil. T2*-weighted functional images were acquired in 34 interleaved slices using the GE standard EPI sequence (TR = 2 s, TE = 30 ms, FOV = 25.6 cm, flip angle = 60°, voxel size = 4 mm3). Functional data from the first three (child) participants were acquired using a SENSE spiral in/out sequence with the same parameters as the EPI sequence with the hope of increased sensitivity to activation in anterior regions near air/tissue interface (Law and Glover, 2009). EPI was used with all subsequent participants because we found the cost in signal-to-noise ratio by using a spiral in/out sequence to be too high in our child participants. Analyses run using only data from the 47 participants collected with EPI sequence confirmed only minor differences in activation compared to the n = 50 sample, e.g., slight shifts in peak voxel location and only a few regions that did not surpass cluster correction; notably these were regions unexpected to be affected by a spiral in/out sequence. Uncorrected patterns of activation remained the same. The differences between these analyses did not change our main conclusions. Each 8-min run provided the acquisition for 240 functional volumes, including four discarded acquisitions at the beginning of each run. High-resolution T1-weighted anatomical images were also acquired using a fast spoiled gradient-recalled sequence (TR = 7.31 s, TE = 2.98 ms, FOV = 25.6 cm, flip angle = 25°, voxel size = 1 mm × 1 mm × 2 mm).
Behavioral Data Analysis
Response time (RT) and selection data were collected for every trial, but only data from runs that were included in the imaging analysis were analyzed for behavioral measures. Risk aversion scores for each individual and trial type were calculated as the proportion of gamble trials for which the certain option was selected. Accuracy across participants on Sure Bet trials (choosing the larger amount) was greater than 93%. Risk aversion scores and median RT from each trial type were submitted to repeated-measures ANOVA (RM-ANOVA) with two levels of Magnitude (Small, Large) and two levels of Risk (Low, High).
Imaging Data Analysis
Functional imaging data were preprocessed and analyzed using FSL 4.1.4 (http://www.fmrib.ox.ac.uk/fsl). Preprocessing steps included motion correction using MCFLIRT (Jenkinson et al., 2002), slice scan time correction, voxel intensity normalization, high-pass temporal filtering to remove low frequency artifacts, and trimming volumes beyond 6 s after the end of the final event for each run. Because GE Signa EPI sequence automatically passes images through a Fermi filter with an effective spatial smoothing kernel of approximately 4.8 mm3, EPI and SENSE images were smoothed using different Gaussian kernel full width half maximums of 8 and 9.4 mm smoothing kernels, respectively, during preprocessing to obtain an effective spatial smoothing of approximately 9.4 mm3 for both acquisition sequences.
Data from runs with more than five volumes containing relative movement of greater than 2 mm in any direction were excluded from subject-level analyses. Because previous work has demonstrated that structural differences between children’s and adult’s brains are negligible following sufficient smoothing (Burgund et al., 2002; Kang et al., 2003), all images were normalized to the same template (Montreal Neurological Institute Template) as done in previous studies with children and adolescents (e.g., Cantlon et al., 2006; Galvan et al., 2006; Eshel et al., 2007).
Whole-brain voxel-based statistical analyses were performed within the framework of the general linear model (GLM). Our model included regressors that were defined for the decision period of five trial types (Sure Bet trials and each of the four EV by risk level gamble types) and the outcome period (certain outcomes, gamble wins, gamble losses). Nuisance regressors were also included to account for physiological variance (time course of intensity for voxels situated in the right ventricle), motion-related variance (motion correction vectors), and variance due to motor response (right and left hand responses). With the exception of ventricle and motion-related regressors, each of the regressor events was convolved with a double-gamma hemodynamic response (HDR) function and included the temporal derivative to account for differences in the HDR between children. The decision period was modeled with duration of 4 s and the outcome period was modeled with a duration of 2 s.
Functional magnetic resonance imaging data from children have been shown to contain more variance than fMRI data from adults (Thomason et al., 2005), as was the case with our data. Therefore, we used a mixed-effects approach that does not assume homogeneity of variance, but rather estimates and accounts for differences in within-group variance. FSL’s cluster correction for multiple comparisons (Gaussian-random field theory based) included a cluster threshold set to a height of z > 2.3 to identify a contiguous voxel cluster, and cluster probability set to p < 0.05 against which to compare the cluster’s estimated significance, whole-brain corrected (http://www.fmrib.ox.ac.uk/fsl). Additionally, risk aversion scores were mean adjusted by age group and used as a covariate in a parallel analysis.
We performed three primary analyses to examine age- and risk-related activations during decision-making. In all three, we restricted ourselves to activations in the Risk trial > Sure Bet trial. Although this contrast cannot dissociate certain aspects of the decision-making process, e.g., the computation of EV or risk, it allows us to isolate activation involved with decision-making under risk by controlling for basic numerical processing and mental comparison. Our first whole-brain analysis looked for age-related increases or decreases in activation using linear contrast weighting by age group, and for searched peaks or troughs in activation using quadratic weighting by age group. A second whole-brain test examined relationship between behavior and brain activation by using our behavioral measure of risk aversion as a covariate. This measure was mean corrected by age group before submitting it to the GLM so that differences in activation due to risk aversion would not be confounded by the general differences in risk aversion due to age.
Region of interest (ROI) analyses were also performed. These analyses were less restrictive than the whole-brain analysis in that our ROIs were selected on the basis of significant activation in any one age group, pair of age groups, or all age groups together, rather than an a priori pattern of activation. However, we also restricted our ROIs by anatomical definitions. This process can be thought of as an omnibus test for activation with follow-up tests to identify the particular patterns of activation within an anatomically defined space (see below). Thus, the procedure that we used for ROI selection incorporated an anatomical constraint and used statistics that (a) were unbiased with respect to our hypotheses and (b) answered a more general question than the statistics that were used in the ROI analysis.
Region of interests defined in the following manner. First, the Risky > Sure contrasts for each age group were submitted to an F-test within FSL to identify activations with parameter estimates significantly different from zero. This resulted in an ANOVA image of active regions due to significant activation in at least one age group. Possible approaches to proceeding from this point could have been to analyze the BOLD signal change of a peak voxel or a region surrounding a peak voxel in an area of activation, or the signal change in the whole of an activated region itself. However, these approaches have the potential to miss anatomical regions if only one peak is used in an activation that spans several regions, and may conflate different anatomical regions if the whole of a broad activation itself is used. Examination of the ANOVA results showed contiguous activation between a priori regions of interest with distinct anatomical boundaries, i.e., between insula and striatum and between occipital and posterior parietal cortices. So to identify the location of potentially different peaks within these regions, we incrementally raised the z-statistic threshold of the cluster-corrected image to the minimum at which the insula was separated from striatum (z = 3.3), allowing us to identify peaks in these regions. Over posterior sites, a large area of activation encompassing occipital, cuneus, and parietal cortices was decomposed at a slightly higher threshold (z = 4). The resulting peaks are listed in Table 3.
We next introduced anatomical constraints by masking each area of activation by the Harvard–Oxford anatomical region within which the ANOVA cluster peaks were located (Figures 3B,E insets). For example, a cluster of activation with a peak voxel in the left insula could partially extend into OFC, but only the activation contained within the Harvard–Oxford atlas for left insula would remain as the left insula ROI. We ran two step-wise regressions with each ROI using mean percent signal change within the entire ROI, in each participant, in the Risky > Sure contrast: one to look for risk-related activations within and between groups (in order: group, risk aversion, group × risk aversion interaction), and one to identify age-related activation (in order: age, age2) using an adjusted alpha of p < 0.0017 (0.05/28).
Results
Decision-Making Behavior
Children, adolescents, and adults made decisions about probabilistic and certain rewards, which were virtual tokens that could be traded for toys or gift card value at the end of the session (Figure 1; Paulsen et al., 2011). On Sure Bet trials, participants chose between two certain options that differed in value, while on Risky Bet trials participants chose between certain and uncertain options with the same EV. On Risky Bet trials, the reward magnitude was either small (EV = 2) or large (EV = 4), and the risk level, defined by the coefficient of variation (CV) in reward amount, was low (0.71) or high (1.41). Risk aversion was operationally defined as the proportion of Risky Bet trials in which a participant selected the certain option.
Overall, participants accurately selected the larger reward on greater than 97% of Sure Bet trials. A RM-ANOVA on Risky Bet trials with reward magnitude and risk level as within-subject factors and age group as a between-subject factor revealed a significant main effect of reward magnitude [F(1,47) = 21.8, p = 3e-5] indicating that participants gambled more often with larger EVs (M = 72%) than with smaller EVs (M = 56%; Table 1). There was also a main effect of risk level [F(1,47) = 21.9, p = 2e-10] indicating that participants selected the gamble more often on low risk (M = 73%) than on high-risk (M = 56%) trials. While there were no interactions between age group and reward magnitude (p = 0.368) or risk level (p = 0.257), risk aversion was different between groups [F(2,47) = 8.35, p < 0.008]. Importantly, independent-sample t-tests between groups showed that children selected the gamble more often (79%) than both adolescents (57%; p = 0.001) and adults (56%; p = 0.001). Adolescents and adults did not differ in risk aversion, as defined here (p > 0.80).
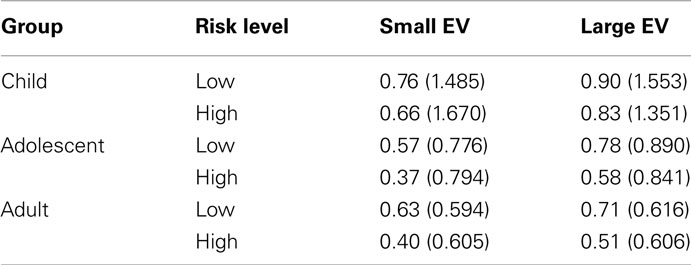
Table 1. Behavioral data: probability of selecting a gamble over a sure bet (RT in seconds).
Analysis of median RT data did not return any significant results (reward magnitude × risk × group: p = 0.232; all other p > 0.33), although a marginal interaction between risk level and reward magnitude was found (p = 0.099). This interaction suggests that participants took longer to respond to high risk than low risk on small magnitude trials, and longer to low risk than high risk on large magnitude trials (Table 1). However, it should be considered that all participants experienced a 4-s delay between stimulus presentation and the opportunity to respond, confounding RT data as a measure of decision-making duration. A main effect of group was also found, showing the typical reduction in RT with age (p = 2e-8).
Changes in Risk-Related Network Activity with Age
To control for the contributions of numerical processing unrelated to risk, we examined within-participant contrasts between the Risky Bet trials and the Sure Bet trials (risky > sure) during the decision period (Figure 1). Whole-brain analyses included tests for two developmental trajectories in the activation of brain regions involved with risky decision-making, as well as an F-test for group activations that would later form the basis of our ROI approach. First, we report that the only regions showing significant cluster-corrected activation in all age groups was in posterior parietal and occipital cortex (see below for additional details). Our first test of development in decision-making used linear contrasts to identify regions of activation that increased or decreased from childhood to adulthood. This contrast revealed increasing activation with age during decision-making under risk in several areas of prefrontal and parietal cortex, as well as sub-cortical areas (Table 2), but did not show any regions decreasing in activation with age. Frontal regions that showed increasing activation with age included the anterior insula, vmPFC, anterior cingulate (ACC), frontal pole, OFC, amygdala (Amy), and hippocampus (HC); sub-cortical age-related increases in activations included the caudate, putamen, and thalamus (Figure 2). Over posterior regions, linearly increasing activation was found in bilateral superior parietal cortex, occipital cortex, and precuneus during the decision period. We tested for robustness to group classification by regressing signal change at peak voxels for the regions identified in the linear contrast (Table 2) on age. With the exception of three foci in superior frontal gyrus, superior occipital gyrus, and dlPFC, all regression coefficients were significant at p < 0.05. To be sure that these increases in activation were not a result of differences in the contrast condition, we checked for decreasing activation with age in the Sure Bet condition, which confirmed that there were no regions significantly more active in children than adults.
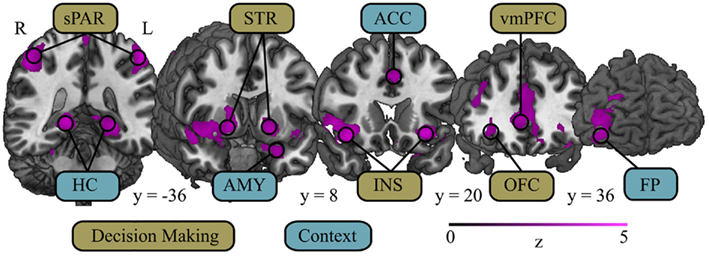
Figure 2. Regions associated with decision-making and context show increased activation with age during the decision period. Several regions comprising a decision-making network showed increased activation with age during decision-making. This network consists of areas associated with processing risk – superior parietal cortex (sPAR) and insula (INS) – and regions associated with processing value – orbitofrontal cortex (OFC), ventromedial prefrontal cortex (vmPFC), and striatum (STR). Additionally, brain regions often associated with memory and context showed increased activation with age during the decision period. These regions include: anterior cingulate cortex (ACC), associated with fictive learning and conflict detection; frontal pole (FP), associated with goals and strategies; amygdala (AMY), associated with affective dimensions of previous outcomes and current stimuli; and hippocampus (HC), associated with contextual memory. Coordinates in MNI space.
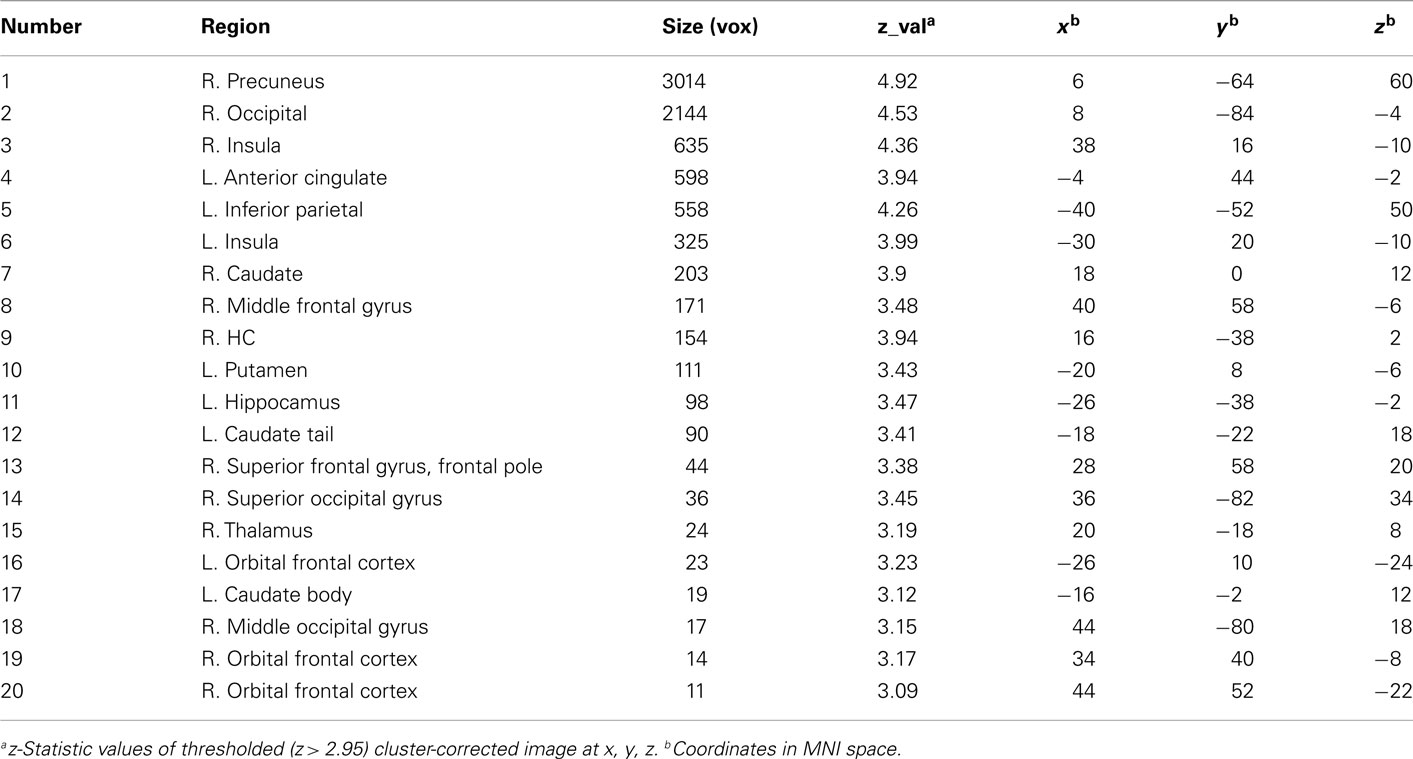
Table 2. Whole-brain analysis linear effect of age group during decision-making.
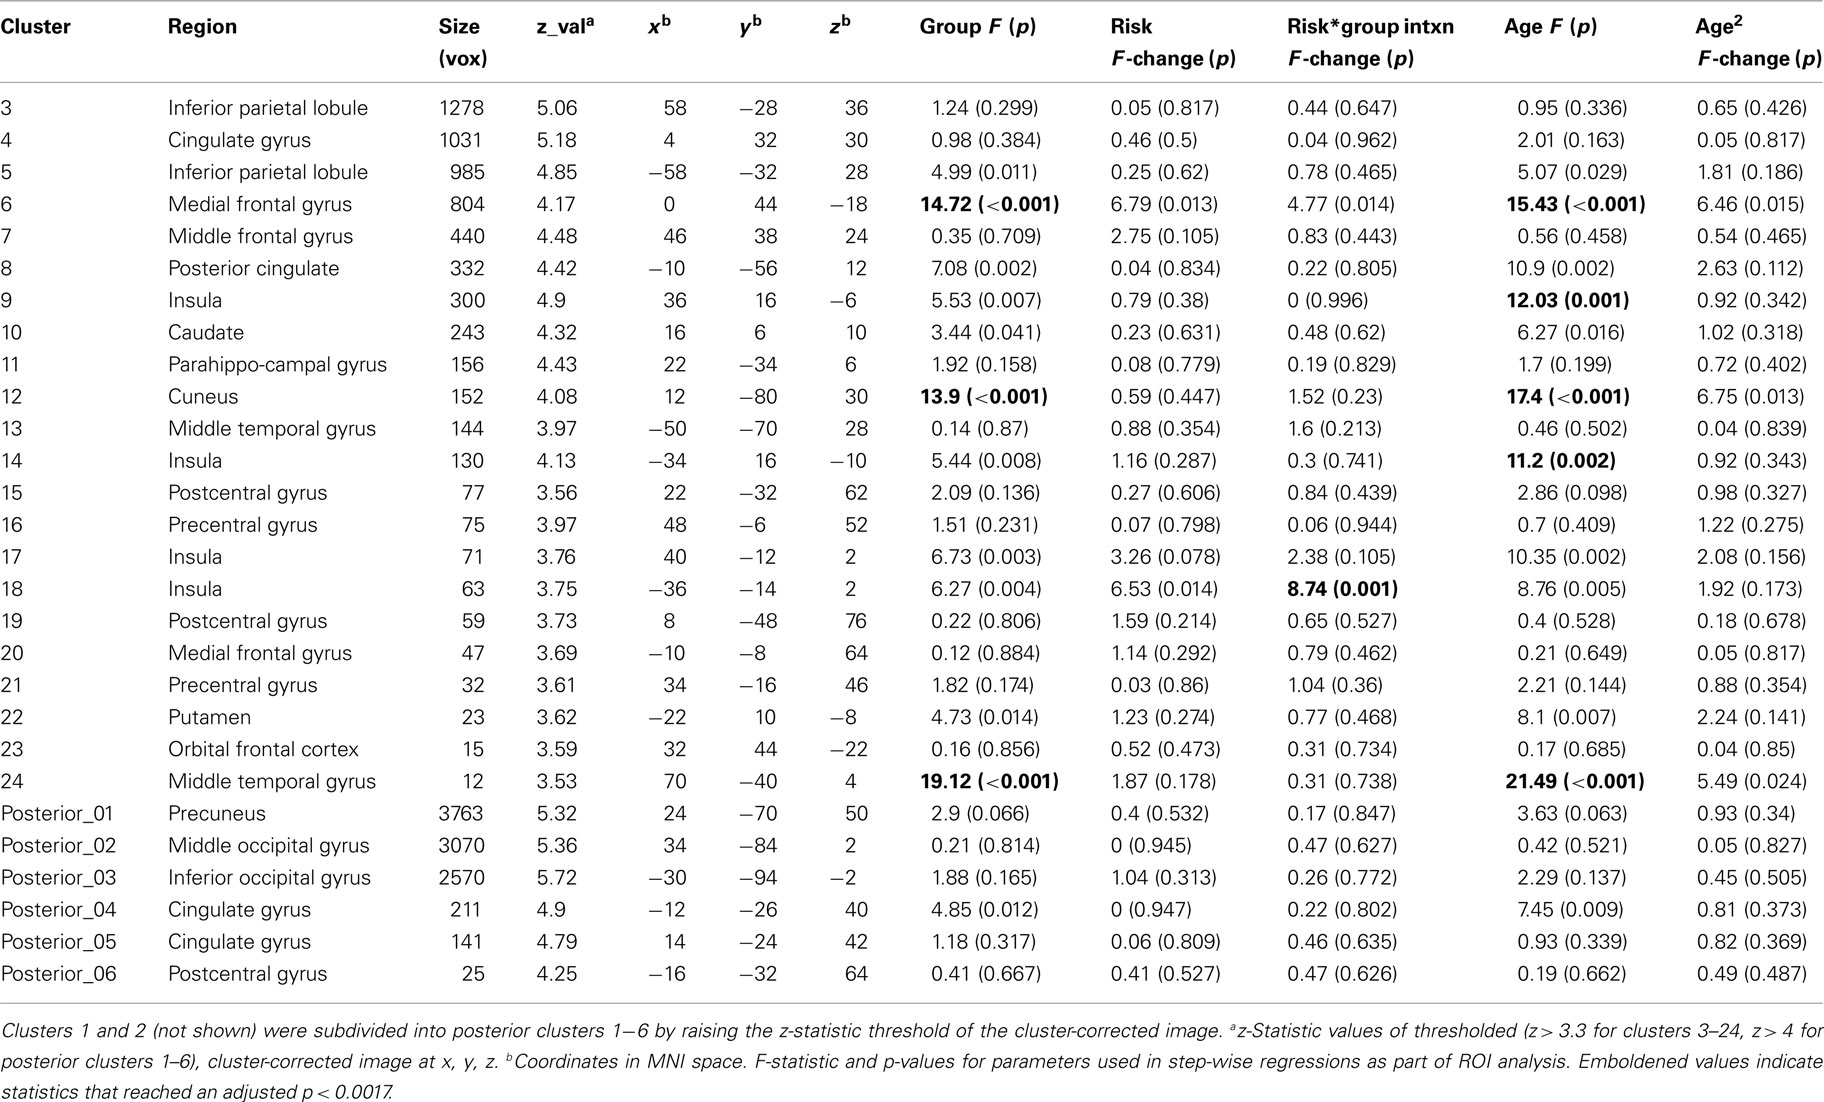
Table 3. Clusters of activation from group ANOVA and ROI analysis statistics during decision-making.
We also tested for changes in the neural response to risk that were unique to adolescents using quadratic contrasts that would identify peaks or troughs of activation in the adolescent group for risky > sure, but did not find any regions showing such patterns of activation in the cluster-corrected images. However, examination of the uncorrected images did reveal small clusters of activation peaking in adolescents in the caudate, hippocampus, and anterior cingulate gyrus, among several other regions (Table A1 in Appendix).
In order to confirm the previous results and to identify developmental effects in any regions of the brain involved with decision-making under risk that may have been missed by the whole-brain analysis, we also took a ROI approach. ROIs were identified using an F-test revealing cluster-corrected activations that were significantly different during Risky Bet trials than Sure Bet trials on average across groups; significance could be due to a large change in one group or a small but consistent change across all groups. For each ROI, we ran two step-wise regressions to look for risk-related activations within and between groups (group, risk aversion, group × risk aversion interaction) and to look for age-related activation (age, age2). As linear effects of age could be due to differences between the two younger groups and the oldest group, between the youngest group and the two older groups, or between each of the groups pairwise, we further performed post hoc t-tests.
The F-test analysis yielded ROIs in portions of PFC, OFC, insula, cingulate, PPC, and striatum (Figures 3B,E insets). These ROIs matched a subset of regions with overlapping activation between adolescents and adults that were found in anterior cingulate, dorsal striatum, insula, PPC, and occipital regions. Areas of activation in children overlapped with the areas activated in both adults and adolescents in PPC and occipital cortex, as mentioned above, with sub-threshold activations in anterior cingulate. These ROIs were similar to those identified in the linear contrast in whole-brain analysis using age group as a factor as described above.
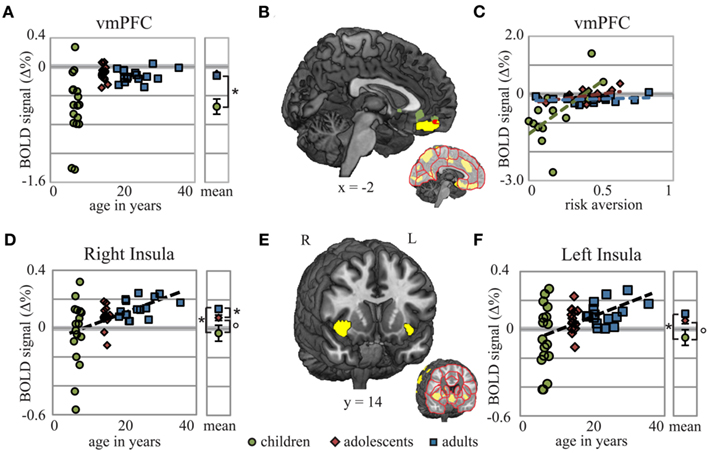
Figure 3. vmPFC showed age- and risk-related activation, while bilateral insula showed only age-related increases in activation during decision-making. Decision-related activation for the vmPFC ROI [(B); yellow] was greater in adults and adolescents than it was in children (A), demonstrating that the age-related linear trend found here was due primarily to the difference between children and adults. Whole-brain analysis revealed activation in children that correlated with risk aversion in ACC and vmPFC [(B); green]. The vmPFC cluster from this whole-brain analysis overlapped with the vmPFC ROI [(B); red]. Regression slopes for each age group shown in (C) demonstrate the unique relationship between BOLD signal change in vmPFC and risk aversion scores found for children. Age-related linear trends of activation were also found in right and left insula ROIs (E). In contrast to vmPFC, these regions showed a more robust positive linear relationship to age (D,F). Coordinates in MNI space; circles – children; diamonds – adolescents; squares – adults; *p < 0.05;°p < 0.1. Note: Though some of the children’s data appear to be outliers, all of the children’s data points in Figure 3 are less than 2.5 SD from the group mean of the panel, and only two exceed 2 SD.
In tests of each ROI between age groups, our results fell into two classes: differences between children and adolescents/adults, and linear changes across age groups for risky > sure. We found no risk-related ROI that showed evidence of peak activation during adolescence. Significant linear trends were followed by t-tests, with correction in degrees of freedom for unequal variance when appropriate, between each group showing group differences in the vmPFC (Figures 3A,B), cuneus, and middle temporal gyrus between children and adults, and children and adolescents (all p < 0.001), but not adults and adolescents (all p > 0.45). Thus, although a significant linear trend of age was found in vmPFC in the whole-brain analysis, this effect appears to be largely due to the difference in BOLD signal change between children and adolescents with little or no change from adolescence to adulthood.
Linear effects of age were also found in right and left insula (Figures 3D–F). In the right insula, t-tests revealed significant differences between children and adults (p = 0.009) and between adolescents and adults (p = 0.023), while differences between children and adolescents were marginal (p = 0.082). In the left insula, differences between children and adults were also significant (p = 0.009), whereas differences between children and adolescents (p = 0.057) and between adolescents and adults (p = 0.119) approached significance demonstrating a trend similar to the right insula. A separate cluster within the left posterior insula showed a significant interaction between risk aversion and age group: activation in this ROI during the decision period for Risky Bet compared to Sure Bet trials was negatively correlated with risk aversion in children, but not in adolescents or adults (Figure A1 in Appendix). Overall, we found strong evidence of child-specific risk-activation deficits in the vmPFC, and linear developmental effects across age groups in the insula.
More Adult-Like Risk Aversion in Children Correlates with Greater vmPFC Activation during Risky Decision-Making
Developmental changes in the neural bases supporting risk and decision-related processing may or may not contribute to specific differences in behavior across age groups. To clarify the links between brain activations and risk aversive choices, we regressed our index of risk aversion against whole-brain data within each age group. We found different networks of brain regions to be associated with risk preferences in each group. In children, risk aversion was correlated with activation in ACC, vmPFC (Figure 3C), caudate and OFC during the decision period for Risky Bets compared to Sure Bets (Figure 4), while in adolescents risk aversion was correlated with activation in medial frontal gyrus and central cingulate gyrus. In contrast to previous studies (Huettel et al., 2006), we failed to find neural activation during the decision period in adults that was correlated with levels of risk aversion.
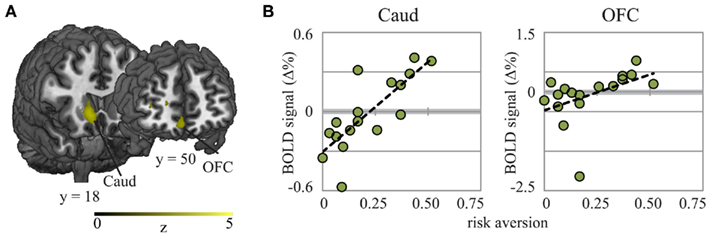
Figure 4. Whole-brain analyses revealed that risk aversion was correlated with activation in caudate nucleus and OFC for children (shown here) but not for adults or adolescents, during decision-making. (A) Activation maps and (B) scatterplots showing the relationship between BOLD signal and risk aversion. Coordinates in MNI space; Caud, caudate nucleus; OFC, orbitofrontal cortex.
Activation Associated with Outcome Evaluation
The activation in response to winning, or positive outcomes (the greater of the possible gamble outcomes) and losing or negative outcomes (the lesser of the possible gamble outcomes) were analyzed with respect to the combined ISI and ITI baseline. Positive outcomes evoked a similar pattern of activation for adolescents and adults across a number of regions, including superior temporal gyrus (STG), ACC, dlPFC, lateral OFC, insula, striatum, inferior parietal cortex, inferior frontal gyrus (IFG), and fusiform gyrus (Figure A2A, Table A2 in Appendix). In children, positive outcomes elicited activation overlapping with that of adolescents and adults in STG, insula, striatum, inferior parietal, and IFG. With age, increasing activation to positive outcomes was found in dlPFC, inferior parietal, and inferior occipital regions.
Overlapping activation to unfavorable or losing outcomes was also similar in adolescents and adults, and was found in insula, STG, and ACC (Figure A2B, Table A3 in Appendix). Regions of activation that overlapped for all three age groups were restricted to STG and insula. Linear trends of age in activation to losing outcomes were found in STG, occipital cortex, and precuneus.
Discussion
Our data suggest that the development of risk aversion co-occurs with the recruitment of a network of brain regions that support decision-making under risk, including the integration of prior outcomes into current decisions. Within regions of the brain associated with decision-making under risk across age groups, we found that the insula showed robust linear patterns of activation with age. Furthermore, the vmPFC exhibited a unique relationship with risk aversion. While vmPFC activations were not perfectly overlapping, there was a region of vmPFC that was active in adolescents and adults that overlapped with the activation correlated with risk aversion in children, interpreted as vmPFC activation in children who made more adult-like risk-averse choices.
A novel finding was that young children engage structures involved with learning, affect, and memory (e.g., hippocampus, amygdala, and vmPFC) to a lesser extent than do both adults and adolescents when making decisions under risk. The hippocampus is known to be active during informed decision-making and is important for learning cue–target associations (Ernst et al., 2002; Amso et al., 2005). Projections from HC to the midbrain signal the detection of new information, while midbrain dopamine neurons reciprocally modulate HC activity, thought to signal events of biological and motivational salience and giving weight to preserving important memories (Lisman and Grace, 2005; Adcock et al., 2006). Amygdala activation is often associated with the processing of emotional content but it is also involved with learning and representing stimulus value (Cardinal et al., 2002; Guitart-Masip et al., 2010). In conjunction with hippocampus and amygdala, vmPFC activation signals the successful learning of abstract cue–outcome relations (Hampton et al., 2007; Kumaran et al., 2009) as well as the subjective value of chosen options (Kable and Glimcher, 2007; Hare et al., 2010; Smith et al., 2010). Thus, our data could suggest that information from prior decisions and outcomes may not be as readily incorporated into children’s decision-making processes as they are in adults, with the caution that this suggestion relies on reverse inference (Poldrack, 2006). However, this hypothesis is supported by behavioral data that demonstrate an improvement in the slow learning rates of young children in gambling tasks by reducing memory load or by providing reminders of prior outcomes (Brainerd, 1981; Garon and Moore, 2004, 2007; Kerr and Zelazo, 2004).
We also found a robust correlation between age and insula activation during the decision period for Risky Bets compared to Sure Bets that can be interpreted in several ways. Prior studies have found anterior insula activation associated with classical conditioning of aversive stimuli and correlated with measures of harm avoidance (Büchel et al., 1998; Paulus et al., 2003). Thus, one interpretation of these data is that increasing insula activation with age merely tracks the development of a region supporting loss aversion, if we assume that small gains are considered losses compared to the larger alternative outcomes (Tversky and Kahneman, 1991) and that losses are aversive. A recent meta-analysis has identified the anterior insula as particularly important for the representation of risk and the influence of emotion on risk processing (Mohr et al., 2010). In this case, we might consider age-related activation of the insula to reflect a maturation in the processing or perception of risk, which in our case assumes a model adopting coefficient of variation as a risk index (Weber et al., 2004). It has been suggested that the anatomical position of the insula is ideal for combining affective and cognitive information during decision-making because of its connectivity to surrounding structures including the amygdala and nucleus accumbens (Preuschoff et al., 2008). Thus, another more general interpretation of our data could be that the age-related increase in insula activation, as well as other regions, reflects the maturing connectivity of a decision-making network. These alternative interpretations are not necessarily exclusive. The importance of this region in risky decision-making and development is clearly an avenue for future research.
The association we have found between brain regions with age-related increases in activation and the development of risk aversion is supported by other lesion and fMRI studies. Amygdala and insula patients show an increased propensity to gamble, especially under gain conditions similar to the ones in our task (Weller et al., 2007; Clark et al., 2008; Talmi et al., 2010). OFC and ACC activation during decision-making has been associated with greater risk aversion in adults compared to adolescents (Galvan et al., 2006; Eshel et al., 2007). Activation in these regions in our study was found to increase with age, as was risk aversion. Interestingly, bilateral amygdala damage has been shown to alter neural responses in the ACC, vmPFC, OFC, and insula (Hampton et al., 2007), which adds further support to the notion that these regions develop as an interconnected network supporting decision-making.
In contrast to (Kuhnen and Knutson, 2005), we found that increased activation in decision value regions like the vmPFC and striatum in children was associated with a decrease in preference for the risky option rather than an increase while activation in these same regions increased with age. Prior studies have found enhanced sensitivity of striatal reward processing regions in adolescents, who are as a group characterized by riskier real-world behavior compared to adults or children (Casey et al., 2008b). Such findings offer the hypothesis that differences in striatal reward processing contribute to differences in risk preferences (Arnett, 1992; Galvan et al., 2006; Casey et al., 2008b; van Leijenhorst et al., 2010a,b). We found little evidence to support this idea. Although an inverted U-shaped pattern of activation was identified in a small uncorrected cluster in the striatum, this region was more dorsal and lateral to the proposed reward sensitive region nucleus accumbens. Nevertheless, it is possible for a region to show fits to linear and curvilinear trends, but it will remain a subjective issue how to interpret data of this sort. We interpret the current data to suggest that there is greater evidence for a linear change in activation and maturity in decision-making regions between 5 years of age and early adulthood than there is for a quadratic one.
It is also important to note that curvilinear activations in the striatum have been reported in response to rewards or reward cues rather than during decision-making (Galvan et al., 2006; van Leijenhorst et al., 2010a). During decision-making in a gambling task, Eshel et al. (2007) reported increasing activation with age in OFC and ACC, and similar to the current findings, also reported a negative correlation between risk-taking and activation in OFC for adolescents. A decrease in the difference between activation in high risk vs activation in low risk trials was found with age in ACC, while an inverted U-shaped pattern was found in medial OFC (van Leijenhorst et al., 2010a). Adolescents tested in a driving simulation were found to show decreased activation in striatum and OFC compared to adults, when peers were present (Chein et al., 2010). Similar to the patterns of activation in the current study, Bjork et al. (2004, 2010) have found that adults exhibit greater activation in the striatum, insula, and amygdala, than do adolescents in response to reward cues.
There are at least three critical aspects of task design that render direct comparisons between studies difficult: the component of the decision-making process targeted (e.g., decision-making, cue/anticipation, and outcome), the age groups included and excluded, and the task contrasts and/or baselines each study used (Galvan, 2010). For example, it may be problematic to compare our sample of children in the 5- to 8-year age range to findings from studies that sample children in the 7- to 11-year age range (Ernst et al., 2005; Galvan et al., 2006; van Leijenhorst et al., 2006, 2010a). Adolescents in our study were not found to show enhanced striatal activation, but were also less prone to making risky choices than adolescents tested in some other tasks. Our findings indicate that increased activation in reward processing regions during decision-making may not necessarily predict greater engagement in risky behavior, but instead may reflect partial maturation of decision-making circuitry.
Posterior parietal activation, which has been previously found to associate with risk preference, action selection, reward value, and probability of reward, was also found to increase linearly with age during the decision period for Risky Bets compared to Sure Bets (Platt and Glimcher, 1999; Huettel et al., 2006; Yang and Shadlen, 2007; Boorman et al., 2009). This region is also well known for its role in numerical processing and attention (Piazza et al., 2004; Cantlon et al., 2006; Huettel et al., 2006; Boorman et al., 2009). Although we attempted to isolate the effects of risk processing from numerical computation, it is possible that at least some of the residual PPC activation we observed was due to the addition of a third numerical value to be compared in Risky Bet trials compared to just the two involved with Sure Bet trials. Thus, it remains difficult to assess how much of the activation found in PPC was due to numerical processing and how much was due to risk.
Analysis of behavioral data showed relatively less risk–taking among older participants than among children. This difference raises questions regarding children’s incentivization or their understanding of the task. Equating incentives across ages is often a problem in developmental research. However, our use of toys for children and monetary value for older participants as incentives returned results keeping with other studies that used similar, dissimilar, or no economic incentives between groups (Harbaugh et al., 2002; Levin and Hart, 2003; Levin et al., 2007b; Rakow and Rahim, 2010; Weller et al., 2010; Paulsen et al., 2011). Although participants were not informed of the exact probabilities for risky outcomes, prior work from our lab (Paulsen et al., 2011) has shown that behavior among samples from the same age groups as the current fMRI study does not differ among age groups when risk level (CV) is low, suggesting that the subjective probabilities of “winning” are similar. Similarly, other work has demonstrated that probabilistic discounting is unaffected by age (Scheres et al., 2006). In the current task, we found that behavior was modulated by risk level and EV across groups. Together, findings suggest that children both were properly incentivized and that they understood the task.
Unexpectedly, adolescent and adult participants on average selected gamble options on slightly more than 50% of trials, demonstrating risk-seeking behavior instead of the typical risk-averse behavior often associated with adult populations. It is possible that participants exhibited risk-seeking behavior because the outcomes associated with the gambles in our task were small, and therefore were not perceived as especially risky (Markowitz, 1952). However, the increase in risk taking for larger magnitude over smaller magnitude gambles is inconsistent with this suggestion. Other studies have found that risk preference can be modulated by the probabilities and variance of outcomes (Weber and Chapman, 2005; Paulsen et al., 2011). Thus, it is possible that the risk-seeking behavior we observed in adolescents and adults was due to the particular parameters implemented in this version of the task.
There are limitations associated with the current task design. First, to dissociate decision-making and response selection, we presented choice options for 4 s before providing response cues. While this procedure was used to remove an important potential confound, it limited our ability to model the decision-making period as a function of RT, and may have increased the noise in our sample if there was a lot of variability in the time at which decisions were made. In this case, using a 4-s decision-making epoch in our model would be overestimating the expected duration of brain activation, reducing our ability to detect more rapidly occurring decision processes, or in identifying similarities in brain activation across age groups that have dissimilar time courses. Another potential limitation may have been our choice of a contrast condition. We chose to use the Sure Bet condition for our contrasts in order to control for the numerical comparison component of our economic decision-making task. While our Risk trials involved three numerical components, Sure Bet trials contained only two. Thus, we were unable to fully control for the effects of numerical comparison. Another potential limitation in our choice of the Sure Bet condition as a contrast is that effects other than numerical comparisons may also have been reduced. For example, the expectation of reward is clear with both a Sure Bet and choosing the safe option (Bjork et al., 2004, 2010), and this expectation could potentially minimize differences in BOLD activation between Sure Bet and Risk conditions in the adult and adolescent groups, as they chose the Safe option more often in Risk trials than children. Finally, while the lower quantity gamble outcomes may have appeared as losses relative to the sure bet and larger gamble outcomes, the value manipulations made it such that choosing a gamble would probabilistically be rewarded 75% of the time. This makes it difficult to directly compare the activation in response to outcomes in our task to studies in which losses are actually incurred.
In summary, we found that a shared network of brain regions was recruited when young children (5- to 8-years-old), adolescents (15- to 16-years-old), and adults (18- to 35-years-old) made decisions under risk. A number of brain regions previously shown to be involved with decision-making under risk showed increasing activation with age, including areas associated with contextual memory. In addition, regions of the brain associated with value determination such as the vmPFC were more active in adults and adolescents than children. Thus, our data provide more support for the hypothesis that the development of mature risk aversion occurs through the gradual development of the neural network that supports decision-making under risk, rather than an imbalance between reward-related and executive control-related regions. Further, children with a relatively more risk-averse profile and thus a more adult-like pattern of responding also showed an increased vmPFC response, suggesting that maturing risky decision-making strategies may reflect relative maturation of decision value systems.
Conflict of Interest Statement
The authors declare that the research was conducted in the absence of any commercial or financial relationships that could be construed as a potential conflict of interest.
Acknowledgments
This research was funded by an Incubator Award from the Duke Institute for Brain Sciences (Scott A. Huettel and Michael L. Platt), NIMH RC1-088680 (Scott A. Huettel and Elizabeth M. Brannon), pre-doctoral NRSA F31-027266 from NIDA to David J. Paulsen. We would also like to thank Anna Beth Keith, Carrie Sweet, and Anita Jurkowski for their assistance in collecting data.
References
Adcock, R., Thangavel, A., Whitfield-Gabrieli, S., Knutson, B., and Gabrieli, J. (2006). Reward-motivated learning: mesolimbic activation precedes memory formation. Neuron 50, 507–517.
Amso, D., Davidson, M., Johnson, S., Glover, G., and Casey, B. (2005). Contributions of the hippocampus and the striatum to simple association and frequency-based learning. Neuroimage 27, 291–298.
Arnett, J. (1992). Reckless behavior in adolescence: a developmental perspective. Dev. Rev. 12, 339–373.
Barth, H., Beckmann, L., and Spelke, E. (2008). Nonsymbolic, approximate arithmetic in children: abstract addition prior to instruction. Dev. Psychol. 44, 1466–1477.
Bechara, A., Damasio, A., Damasio, H., and Anderson, S. (1994). Insensitivity to future consequences following damage to human prefrontal cortex. Cognition 50, 7–15.
Bjork, J., Knutson, B., Fong, G., Caggiano, D., Bennett, S., and Hommer, D. (2004). Incentive-elicited brain activation in adolescents: similarities and differences from young adults. J. Neurosci. 24, 1793–1802.
Bjork, J. M., Smith, A. R., Chen, G., and Hommer, D. W. (2010). Adolescents, adults and rewards: comparing motivational neurocircuitry recruitment using fMRI. PLoS ONE 5, e11440. doi:10.1371/journal.pone.0011440
Boorman, E., Behrens, T., Woolrich, M., and Rushworth, M. (2009). How green is the grass on the other side? Frontopolar cortex and the evidence in favor of alternative courses of action. Neuron 62, 733–743.
Brainerd, C. (1981). Working memory and the developmental analysis of probability judgment. Psychol. Rev. 88, 463–502.
Büchel, C., Morris, J., Dolan, R., and Friston, K. (1998). Brain systems mediating aversive conditioning: an event-related fMRI study. Neuron 20, 947–957.
Burgund, E., Kang, H., Kelly, J., Buckner, R., Snyder, A., Petersen, S., and Schlaggar, B. L. (2002). The feasibility of a common stereotactic space for children and adults in fMRI studies of development. Neuroimage 17, 184–200.
Burnett, S., Bault, N., Coricelli, G., and Blakemore, S. -J. (2010). Adolescents’ heightened risk-seeking in a probabilistic gambling task. Cogn. Dev. 1–14.
Cantlon, J., Brannon, E., Carter, E., and Pelphrey, K. (2006). Functional imaging of numerical processing in adults and 4-y-old children. PLoS Biol. 4, e125. doi:10.1371/journal.pbio.0040125
Cardinal, R., Parkinson, J., Hall, J., and Everitt, B. (2002). Emotion and motivation: the role of the amygdala, ventral striatum, and prefrontal cortex. Neurosci. Biobehav. Rev. 26, 321–352.
Casey, B. J., Jones, R. M., and Hare, T. A. (2008b). The adolescent brain. Ann. N. Y. Acad. Sci. 1124, 111–126.
Chein, J., Albert, D., O’brien, L., Uckert, K., and Steinberg, L. (2010). Peers increase adolescent risk taking by enhancing activity in the brain’s reward circuitry. Dev. Sci. 14, F1–F10.
Clark, L., Bechara, A., Damasio, H., Aitken, M., Sahakian, B., and Robbins, T. (2008). Differential effects of insular and ventromedial prefrontal cortex lesions on risky decision-making. Brain 131, 1311.
Ernst, M., Bolla, K., Mouratidis, M., Contoreggi, C., Matochik, J., Kurian, V., Cadet, J. L., Kimes, A. S., and London, E. D. (2002). Decision-making in a risk-taking task: a PET study. Neuropsychopharmacology 26, 682–691.
Ernst, M., Nelson, E., Jazbec, S., McClure, E., Monk, C., Leibenluft, E., Blair, J., and Pine, D. S. (2005). Amygdala and nucleus accumbens in responses to receipt and omission of gains in adults and adolescents. Neuroimage 25, 1279–1291.
Eshel, N., Nelson, E., Blair, R., Pine, D., and Ernst, M. (2007). Neural substrates of choice selection in adults and adolescents: development of the ventrolateral prefrontal and anterior cingulate cortices. Neuropsychologia 45, 1270–1279.
Figner, B., Mackinlay, R., Wilkening, F., and Weber, E. (2009). Affective and deliberative processes in risky choice: age differences in risk taking in the Columbia Card Task. J. Exp. Psychol. Learn. Mem. Cogn. 35, 709–730.
Galvan, A. (2010). Adolescent development of the reward system. Front. Hum. Neurosci. 4:6. doi:10.3389/neuro.09.006.2010
Galvan, A., Hare, T., Parra, C., Penn, J., Voss, H., Glover, G., and Casey, B. J. (2006). Earlier development of the accumbens relative to orbitofrontal cortex might underlie risk-taking behavior in adolescents. J. Neurosci. 26, 6885.
Garon, N., and Moore, C. (2004). Complex decision-making in early childhood. Brain Cogn. 55, 158–170.
Garon, N., and Moore, C. (2007). Awareness and symbol use improves future-oriented decision making in preschoolers. Dev. Neuropsychol. 31, 39–59.
Giedd, J., Blumenthal, J., Jeffries, N., Castellanos, F., Liu, H., Zijdenbos, A., Paus, T., Evans, A. C., and Rapoport, J. L. (1999). Brain development during childhood and adolescence: a longitudinal MRI study. Nat. Neurosci. 2, 861–862.
Guitart-Masip, M., Talmi, D., and Dolan, R. (2010). Conditioned associations and economic decision biases. Neuroimage 53, 206–214.
Hampton, A., Adolphs, R., Tyszka, J., and O’Doherty, J. (2007). Contributions of the amygdala to reward expectancy and choice signals in human prefrontal cortex. Neuron 55, 545–555.
Harbaugh, W., Krause, K., and Vesterlund, L. (2002). Risk attitudes of children and adults: choices over small and large probability gains and losses. Exp. Econ. 5, 53–84.
Hare, T. A., Camerer, C. F., Knoepfle, D. T., and Rangel, A. (2010). Value computations in ventral medial prefrontal cortex during charitable decision making incorporate input from regions involved in social cognition. J. Neurosci. 30, 583.
Hsu, M., Bhatt, M., Adolphs, R., Tranel, D., and Camerer, C. (2005). Neural systems responding to degrees of uncertainty in human decision-making. Science 310, 1680–1683.
Huettel, S., Stowe, C., Gordon, E., Warner, B., and Platt, M. (2006). Neural signatures of economic preferences for risk and ambiguity. Neuron 49, 765–775.
Jenkinson, M., Bannister, P., Brady, M., and Smith, S. (2002). Improved optimization for the robust and accurate linear registration and motion correction of brain images. Neuroimage 17, 825–841.
Kable, J., and Glimcher, P. (2007). The neural correlates of subjective value during intertemporal choice. Nat. Neurosci. 10, 1625–1633.
Kang, H., Burgund, E., Lugar, H., Petersen, S., and Schlaggar, B. (2003). Comparison of functional activation foci in children and adults using a common stereotactic space. Neuroimage 19, 16–28.
Kerr, A., and Zelazo, P. (2004). Development of “hot” executive function: the children’s gambling task. Brain Cogn. 55, 148–157.
Krawczyk, D. (2002). Contributions of the prefrontal cortex to the neural basis of human decision making. Neurosci. Biobehav. Rev. 26, 631–664.
Kumaran, D., Summerfield, J. J., Hassabis, D., and Maguire, E. A. (2009). Tracking the emergence of conceptual knowledge during human decision making. Neuron 63, 889–901.
Law, C. S., and Glover, G. H. (2009). Interleaved spiral-in/out with application to functional MRI (fMRI). Magn. Reson. Med. 62, 829–834.
Levin, I., and Hart, S. (2003). Risk preferences in young children: early evidence of individual differences in reaction to potential gains and losses. J. Behav. Decis. Mak. 16, 397–413.
Levin, I., Hart, S., Weller, J., and Harshman, L. (2007a). Stability of choices in a risky decision-making task: a 3-year longitudinal study with children and adults. J. Behav. Decis. Mak. 20, 241–252.
Levin, I., Weller, J., Pederson, A., and Harshman, L. (2007b). Age-related differences in adaptive decision making: sensitivity to expected value in risky choice. Judgm. Decis. Mak. 2, 225–233.
Lisman, J., and Grace, A. (2005). The hippocampal-VTA loop: controlling the entry of information into long-term memory. Neuron 46, 703–713.
Maratos, E., Dolan, R., Morris, J., Henson, R., and Rugg, M. (2001). Neural activity associated with episodic memory for emotional context. Neuropsychologia 39, 910–920.
Mohr, P., Biele, G., and Heekeren, H. (2010). Neural processing of risk. J. Neurosci. 30, 6613–6619.
Østby, Y., Tamnes, C. K., Fjell, A. M., Westlye, L. T., Due-Tønnessen, P., and Walhovd, K. B. (2009). Heterogeneity in subcortical brain development: a structural magnetic resonance imaging study of brain maturation from 8 to 30 years. J. Neurosci. 29, 11772–11782.
Paulsen, D. J., Platt, M. L., Huettel, S. A., and Brannon, E. M. (2011). Decision-making under risk in children, adolescents, and young adults. Front. Psychol. 2:72. doi:10.3389/fpsyg.2011.00072
Paulus, M., Rogalsky, C., Simmons, A., Feinstein, J., and Stein, M. (2003). Increased activation in the right insula during risk-taking decision making is related to harm avoidance and neuroticism. Neuroimage 19, 1439–1448.
Piazza, M., Izard, V., Pinel, P., Le Bihan, D., and Dehaene, S. (2004). Tuning curves for approximate numerosity in the human intraparietal sulcus. Neuron 44, 547–555.
Platt, M., and Glimcher, P. (1999). Neural correlates of decision variables in parietal cortex. Nature 400, 223–238.
Platt, M., and Huettel, S. A. (2008). Risky business: the neuroeconomics of decision making under uncertainty. Nat. Neurosci. 11, 398–403.
Poldrack, R. A. (2006). Can cognitive processes be inferred from neuroimaging data? Trends Cogn. Sci. (Regul. Ed.) 10, 59–63.
Preuschoff, K., Quartz, S., and Bossaerts, P. (2008). Human insula activation reflects risk prediction errors as well as risk. J. Neurosci. 28, 2745–2752.
Rakow, T., and Rahim, S. B. (2010). Developmental insights into experience-based decision making. J. Behav. Decis. Mak. 23, 69–82.
Rangel, A., Camerer, C., and Montague, P. R. (2008). A framework for studying the neurobiology of value-based decision making. Nat. Rev. Neurosci. 9, 545–556.
Rushworth, M. F. S., and Behrens, T. E. J. (2008). Choice, uncertainty and value in prefrontal and cingulate cortex. Nat. Neurosci. 11, 389–397.
Scheres, A., Dijkstra, M., Ainslie, E., Balkan, J., Reynolds, B., Sonuga-Barke, E., and Castellanos, F. X. (2006). Temporal and probabilistic discounting of rewards in children and adolescents: effects of age and ADHD symptoms. Neuropsychologia 44, 2092–2103.
Shohamy, D., and Adcock, R. (2010). Dopamine and adaptive memory. Trends Cogn. Sci. (Regul. Ed.) 14, 464–472.
Shohamy, D., Myers, C., Hopkins, R., Sage, J., and Gluck, M. (2009). Distinct hippocampal and basal ganglia contributions to probabilistic learning and reversal. J. Cogn. Neurosci. 21, 1820–1832.
Smith, D. V., Hayden, B. Y., Truong, T.-K., Song, A. W., Platt, M. L., and Huettel, S. A. (2010). Distinct value signals in anterior and posterior ventromedial prefrontal cortex. J. Neurosci. 30, 2490–2495.
Talmi, D., Hurlemann, R., Patin, A., and Dolan, R. (2010). Framing effect following bilateral amygdala lesion. Neuropsychologia 48, 1823–1827.
Thomason, M. E., Burrows, B. E., Gabrieli, J. D. E., and Glover, G. H. (2005). Breath holding reveals differences in fMRI BOLD signal in children and adults. Neuroimage 25, 824–837.
Tversky, A., and Kahneman, D. (1991). Loss aversion in riskless choice: a reference-dependent model. Q. J. Econ. 106, 1039.
Van Duijvenvoorde, A. C. K., Zanolie, K., Rombouts, S. A. R. B., Raijmakers, M. E. J., and Crone, E. A. (2008). Evaluating the negative or valuing the positive? Neural mechanisms supporting feedback-based learning across development. J. Neurosci. 28, 9495–9503.
van Leijenhorst, L., Crone, E., and Bunge, S. (2006). Neural correlates of developmental differences in risk estimation and feedback processing. Neuropsychologia 44, 2158–2170.
van Leijenhorst, L., Moor, B., Op de Macks, Z., Rombouts, S., Westenberg, P., and Crone, E. (2010a). Adolescent risky decision-making: neurocognitive development of reward and control regions. Neuroimage 51, 345–355.
van Leijenhorst, L., Zanolie, K., Van Meel, C., Westenberg, P., Rombouts, S., and Crone, E. (2010b). What motivates the adolescent? Brain regions mediating reward sensitivity across adolescence. Cereb. Cortex 20, 61.
van Leijenhorst, L., Westenberg, P. M., and Crone, E. A. (2008). A Developmental study of risky decisions on the cake gambling task: age and gender analyses of probability estimation and reward evaluation. Dev. Neuropsychol. 33, 179–196.
Wallis, J. D. (2007). Orbitofrontal cortex and its contribution to decision-making. Annu. Rev. Neurosci. 30, 31–56.
Weber, B. J., and Chapman, G. B. (2005). Playing for peanuts: why is risk seeking more common for low-stakes gambles? Organ. Behav. Hum. Decis. Process. 97, 31–46.
Weber, E., Shafir, S., and Blais, A. (2004). Predicting risk sensitivity in humans and lower animals: risk as variance or coefficient of variation. Psychol. Rev. 111, 430–445.
Weller, J., Levin, I., and Denburg, N. (2010). Trajectory of risky decision making for potential gains and losses from ages 5 to 85. J. Behav. Decis. Mak. 24, 331–344.
Weller, J. A., Levin, I. P., Shiv, B., and Bechara, A. (2007). Neural correlates of adaptive decision making for risky gains and losses. Psychol. Sci. 18, 958–964.
Appendix
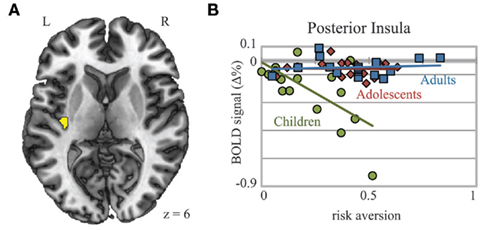
Figure A1. Posterior insula shows age group by risk aversion interaction. (A) An interaction between age group and risk aversion in posterior insula showed that (B) while activation during decision-making in adolescents and adults did not correlate in any way with risk aversion, activation in children decreased with greater risk aversion, in children, activation in posterior insula decreased with greater risk aversion. Coordinates in MNI space.
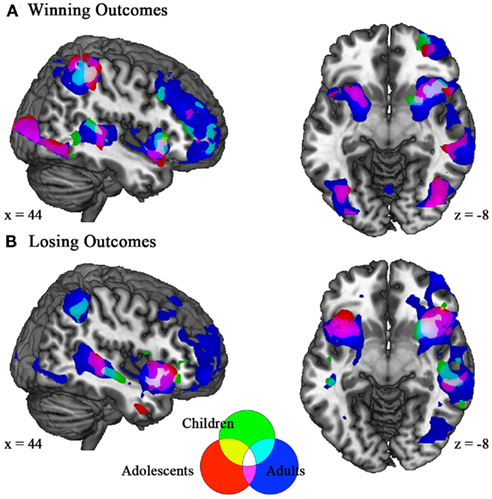
Figure A2. Winning and losing outcomes elicit similar patterns of activation in children, adolescents, and adults. (A) Activations to winning outcomes in all age groups were found in superior temporal gyrus, insula, striatum, inferior frontal gyrus, and inferior parietal regions. Adults and adolescents showed additional activation in dlPFC, lateral OFC, and ACC. (B) Relative losses elicited activation for all age groups in superior temporal gyrus and insula, while adults and adolescents also showed activation in anterior cingulate. Coordinates in MNI space; z > 3.0.
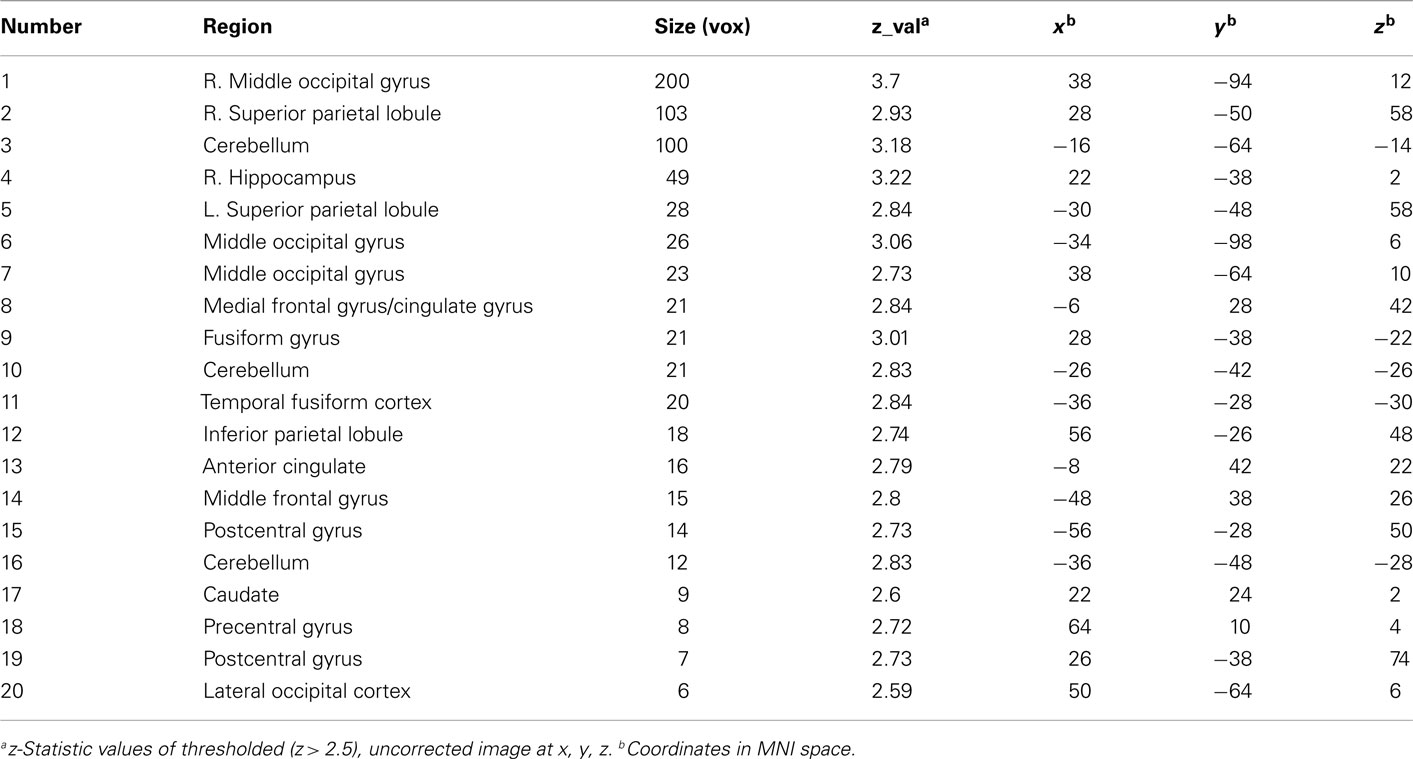
Table A1. Uncorrected regions of activation from the quadratic contrast showing adolescent peaks.
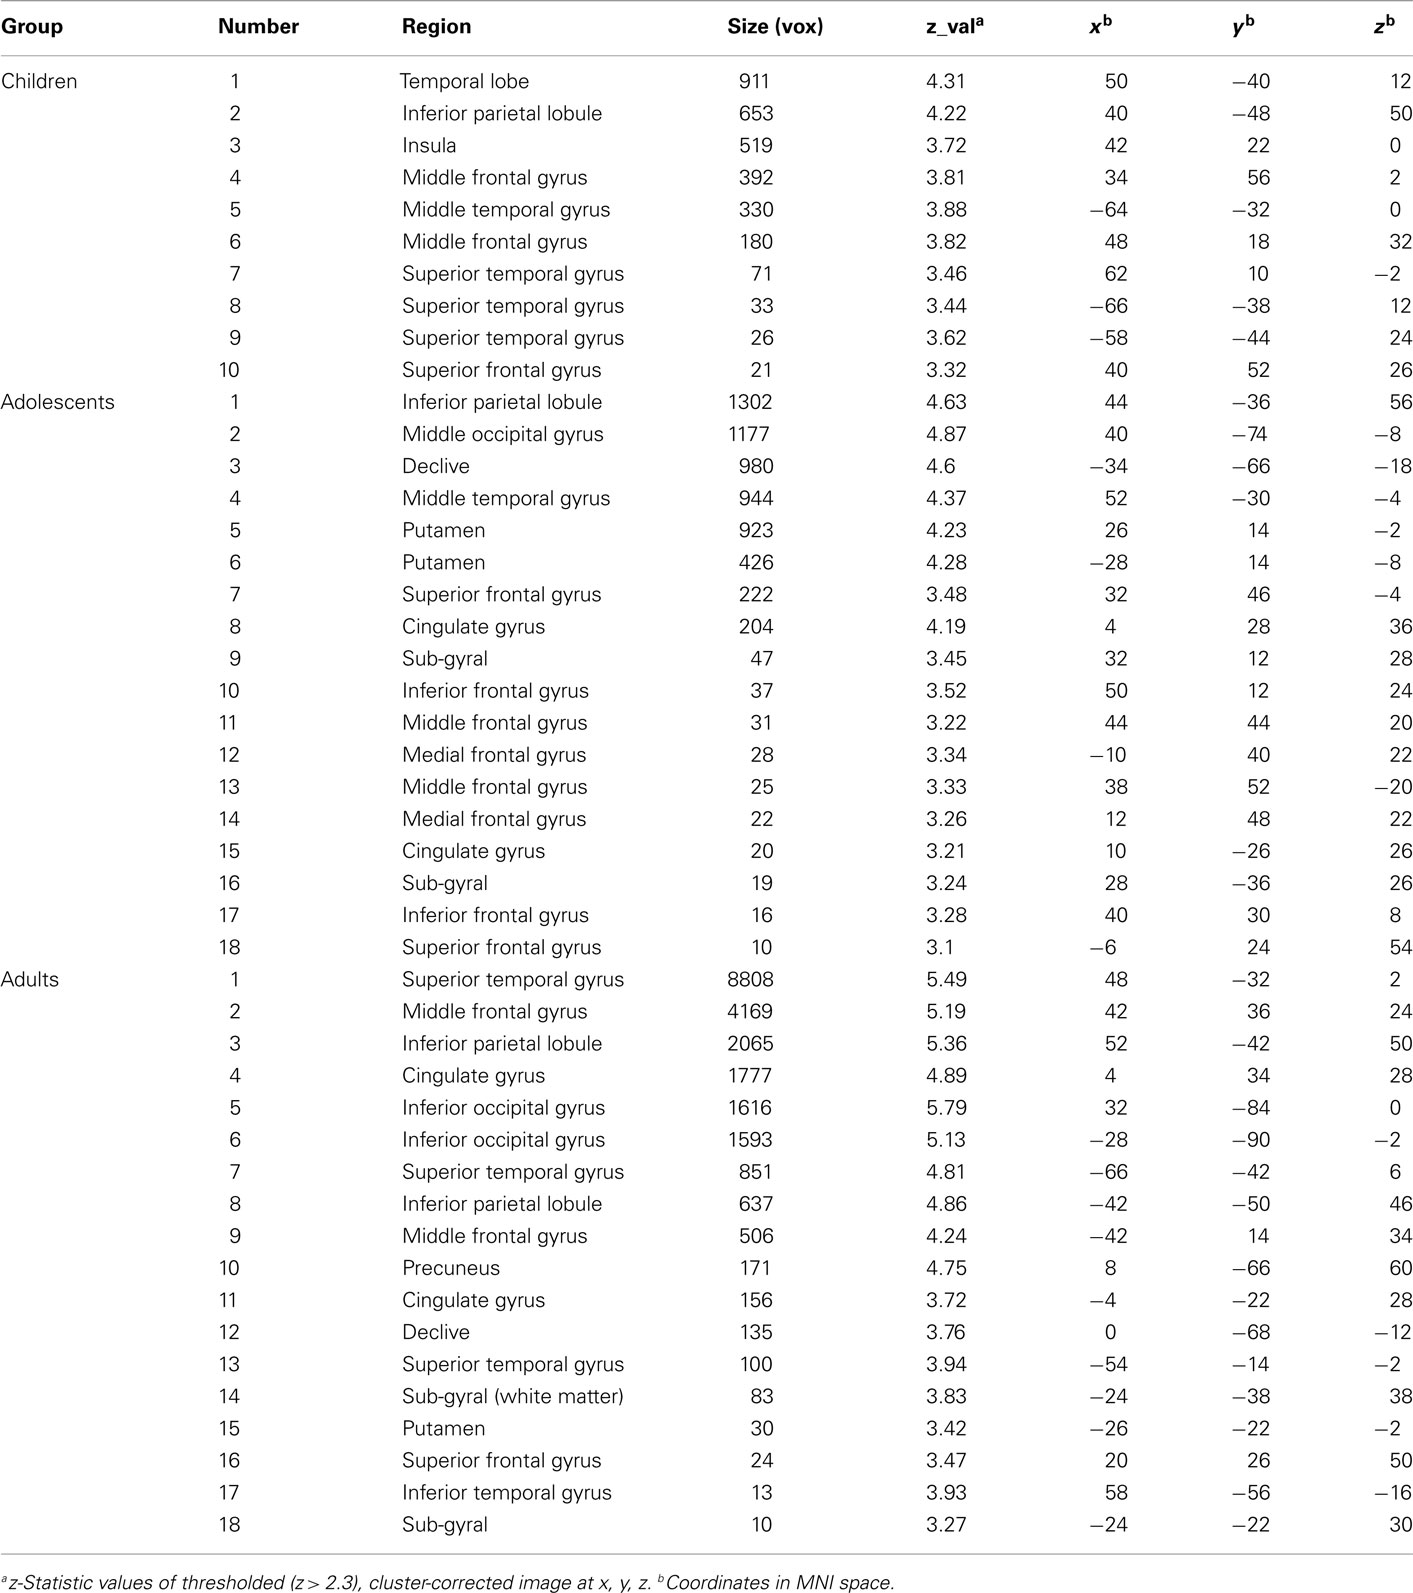
Table A2. Activation to winning outcomes by age group.
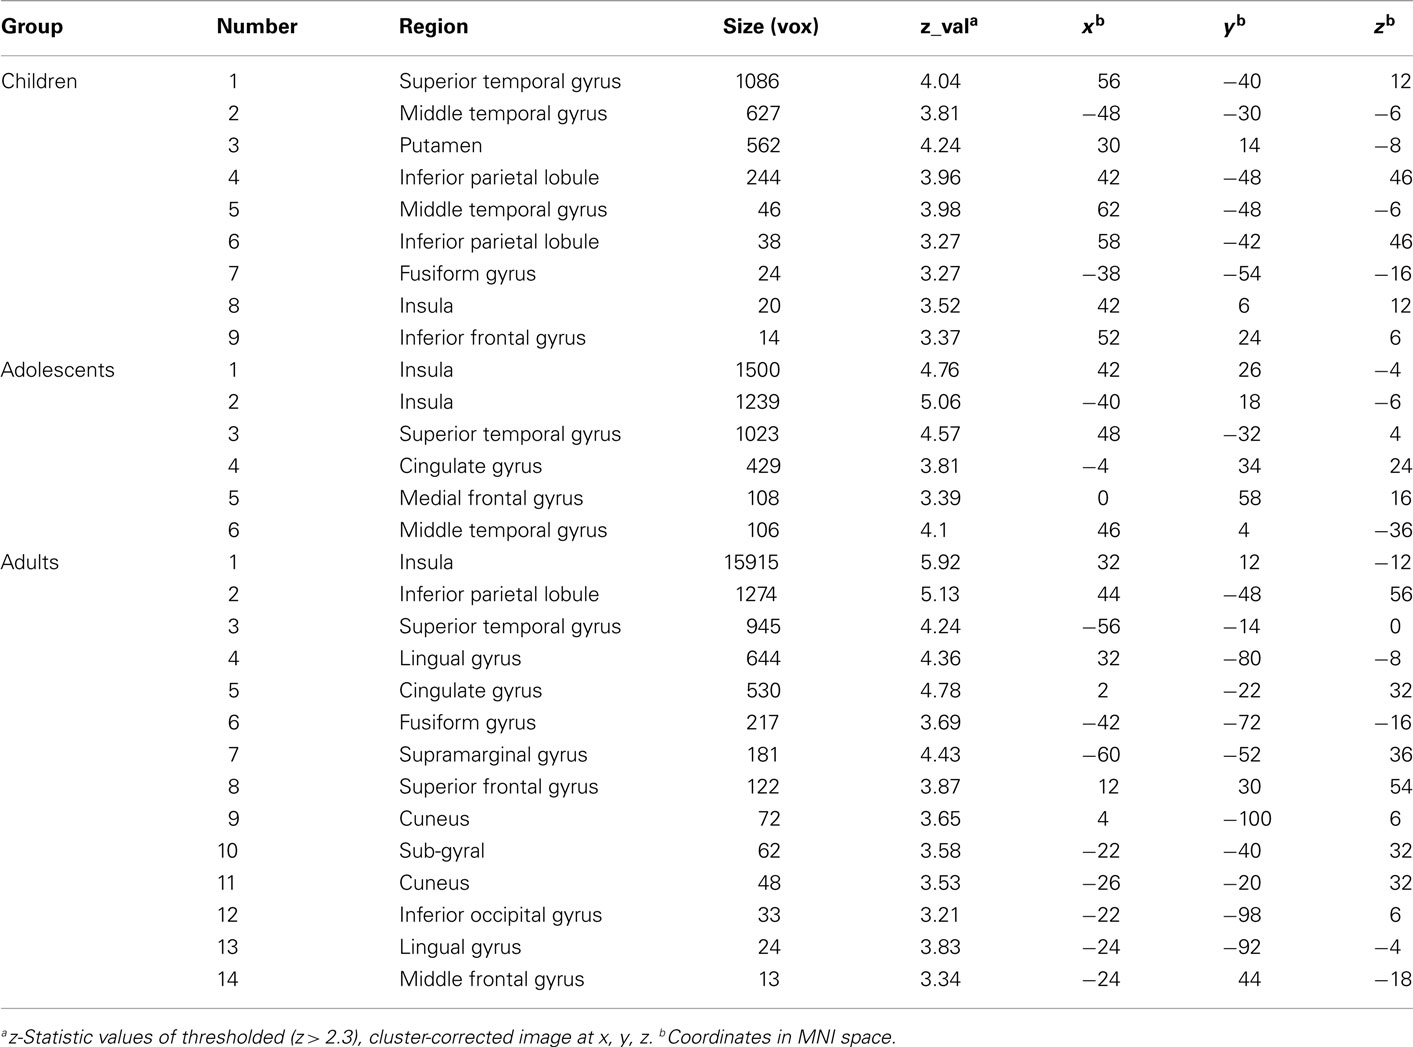
Table A3. Activation to losing outcomes by age group.
Keywords: fMRI, risk, decision-making, children, adolescence, reward, development, gambling
Citation: Paulsen DJ, Carter RM, Platt ML, Huettel SA and Brannon EM (2012) Neurocognitive development of risk aversion from early childhood to adulthood. Front. Hum. Neurosci. 5:178. doi: 10.3389/fnhum.2011.00178
Received: 19 July 2011;
Accepted: 15 December 2011;
Published online: 03 January 2012.
Edited by:
Hauke R. Heekeren, Freie Universität Berlin, GermanyReviewed by:
Eveline A. Crone, Leiden University, NetherlandsStephan Hamann, Emory University, USA
Peter N. C. Mohr, Freie Unversität Berlin, Germany
Copyright: © 2012 Paulsen, Carter, Platt, Huettel and Brannon. This is an open-access article distributed under the terms of the Creative Commons Attribution Non Commercial License, which permits non-commercial use, distribution, and reproduction in other forums, provided the original authors and source are credited.
*Correspondence: David J. Paulsen, Duke University, LSRC Bldg Room B203, 90999; Durham, NC 27708, USA. e-mail: djp16@duke.edu